
Climate Change Projections of Dry and Wet Events in Iberia Based on the WASP-Index


1
Natural Hazards Research Center (NHRC.ipt), Instituto Politécnico de Tomar, Quinta do Contador, Estrada da Serra, 2300-313 Tomar, Portugal
2
Centre for the Research and Technology of Agro-Environmental and Biological Sciences (CITAB), University of Trás-os-Montes e Alto Douro, P.O. Box 1013, 5001-801 Vila Real, Portugal
*
Author to whom correspondence should be addressed.
Climate 2021, 9(6), 94; https://0-doi-org.brum.beds.ac.uk/10.3390/cli9060094
Submission received: 20 April 2021
/
Revised: 26 May 2021
/
Accepted: 8 June 2021
/
Published: 10 June 2021
(This article belongs to the Special Issue Extreme Weather Events)
Abstract
:The Weighted Anomaly of Standardized Precipitation Index (WASP-Index) was computed over Iberia for three monthly timescales (3-month, 6-month and 12-month) in 1961–2020, based on an observational gridded precipitation dataset (E-OBS), and between 2021 and 2070, based on bias-corrected precipitation generated by a six-member climate model ensemble from EURO-CORDEX, under two Representative Concentration Pathways (RCPs), RCP4.5 and RCP8.5. The area-mean values revealed an upward trend in the frequency of occurrence of intermediate-to-severe dry events over Iberia, which will be strengthened in the future, particularly for the 12-month WASP (12m-WASP) intermediate dry events under RCP8.5. Besides, the number of 3-month WASP (3m-WASP) intermediate-to-severe wet events is projected to increase (mostly the severest events under RCP4.5) but no evidence was found for an increase in the number of more persistent 12m-WASP wet events under both RCPs. Despite important spatial heterogeneities, an increase/decrease of the intensity, duration and frequency of occurrence of the 12m-WASP intermediate-to-severe dry/wet events was found under both scenarios, mainly in the southernmost regions of Iberia (mainly Comunidad Valenciana, Región de Murcia, Andalucía in Spain, Alentejo, and Algarve in Portugal), thus becoming more exposed to prolonged and severe droughts in the future. This finding corroborates the results of previous studies.
1. Introduction
It is commonly accepted that climate change has a direct link to the increasing frequency and intensity of extreme events [1]. Projected increases in temperature [2,3,4] and alterations in precipitation patterns will be accompanied by more frequent and intense droughts, as well as floods [5]. These extreme events can have a deep impact on the economy [6,7,8], agriculture [9,10] and the environment [11]. Therefore, a better understanding of their future projections in regions more vulnerable to climatic shifts is of utmost relevance.
Drought can be defined as a prolonged absence of precipitation leading to a deficit in natural water availability [12]. However, four different types of droughts can be defined in an increasing severity grade: meteorological, agricultural, hydrological and socioeconomic. Meteorological drought is caused by a precipitation deficit with respect to the climatological average of a region; agricultural drought occurs when the soil moisture is too scarce to sustain crop production, and hydrological drought is caused by weak stream flows leading to low water levels in rivers, lakes and reservoirs. Lastly, socioeconomic drought can be defined as the consequence of the above-mentioned drought types, resulting in a lack of water supply to produce or sustain an economic good or service [13,14]. Floods are one of the most recurrent natural hazards in the world [15] and can be defined, to a certain extent, as the opposite of droughts as an excess of precipitation relative to the climatological average in a given region, promoting a rise of water levels in rivers, lakes and reservoirs. However, the timescales and spatial extent of droughts and floods are usually different, the former being more prolonged in time and covering larger areas, while the latter typically develop in much shorter periods and are often constrained to flood-risk areas.
Changes in precipitation patterns have implications on water availability and, consequently, on its management [16]. Shifts in these patterns combined with an increase in drought and flood frequency may thus exacerbate hydroclimatic risks. These risks can have a wide range of impacts, depending on the region. In particular, the Mediterranean region, which is considered amongst the most exposed to climate change risks [17,18,19,20,21,22], is highly susceptible. In the Iberian Peninsula (IP), for example, these risks include an increase in the number and extension of wildfires, mostly in the summer, an increase in the intensity and duration of droughts [23,24], as well as an increasing number and intensity of winter storms (Xynthia in 2010; Dirk in 2014; Leslie in 2018; Elsa, Fabien and Gloria in 2020) that induce floods and flash floods [25]. Additionally, the precipitation regimes in Iberia are characterized by strong irregularity and interannual variability related to persistent large-scale eddies in the eastern North Atlantic [26,27] associated with jet stream wave-breaking episodes [28,29].
Several climatic indices can be used to assess flood and drought events and, consequently, wet and dry events, namely the Standardized Precipitation Index (SPI), Standardized Precipitation Evapotranspiration Index (SPEI), Standardized Precipitation Temperature Index (SPTI), Rainfall Variability Index (RVI), and Weighted Anomaly of Standardized Precipitation Index (WASP-Index). In this study, wet and dry events are assessed by using the WASP-Index. This index was first proposed by Lyon and Barnston [30] and is based on the previous formulation presented by Lyon [31]. Several studies using this index have proved it to be a useful tool to assess dry events. Andrade and Belo [32] used this index in the IP; Croitoru et al. [33] for Romania; Zubair et al. and Lokuhetti et al. [34,35] for Sri Lanka; Adnan et al. [36] for Pakistan; Carrão et al. [37] on a global scale; Procházka et al. [38] for the Middle East, and Below et al. [11] reviewed drought-related catastrophes worldwide. An assessment of the impact of hydroclimatic events on the economic growth of sub-Saharan Africa was made by Brown et al. [6], while Borgomeo et al. [39] analysed the impacts of rainfall shocks in Ethiopia. Brown et al. [7] used this index to make an empirical analysis on the effects of climate hazards on national-level economic growth, while Holterman [8] compared European countries with different economic developments. Ayanlade et al. [40] used this index to assess interannual precipitation variability and crop yield in Nigeria, while Zubair et al. [34] assessed drought hazard risk in Sri Lanka using the WASP-Index.
This study is an extension of the work of Andrade and Belo [32] in which the severity, frequency and spatial variability of droughts in IP were assessed for three different time scales (three, six and 12-months) using four observational precipitation-gridded data sets. Furthermore, the WASP-Index and SPI were also compared in the preceding study, and it was concluded that both indices are highly correlated for this region. Therefore, the main purpose of the present study is to use only the WASP-Index as an indicator for intermediate-to-severe wet and dry events. As previously, the WASP-Index is computed on three different time scales, i.e., 3-month, 6-month and 12-month WASP-Indexes, respectively (hereafter, 3m-WASP, 6m-WASP, and 12m-WASP) from 1961 to 2070. Though the WASP-Index is computed on a monthly timescale, four 30-year climatologies are also analysed: 1961–1990 (baseline climate), 1981–2010 for the recent past period using an observation-based dataset, and projections for the future periods 2021–2050 and 2041–2070, under two Representative Concentration Pathway (RCP) scenarios, RCP4.5 and RCP8.5. Towards this aim, an ensemble of six-member Regional Climate Models (RCMs) of bias-corrected monthly precipitation data was used to compute the monthly WASP-Index, and hence the respective magnitude (severity), duration, intensity and probability for the four above-referred 30-year periods. The spatial representation for the historical periods and projections for the duration, intensity and probability under RCP4.5 and RCP8.5 for the four 30-year climatologies are presented and analysed.
2. Data and Methodology
2.1. Data and Bias Correction
Observation-based gridded daily total precipitation (in mm) from E-OBS v23.0e was retrieved from the EU-FP6 project UERRA (https://www.ecad.eu/download/ensembles/ensembles.php accessed on 3 February 2021), for the period from January 1961 to December 2020, on a 0.1° regular grid [41]. This dataset was subject to a bilinear interpolation on a 0.11° regular grid, thus allowing an overlap period with the simulated data.
Projections for daily total precipitation were taken from the EURO-CORDEX initiative (https://www.euro-cordex.net accessed on 20 December 2020), which provides regional climate models for Europe at a 12.5 km (EUR-11) resolution, for the periods 1951–2005 (historical) and 2006–2070 (scenarios). The RCMs, along with the respective driving models and contributors, are presented in Table 1. The RCM runs under the RCPs [42,43] were attained from the Coupled Model Intercomparison Project 5 (CMIP5) global climate project [44]. In this study, two RCPs were analysed: RCP4.5, which implies a stabilization without crossing out the pathway to a 4.5 W m−2 stabilization after 2100 [45,46,47], and RCP8.5, which is associated with a rising radiative forcing pathway to 8.5 W m−2 in 2100 [48,49].
The bias correction method used in this study was the quantile-quantile method, which assumes that the distribution function of a variable may change in the future but allows a correction of the whole distribution with tails included. Details about this methodology are described in Amengual et al. [50] and Viceto et al. [2].
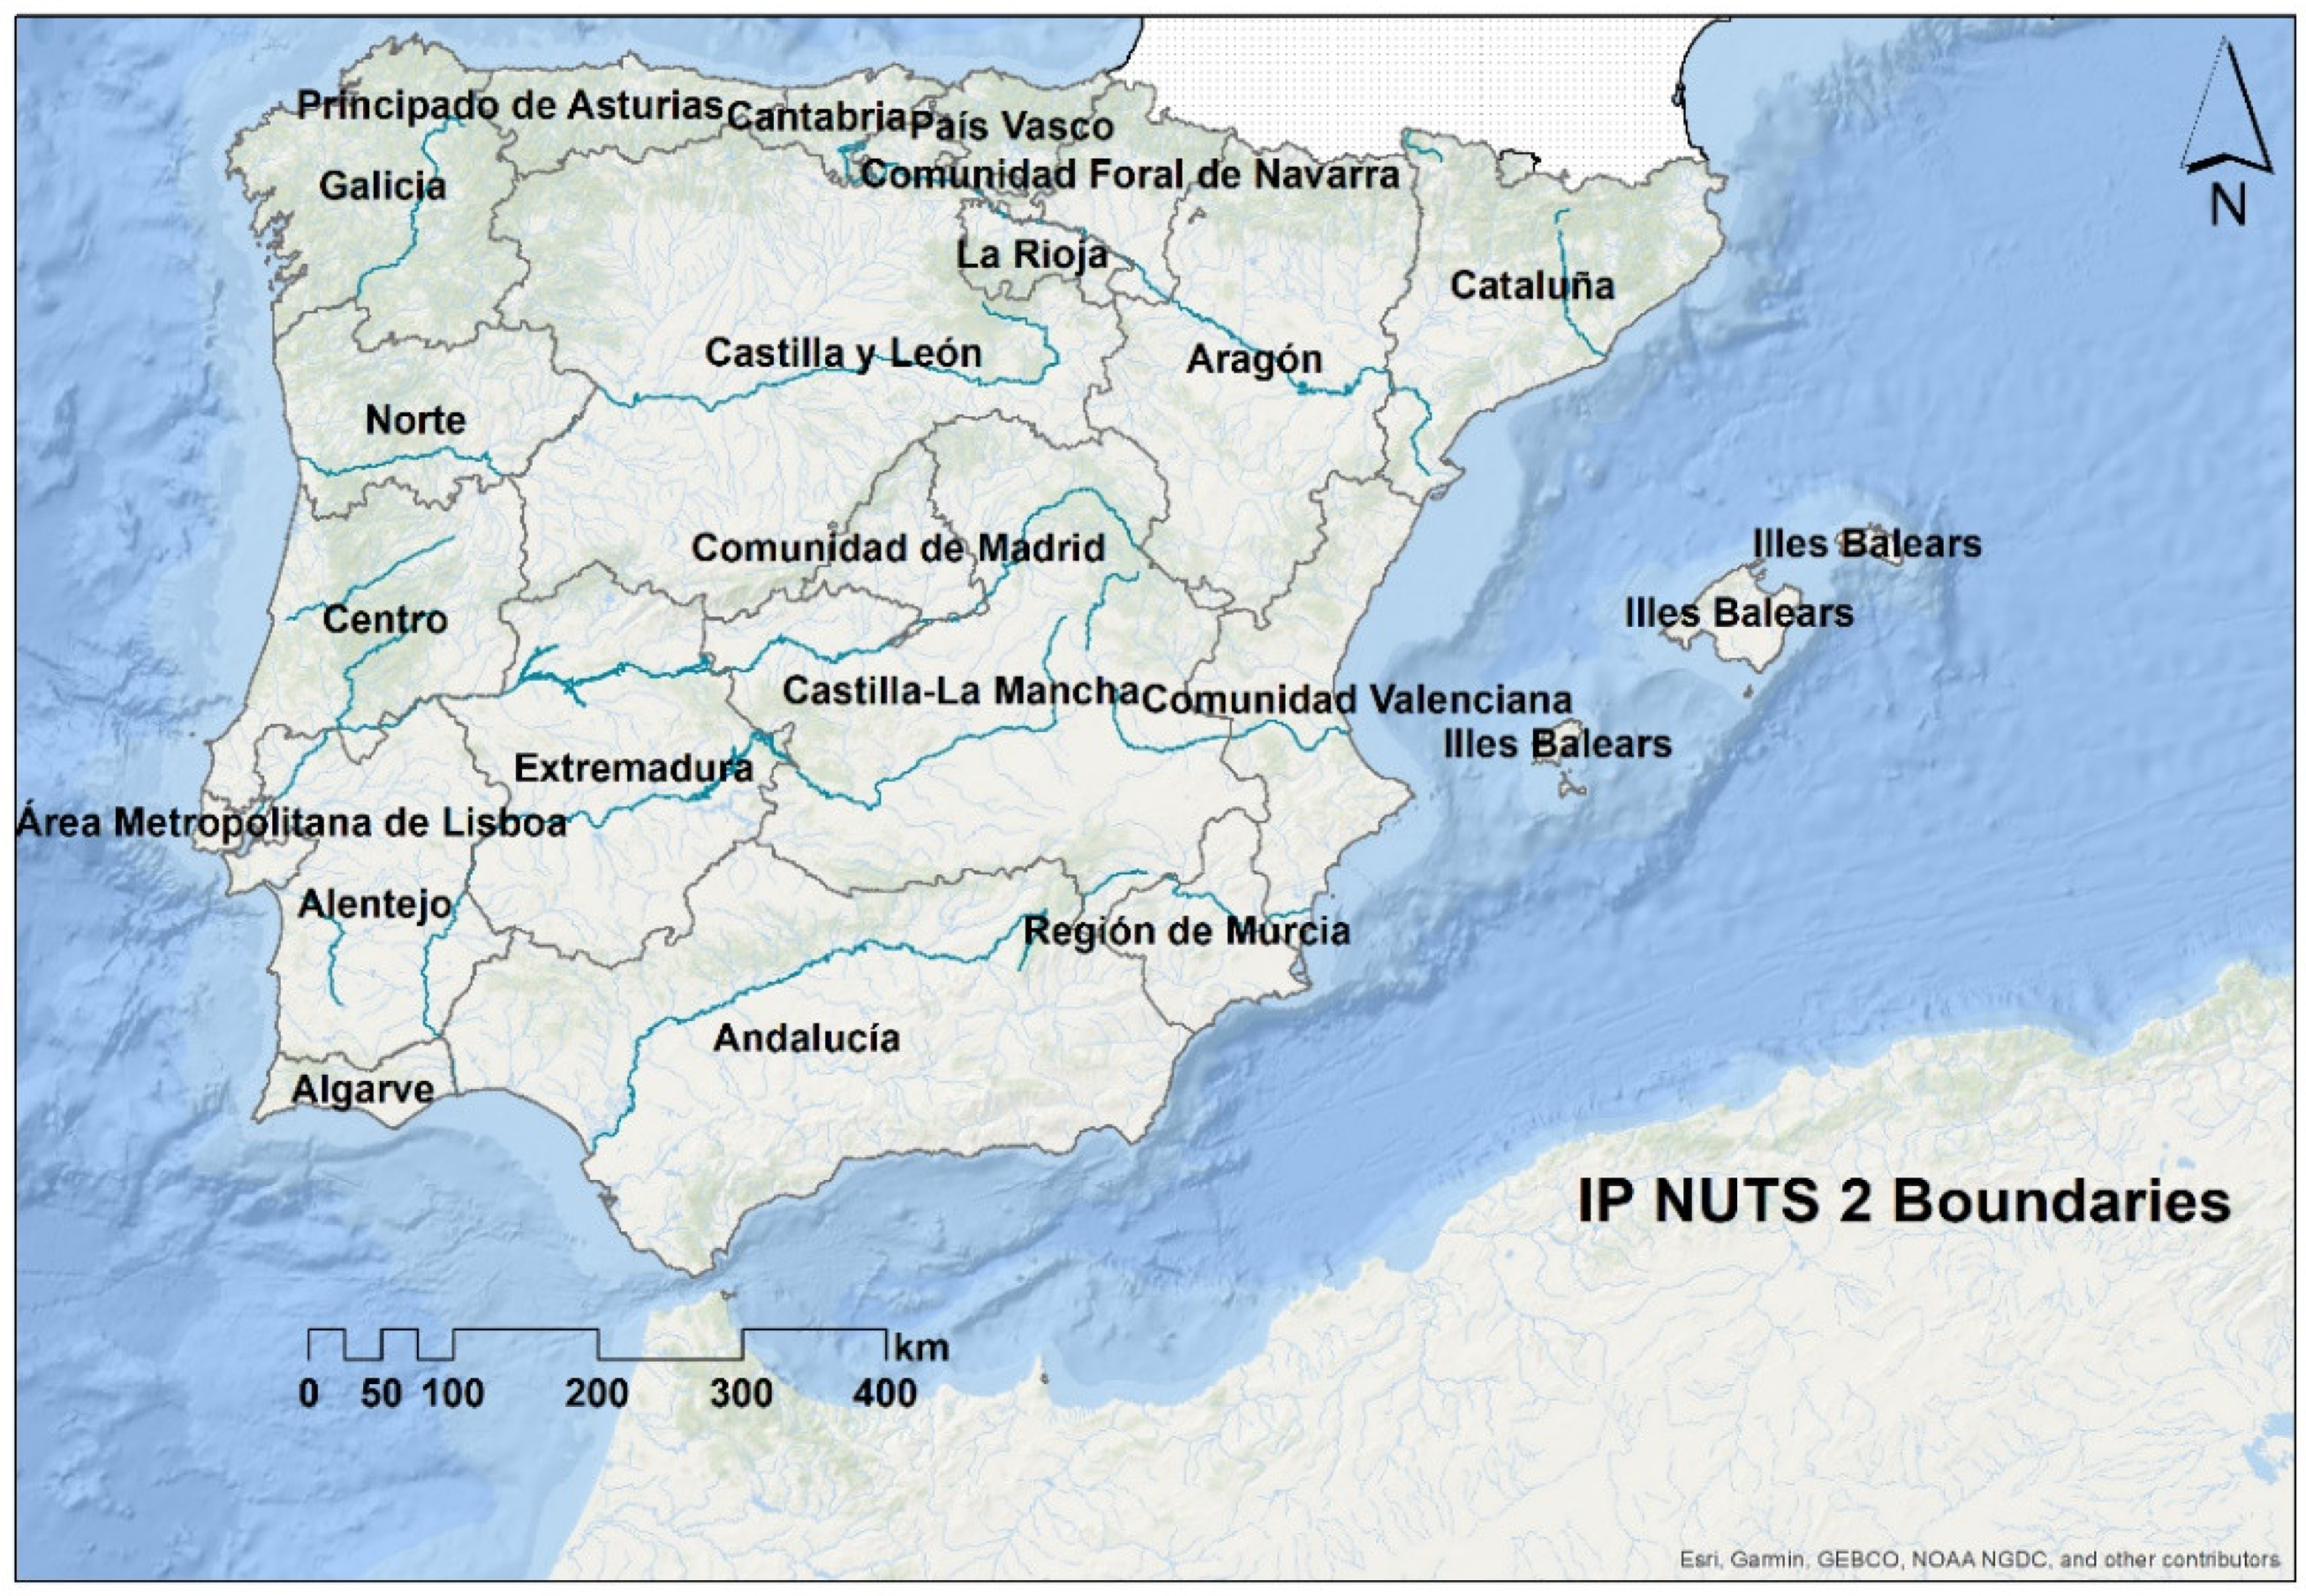
All subsequent calculations were carried out for the study area, which was a Euro-Atlantic sector comprising the IP (34.625° N–45.075° N, 15.125° W–4.785° E). It is worth mentioning that all calculations were undertaken for all grid points and were only clipped for the figures presented herein, thus excluding grid points in the Atlantic Ocean and the Mediterranean Sea (Figure 1). All maps have the GCS ETRS 1989 Geographical Coordinate System.
2.2. WASP-Index Calculation
The WASP-Index is obtained through the following equation:
where is the observed i-th month precipitation attained from daily ensemble-mean precipitation (PR), is the precipitation baseline climatology (1961–1990) for the corresponding month/year, is the standard deviation of monthly precipitation and is the mean annual precipitation. in (2) is obtained considering the preceding N months (time scale of the index). For example, WASP12 is calculated taking into consideration the preceding 11 months of the month that is being calculated. Furthermore, the WASP-Index allows a qualitative classification of dry and wet severity through its values, as described in Table 2.
For this study, the WASP-Index was computed for three timescales, i.e., 3m-WASP (which has 1318 instants, with the first summing the period from January 1961 to March 1961), 6m-WASP (totalizing 1315 instants, with the first being the sum of the period from January 1961 to June 1961), and 12m-WASP (1309 instants in total, the first encompassing January 1961 to December 1961), for the period between 1961 and 2070. These three indices (3m-WASP, 6m-WASP, and 12m-WASP) were attained from E-OBS (January 1961 and December 2020) for the past period (1961–2020), and from the bias-corrected ensemble, under RCP4.5 and RCP8.5, from 2021 until 2070. For the past period, the three-time scaled WASP indices were averaged over latitude and longitude to obtain a single time series (area-mean) that allows the identification of the dry and wet events over the target region.
2.3. Dry and Wet Events Methodological Analysis
The spatial and temporal evolution of wet and dry events was analysed for two mean historical periods, 1961−1990 and 1981−2010 (from the E-OBS dataset), and two future periods, 2021−2050 and 2041−2070 (from the six-member bias-corrected ensemble) under RCP4.5 and RCP8.5, for the 12m-WASP (Figure 2). Towards this goal, the spatial-temporal evolution of duration, intensity, severity and frequency for these four time periods was analysed for the IP, as well as for some illustrative main cities that are provided as Supplementary material.
The duration of an event is determined by the total number of consecutive months for which the index value falls between −2 and −1.5 (1.5 and 2) for intermediate dry (wet), below or equal −2 (above or equal 2) for severe dry (wet) but lasting at least two consecutive months to ensure that the extreme event has occurred [51]. In this study, only the results regarding the threshold −1.5 (1.5) for intermediate-to-severe dry (wet) events are presented (≤−1.5 and ≥1.5, respectively).
The severity or magnitude of an event is calculated by:
where j is the first month in which the 12m-WASP lies below/above a chosen value and is the month when the 12m-WASP becomes greater/lower than the threshold value [52]. As previously referred, only the results with a threshold smaller or equal to −1.5 (greater or equal to 1.5) for intermediate-to-severe dry (wet) events were analysed.
Intensity is defined as the average index value per month, which is high and has a severe impact when a large magnitude occurs over a short period.
Lastly, frequency is the probability of occurrence of a dry or wet event (in %), defined by the following equation:
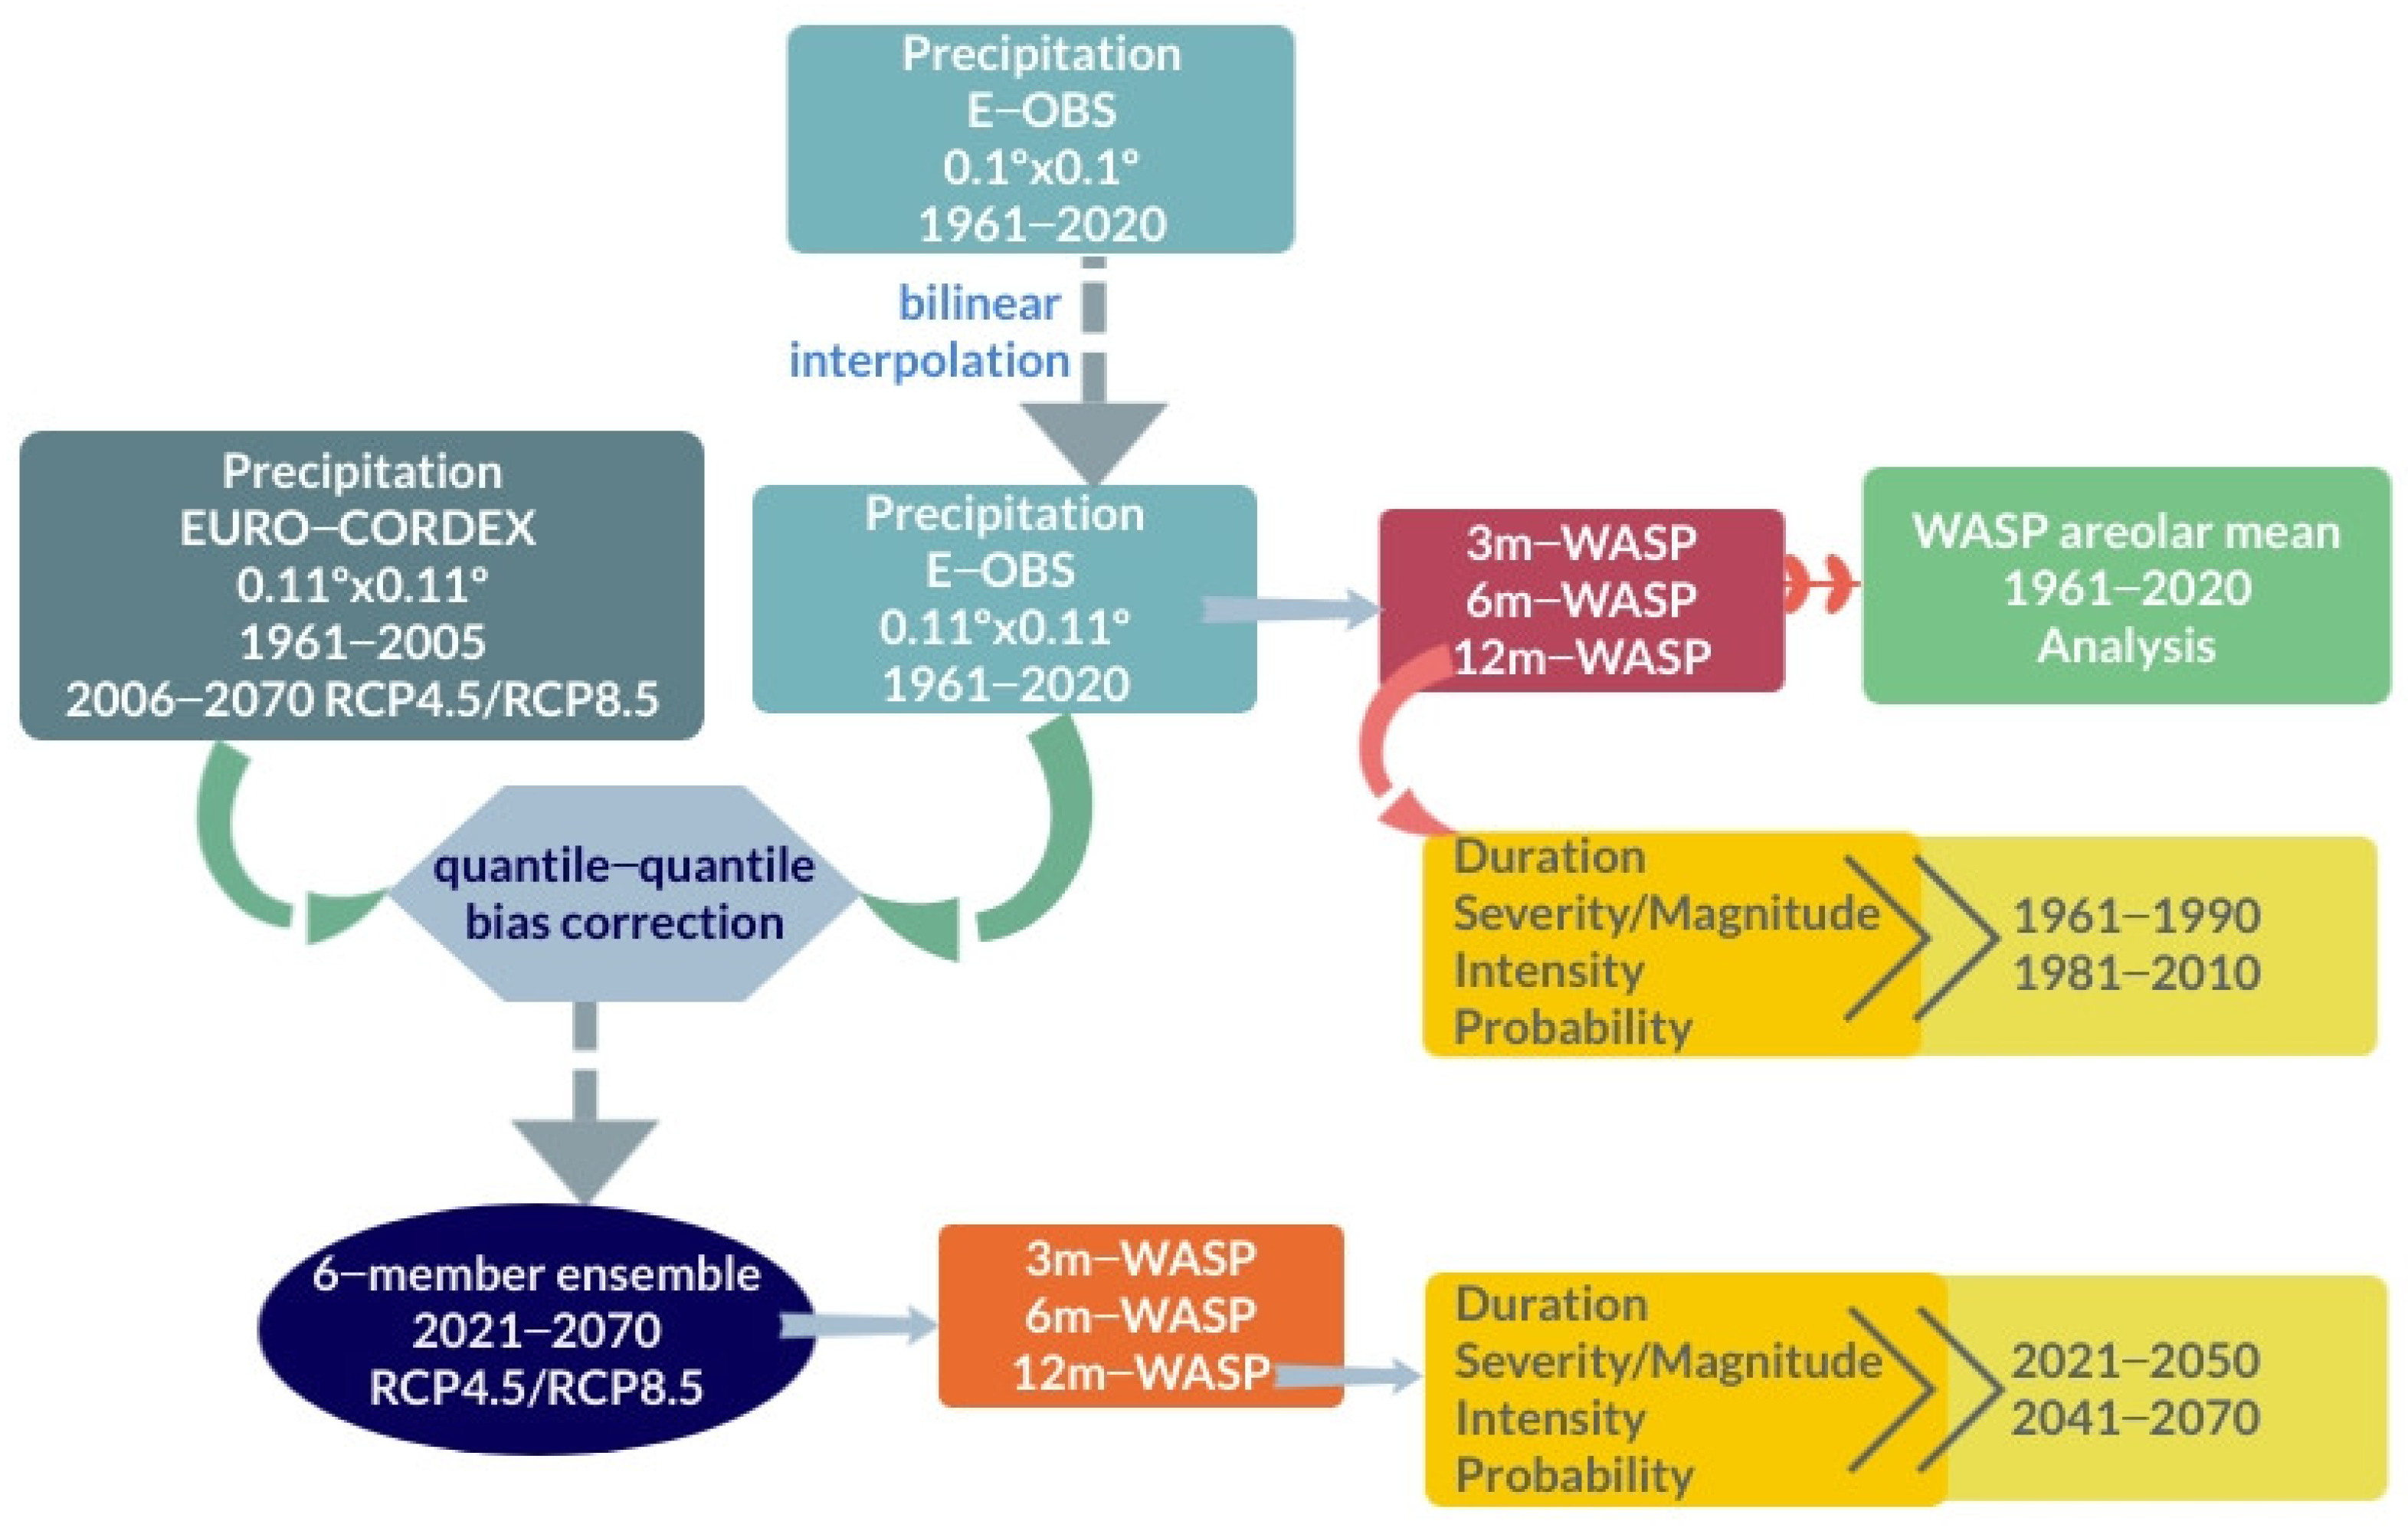
As stated before, only the spatial representations of the results concerning intermediate-to-severe dry (wet) events are presented and discussed (Section 3.1). The overall schematic methodology followed in this study is illustrated in Figure 2.
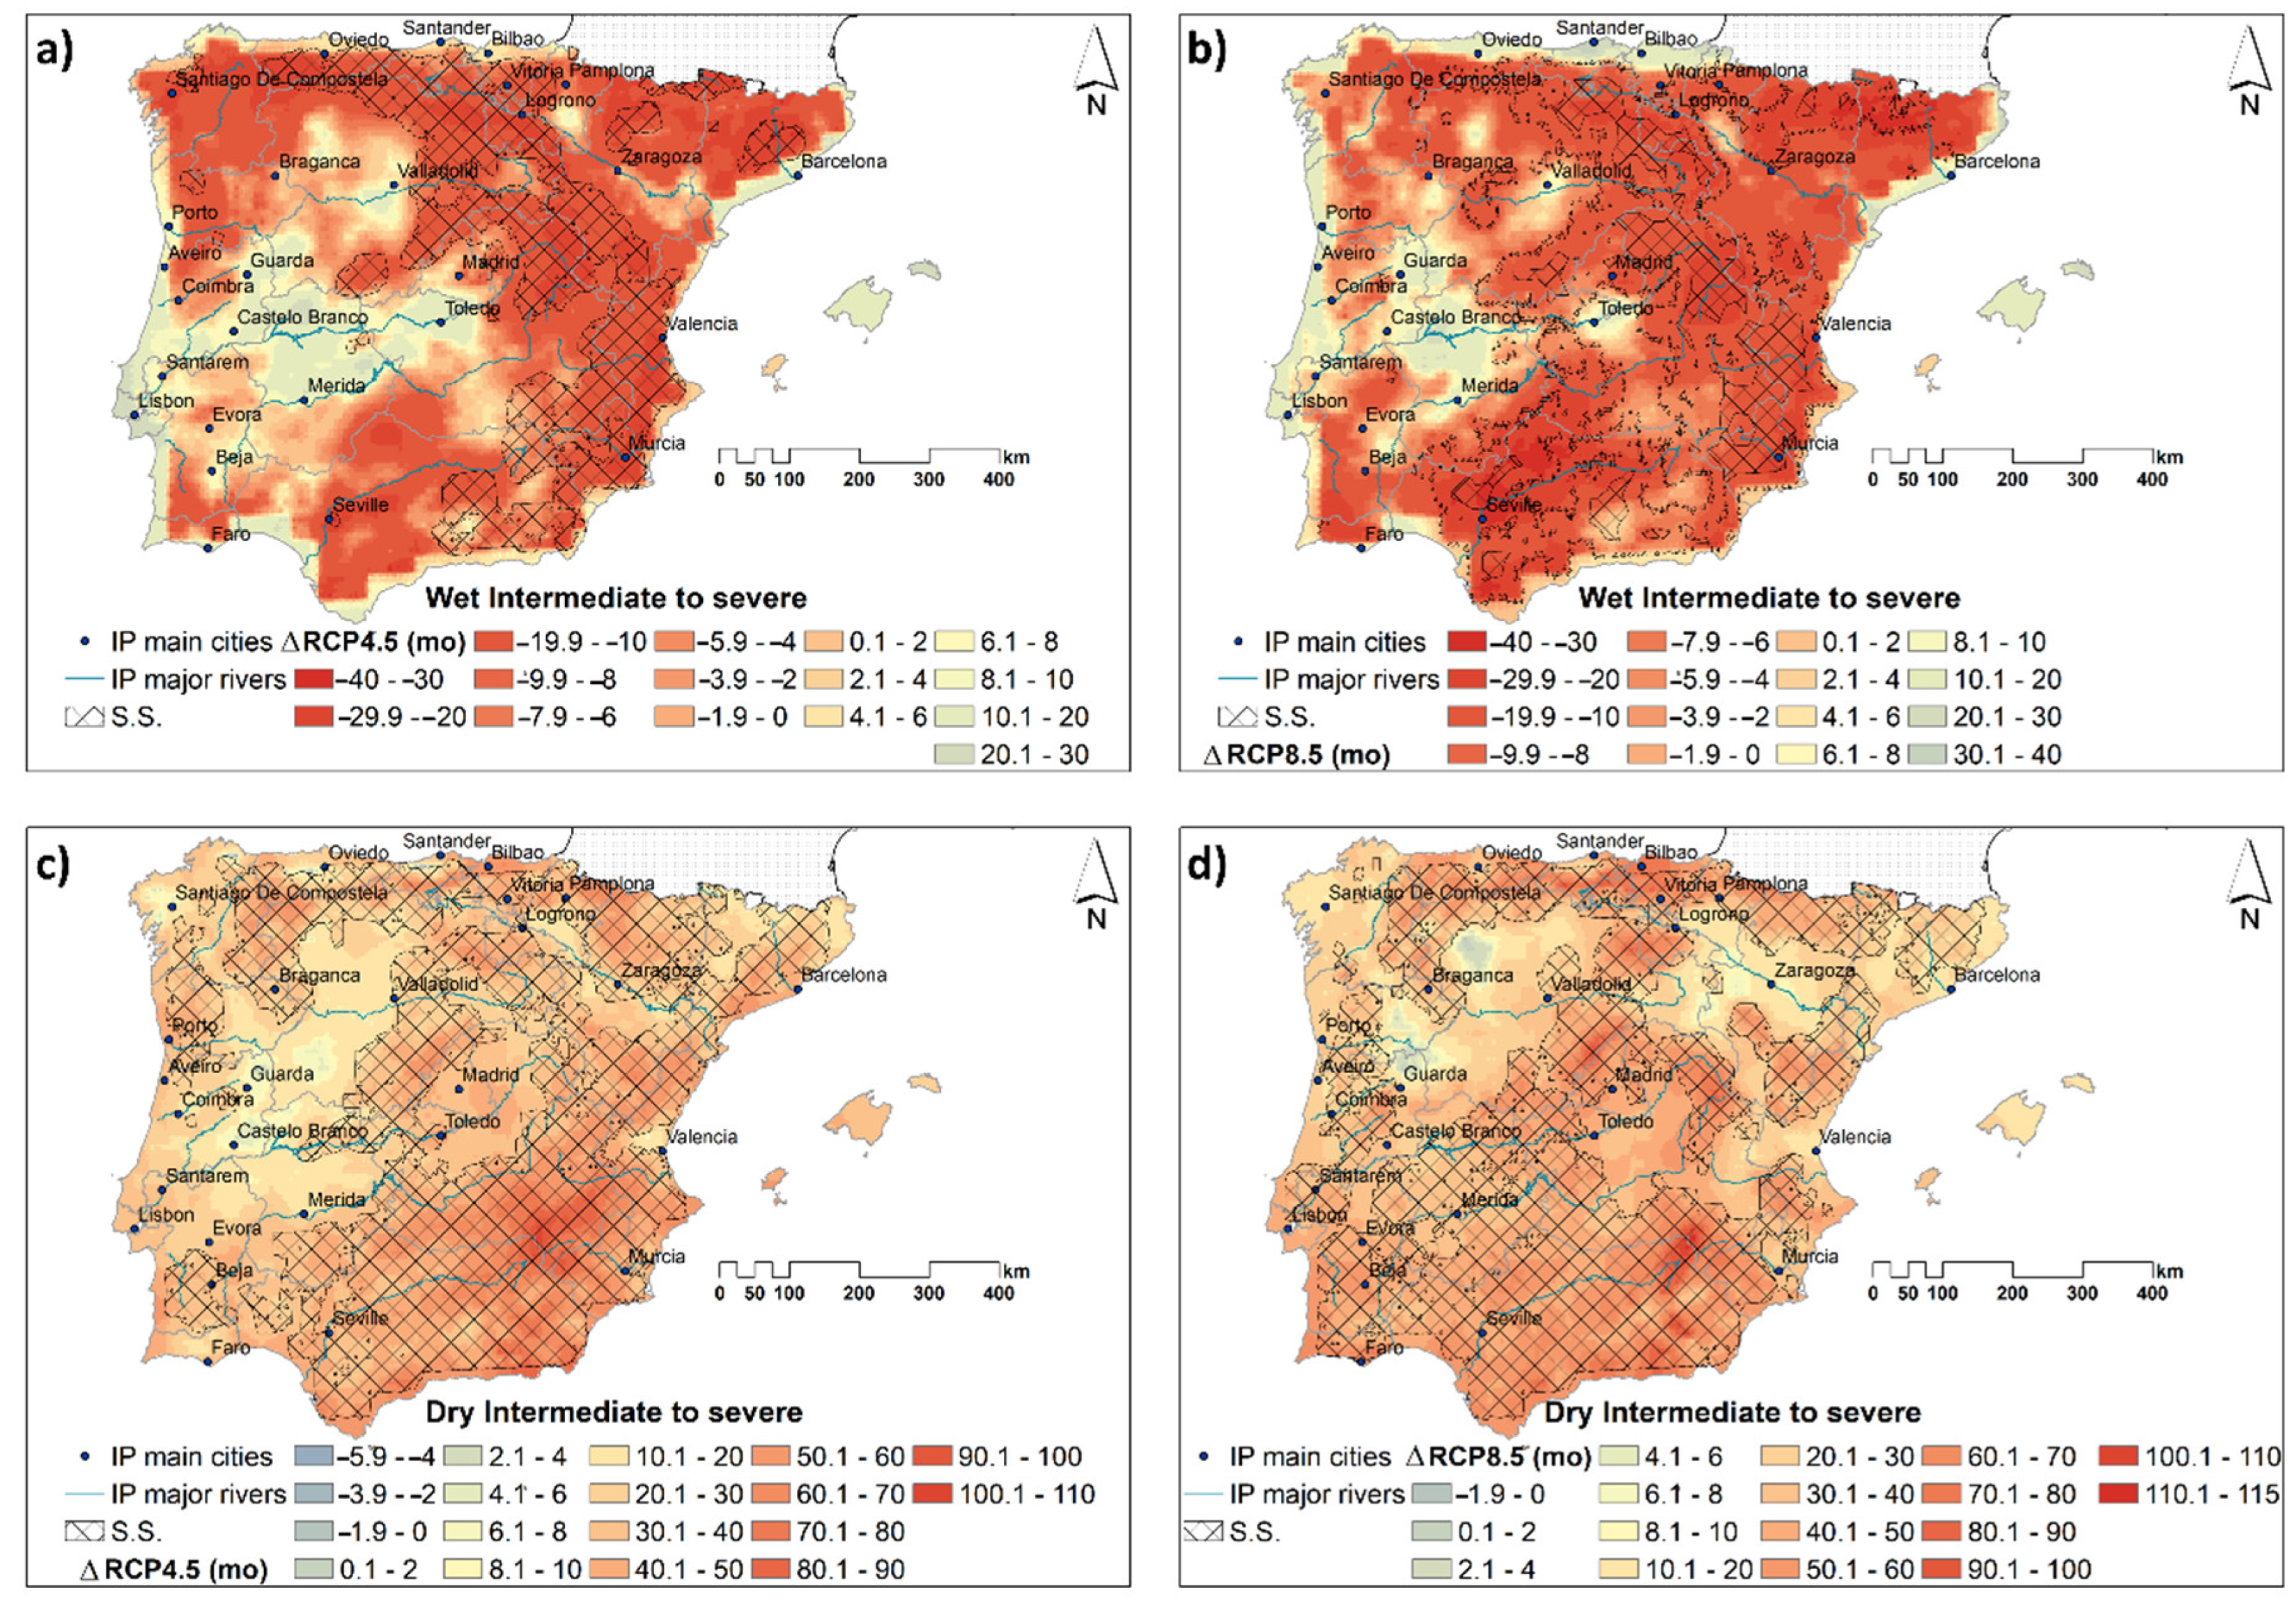
A comparison between 2041–2070 under both RCPs and 1961–1990 was performed for the duration and frequency of occurrence of intermediate-to-severe dry and wet events. The anomalies (∆) were attained between 2041–2070 12m-WASP values minus the 1961–1990 12m-WASP. The statistically significant anomalies (S.S) were assessed by the Mann-Whitney-Wilcoxon test (MWW) at a 5% significance level [53,54]. The null hypothesis of this nonparametric test, assesses if the data have equal medians or not (Ha = 1, rejection of the null hypothesis).
3. Results
3.1. Historical Evolution for Wet and Dry Events
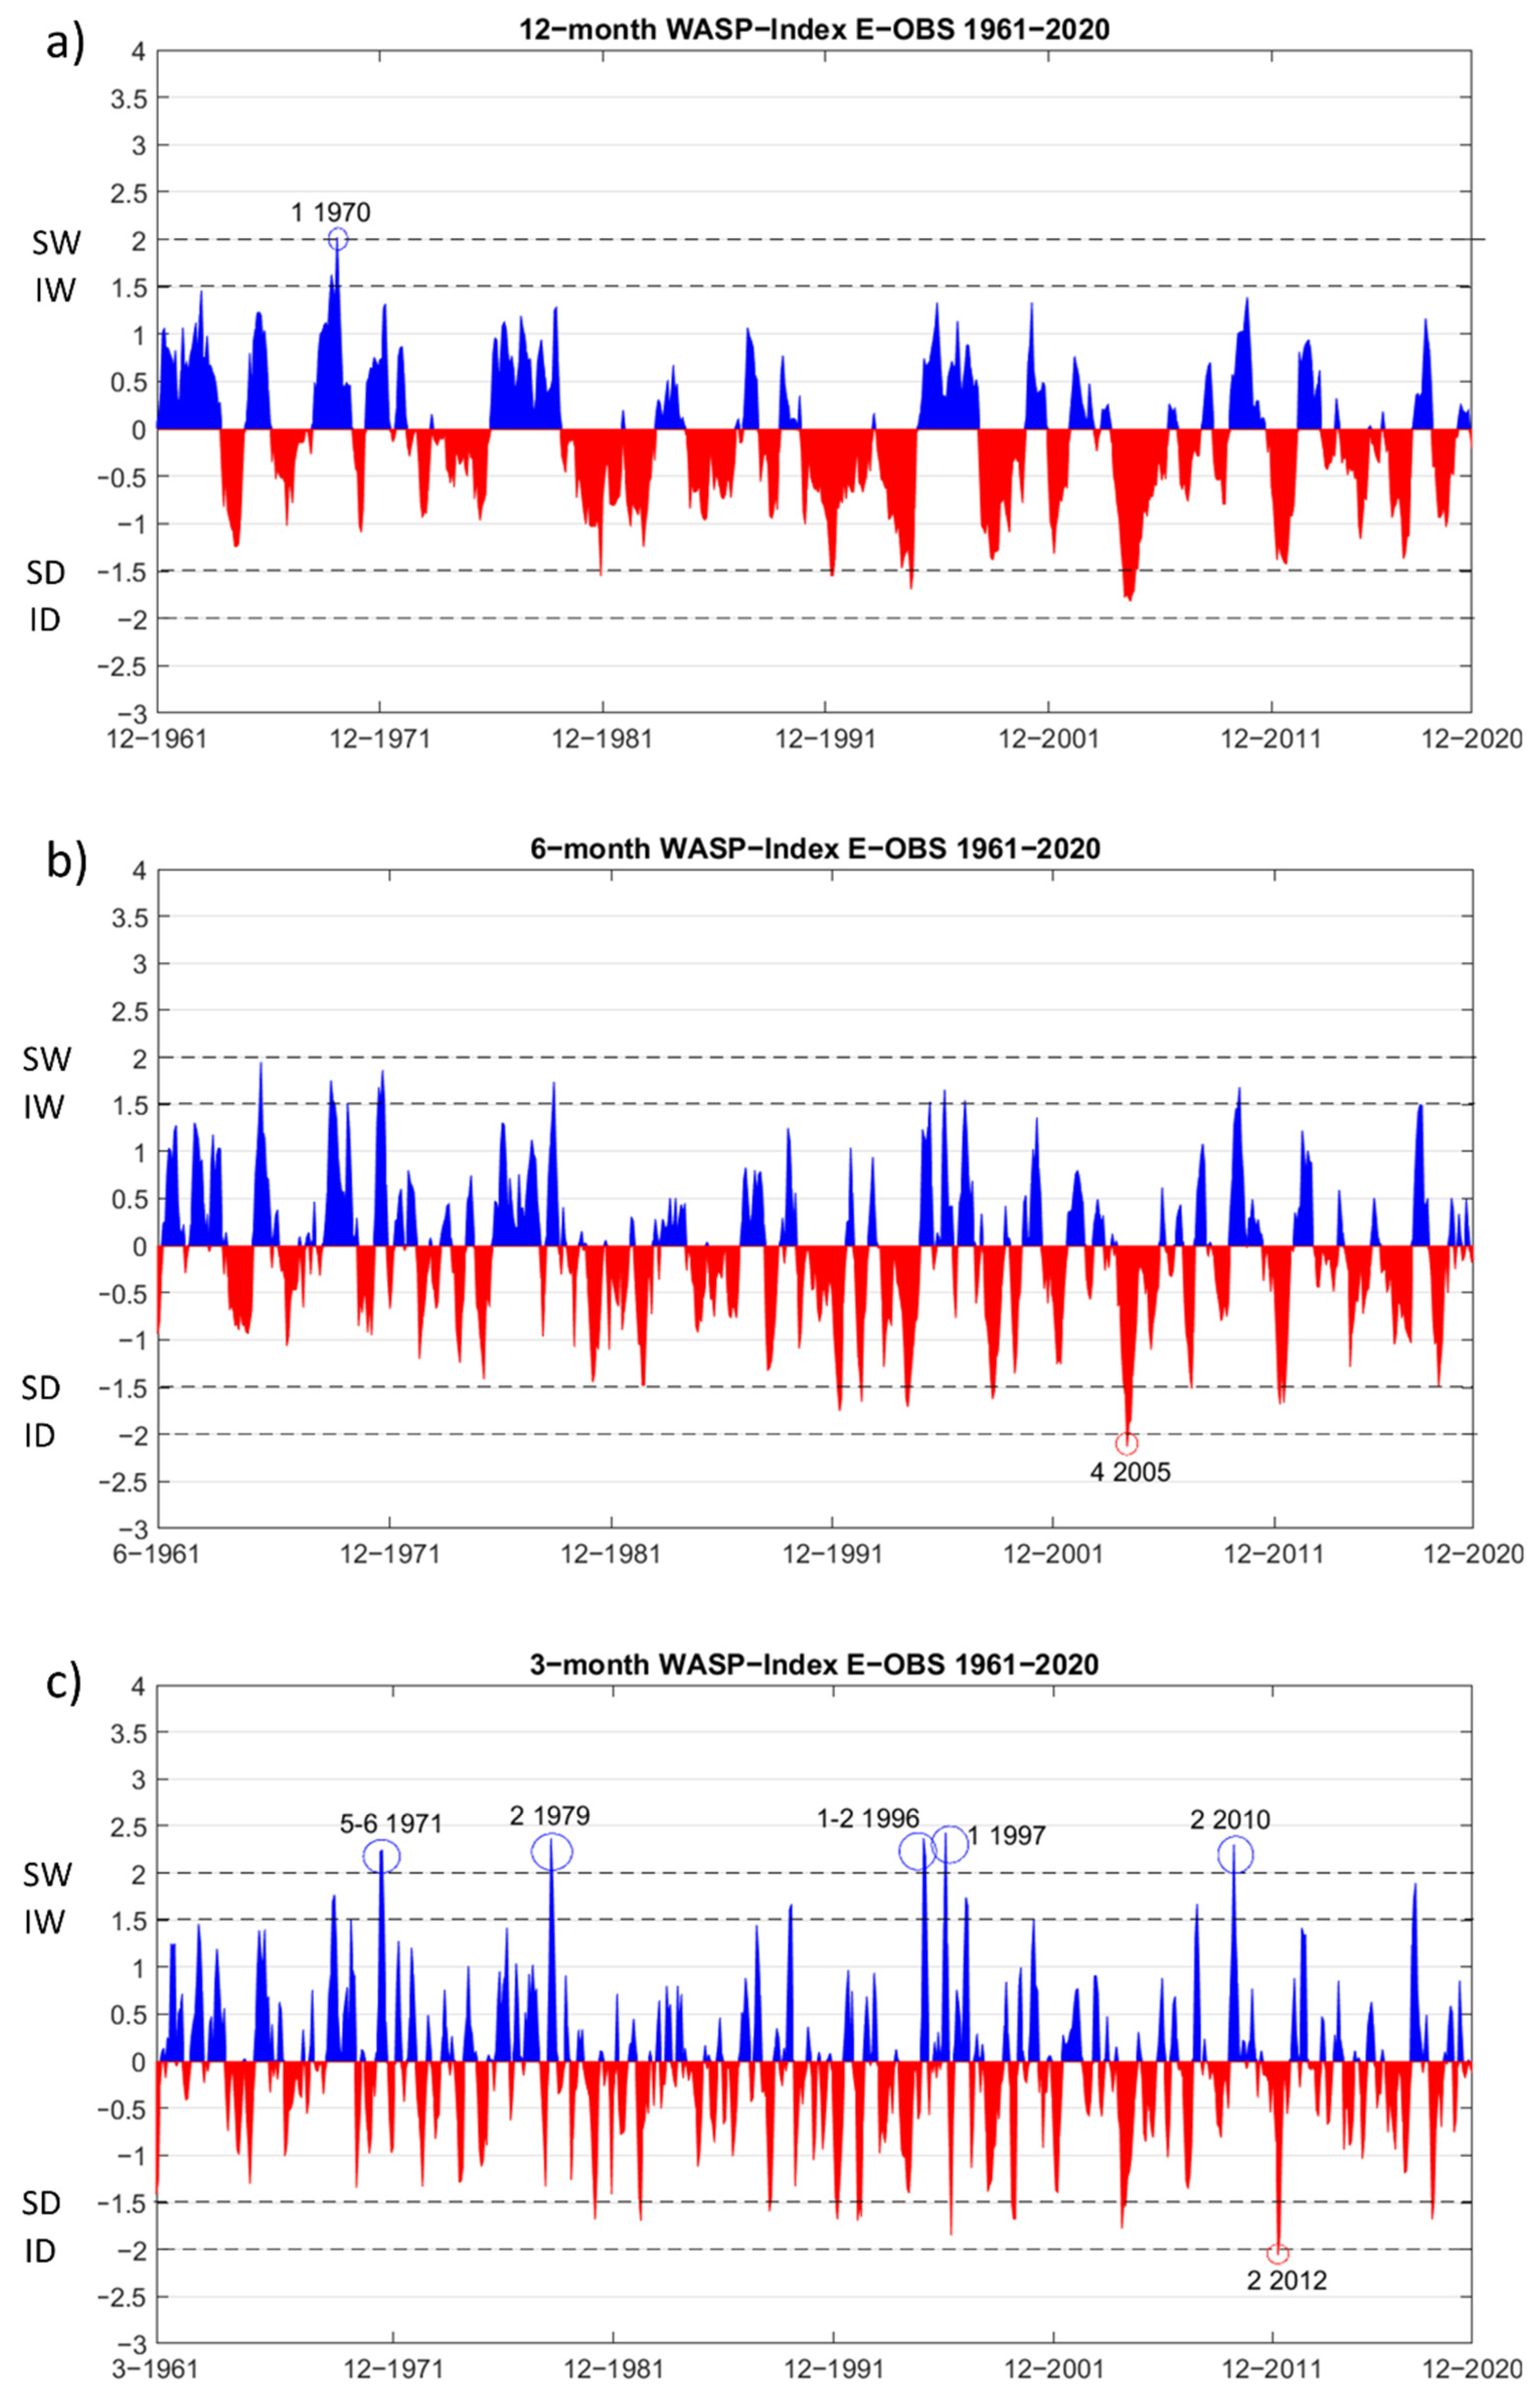
The analysis of 12m-WASP, 6m-WASP, and 3m-WASP values in both Table 3 and Figure 3 (only for the past periods) allows a better understanding of past and future conditions for dry and wet events for the entire IP, under RCP4.5 and RCP8.5. According to Table 3, a single 12m-WASP intermediate dry (ID) event and three 3m-WASP ID events were detected for the study area in the period 1961–1990 (Figure 3). No severe dry (SD) events were detected. For 3m-WASP, seven intermediate wet (IW) and three severe wet (SW) events are shown for the same period, 9 IW, no SW for 6m-WASP and 2 IW, and one SW for the 12m-WASP (Figure 3).
For 1981–2010, no SW events were detected except for 3m-WASP with 4 SW events. Similar considerations can be made for the SD events, apart from one event for the 6m-WASP. For this period, 4 IW events were detected for the 6m-WASP and six for the 3m-WASP. Conversely, in 1981–2010, 10 ID events were found for the 12m-WASP, 13 ID events for the 6m and 3m-WASPs and one SD event in 2005 for the 6m-WASP [55], hinting at an upward trend’ in dry conditions (Figure 3).
The results project an increase in the number of both intermediate-to-severe dry events, between 2021−2050 and 2041−2070 under both RCPs, and for the three WASP timescales. The number of projected events is higher than for the intermediate-to-severe wet events. A higher number of dry events are projected, with the 12m-WASP higher for RCP8.5 (23 ID and 2 SD) than for RCP4.5 (14 ID and 8 SD) over the period 2041−2070 (Table 3). The increase of the intermediate-to-severe wet events was not as pronounced as for the dry events (Table 3) for both the 12m-WASP (Figure 3a) and the 6m-WASP (Figure 3b).
Since wet events are typically associated with shorter timescales (e.g., flash floods, floods, and storms), they are better captured with the smaller timescale WASP-Index. Therefore, for the 3m-WASP in 2041−2070, 10 IW and four SW events were found under RCP8.5, and three IW and six SW under RCP4.5. These results hint at a link between drought conditions and extreme climatological events (higher values in the 12m-WASP) and wet conditions and extreme meteorological events (higher values in the 3m-WASP). The projections for the number of SW events for the 3m-WASP (six and one for 2021−2050, six and four for 2041−2070 for RCP4.5 and RCP8.5, respectively) were higher in comparison with the SD events (two and one for 2021−2050, three and zero for 2041−2070 for RCP4.5 and RCP8.5, respectively) (Table 3). No intermediate-to-severe wet events were projected to occur for the 12m-WASP under RCP8.5. Only two IW events were projected for both future periods under RCP4.5.
In summary, an overall increase of ID events was projected, more pronounced than for the SD events, and higher for the 12m-WASP under RCP8.5 (Table 3). For the 6m-WASP, the projected number of dry events was also noticeable, and higher for ID (12 and 8 for 2021−2050, 14 and 11 for 2041−2070, for both RCPs, respectively) than for SD events (four and four for 2021−2050, three and zero for 2041−2070, for both RCPs, respectively). As stated above, the projected increase of intermediate-to-severe wet events was not as pronounced as for dry events. The 3m-WASP IW events showed the most significant change under RCP8.5 (four and five for 2021−2050, three and 10 for 2041−2070 for both RCPs, respectively). For the 12m-WASP, no significant increase in the number of IW events was projected under RCP4.5, for which no SW events were projected to occur from 2021 to 2070 under both RCPs.
Following the selected methodology (Figure 2), the duration (Figure 4 and Figure 5), intensity (Figures 7 and 8) and frequency of occurrence (Figures 9 and 10) for intermediate-to-severe wet and dry events for the 12m-WASP were computed for the past periods 1961–1990 and 1981–2010, and the future periods 2021–2050 and 2041–2070, under RCP4.5 and RCP8.5. The 12m-WASP anomalies (∆) between 2041–2070, for both RCPs, and 1961–1990 are presented for the duration (Figure 6) and frequency of occurrence (Figure 11) of wet and dry events. The corresponding tables for duration (Table S1), intensity (Table S2), and frequency of occurrence (Table S3) were analyzed for several IP main cities (within NUTS 2 regions) and are provided as supplementary material.
3.2. Projections for Intermediate-to-Severe Wet and Dry Events
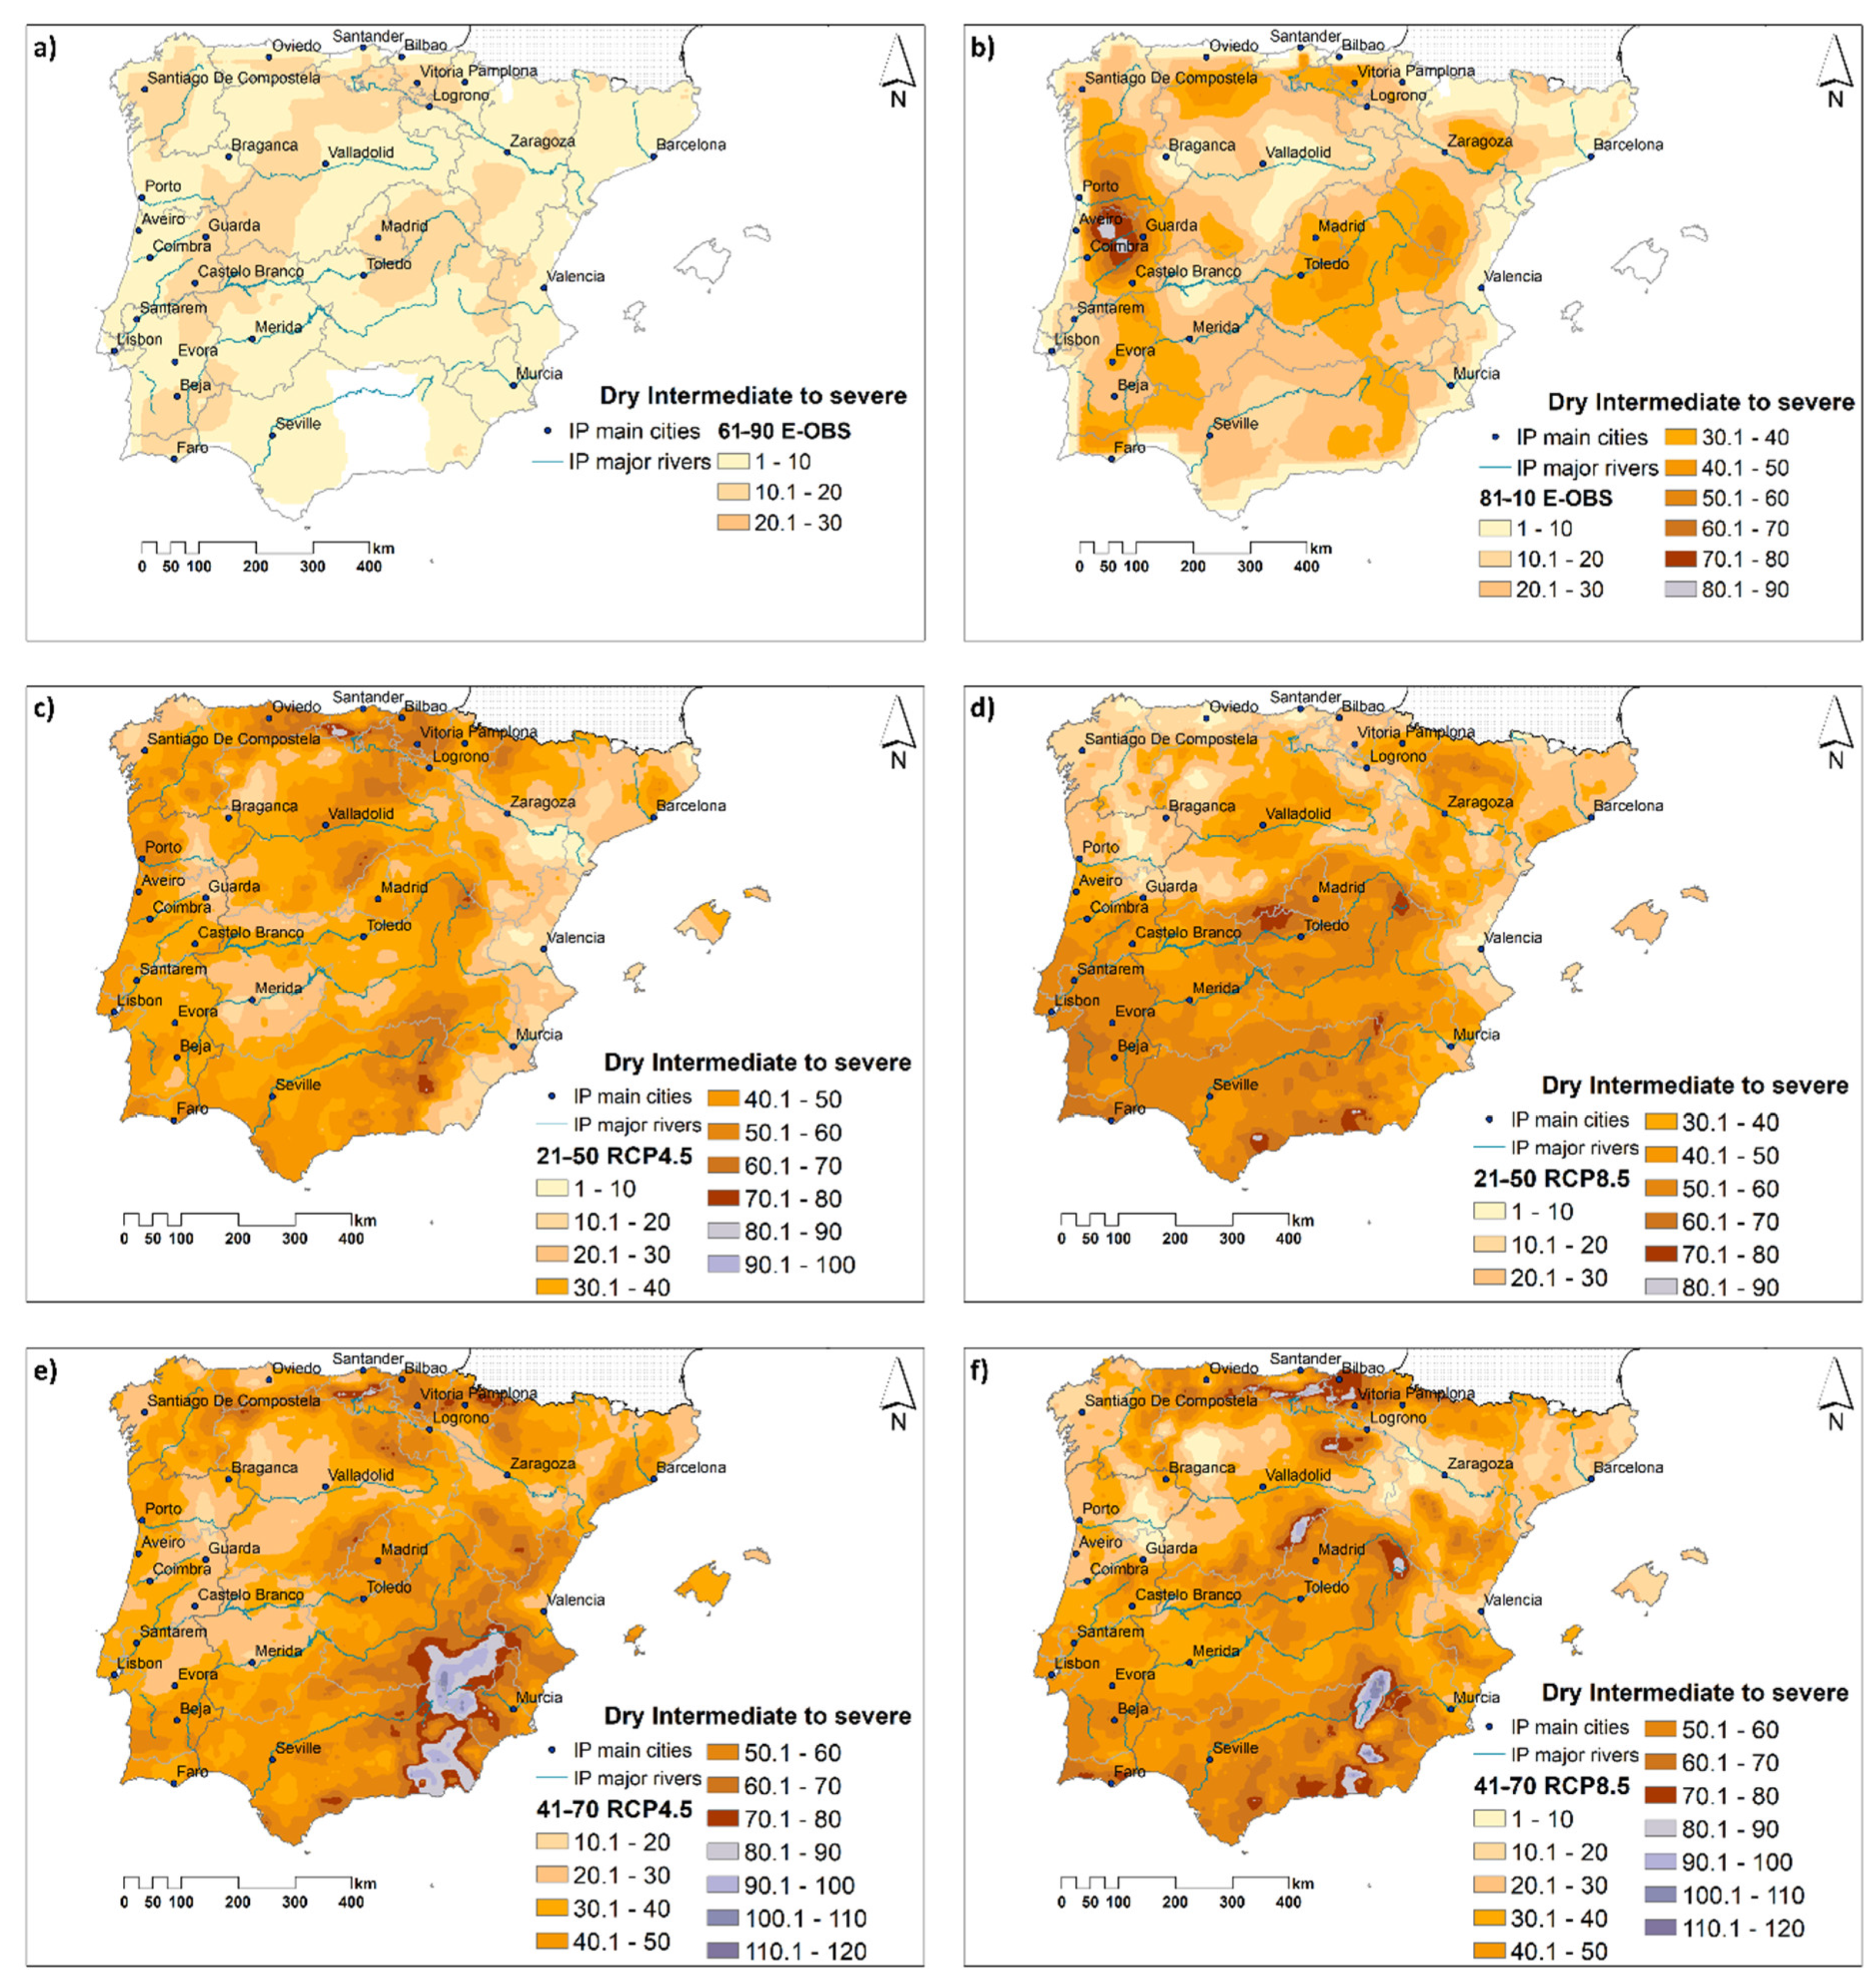
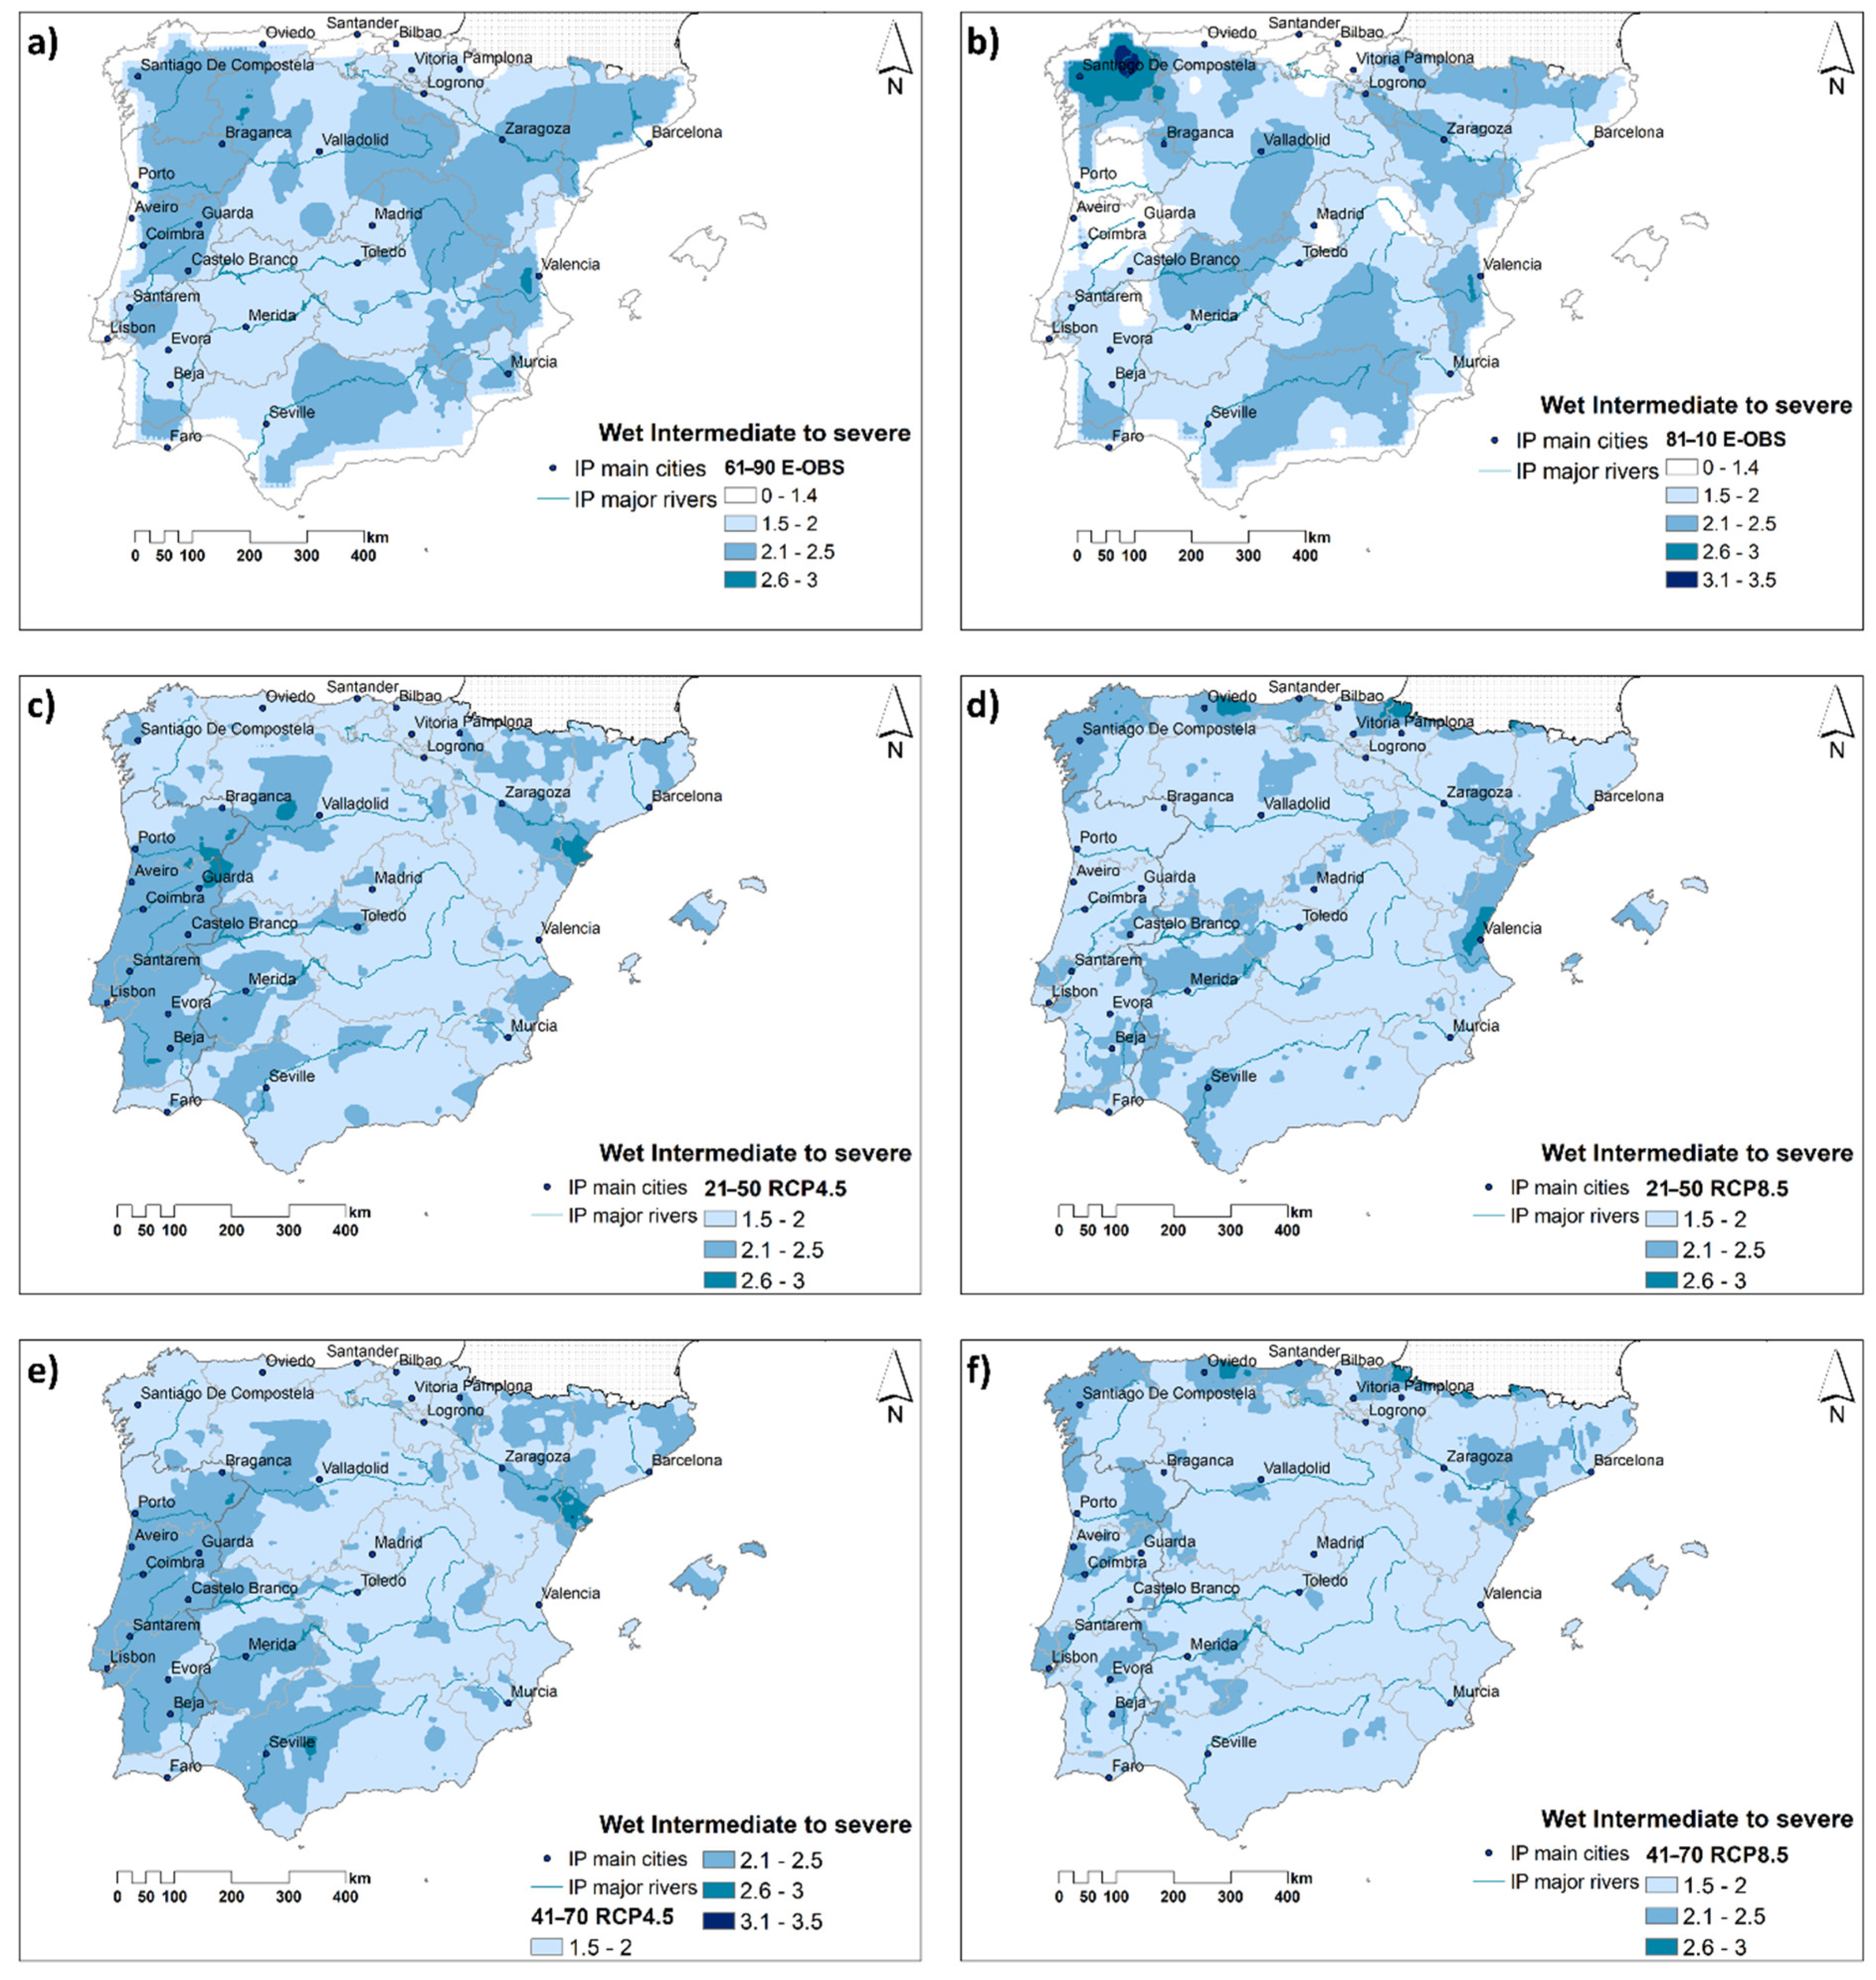
Figure 4 shows the duration in months of intermediate-to-severe wet events for the 12m-WASP under both RCPs. The results show a clear projected decrease in the duration of these events from 1961–1990 (Figure 4a) to 1981–2010 (Figure 4b) in Aragón and Cataluña despite the increase in the duration over central Iberia and southern Portugal. This hints at a change in the precipitation regime during these periods. Conversely, for the same periods, there was an outstanding difference between the duration of intermediate-to-severe dry events in 1961–1990 (Figure 5a) and 1981–2010 (Figure 5b). An increase in the number of dry months in Centro, Norte (in Portugal), and Galicia are noteworthy, with values reaching 90 months (corresponding to 7.5 years) for 1981–2010 (Figure 5a). The high number of intermediate-to-severe dry months (30 to 70 months; 2.5 to 5.8 years) can also be found in the north, between Oviedo and Zaragoza, inner Iberia (surrounding Madrid, Toledo, Valencia, and Murcia) and in between Merida and Seville (Figure 5b).
A decrease in the number of intermediate-to-severe wet months is apparent and more pronounced for 2041–2070 (Figure 4e,f) than for 2021–2050 (Figure 4c,d), and lower under RCP8.5 (Figure 4f) than RCP4.5 (Figure 4e). This decrease is clear for 2041–2070 (Figure 6a,b), for which most of the IP shows negative anomalies under both RCPs. The region with higher duration is located near the Atlantic Ocean, over Portugal (positive anomalies), extending towards Extremadura in Spain, mainly under RCP4.5. This projected decrease in the duration can also be found in southern Portugal, affecting the Alentejo and Algarve regions in both periods, mainly under RCP8.5 and for 2021–2050. Conversely, the projected increase in the number of months of intermediate-to-severe dry events is worth noting (Figure 5c–f). The spatial extension of the highest values towards the southern half of IP is also clear, though for 2021–2050 there are areas with lower values in inner Iberia and the eastern coast, mainly under RCP4.5 (Figure 5c) when compared with RCP8.5 (Figure 5d). The highest durations (up to 120 months, e.g., equivalent to 10 years) were projected for the region of Murcia and its surroundings, with a more prominent extension under RCP4.5 (Figure 5e). Although the extension of these maximum values was weaker under RCP8.5, small areas in the north (between Oviedo and Vitoria, Logroño; Figure 5f) can also be identified for 2041–2070. The corresponding positive differences are shown in Figure 6c,d, with prominent values in the previously stated regions. Hence, for these areas, one-third of the years (approximately 10 years) in the period 2041–2070 will experience intermediate-to-severe dry conditions under both RCPs.
Figure 7 shows the spatial-temporal evolution of intermediate-to-severe wet events for the 12m-WASP past and future periods, under RCP4.5 and RCP8.5. Clear differences between the past and future periods are shown. The extensions of areas with SW events (>2) for 1961–1990 decrease for 1981–2010 (though Galicia presents values >2.6). However, for 2021–2050 and both RCPs, the prominence of IW events through the southeast of Iberia is apparent. This predicted decrease of intensity of SW areas in most of IP is higher between 2041–2070, mainly for RCP8.5 (Figure 7f). Although an intensity decrease was found for severe events under RCP8.5, an area comprising most of the Portuguese territory, western Andalucía, Extremadura, certain regions of Castilla y Léon and Cataluña was predicted to remain with conditions favorable to the occurrence of SW conditions towards 2070 and under RCP4.5 (Figure 7e).
Although ID conditions prevailed over the two past periods (Figure 8a,c) in the westernmost half of the IP from 2021 onwards (Figure 8a–c), most of the territory may experience SD conditions, mainly for RCP4.5 and 2041–2070 (Figure 8e). Similar results were found for RCP8.5, projecting areas of ID conditions in Galicia, Castilla y Léon, Aragón, and Valencia, in Spain, and Centro and Norte, in Portugal (Figure 8d,f).
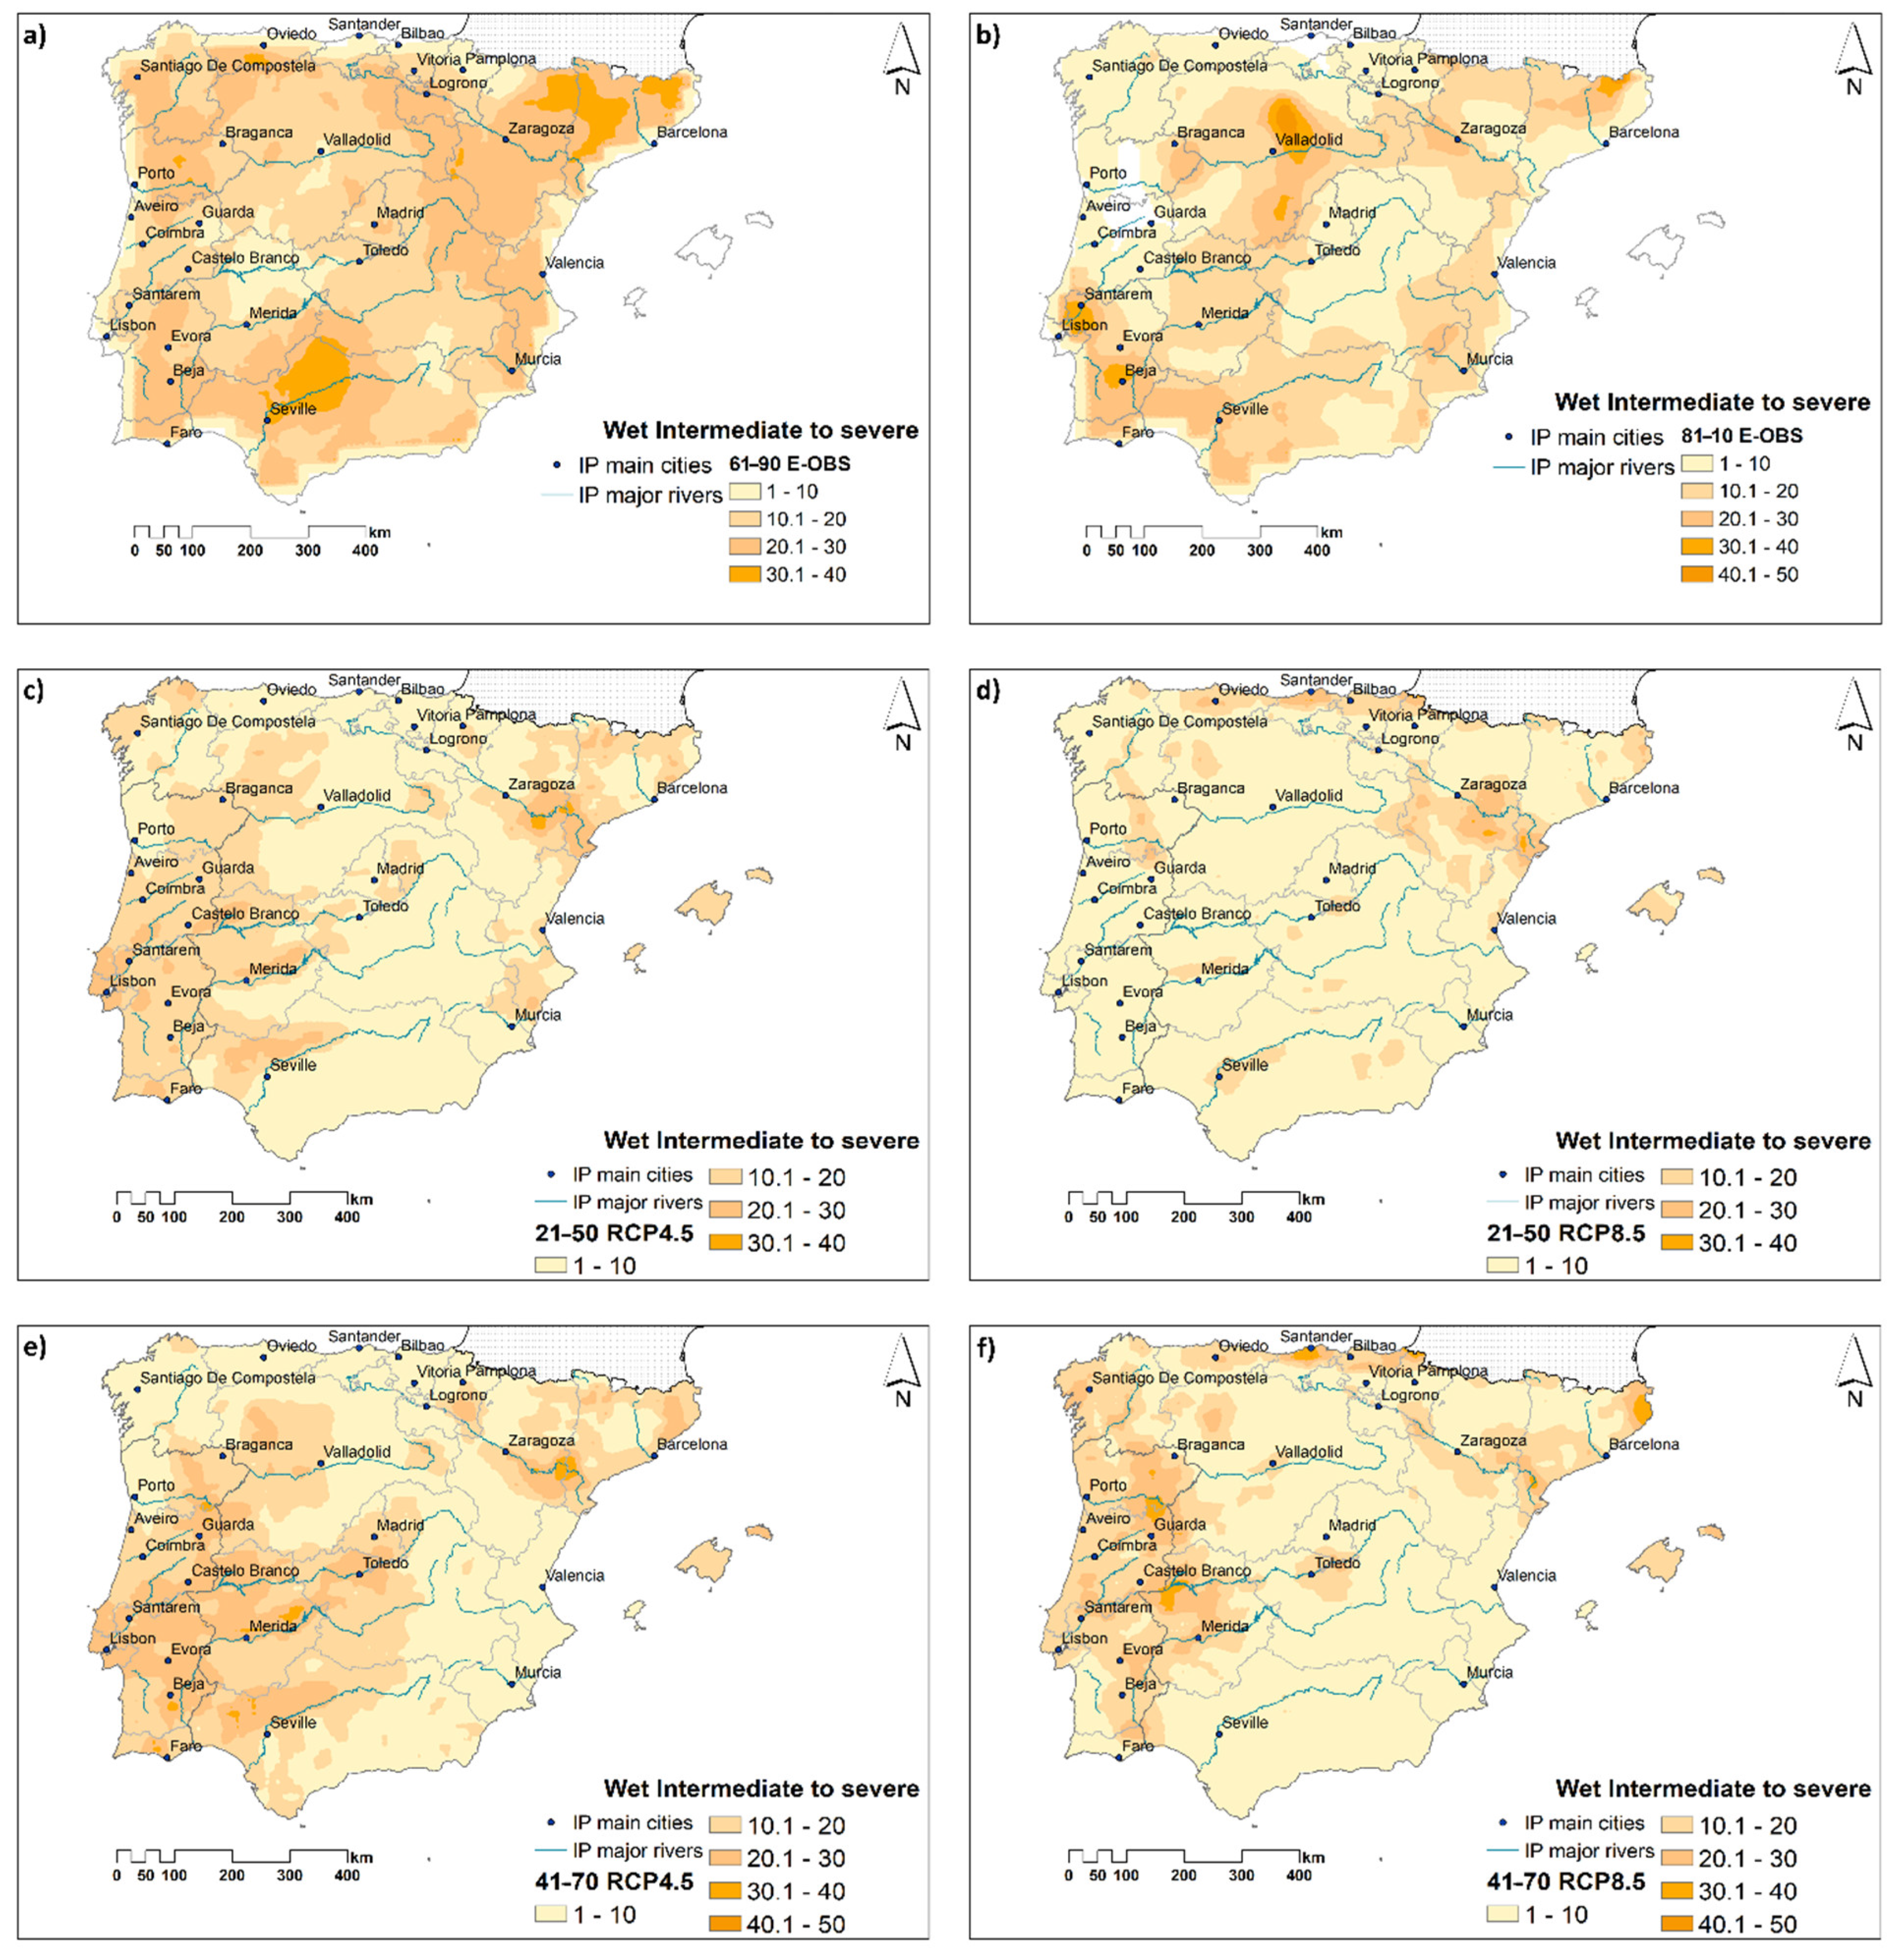
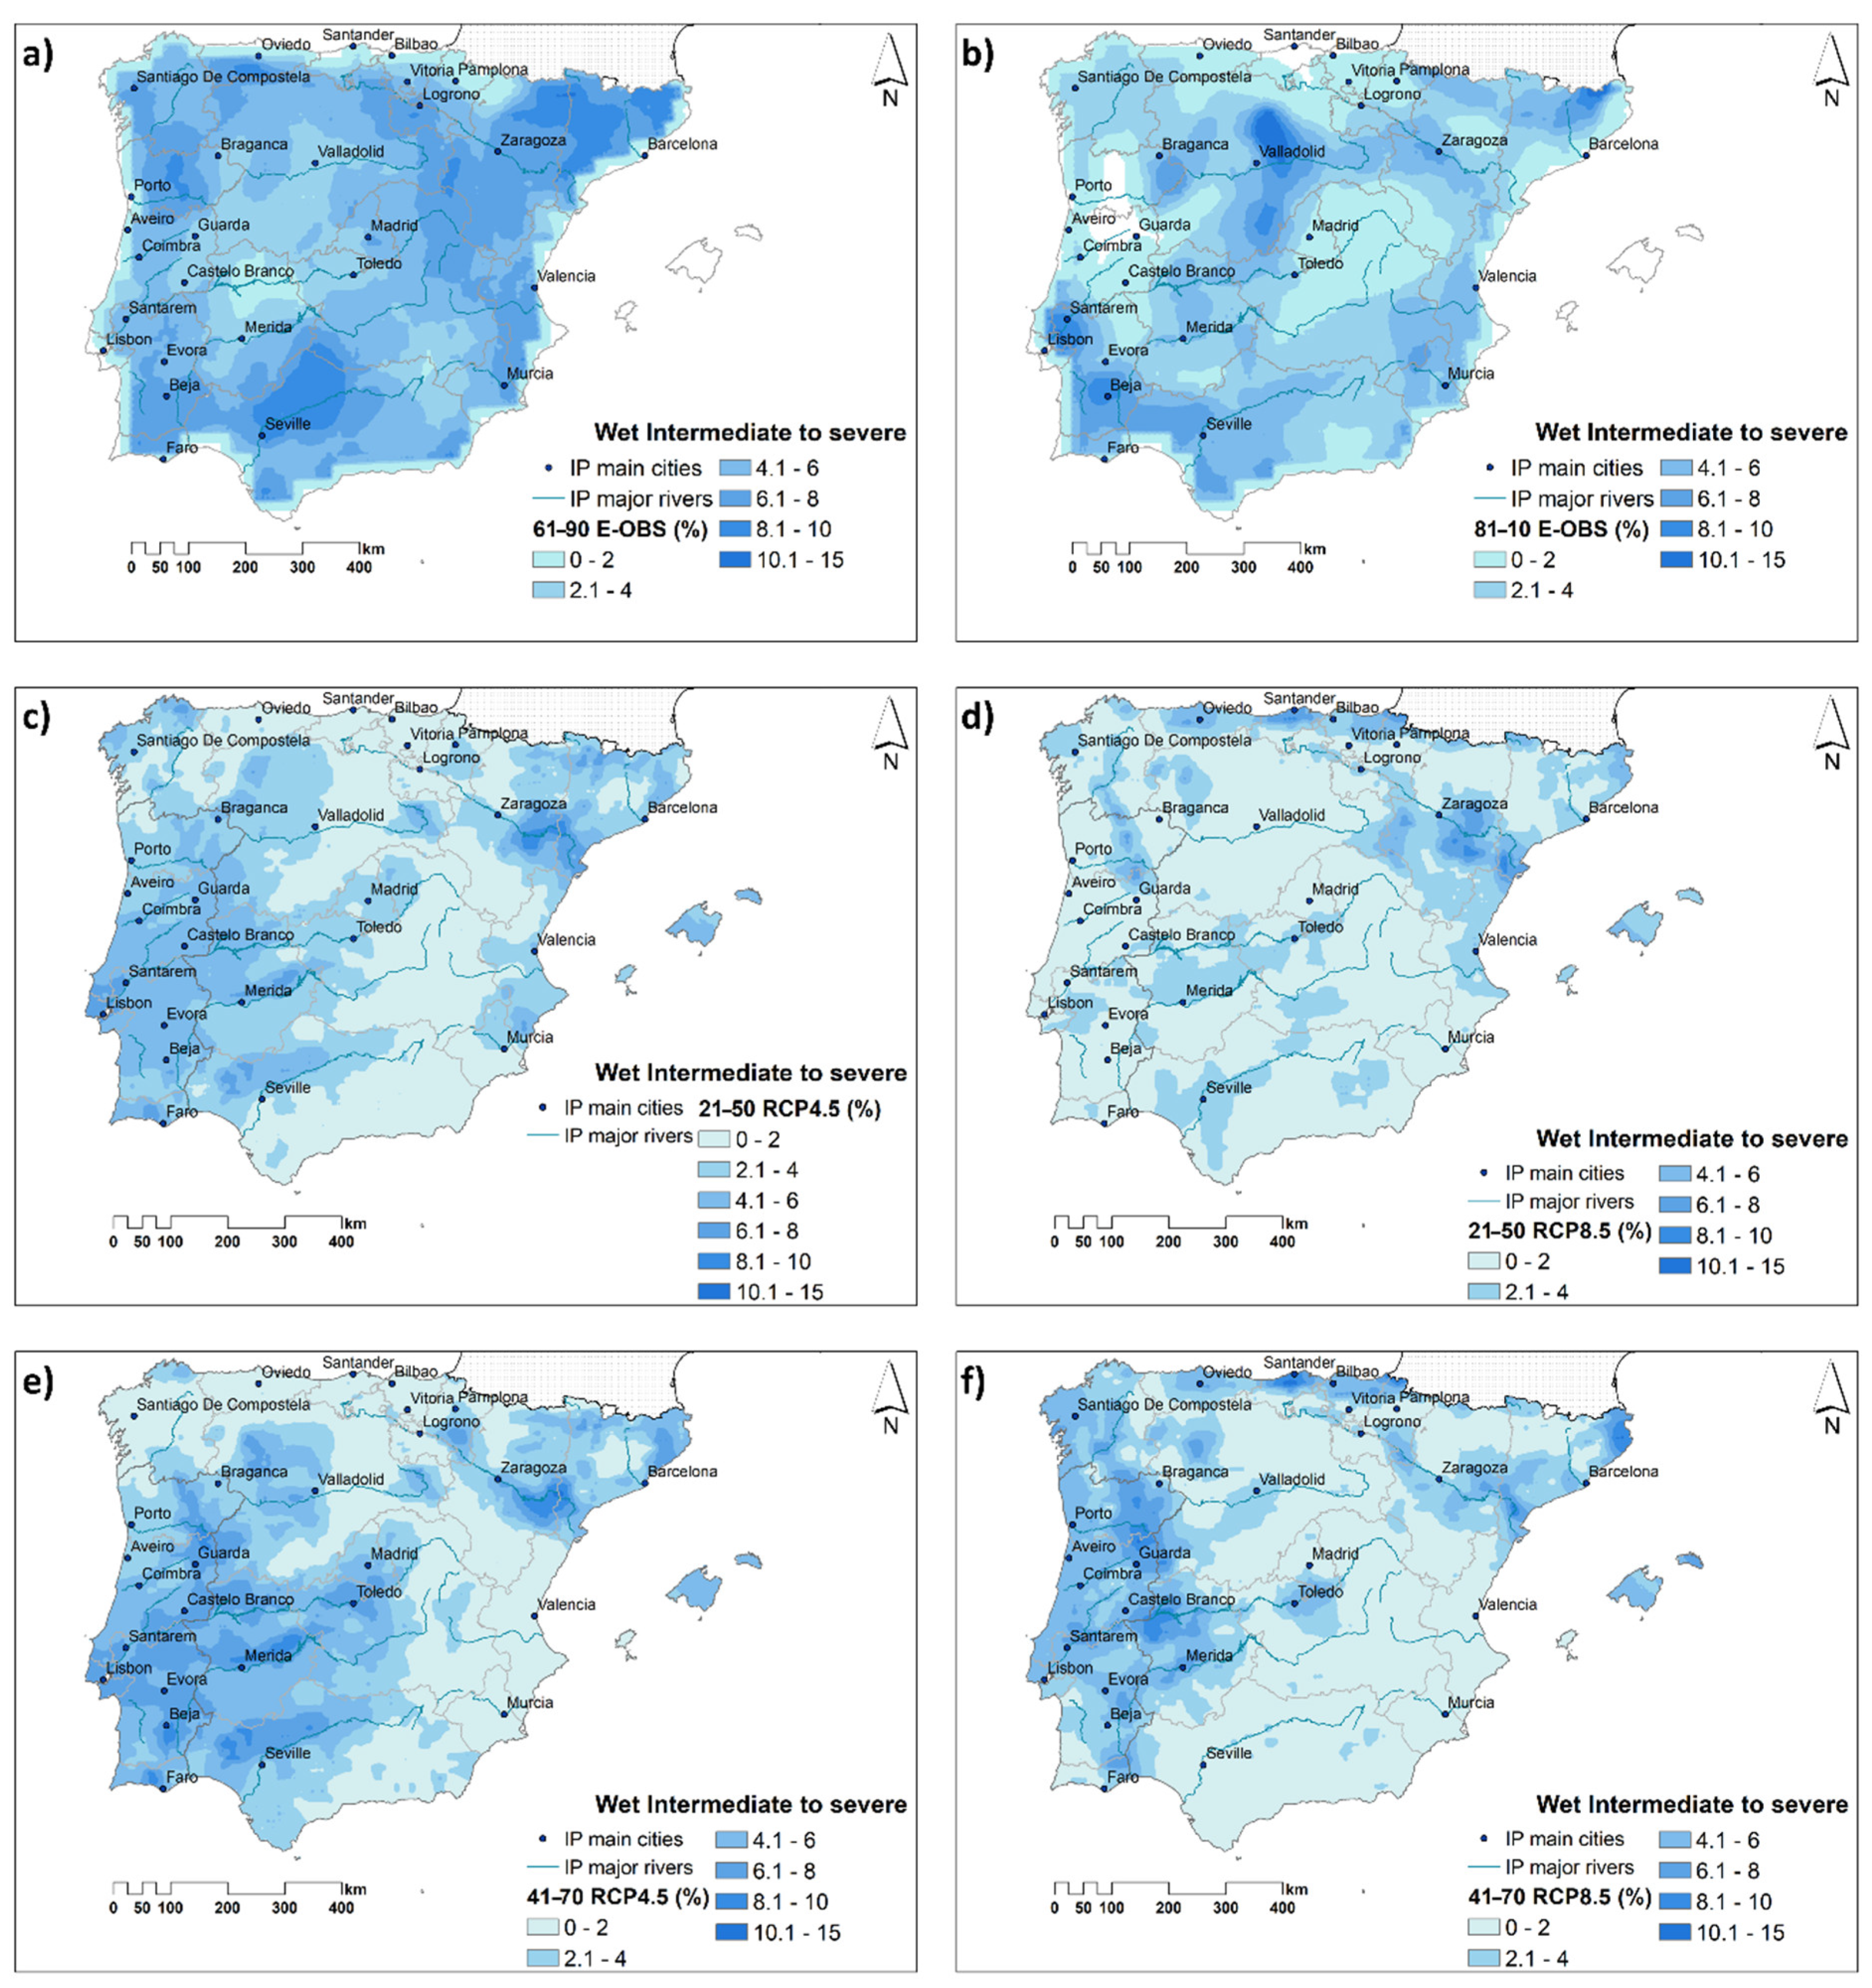
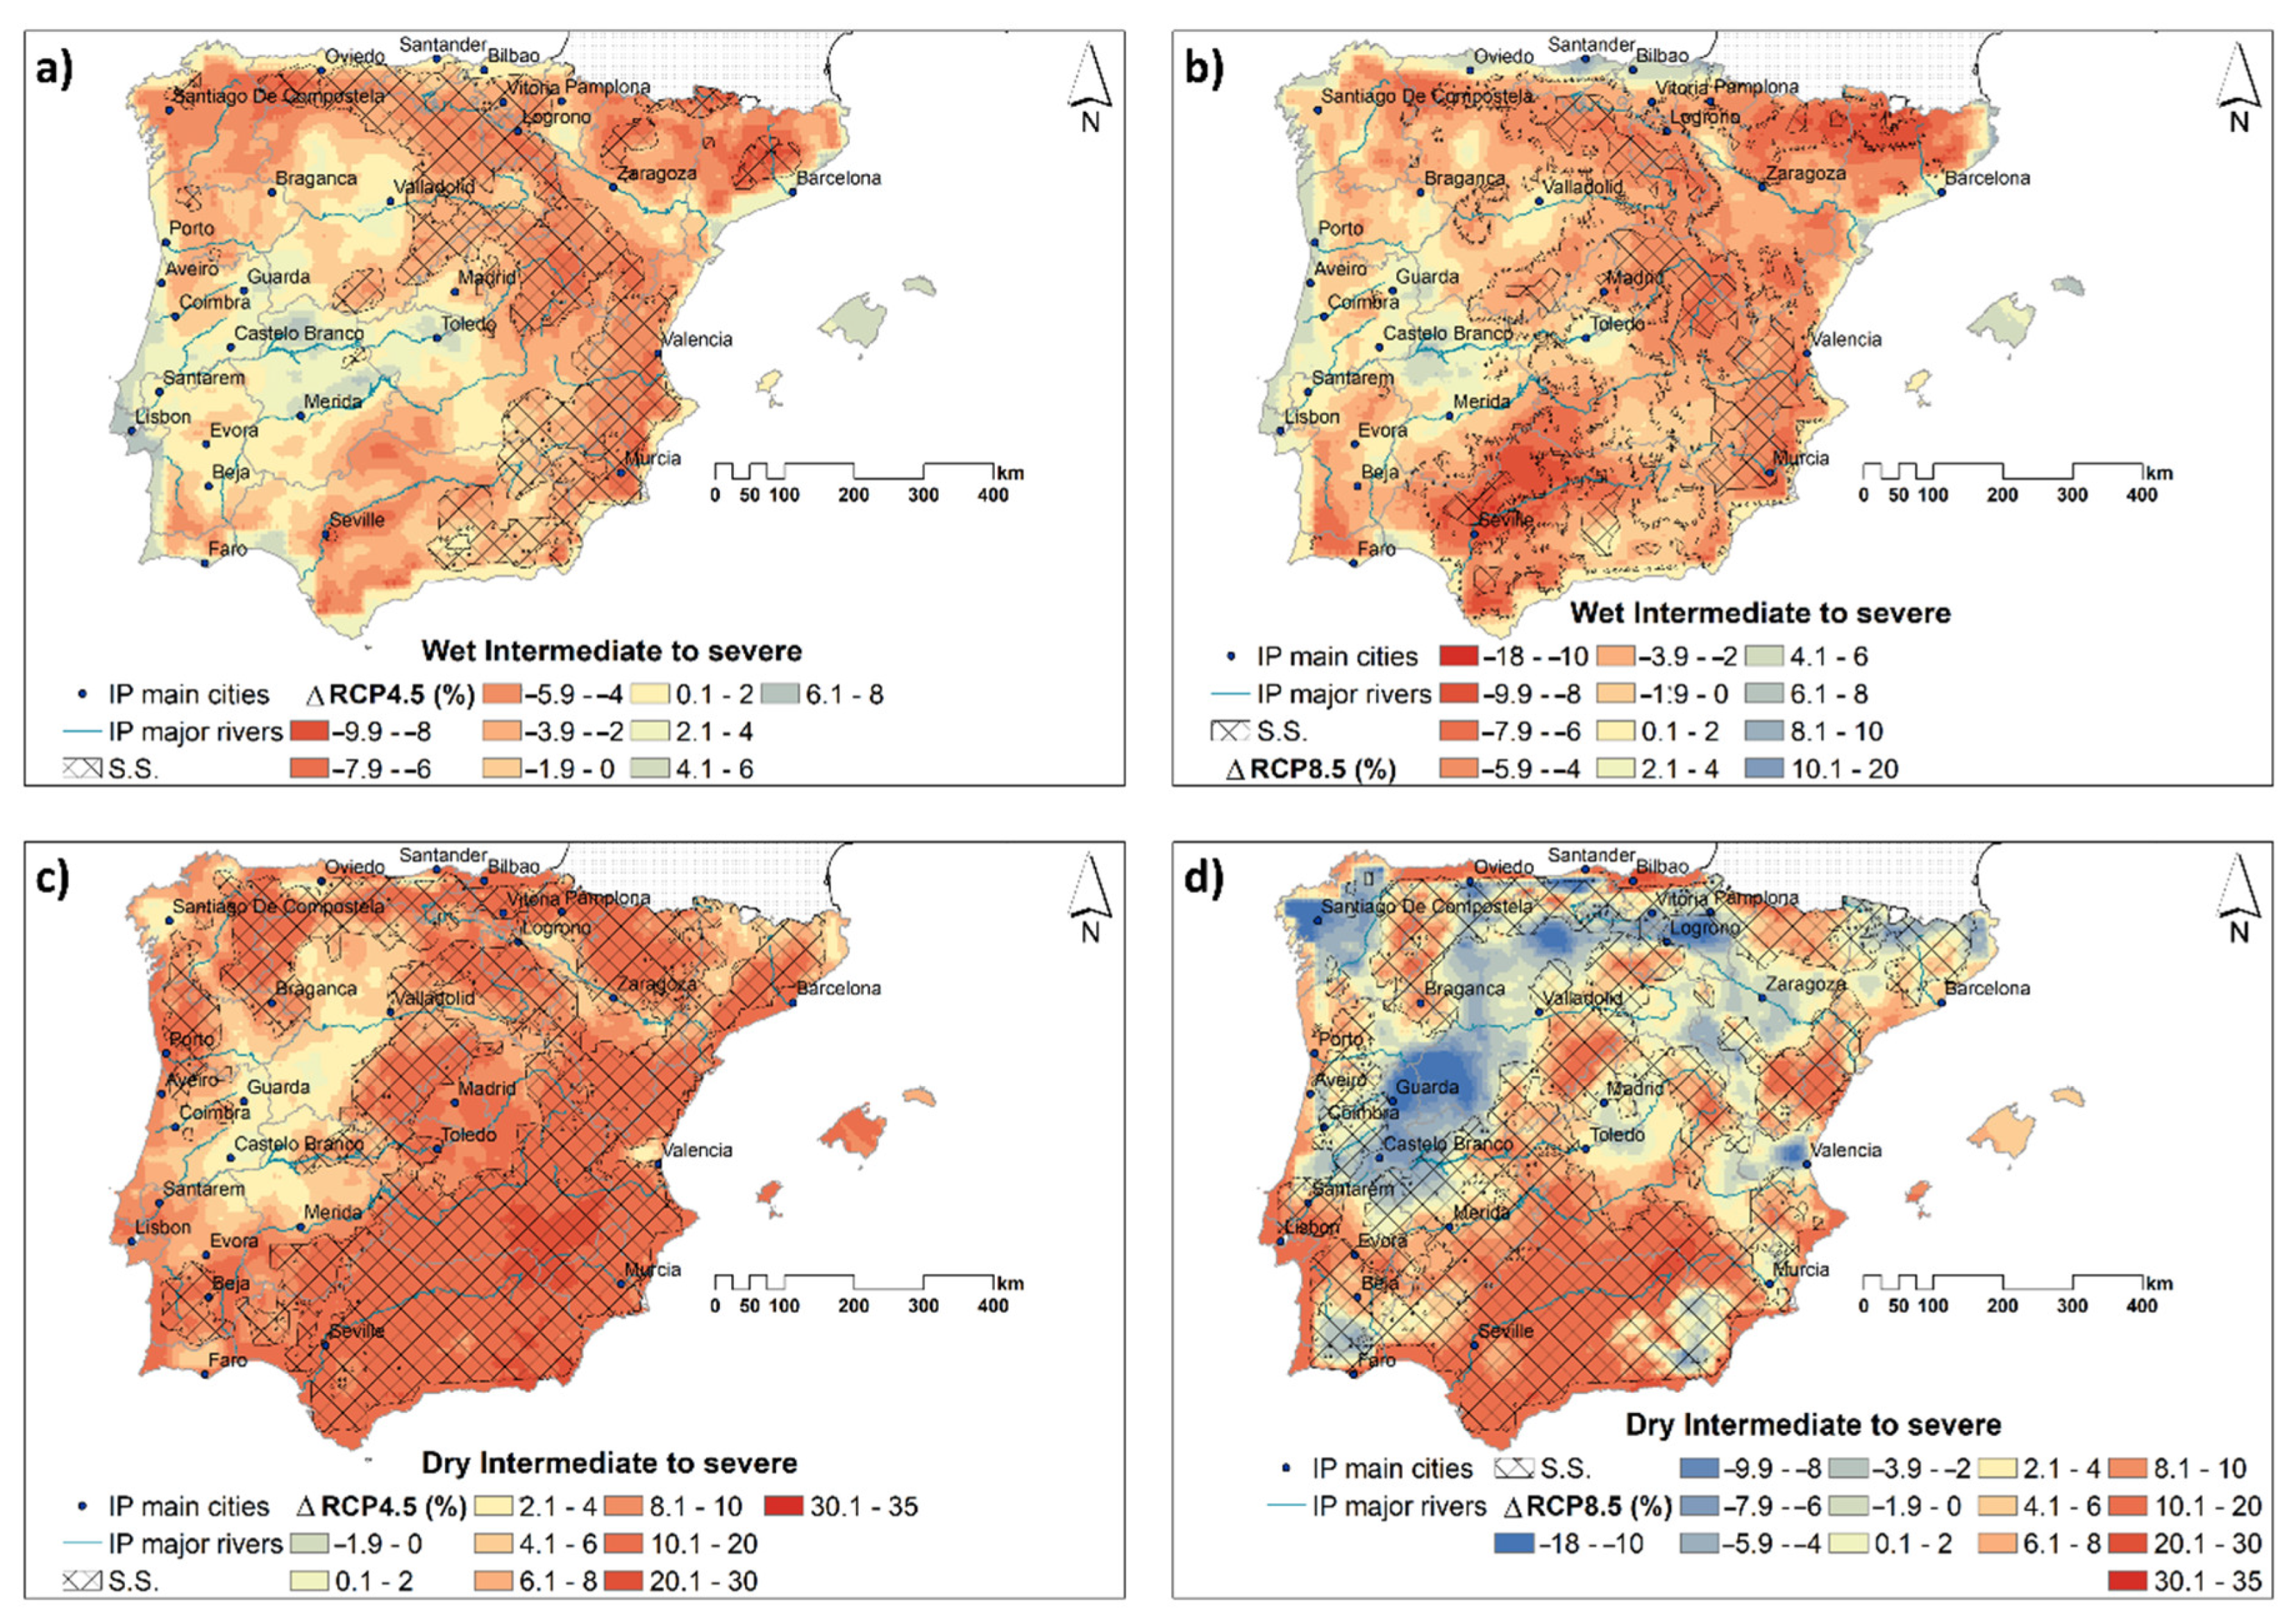
Figure 9 shows the frequency of occurrence of intermediate-to-severe wet events that reveals an overall decrease of these events from 2021–2050 under RCP8.5 (Figure 9e) when compared with the past periods (Figure 9a,b), as well as for the same period under RCP4.5 (Figure 9d). The period 2041–2070 has higher probabilities of occurrence of wet events in the westernmost part of the IP (Galicia not included under RCP4.5) and in the vicinity of Zaragoza and Barcelona (Aragon and Cataluña provinces) (Figure 9e,f), though with lower percentages under RCP8.5. For all periods, these percentages do not exceed 15%. A closer inspection of the spatial patterns between the past (Figure 9a,b) and future periods reveals contrasting differences (Figure 9c–f). These contrasting differences are also present for the frequency of occurrence of intermediate-to-dry events, but it is predicted that an increase might reach a maximum of 35% from 2021 until 2070 under both RCPs (Figure 10). The aforementioned decrease in the frequency is shown in the spatial representation of the anomalies for 2041–2070, in which the negative signal is prominent, except for small areas in the Portuguese and northern Spanish coastal areas, as well as central Iberia in the vicinity of Murcia (positive anomalies), with higher expression under RCP8.5 (Figure 11a,b).
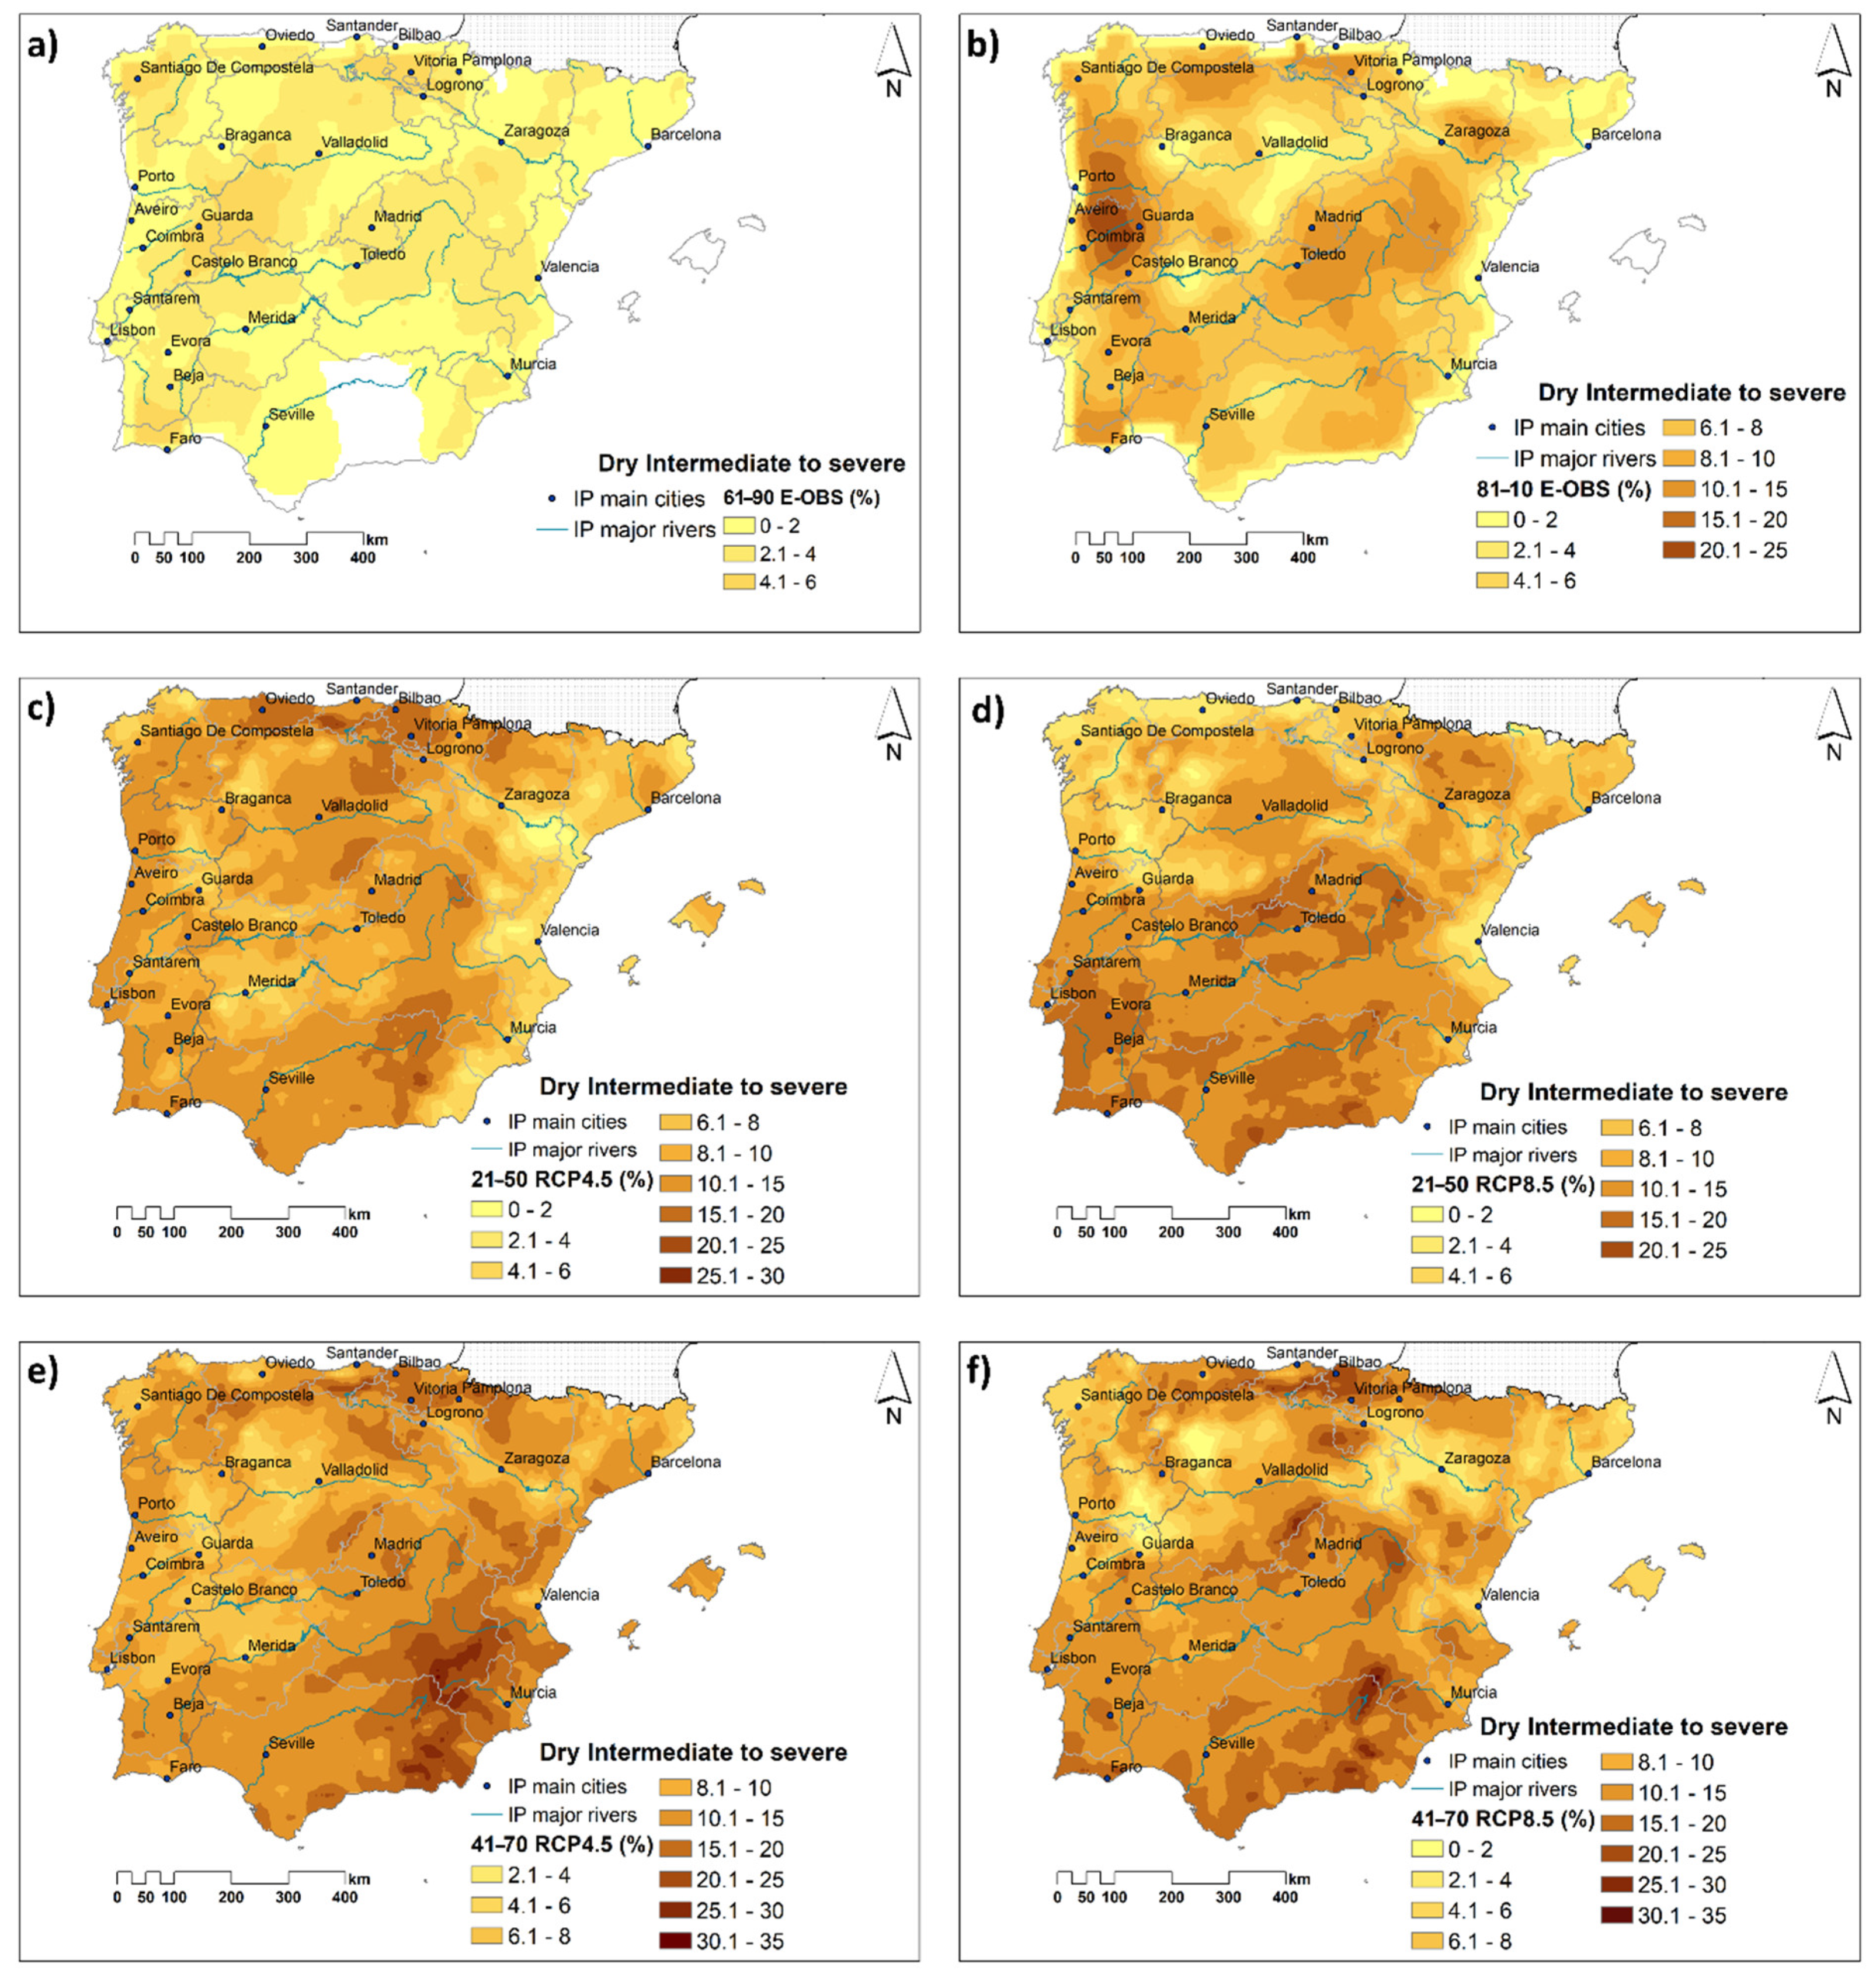
Smaller frequencies of occurrence of intermediate-to-severe dry events up to 8% were recorded for 1961–1990 (Figure 10a), with areas with near-normal classification. However, clear changes can be observed for 1981–2010 (Figure 10b), in which the percentages of occurrence of dry events increase by nearly 25%, mainly in the Centro Region of Portugal. Projections show that for 2021–2050 the southern half of the IP (Comunidad de Madrid, Castilla-La Mancha, and Comunidad Valenciana, in Spain, and Centro, in Portugal) will be the most affected under RCP8.5 (Figure 10d). This includes the southern region of Portugal (Algarve, Alentejo, and Área Metropolitana de Lisboa) that can reach 20% of intermediate-to-dry events under RCP8.5. For the same period (2021–2050), a broader belt from eastern Andalucía to Principado de Asturias, Cantabria, País Vasco and La Rioja with higher percentages are projected under RCP4.5 (Figure 10c). Projections show that the percentage of these dry conditions can reach 35% in certain regions of the IP, such as its central and south-eastern areas, under both RCPs (Figure 10e,f). Southern Portugal also presents higher percentages, mainly under RCP8.5, with projected frequencies from 10 to 25%.
The analysis of the anomalies highlights the spatial variability of the frequencies of occurrence of the dry events towards 2070 (Figure 11c,d). While under RCP4.5 anomalies were positive through most of Iberia and up to 35% changes are projected, there are regions for which negative anomalies were found under RCP8.5 (Figure 11d) though smaller (up to −9.9%). This reveals how climate change projections will affect the IP in different ways, mainly regarding intermediate-to-severe dry events.
4. Discussion
In the present study, the ability of the WASP-index to capture extremely dry or wet events in the IP was used because most studies use the SPI or SPEI. Although most of these extreme events, particularly the meteorological or weather-driven events (e.g., floods or storms) typically occur in shorter timescales (hours to days), they are still identified by the shorter monthly timescales of the WASP-index. For example, the 3m-WASP was able to capture the 2010 winter anomalous conditions depicted by Vicente-Serrano et al. [56]. This latter study analyzed the SPI for the IP, and also reports that 1969 (also by Ramos et al. [57]) and 1996 winters were very similar to 2010. Both winters were also captured by the 3m-WASP (Figure 3c). These results show a reasonable performance of WASP-Index in capturing extreme wet events. The performance of the 1m-WASP in detecting these wet events will be explored in future research. Conversely, for dry events, three timescales of the WASP-Index were used. As an example, Spinoni et al. [58] used SPI at different timescales to construct a new global database of meteorological drought events from 1951 to 2016. For the IP, they identified drought periods between 1991–1995 and 2004–2007 that were also depicted by 3m, 6m and 12m-WASP (Figure 3). Overall, this analysis enabled better documentation of some reported events for the IP between 1961–2020. Furthermore, for this same period, the area-mean values over the IP revealed an upward trend in the frequency of occurrence of intermediate-to-severe dry events, which is in line with a general drying trend reported by previous studies [2,4,23,32,51,59,60].
For future climates, an increase of the intensity, duration, and frequency of occurrence of the 12m-WASP intermediate-to-severe dry events under both RCPs was found, particularly in the southernmost regions of the IP. Indeed, these regions that comprise mainly Comunidad Valenciana, Región de Murcia, Andalucía (in Spain), Alentejo, and Algarve (in Portugal) will endure more prolonged and intense droughts until 2070, increasing the vulnerability of the ecosystems to water scarcity. The heterogeneity of the spatial patterns in the future, under both RCPs, also suggests changes in large-scale patterns of daily precipitation in IP that have been identified in the past [61]. Furthermore, the upward trend in the dry events is projected to be strengthened in future climates, which is also in agreement with previous studies with related impacts on drought [62], bioclimatic conditions [63] or climate classification [21,64]. Since droughts have deep impacts on water resources, agriculture and the environment, this is particularly relevant. This standardized index and methodology can lead to the analysis of drought indices derived from the Standardized Soil Water Index (SSWI) [65]. In future research, the linkage of the agricultural Drought Hazard Index (DHI) with crop yields can lead to the quantification of crop drought vulnerability and risks. This enables evaluation of the water resources vulnerability and scarcity of this region. For instance, Procházka et al. [38] evaluated water scarcity in the Middle East using the WASP-Index. Concerning the wet events, the study showed a decrease in the intensity, duration and frequency of occurrence of the 12m-WASP intermediate-to-severe wet events. These outcomes are supported by previous research for the IP [56]. Nonetheless, the number of 3m-WASP intermediate-to-severe wet events was projected to increase, particularly for the severe events under RCP4.5, suggesting a trend for a strengthening of shorter-term wet events and extreme precipitation episodes [16,66,67,68,69].
The assessment of wet and dry events is highly relevant in regions already considered climatic hotspots like the IP [18,20,70]. Drought risk analysis should be a primary concern of policymakers, as drought risk management should decrease the impacts of severe droughts in urban areas, in which water supply frequently depends on artificial storage. As an example, the Alqueva dam (Portugal) in the Guadiana River has a deep impact on the water supply for population and agriculture in Extremadura, Andalucía, and southern Portugal, for which the cities identified in this study (Supplementary Material), like Faro (Tables S1–S3), are projected to endure more severe and prolonged dry conditions. Overall, this study allows the conclusion that there will be a greater occurrence of dry events in the IP until 2070, under both RCPs, with inevitable consequences on ecosystems [37] and wildfire risk [24], as well as requiring changes in agricultural practices [9,71] such as the selection of new grapevine cultivars [72] or the implementation of olive tree irrigation [73].
Supplementary Materials
The following are available online at https://0-www-mdpi-com.brum.beds.ac.uk/article/10.3390/cli9060094/s1.
Author Contributions
For this study, the author’s contribution was conceptualization, C.A.; methodology, C.A. and J.A.S.; software, C.A. and J.C.; validation, C.A. and J.A.S.; formal analysis, C.A.; investigation, C.A.; data curation, J.C.; writing—original draft preparation, C.A.; writing—review and editing, C.A. and J.A.S.; visualization, C.A. and J.C.; supervision, J.A.S. All authors have read and agreed to the published version of the manuscript.
Funding
This research was funded by National Funds by FCT: The Portuguese Foundation for Science and Technology, under the project UIDB/04033/2020. This study was funded by the European Commission-funded project “Climate change impact mitigation for European viticulture: knowledge transfer for an integrated approach—Clim4Vitis” [grant 810176].
Institutional Review Board Statement
Not applicable.
Informed Consent Statement
Not applicable.
Data Availability Statement
Not applicable.
Acknowledgments
We acknowledge the E-OBS dataset from the EU-FP6 project UERRA (https://www.uerra.eu accessed on 3 February 2021) and the Copernicus Climate Change Service, and the data providers in the ECA&D project (https://www.ecad.eu accessed on 3 February 2021).
Conflicts of Interest
The authors declare no conflict of interest.
References
- Forzieri, G.; Feyen, L.; Russo, S.; Vousdoukas, M.; Alfieri, L.; Outten, S.; Migliavacca, M.; Bianchi, A.; Rojas, R.; Cid, A. Multi-Hazard Assessment in Europe under Climate Change. Clim. Chang. 2016, 137, 105–119. [Google Scholar] [CrossRef] [Green Version]
- Viceto, C.; Cardoso Pereira, S.; Rocha, A. Climate Change Projections of Extreme Temperatures for the Iberian Peninsula. Atmosphere 2019, 10, 229. [Google Scholar] [CrossRef] [Green Version]
- Portero Serrano, J.; Acero Díaz, F.J.; García García, J.A. Analysis of Extreme Temperature Events over the Iberian Peninsula during the 21st Century Using Dynamic Climate Projections Chosen Using Max-Stable Processes. Atmosphere 2020, 11, 506. [Google Scholar] [CrossRef]
- Carvalho, D.; Cardoso Pereira, S.; Rocha, A. Future Surface Temperature Changes for the Iberian Peninsula According to EURO-CORDEX Climate Projections. Clim. Dyn. 2021, 56, 123–138. [Google Scholar] [CrossRef]
- IPCC Climate Change 2013—The Physical Science Basis: Working Group I Contribution to the Fifth Assessment Report of the Intergovernmental Panel on Climate Change. Available online: https://0-www-cambridge-org.brum.beds.ac.uk/core/books/climate-change-2013-the-physical-science-basis/BE9453E500DEF3640B383BADDC332C3E (accessed on 14 April 2021).
- Brown, C.; Meeks, R.; Hunu, K.; Yu, W. Hydroclimate Risk to Economic Growth in Sub-Saharan Africa. Clim. Chang. 2011, 106, 621–647. [Google Scholar] [CrossRef]
- Brown, C.; Meeks, R.; Ghile, Y.; Hunu, K. Is Water Security Necessary? An Empirical Analysis of the Effects of Climate Hazards on National-Level Economic Growth. Philos. Trans. R. Soc. Math. Phys. Eng. Sci. 2013, 371, 20120416. [Google Scholar] [CrossRef] [PubMed] [Green Version]
- Holtermann, L. Precipitation Anomalies, Economic Production, and the Role of “First-Nature” and “Second-Nature” Geographies: A Disaggregated Analysis in High-Income Countries. Glob. Environ. Chang. 2020, 65, 102167. [Google Scholar] [CrossRef]
- Lal, R.; Delgado, J.A.; Gulliford, J.; Nielsen, D.; Rice, C.W.; Pelt, R.S.V. Adapting Agriculture to Drought and Extreme Events. J. Soil Water Conserv. 2012, 67, 162A–166A. [Google Scholar] [CrossRef] [Green Version]
- Vogel, E.; Donat, M.G.; Alexander, L.V.; Meinshausen, M.; Ray, D.K.; Karoly, D.; Meinshausen, N.; Frieler, K. The Effects of Climate Extremes on Global Agricultural Yields. Environ. Res. Lett. 2019, 14, 054010. [Google Scholar] [CrossRef]
- Below, R.; Grover-Kopec, E.; Dilley, M. Documenting Drought-Related Disasters: A Global Reassessment. J. Environ. Dev. 2007, 16, 328–344. [Google Scholar] [CrossRef]
- Vogt, J.V.; Somma, F. Drought and Drought Mitigation in Europe; Advances in Natural and Technological Hazards Research; Kluwer Academic Publishers: Dordrecht, The Netherlands, 2000; ISBN 978-94-015-9472-1. [Google Scholar]
- Dracup, J.A.; Lee, K.S.; Paulson, E.G. On the Definition of Droughts. Water Resour. Res. 1980, 16, 297–302. [Google Scholar] [CrossRef]
- Wilhite, D.A.; Glantz, M.H. Understanding: The Drought Phenomenon: The Role of Definitions. Water Int. 1985, 10, 111–120. [Google Scholar] [CrossRef] [Green Version]
- Jonkman, S.N. Global Perspectives on Loss of Human Life Caused by Floods. Nat. Hazards 2005, 34, 151–175. [Google Scholar] [CrossRef]
- López-Moreno, J.I.; Vicente-Serrano, S.M.; Angulo-Martínez, M.; Beguería, S.; Kenawy, A. Trends in Daily Precipitation on the Northeastern Iberian Peninsula, 1955-2006: Trends in daily precipitation on the NE Iberian Peninsula. Int. J. Climatol. 2010, 30, 1026–1041. [Google Scholar] [CrossRef] [Green Version]
- Sánchez, E.; Gallardo, C.; Gaertner, M.A.; Arribas, A.; Castro, M. Future Climate Extreme Events in the Mediterranean Simulated by a Regional Climate Model: A First Approach. Glob. Planet. Chang. 2004, 44, 163–180. [Google Scholar] [CrossRef]
- Giorgi, F. Climate Change Hot-Spots. Geophys. Res. Lett. 2006, 33. [Google Scholar] [CrossRef]
- Diffenbaugh, N.S.; Pal, J.S.; Giorgi, F.; Gao, X. Heat Stress Intensification in the Mediterranean Climate Change Hotspot. Geophys. Res. Lett. 2007, 34. [Google Scholar] [CrossRef] [Green Version]
- Diffenbaugh, N.S.; Giorgi, F. Climate Change Hotspots in the CMIP5 Global Climate Model Ensemble. Clim. Chang. 2012, 114, 813–822. [Google Scholar] [CrossRef] [PubMed] [Green Version]
- Planton, S.; Lionello, P.; Artale, V.; Aznar, R.; Carrillo, A.; Colin, J.; Congedi, L.; Dubois, C.; Elizalde, A.; Gualdi, S.; et al. The Climate of the Mediterranean Region in Future Climate Projections. In The Climate of the Mediterranean Region; Lionello, P., Ed.; Elsevier: Oxford, UK, 2012; pp. 449–502. ISBN 978-0-12-416042-2. [Google Scholar]
- Hoegh-Guldberg, O.; Jacob, D.; Taylor, M.; Bindi, M.; Brown, S.; Camilloni, I.; Diedhiou, A.; Djalante, R.; Ebi, K.L.; Engelbrecht, F.; et al. Impacts of 1.5 °C of Global Warming on Natural and Human Systems; IPCC: Geneva, Switzerland, 2018; p. 183. [Google Scholar]
- Vicente-Serrano, S.M. Spatial and Temporal Analysis of Droughts in the Iberian Peninsula (1910–2000). Hydrol. Sci. J. 2006, 51, 83–97. [Google Scholar] [CrossRef]
- Russo, A.; Gouveia, C.M.; Páscoa, P.; DaCamara, C.C.; Sousa, P.M.; Trigo, R.M. Assessing the Role of Drought Events on Wildfires in the Iberian Peninsula. Agric. For. Meteorol. 2017, 237–238, 50–59. [Google Scholar] [CrossRef]
- Guha-Sapir, D.; Below, R.; Hoyois, P. EM-DAT: The CRED/OFDA International Disaster Database—Www.Emdat.Be. Brussels—Belgium: Université Catholique de Louvain. Available online: https://public.emdat.be/ (accessed on 14 April 2021).
- Santos, J.A.; Pinto, J.G.; Ulbrich, U. On the Development of Strong Ridge Episodes over the Eastern North Atlantic. Geophys. Res. Lett. 2009, 36. [Google Scholar] [CrossRef] [Green Version]
- Santos, J.A.; Andrade, C.; Corte-Real, J.; Leite, S. The Role of Large-Scale Eddies in the Occurrence of Winter Precipitation Deficits in Portugal. Int. J. Climatol. 2009, 29, 1493–1507. [Google Scholar] [CrossRef]
- Santos, J.A.; Woollings, T.; Pinto, J.G. Are the Winters 2010 and 2012 Archetypes Exhibiting Extreme Opposite Behavior of the North Atlantic Jet Stream? Mon. Weather Rev. 2013, 141, 3626–3640. [Google Scholar] [CrossRef] [Green Version]
- Woollings, T.; Pinto, J.G.; Santos, J.A. Dynamical Evolution of North Atlantic Ridges and Poleward Jet Stream Displacements. J. Atmos. Sci. 2011, 68, 954–963. [Google Scholar] [CrossRef]
- Lyon, B.; Barnston, A.G. ENSO and the Spatial Extent of Interannual Precipitation Extremes in Tropical Land Areas. J. Clim. 2005, 18, 5095–5109. [Google Scholar] [CrossRef]
- Lyon, B. The Strength of El Niño and the Spatial Extent of Tropical Drought. Geophys. Res. Lett. 2004, 31. [Google Scholar] [CrossRef] [Green Version]
- Andrade, C.; Belo-Pereira, M. Assessment of Droughts in the Iberian Peninsula Using TheWASP-Index. Atmos. Sci. Lett. 2015, 16, 208–218. [Google Scholar] [CrossRef]
- Croitoru, A.-E.; Toma, F.-M. Trends in Precipitation and Snow Cover in Central Part of Romanian Plain. Geogr. Tech. 2010, 9, 1–98. [Google Scholar]
- Zubair, L.; Ralapanawe, V.; Tennakoon, U.; Yahiya, Z.; Perera, R. Natural Disaster Risks in Sri Lanka: Mapping Hazards and Risk Hotspots. Nat. Disaster Hotspots Case Stud. 2006, 109, 28. Available online: http://www.water.columbia.edu/files/2011/11/Zubair2006NaturalDisaster.pdf (accessed on 12 December 2020).
- Lokuhetti, R.; Zubair, L.; Visvanathan, J.; Nijamdeen, A. Drought Monitoring for Sri Lanka: Spatial Extent and Temporal Evolution during the 2016–17 Drought. In Proceedings of the International Roundtable on the Impact of Extreme Natural Events: Science and Technology for Mitigation, Colombo, Sri Lanka, 13–15 December 2017. [Google Scholar]
- Adnan, S.; Ullah, K.; Shuanglin, L.; Gao, S.; Khan, A.H.; Mahmood, R. Comparison of Various Drought Indices to Monitor Drought Status in Pakistan. Clim. Dyn. 2018, 51, 1885–1899. [Google Scholar] [CrossRef]
- Carrão, H.; Naumann, G.; Barbosa, P. Global Projections of Drought Hazard in a Warming Climate: A Prime for Disaster Risk Management. Clim. Dyn. 2018, 50, 2137–2155. [Google Scholar] [CrossRef] [Green Version]
- Procházka, P.; Hönig, V.; Maitah, M.; Pljučarská, I.; Kleindienst, J. Evaluation of Water Scarcity in Selected Countries of the Middle East. Water 2018, 10, 1482. [Google Scholar] [CrossRef] [Green Version]
- Borgomeo, E.; Vadheim, B.; Woldeyes, F.B.; Alamirew, T.; Tamru, S.; Charles, K.J.; Kebede, S.; Walker, O. The Distributional and Multi-Sectoral Impacts of Rainfall Shocks: Evidence From Computable General Equilibrium Modelling for the Awash Basin, Ethiopia. Ecol. Econ. 2018, 146, 621–632. [Google Scholar] [CrossRef]
- Ayanlade, S.; Odekunle, T.; Orimoogunje, O.; Adeoye, N. Inter-Annual Climate Variability and Crop Yields Anomalies in Middle Belt of Nigeria. Appl. Sci. 2009, 3, 452–465. [Google Scholar]
- Cornes, R.C.; van der Schrier, G.; van den Besselaar, E.J.M.; Jones, P.D. An Ensemble Version of the E-OBS Temperature and Precipitation Data Sets. J. Geophys. Res. Atmos. 2018, 123, 9391–9409. [Google Scholar] [CrossRef] [Green Version]
- Moss, R.H.; Edmonds, J.A.; Hibbard, K.A.; Manning, M.R.; Rose, S.K.; van Vuuren, D.P.; Carter, T.R.; Emori, S.; Kainuma, M.; Kram, T.; et al. The next Generation of Scenarios for Climate Change Research and Assessment. Nature 2010, 463, 747–756. [Google Scholar] [CrossRef]
- van Vuuren, D.P.; Edmonds, J.; Kainuma, M.; Riahi, K.; Thomson, A.; Hibbard, K.; Hurtt, G.C.; Kram, T.; Krey, V.; Lamarque, J.-F.; et al. The Representative Concentration Pathways: An Overview. Clim. Chang. 2011, 109, 5. [Google Scholar] [CrossRef]
- Taylor, K.E.; Stouffer, R.J.; Meehl, G.A. An Overview of CMIP5 and the Experiment Design. Bull. Am. Meteorol. Soc. 2012, 93, 485–498. [Google Scholar] [CrossRef] [Green Version]
- Smith, S.J.; Wigley, T.M.L. Multi-Gas Forcing Stabilization with Minicam. Energy J. 2006, SI2006. [Google Scholar] [CrossRef]
- Clarke, L.; Edmonds, J.; Jacoby, H.; Pitcher, H.; Reilly, J.; Richels, R. Scenarios of Greenhouse Gas Emissions and Atmospheric Concentrations. US Department of Energy Publications; p. 166. Available online: https://core.ac.uk/download/pdf/17231294.pdf (accessed on 13 December 2020).
- Wise, M.; Calvin, K.; Thomson, A.; Clarke, L.; Bond-Lamberty, B.; Sands, R.; Smith, S.J.; Janetos, A.; Edmonds, J. Implications of Limiting CO2 Concentrations for Land Use and Energy. Science 2009, 324, 1183–1186. [Google Scholar] [CrossRef] [PubMed]
- Rao, S.; Riahi, K. The Role of Non-CO2 Greenhouse Gases in Climate Change Mitigation: Long-Term Scenarios for the 21st Century. Energy J. 2006, SI2006. [Google Scholar] [CrossRef]
- Riahi, K.; Grübler, A.; Nakicenovic, N. Scenarios of Long-Term Socio-Economic and Environmental Development under Climate Stabilization. Technol. Forecast. Soc. Chang. 2007, 74, 887–935. [Google Scholar] [CrossRef]
- Amengual, A.; Homar, V.; Romero, R.; Alonso, S.; Ramis, C. A Statistical Adjustment of Regional Climate Model Outputs to Local Scales: Application to Platja de Palma, Spain. J. Clim. 2012, 25, 939–957. [Google Scholar] [CrossRef] [Green Version]
- Spinoni, J.; Naumann, G.; Carrao, H.; Barbosa, P.; Vogt, J. World Drought Frequency, Duration, and Severity for 1951–2010. Int. J. Climatol. 2014, 34, 2792–2804. [Google Scholar] [CrossRef] [Green Version]
- Maccioni, P.; Kossida, M.; Brocca, L.; Moramarco, T. Assessment of the Drought Hazard in the Tiber River Basin in Central Italy and a Comparison of New and Commonly Used Meteorological Indicators. J. Hydrol. Eng. 2015, 20, 05014029. [Google Scholar] [CrossRef]
- Mann, H.B.; Whitney, D.R. On a Test of Whether One of Two Random Variables Is Stochastically Larger than the Other. Ann. Math. Stat. 1947, 18, 50–60. [Google Scholar] [CrossRef]
- Wilcoxon, F. Individual Comparisons by Ranking Methods. Biom. Bull. 1945, 1, 80–83. [Google Scholar] [CrossRef]
- Twardosz, R.; Kossowska-Cezak, U. Large-Area Thermal Anomalies in Europe (1951–2018). Temporal and Spatial Patterns. Atmos. Res. 2021, 251, 105434. [Google Scholar] [CrossRef]
- Vicente-Serrano, S.; Trigo, R.; López-Moreno, J.; Liberato, M.; Lorenzo-Lacruz, J.; Beguería, S.; Morán-Tejeda, E.; El Kenawy, A. Extreme Winter Precipitation in the Iberian Peninsula in 2010: Anomalies, Driving Mechanisms and Future Projections. Clim. Res. 2011, 46, 51–65. [Google Scholar] [CrossRef] [Green Version]
- Ramos, A.M.; Trigo, R.M.; Liberato, M.L.R. A Ranking of High-Resolution Daily Precipitation Extreme Events for the Iberian Peninsula: Ranking of the Iberian Peninsula Daily Precipitation. Atmos. Sci. Lett. 2014. [Google Scholar] [CrossRef]
- Spinoni, J.; Barbosa, P.; De Jager, A.; McCormick, N.; Naumann, G.; Vogt, J.V.; Magni, D.; Masante, D.; Mazzeschi, M. A New Global Database of Meteorological Drought Events from 1951 to 2016. J. Hydrol. Reg. Stud. 2019, 22, 100593. [Google Scholar] [CrossRef] [PubMed]
- Andrade, C.; Leite, S.M.; Santos, J.A. Temperature Extremes in Europe: Overview of Their Driving Atmospheric Patterns. Nat. Hazards Earth Syst. Sci. 2012, 12, 1671–1691. [Google Scholar] [CrossRef] [Green Version]
- Andrade, C.; Fraga, H.; Santos, J.A. Climate Change Multi-Model Projections for Temperature Extremes in Portugal. Atmos. Sci. Lett. 2014, 15, 149–156. [Google Scholar] [CrossRef]
- Merino, A.; Fernández-Vaquero, M.; López, L.; Fernández-González, S.; Hermida, L.; Sánchez, J.L.; García-Ortega, E.; Gascón, E. Large-Scale Patterns of Daily Precipitation Extremes on the Iberian Peninsula: Precipitation Extremes on the Iberian Peninsula. Int. J. Climatol. 2016, 36, 3873–3891. [Google Scholar] [CrossRef]
- Spinoni, J.; Vogt, J.V.; Naumann, G.; Barbosa, P.; Dosio, A. Will Drought Events Become More Frequent and Severe in Europe? Int. J. Climatol. 2018, 38, 1718–1736. [Google Scholar] [CrossRef] [Green Version]
- Andrade, C.; Contente, J. Climate Change Projections for the Worldwide Bioclimatic Classification System in the Iberian Peninsula until 2070. Int. J. Climatol. 2020, 1–24. [Google Scholar] [CrossRef]
- Andrade, C.; Contente, J. Köppen’s Climate Classification Projections for the Iberian Peninsula. Clim. Res. 2020, 81, 71–89. [Google Scholar] [CrossRef]
- Kamali, B.; Houshmand Kouchi, D.; Yang, H.; Mikayilov, F. Multilevel Drought Hazard Assessment under Climate Change Scenarios in Semi-Arid Regions—A Case Study of the Karkheh River Basin in Iran. Water 2017, 9, 241. [Google Scholar] [CrossRef]
- Santos, J.A.; Belo-Pereira, M.; Fraga, H.; Pinto, J.G. Understanding Climate Change Projections for Precipitation over Western Europe with a Weather Typing Approach. J. Geophys. Res. Atmos. 2016, 121, 1170–1189. [Google Scholar] [CrossRef] [Green Version]
- Santos, M.; Fragoso, M.; Santos, J.A. Regionalization and Susceptibility Assessment to Daily Precipitation Extremes in Mainland Portugal. Appl. Geogr. 2017, 86, 128–138. [Google Scholar] [CrossRef]
- Santos, M.; Fragoso, M.; Santos, J.A. Damaging Flood Severity Assessment in Northern Portugal over More than 150 Years (1865–2016). Nat. Hazards 2018, 91, 983–1002. [Google Scholar] [CrossRef]
- Santos, M.; Fonseca, A.; Fragoso, M.; Santos, J.A. Recent and Future Changes of Precipitation Extremes in Mainland Portugal. Theor. Appl. Climatol. 2019, 137, 1305–1319. [Google Scholar] [CrossRef]
- Carrão, H.; Naumann, G.; Barbosa, P. Climate Change Impacts on Droughts; 2016, EUR 28332 EN. Publications Office of the European Union; 2016. JRC104402. Available online: https://publications.jrc.ec.europa.eu/repository/handle/JRC104402 (accessed on 26 May 2021).
- Yang, C.; Fraga, H.; van Ieperen, W.; Santos, J.A. Assessing the Impacts of Recent-Past Climatic Constraints on Potential Wheat Yield and Adaptation Options under Mediterranean Climate in Southern Portugal. Agric. Syst. 2020, 182, 102844. [Google Scholar] [CrossRef]
- Molitor, D.; Fraga, H.; Junk, J. UniPhen—A Unified High Resolution Model Approach to Simulate the Phenological Development of a Broad Range of Grape Cultivars as Well as a Potential New Bioclimatic Indicator. Agric. For. Meteorol. 2020, 291, 108024. [Google Scholar] [CrossRef]
- Fraga, H.; Pinto, J.G.; Santos, J.A. Olive Tree Irrigation as a Climate Change Adaptation Measure in Alentejo, Portugal. Agric. Water Manag. 2020, 237, 106193. [Google Scholar] [CrossRef]
Figure 1.
Iberian Peninsula (IP) study area, with the respective Nomenclature of Territorial Units for Statistics (NUTS) NUTS 2 boundaries.
Figure 1.
Iberian Peninsula (IP) study area, with the respective Nomenclature of Territorial Units for Statistics (NUTS) NUTS 2 boundaries.

Figure 2.
Schematic representation of this study methodology.

Figure 3.
Area-mean values between 1961–2070 for (a) 12m-WASP, (b) 6m-WASP and (c) 3m-WASP-Indexes in which intermediate-to-severe dry (red) and wet (blue) events are identified (months and year).
Figure 3.
Area-mean values between 1961–2070 for (a) 12m-WASP, (b) 6m-WASP and (c) 3m-WASP-Indexes in which intermediate-to-severe dry (red) and wet (blue) events are identified (months and year).

Figure 4.
Duration in months of 12m-WASP intermediate-to-severe wet events in IP for the periods (a) 1961–1990; (b) 1981–2010; (c,d) 2021–2050; (e,f) 2041–2070 under RCP4.5 (left) and RCP8.5 (right) (Note: NUTS 2 in grey contours).
Figure 4.
Duration in months of 12m-WASP intermediate-to-severe wet events in IP for the periods (a) 1961–1990; (b) 1981–2010; (c,d) 2021–2050; (e,f) 2041–2070 under RCP4.5 (left) and RCP8.5 (right) (Note: NUTS 2 in grey contours).

Figure 5.
Duration in months of 12m-WASP intermediate-to-severe dry events in IP for the periods (a) 1961–1990; (b) 1981–2010; (c,d) 2021–2050; (e,f) 2041–2070 under RCP4.5 (left) and RCP8.5 (right) (Note: NUTS 2 in grey contours).
Figure 5.
Duration in months of 12m-WASP intermediate-to-severe dry events in IP for the periods (a) 1961–1990; (b) 1981–2010; (c,d) 2021–2050; (e,f) 2041–2070 under RCP4.5 (left) and RCP8.5 (right) (Note: NUTS 2 in grey contours).

Figure 6.
Statistically significant differences (MWW at a 5% significance level) between 2041–2070 and 1961−1990 for the duration, in months (mo) of 12m-WASP intermediate-to-severe wet events in IP under (a) RCP4.5 and (b) RCP8.5; and for the intermediate-to-severe dry events under (c) RCP4.5 and (d) RCP8.5. (Note: NUTS 2 in grey contours; and ∆(2041–2070–1961–1990)).

Figure 7.
Intensity of 12m-WASP intermediate-to-severe wet events in IP for the periods (a) 1961–1990 and, (b) 1981–2010, (c,d) 2021–2050, (e,f) 2041–2070 under RCP4.5 (left) and RCP8.5 (right) (Note: NUTS 2 in grey contours).
Figure 7.
Intensity of 12m-WASP intermediate-to-severe wet events in IP for the periods (a) 1961–1990 and, (b) 1981–2010, (c,d) 2021–2050, (e,f) 2041–2070 under RCP4.5 (left) and RCP8.5 (right) (Note: NUTS 2 in grey contours).

Figure 8.
Intensity of 12m-WASP intermediate-to-severe dry events in IP for the periods (a) 1961–1990 and, (b) 1981–2010, (c,d) 2021–2050, (e,f) 2041–2070 under RCP4.5 (left) and RCP8.5 (right) (Note: NUTS 2 in grey contours).
Figure 8.
Intensity of 12m-WASP intermediate-to-severe dry events in IP for the periods (a) 1961–1990 and, (b) 1981–2010, (c,d) 2021–2050, (e,f) 2041–2070 under RCP4.5 (left) and RCP8.5 (right) (Note: NUTS 2 in grey contours).

Figure 9.
Probability (in %) of 12m-WASP intermediate-to-severe wet events in IP for the periods (a) 1961–1990, and (b) 1981–2010, (c,d) 2021–2050, (e,f) 2041–2070 under RCP4.5 (left) and RCP8.5 (right) (Note: NUTS 2 in grey contours).
Figure 9.
Probability (in %) of 12m-WASP intermediate-to-severe wet events in IP for the periods (a) 1961–1990, and (b) 1981–2010, (c,d) 2021–2050, (e,f) 2041–2070 under RCP4.5 (left) and RCP8.5 (right) (Note: NUTS 2 in grey contours).

Figure 10.
Probability (in %) of 12m-WASP intermediate-to-severe dry events in IP for the periods (a) 1961–1990, and (b) 1981–2010, (c,d) 2021–2050, (e,f) 2041–2070 under RCP4.5 (left) and RCP8.5 (right) (Note: NUTS 2 in grey contours).
Figure 10.
Probability (in %) of 12m-WASP intermediate-to-severe dry events in IP for the periods (a) 1961–1990, and (b) 1981–2010, (c,d) 2021–2050, (e,f) 2041–2070 under RCP4.5 (left) and RCP8.5 (right) (Note: NUTS 2 in grey contours).

Figure 11.
Statistically significant differences (MWW at a 5% significance level) between 2041–2070 and 1961–1990 for the frequency, in %, for the 12m-WASP intermediate-to-severe wet events in IP under (a) RCP4.5 and (b) RCP8.5; and for the intermediate-to-severe dry events under (c) RCP4.5 and (d) RCP8.5 (Note: NUTS 2 in grey contours; and ∆(2041–2070–1961–1990)).


Table 1.
Regional Climate Models (RCMs) and their respective driving models and contributors.
| RCM | Driving Model | Contributor |
|---|---|---|
| ALADIN53 | CNRM-CM5 | Météo France, CNRM |
| HIRHAM5 | ICHEC-EC-EARTH | Danish Meteorological Institute, DMI |
| WRF331F | IPSL-CM5A-MR | Institute Pierre-Simon Laplace, IPSL-INERIS |
| RACMO22E | ICHEC-EC-EARTH | Royal Netherlands Meteorological Institute, KNMI |
| REMO2009 | MPI-ESM-LR | Max Planck Institute for Meteorology, MPI-CSC |
| CCLM4-8-17 | ICHEC-EC-EARTH | Climate Limited-Area Modelling Community, CLMcom |
| WASP Values | Meaning |
|---|---|
| WASP ≤ −2 | Severe dry |
| −2 < WASP ≤ −1.5 | Intermediate dry |
| −1.5 < WASP ≤ −1 | Moderate dry |
| −1 < WASP < 1 | Near normal |
| 1 ≤ WASP < 1.5 | Moderate wet |
| 1.5 ≤ WASP < 2 | Intermediate wet |
| WASP ≥ 2 | Severe wet |
Table 3.
Number of intermediate-to-severe wet and dry events for the past periods 1961−1990, 1981−2010, and for the future periods 2021−2050 and 2041−2070 under RCP4.5 and RCP8.5 1.
Table 3.
Number of intermediate-to-severe wet and dry events for the past periods 1961−1990, 1981−2010, and for the future periods 2021−2050 and 2041−2070 under RCP4.5 and RCP8.5 1.
| Wet Events | 1961−1990 | 1981−2010 | 2021−2050 | 2041−2070 | |||
|---|---|---|---|---|---|---|---|
| RCP4.5 | RCP8.5 | RCP4.5 | RCP8.5 | ||||
| 12m-WASP | IW | 2 | 0 | 2 | 0 | 2 | 0 |
| SW | 1 | 0 | 0 | 0 | 0 | 0 | |
| 6m-WASP | IW | 9 | 4 | 3 | 3 | 6 | 2 |
| SW | 0 | 0 | 4 | 0 | 4 | 0 | |
| 3m-WASP | IW | 7 | 6 | 4 | 5 | 3 | 10 |
| SW | 3 | 4 | 6 | 1 | 6 | 4 | |
| Dry events | |||||||
| 12m-WASP | ID | 1 | 10 | 8 | 18 | 14 | 23 |
| SD | 0 | 0 | 10 | 4 | 8 | 2 | |
| 6m-WASP | ID | 0 | 13 | 12 | 8 | 14 | 11 |
| SD | 0 | 1 | 4 | 4 | 3 | 0 | |
| 3m-WASP | ID | 3 | 13 | 7 | 11 | 9 | 9 |
| SD | 0 | 0 | 2 | 1 | 3 | 0 | |
1 In the table ID = intermediately dry; IW = intermediately wet; SD = severely dry; SW = severely wet.
Publisher’s Note: MDPI stays neutral with regard to jurisdictional claims in published maps and institutional affiliations. |
© 2021 by the authors. Licensee MDPI, Basel, Switzerland. This article is an open access article distributed under the terms and conditions of the Creative Commons Attribution (CC BY) license (https://creativecommons.org/licenses/by/4.0/).
Share and Cite
MDPI and ACS Style
Andrade, C.; Contente, J.; Santos, J.A. Climate Change Projections of Dry and Wet Events in Iberia Based on the WASP-Index. Climate 2021, 9, 94. https://0-doi-org.brum.beds.ac.uk/10.3390/cli9060094
AMA Style
Andrade C, Contente J, Santos JA. Climate Change Projections of Dry and Wet Events in Iberia Based on the WASP-Index. Climate. 2021; 9(6):94. https://0-doi-org.brum.beds.ac.uk/10.3390/cli9060094
Chicago/Turabian StyleAndrade, Cristina, Joana Contente, and João A. Santos. 2021. "Climate Change Projections of Dry and Wet Events in Iberia Based on the WASP-Index" Climate 9, no. 6: 94. https://0-doi-org.brum.beds.ac.uk/10.3390/cli9060094
Note that from the first issue of 2016, this journal uses article numbers instead of page numbers. See further details here.