Article

Dynamic Characterization of a High-Altitude Balloon during a Flight Campaign for the Detection of ISM Radio Background in the Stratosphere

by
Matteo Gemignani
and
Salvo Marcuccio
*,†
Aerospace Division, Department of Civil and Industrial Engineering, University of Pisa, 56122 Pisa, Italy
*
Author to whom correspondence should be addressed.
These authors contributed equally to this work.
Submission received: 30 April 2020 / Revised: 6 December 2020 / Accepted: 13 January 2021 / Published: 17 January 2021

Abstract

:
Sounding balloons, available at very low cost from commercial vendors and operable with minimal training, have an excellent potential as testing platforms in the near-space environment. The work reported here was motivated by the need to perform an experimental assessment of the radio frequency (RF) background present in the ISM (Industrial, Scientific and Medical) bands, namely 868 MHz (Ultra High Frequency—UHF) and 2.4 GHz (S-Band), simulating the operational environment of a Low Earth Orbit (LEO) constellation forInternet of Things (IoT) telecommunications. To this end, five balloons were flown with a dedicated RF payload. Along with the radio measurements, the flights provided a convenient opportunity to collect data on the dynamic behavior of the payload gondola. We report on the system design and the operational phase of the mission, and discuss the data collected throughout the successful flight campaign. As a result, a preliminary understanding of the gondola dynamics has been gained, including both linear accelerations and attitude oscillations. It is also concluded that the two ISM bands considered are actually suitable for IoT ground-to-LEO links.

1. Introduction

Industrial, Scientific and Medical (ISM) bands are those portions of the electromagnetic spectrum that are made available for non-telecommunication applications. Typical uses of the ISM bands are for domestic appliances, such as microwave ovens and door openers, and for the omnipresent Wi-Fi and Bluetooth networks. As per Reference [1], “… Radiocommunication services operating within these bands must accept harmful interference, which may be caused by (ISM) applications…”. Due to their unlicensed status, the popularity of ISM bands is growing very fast in the telecommunication sector, in spite of the possible interference issues. The use of ISM bands is especially appealing for Internet of Things (IoT) applications [2], where interference issues are limited by the low power, short burst nature of messages and by the use of spread-spectrum techniques. Several terrestrial operators plan to deploy IoT networks over a geographical area using Low-Power Wide Area Network (LP-WAN) protocols, such as LoRa [3] and Sigfox [4], that use the ISM sub-GHz frequency bands (868 MHz in Europe and 900 MHz in the USA). During its early phase, Google’s Project Loon made use of 2.4 and 5.8 GHz ISM bands to link stratospheric balloons to each other and with the ground [5].
Recently, several initiatives have been started aiming at defining new IoT protocols suitable for the satellite environment, and several attempts are underway to adapt existing terrestrial technologies to the satellite environment. The possibility to use portions of the terrestrial ISM bands for telecommunication between the spacecraft and ground terminals is a potential disruptive factor for the development of satellite-based IoT networks. However, as a result of the growing popularity, the number of devices operating in these frequency bands is rapidly increasing, potentially leading to further congestion of this portion of the spectrum to the extent that communication performance could be seriously degraded.
Several studies exist on the ISM interference in a terrestrial setting, e.g., References [6,7,8,9]. However, in order to design and operate satellite communications in the ISM bands, one needs to have a full understanding of the background electromagnetic noise at orbital altitude due to terrestrial ISM emissions. The work reported here was carried out in the frame of a recent study by the Italian company MBI for Eutelsat, aimed at gathering experimental data to investigate orbital altitude ISM noise, as part of an ongoing study related to the feasibility of a Low Earth Orbit (LEO) constellation for IoT applications [10]. The approach chosen was to take measurements at stratospheric altitudes of about 25 to 30 km using high-altitude balloons (HAB), from which one can estimate the background noise level at LEO by extrapolation.
The most common and most cost-effective implementation of HABs is the sounding balloon, also known as weather balloon. Such vehicles are commonly used to collect meteorological information—they are actually the primary source of data for weather forecast worldwide [11]. With about 900 launches worldwide twice a day, the sounding balloon technology is mature, well-understood and reliable. Sounding balloons, made of natural latex or neoprene film, are inexpensive and easy to procure and setup, and can be operated by a small crew with minimal training. The relevant authorizations from air traffic authorities can be obtained easily and quickly in most countries worldwide. When properly instrumented with state-of-the-art onboard electronics, HABs can effectively act as miniaturized high-altitude platforms (HAPs), being to the larger HAPs what Cubesats are to larger satellites. In addition to their well-established role in scientific research, they may prove very valuable as a test bench for HAPs technologies and, to some extent, for satellite technologies as well.
Thanks to the ease of operation and cost effectiveness of sounding balloons, it was possible to perform a total of 5 flights up to the altitude of 32 km to collect radio frequency (RF) power measurements in the ISM bands. At such altitude, the signal was collected from sources scattered over a quite large portion of terrain, thus mimicking what would be experienced by a LEO satellite. Collected RF power levels were measured in the following two bands:
  • S band (2.4 GHz ISM band): 2400–2483 MHz (83 MHz bandwidth).
  • Ultra High Frequency (UHF) band (868 MHz and 900 MHz ISM bands): 862–922 MHz (60 MHz bandwidth).
In the following, the flight campaign comprising the five flights will be referred to as the ISM-HAB project. All flights used identical carrier hardware and the same payload, with the first flights dedicated to debugging and fine-tuning the system and later flights performing measurements with an ample degree of redundancy. Along with the RF noise measurements, the project offered an excellent opportunity to perform an accurate characterization of the balloon dynamic behavior, particularly regarding the attitude oscillations of the payload gondola. While studies exist on the motion of payload gondolas of large, zero-pressure balloons capable of lifting several tons (e.g., References [12,13,14]), the oscillatory motion of sounding balloon HABs gondolas has received much less attention. Knowledge of such motion is especially important in view of the possible future use of such systems as low-cost, near-space carriers for spacecraft hardware testing and, in general, for scientific instrumentation. With this in mind, it was decided to integrate the ISM-HAB payload with an Inertial Measurement Unit (IMU) to record the attitude motion of the payload platform during the various phases of the mission and the different flight regimes encountered by the system. To this end, a dedicated secondary payload was designed, built and integrated, including a 3-axis miniaturized inertial sensor and the associated data handling and storage system.
This paper provides an overview of the architecture of the ISM-HAB experimental system (Section 2) and of the balloon flight operations (Section 3). Section 4 reports on the findings of the missions: a brief account of the RF measurements is given in Section 4.2, with the remainder of Section 4 dedicated to the gondola dynamics.

2. Experimental Setup and Mission Architecture

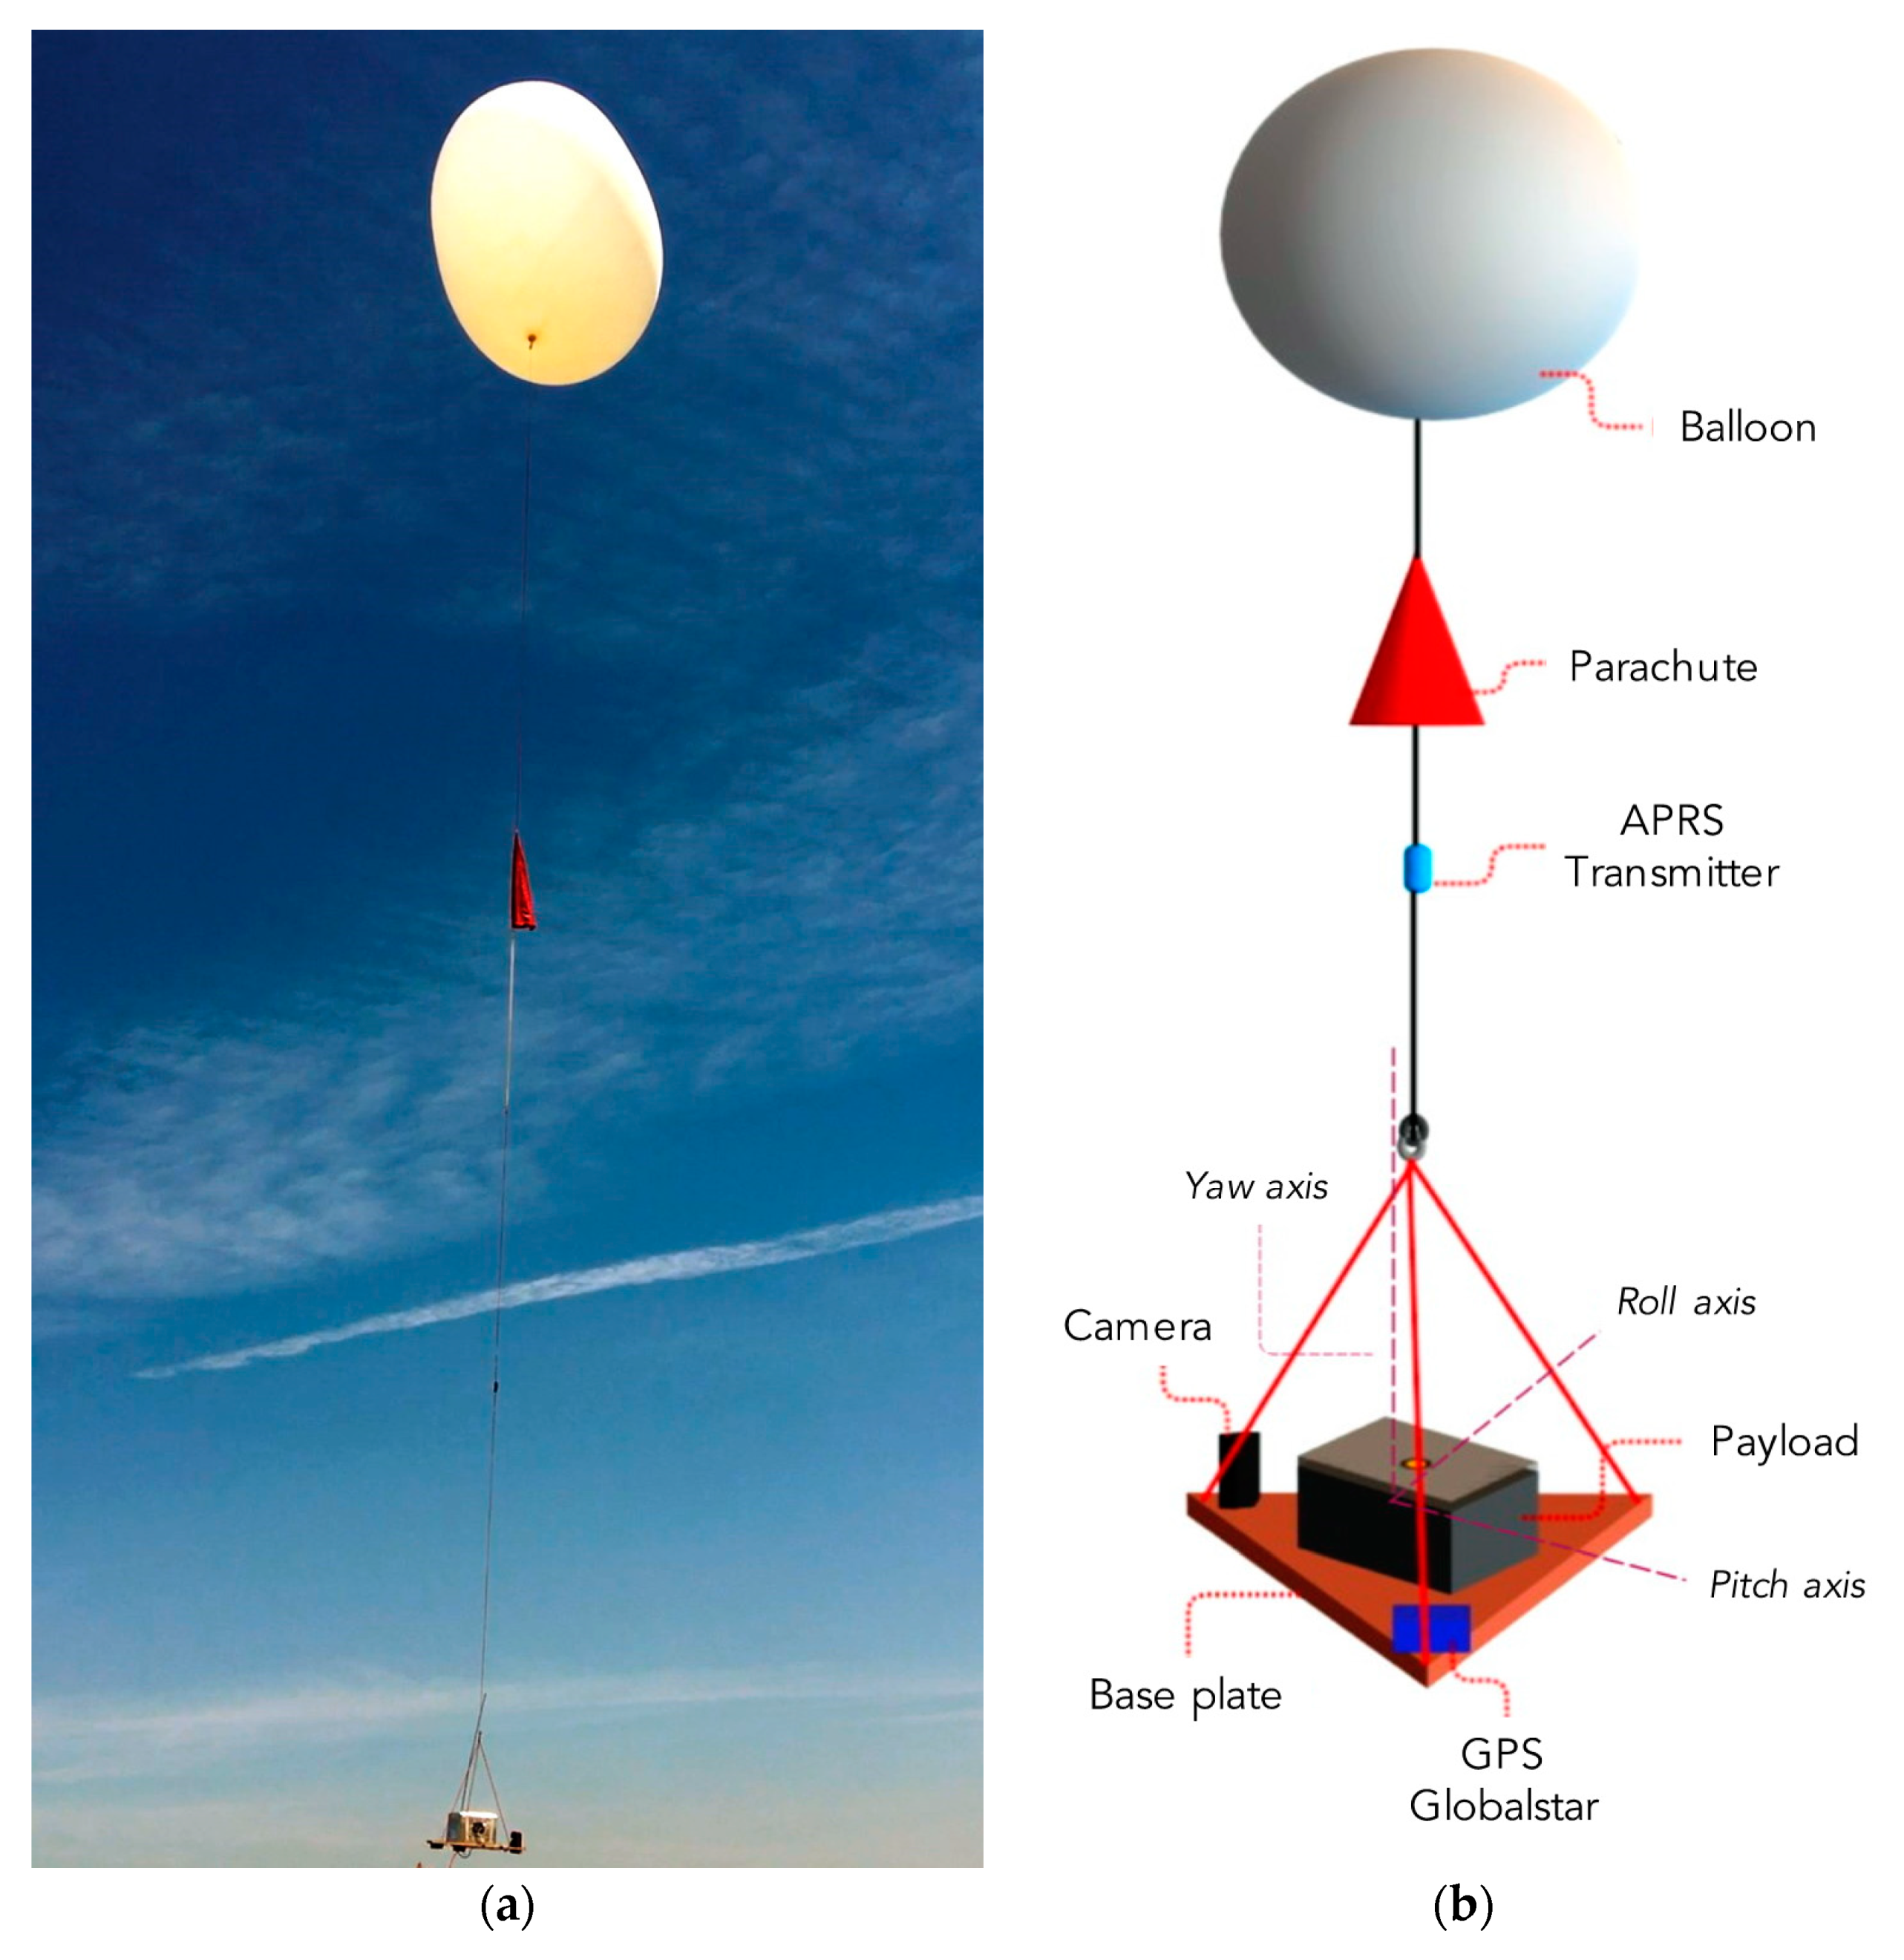
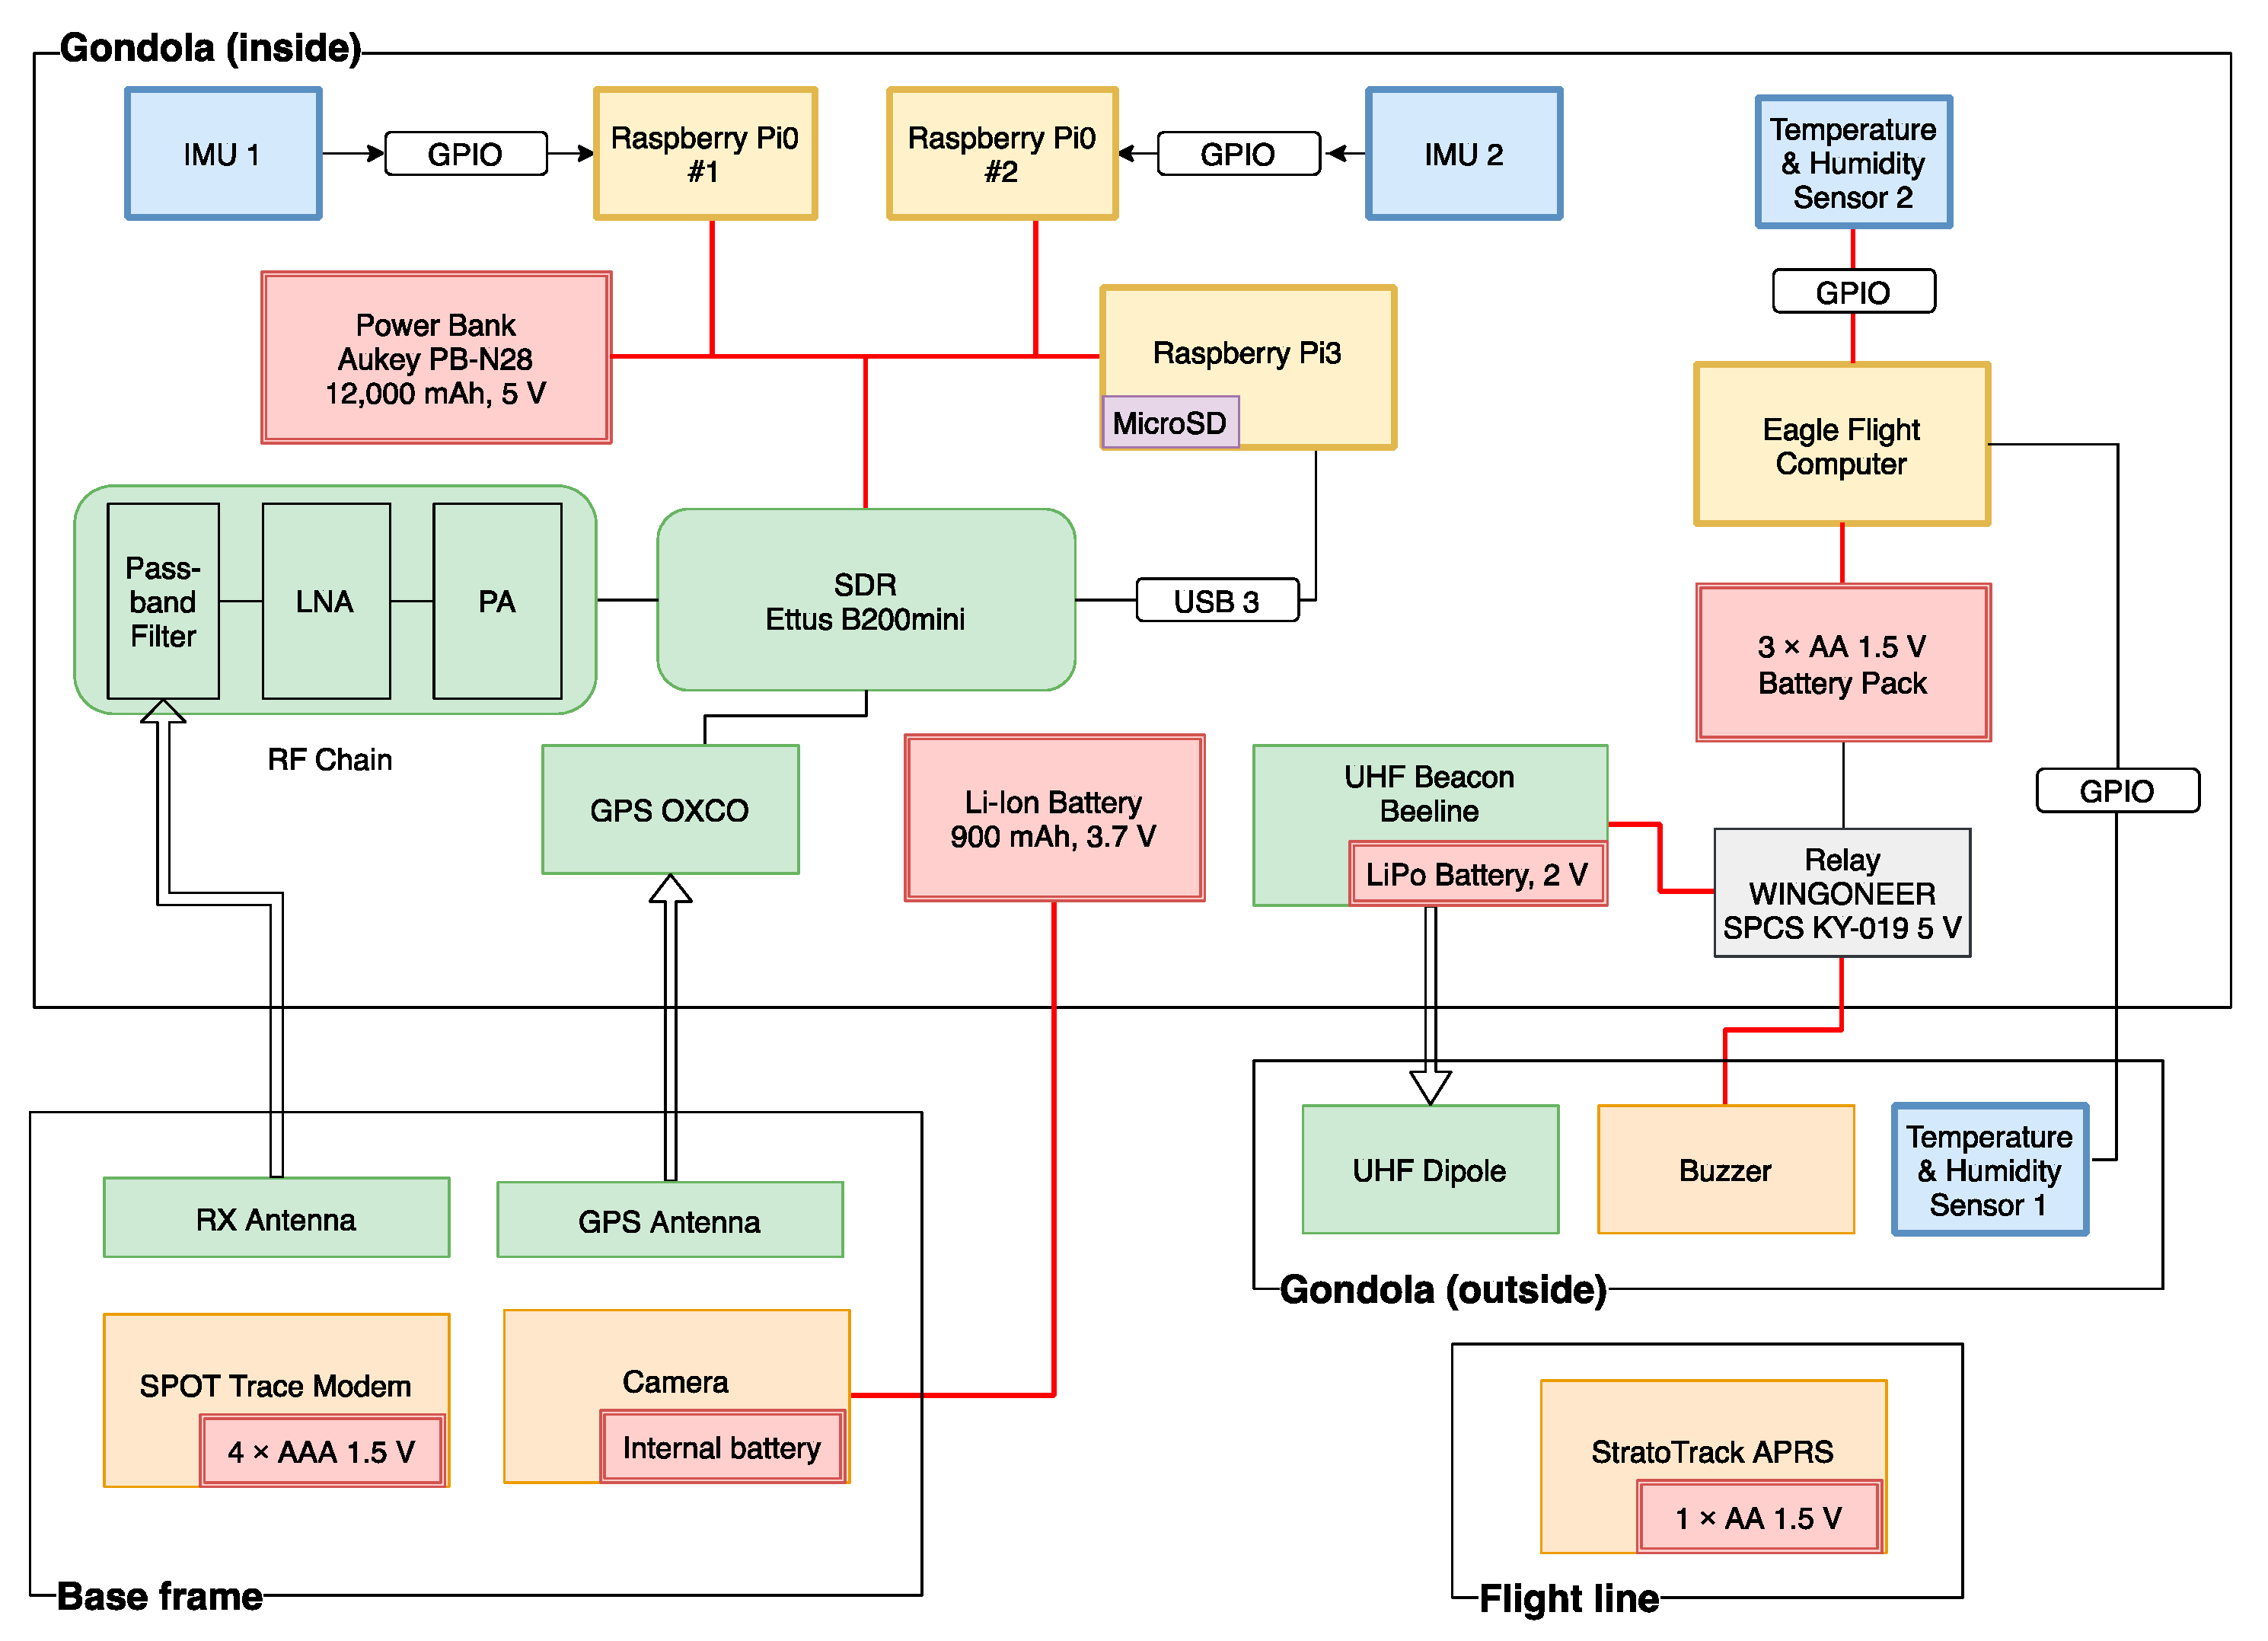
2.1. The ISM-HAB Platform

The core of the experimental vehicle is a commercial latex 1200 g HAB filled with industrial-grade helium. The balloon is released from the ground and climbs up to the stratosphere, generally attaining a height between 18 and 40 km. The amount of helium is calculated in order to have a pre-determined amount of lift at ground, so to carry the balloon up to the desired altitude at a speed of about 3 to 5 m/s.
The balloon lifts a group of objects to the stratosphere, including the scientific instrumentation, a small parachute and the relative suspension lines. The objects attached to the balloon are often referred to as the “payload train” (Figure 1). In the configuration chosen for ISM-HAB, the train includes a 1.5 m diameter parachute, a radar reflector and the custom payloads designed to perform the ISM measurements and the characterization of the gondola mechanical oscillation. The payload package also includes tracking devices, sensors and cameras.
As it ascends through the atmosphere, the balloon expands up to a certain maximum size as a consequence of the decrease in external pressure. Upon attaining a certain maximum altitude, the balloon bursts because of structural failure of the latex membrane under the internal pressure. Figure 2 shows the moment of bursting as captured by the onboard camera of one of the ISM-HAB flights. After bursting, the payload train starts free-falling until the parachute is fully opened and the descent speed decreases down to the limit (typically 4 to 5 m/s) imposed by the size of the parachute and by the attached mass.
In all of the five flights performed, the payload included the following main systems:
  • The tracking payload, used to track the HAB and to collect data from the on-board sensors.
  • The RF payload, used to perform the measurement of the aggregated RF power received over the bands of interest.
  • The dynamics payload, including the IMU and the associated data handling and storage systems.
Some components of the payloads are attached directly to the support base, consisting of a triangular wooden frame, namely the SPOT Globalstar modem, the cameras, the external sensor of the on-board computer and the RX antenna of the RF payload (Figure 3b). All other components are installed within a Styrofoam box (Figure 3a), the only exception being the Automatic Packet Reporting System (APRS) transmitter that is attached to the cord connecting the parachute to the box. APRS is a standard protocol mostly used by radio amateur operators to broadcast Global Navigation Satellite Sytem (GNSS)-based location data and other environmental information. Such data is essential to help track the balloon in near real-time and recover the payload after landing.
The active components are powered by means of standard power banks (Aukey PB-N28, mainly used to power the RF payload, and Li-Ion 3.7 V used to extend the lifetime of the internal battery of the camera) and battery packs with AA batteries. This architecture is able to power all the components for at least 5 h, a duration much longer than the average duration of a mission. The overall architecture of the ISM-HAB system is schematically shown in Figure 4. The four blocks depicted correspond to the four locations of hardware in the ISM-HAB setup: inside the gondola Styrofoam box, on the external surface of the gondola box, on the base frame below the gondola and along the flight line.

2.2. Tracking Payload

The tracking payload is composed of several sub-systems, listed below. Most of them act in a redundant way to maximize the possibility to recover the payload:
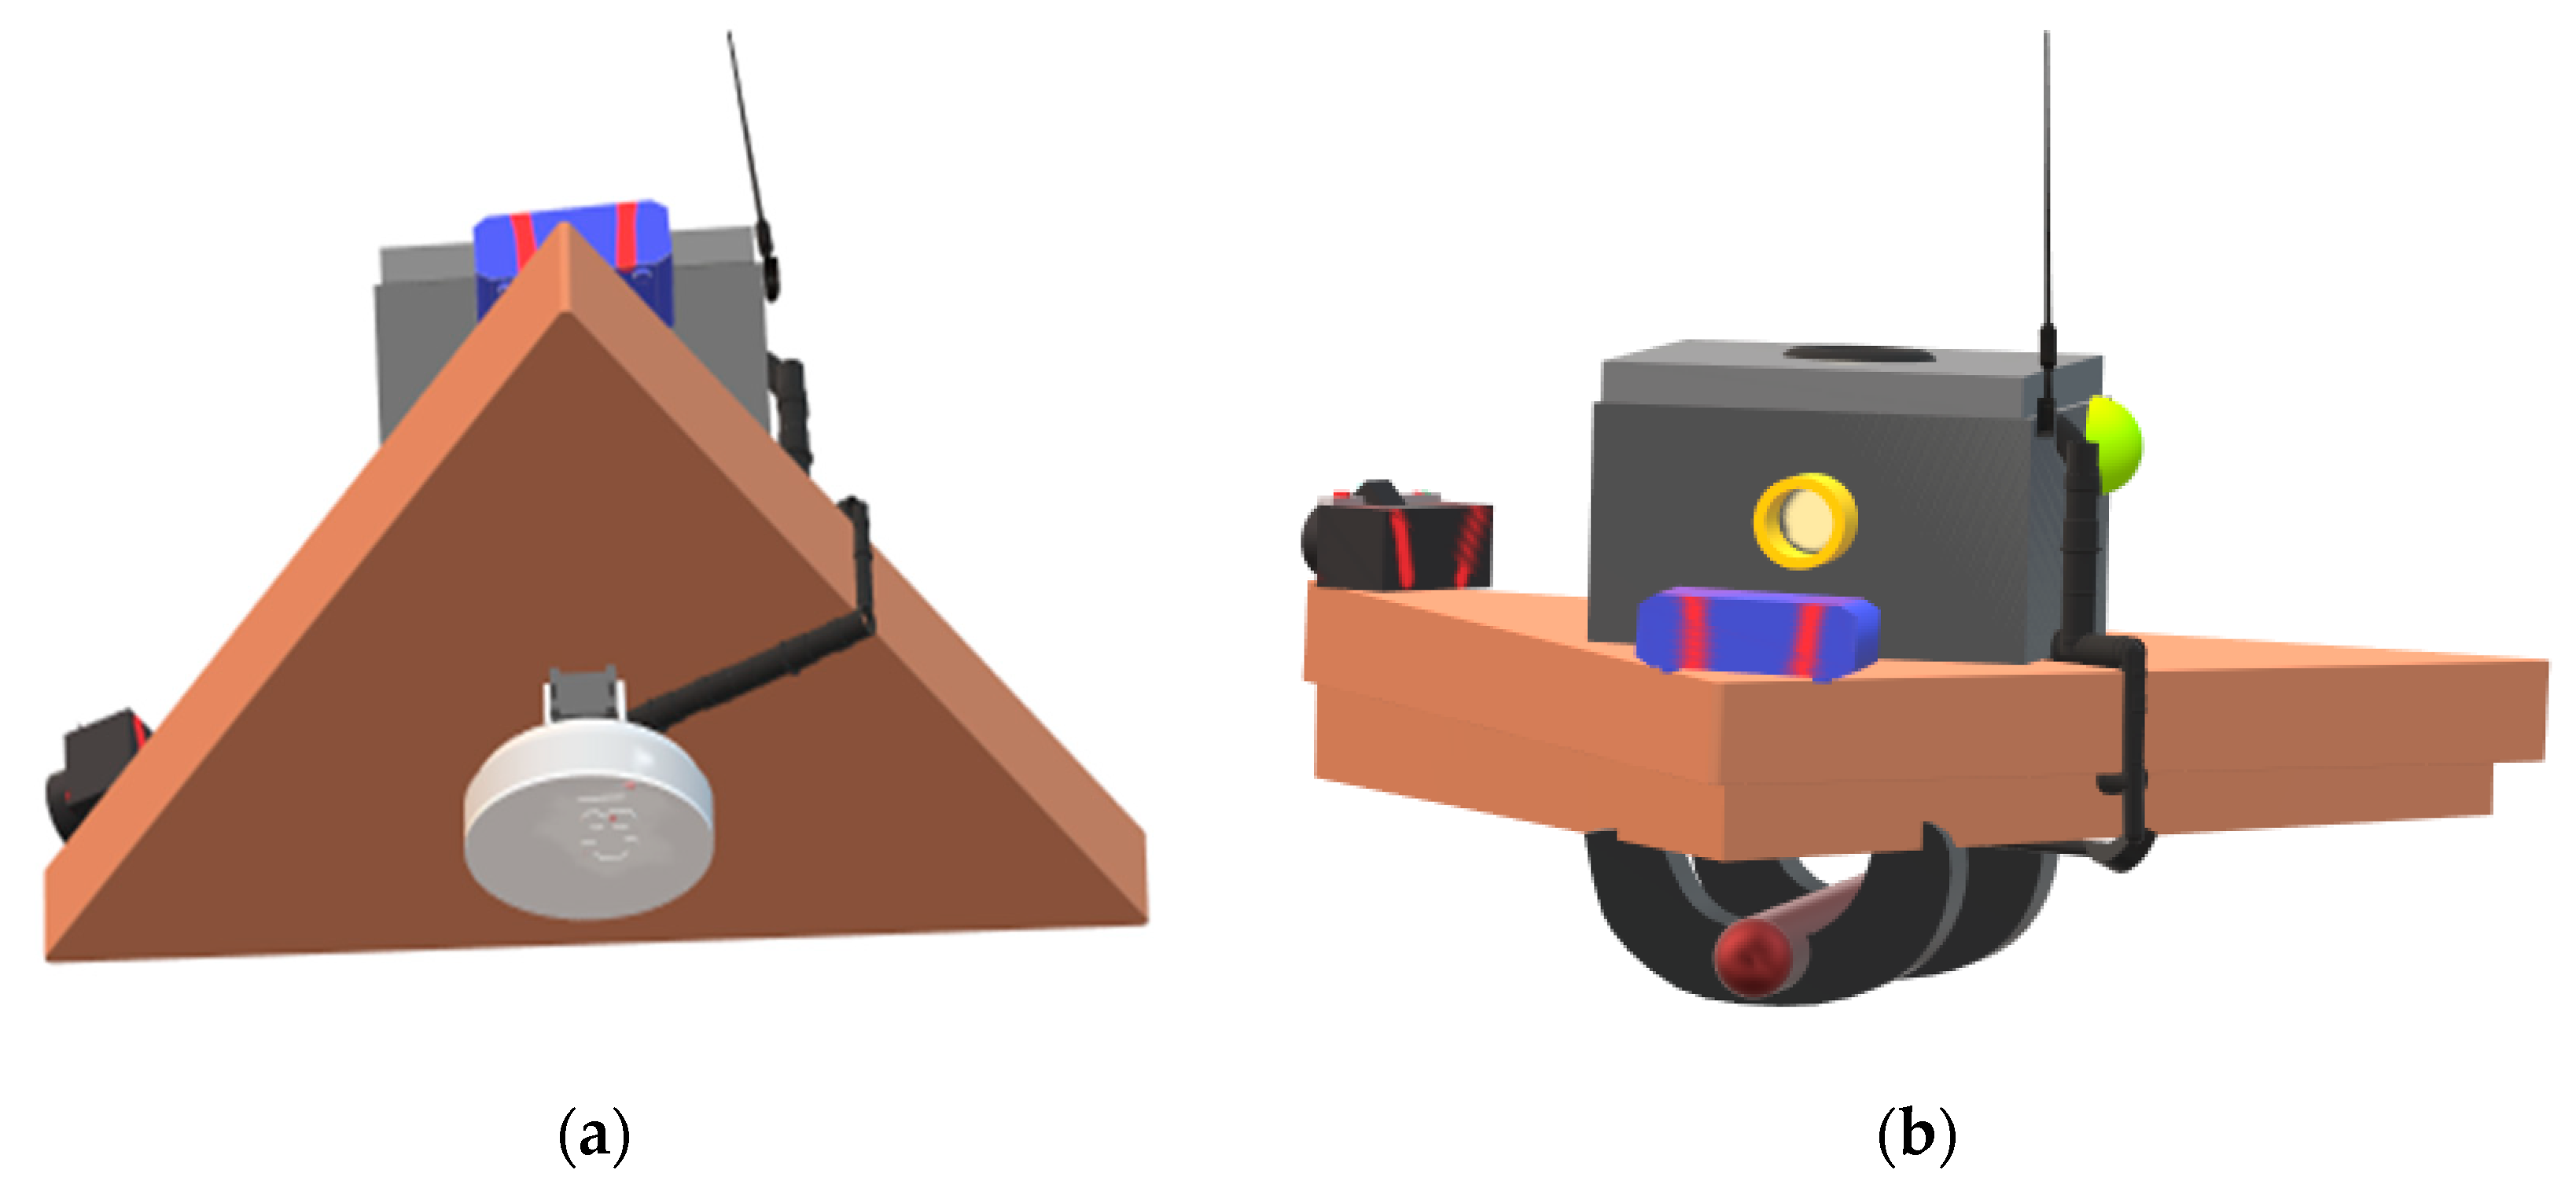
  • The APRS transmitter (StratoTrack model by StratoGear [15]) transmits, every few minutes (three available TX periods of 1.5 to 15 min), the position of the HAB collected by the GPS modules embedded in the module, as well as a few additional pieces of information such as the external temperature, GPS lock quality and voltage of its battery pack (Figure 5a). Data are transmitted using the dedicated Very High Frequency (VHF) channel (144.80 MHz) and collected by one or more of the many existing amateur-operated APRS receiving stations and can be accessed using the APRS public website (https://aprs.fi).
  • The SPOT Trace Modem [16] transmits the position of the balloon using the Globalstar LEO constellation every few minutes (Figure 5b). The service is very reliable, with the modem capable to successfully transmit the position even if the payload lands deep in the woodlands (as happened 4 times out of 5 in this project).
  • The on-board computer, namely the Eagle Flight model by High-Altitude Science (HAS) [17], that collects data with a periodicity of 6 s from its embedded GPS receivers as well as from its own two temperature and pressure sensors (Figure 5c). One sensor is installed outdoors in order to record the external temperature and pressure while the second one is located within the Styrofoam box.
  • The UHF Beacon, namely a BeeLine Transmitter, that is used to transmit a beacon on 433 MHz used to locate the landed HAB using a UHF Fox Hunter. As the signal cannot be emitted while flying, the UHF beacon is only activated at landing, using a relay controlled by a Raspberry Pi 3 microcomputer.
  • The 433 MHz controlled buzzer that is used to emit a sound to help recovery of the landed payload during the night or within woodlands.
  • A video camera used to record video during the flight. The position of the video camera was changed before every mission in order to adjust the view or to image in different directions.
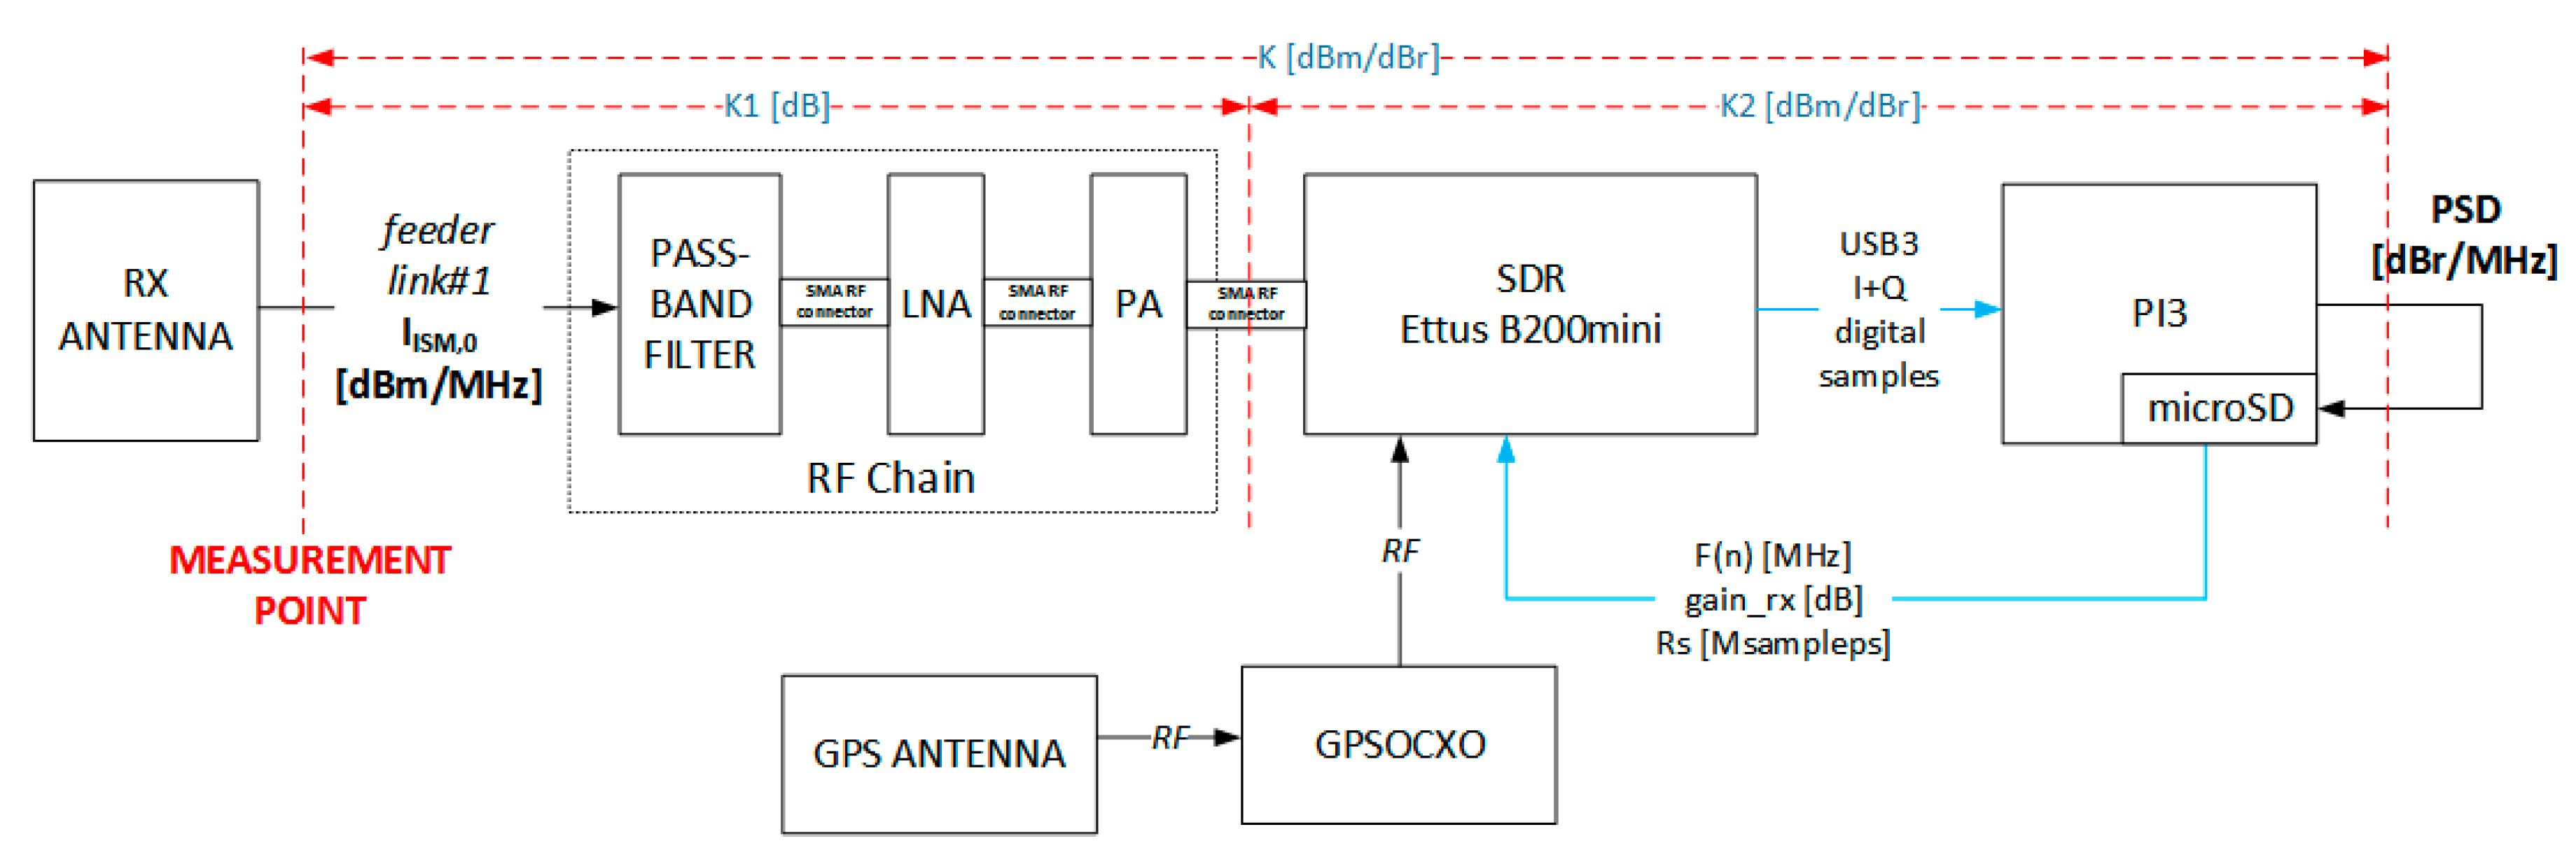
2.3. RF Payload

The diagram in Figure 6 shows the architecture of the RF payload. All the hardware components used to integrate the RF payload are Commercial-Off-The-Shelf. The on-board antenna, the pass-band filter and the LNA (Low-Noise Amplifier) are tuned on UHF or S bands, while the power amplifier, the SDR (Software-Defined Radio) device, a Ettus B200mini [18] and the Raspberry Pi 3 are common to both bands. A GPS OCXO (Oven-Controlled Crystal Oscillator) has been added to flight ISM-HAB #5 in order to increase the frequency stability of the SDR oscillator during the sample recording.
The S-band patch antenna is attached to base of the payload while the UHF dipole antenna is installed parallel to the base at a distance of 7 cm using a plastic bracket in order to maximize the antenna gain (Figure 7). Both antennas are connected to the pass-band filter with a short SMA coaxial cable (the antenna feeder link). All other components of the RF payload apart from the RX antennas, the feeder link and the GPS antenna of the GPS OCXO are installed within a Styrofoam box (20 × 24 × 15 cm) in order to keep the components warm during the flight. The pass-band filter, the LNA, the PA and the SDR device are connected to each other using their SMA connectors. Finally, the SDR device is connected to the Raspberry Pi 3 using a USB cable. The Raspberry Pi 3 stores the collected data within its micro-SD (micro Secure Data card).

2.4. Dynamics Payload

The Inertial Measurement Unit (IMU) is a BerryIMU based on a LSM9DS1 sensor [19] that contains a micro-electromechanical system (MEMS) accelerometer and a MEMS gyro in a single chip (Figure 5d). Each mission was equipped with one or two LSM9DS1 sensors. This sensor provides information about the attitude and angular acceleration of the payload assembly. The sensor is controlled by a dedicated Raspberry Pi Zero, which stores the collected data in a micro-SD memory card.

3. Mission Operations
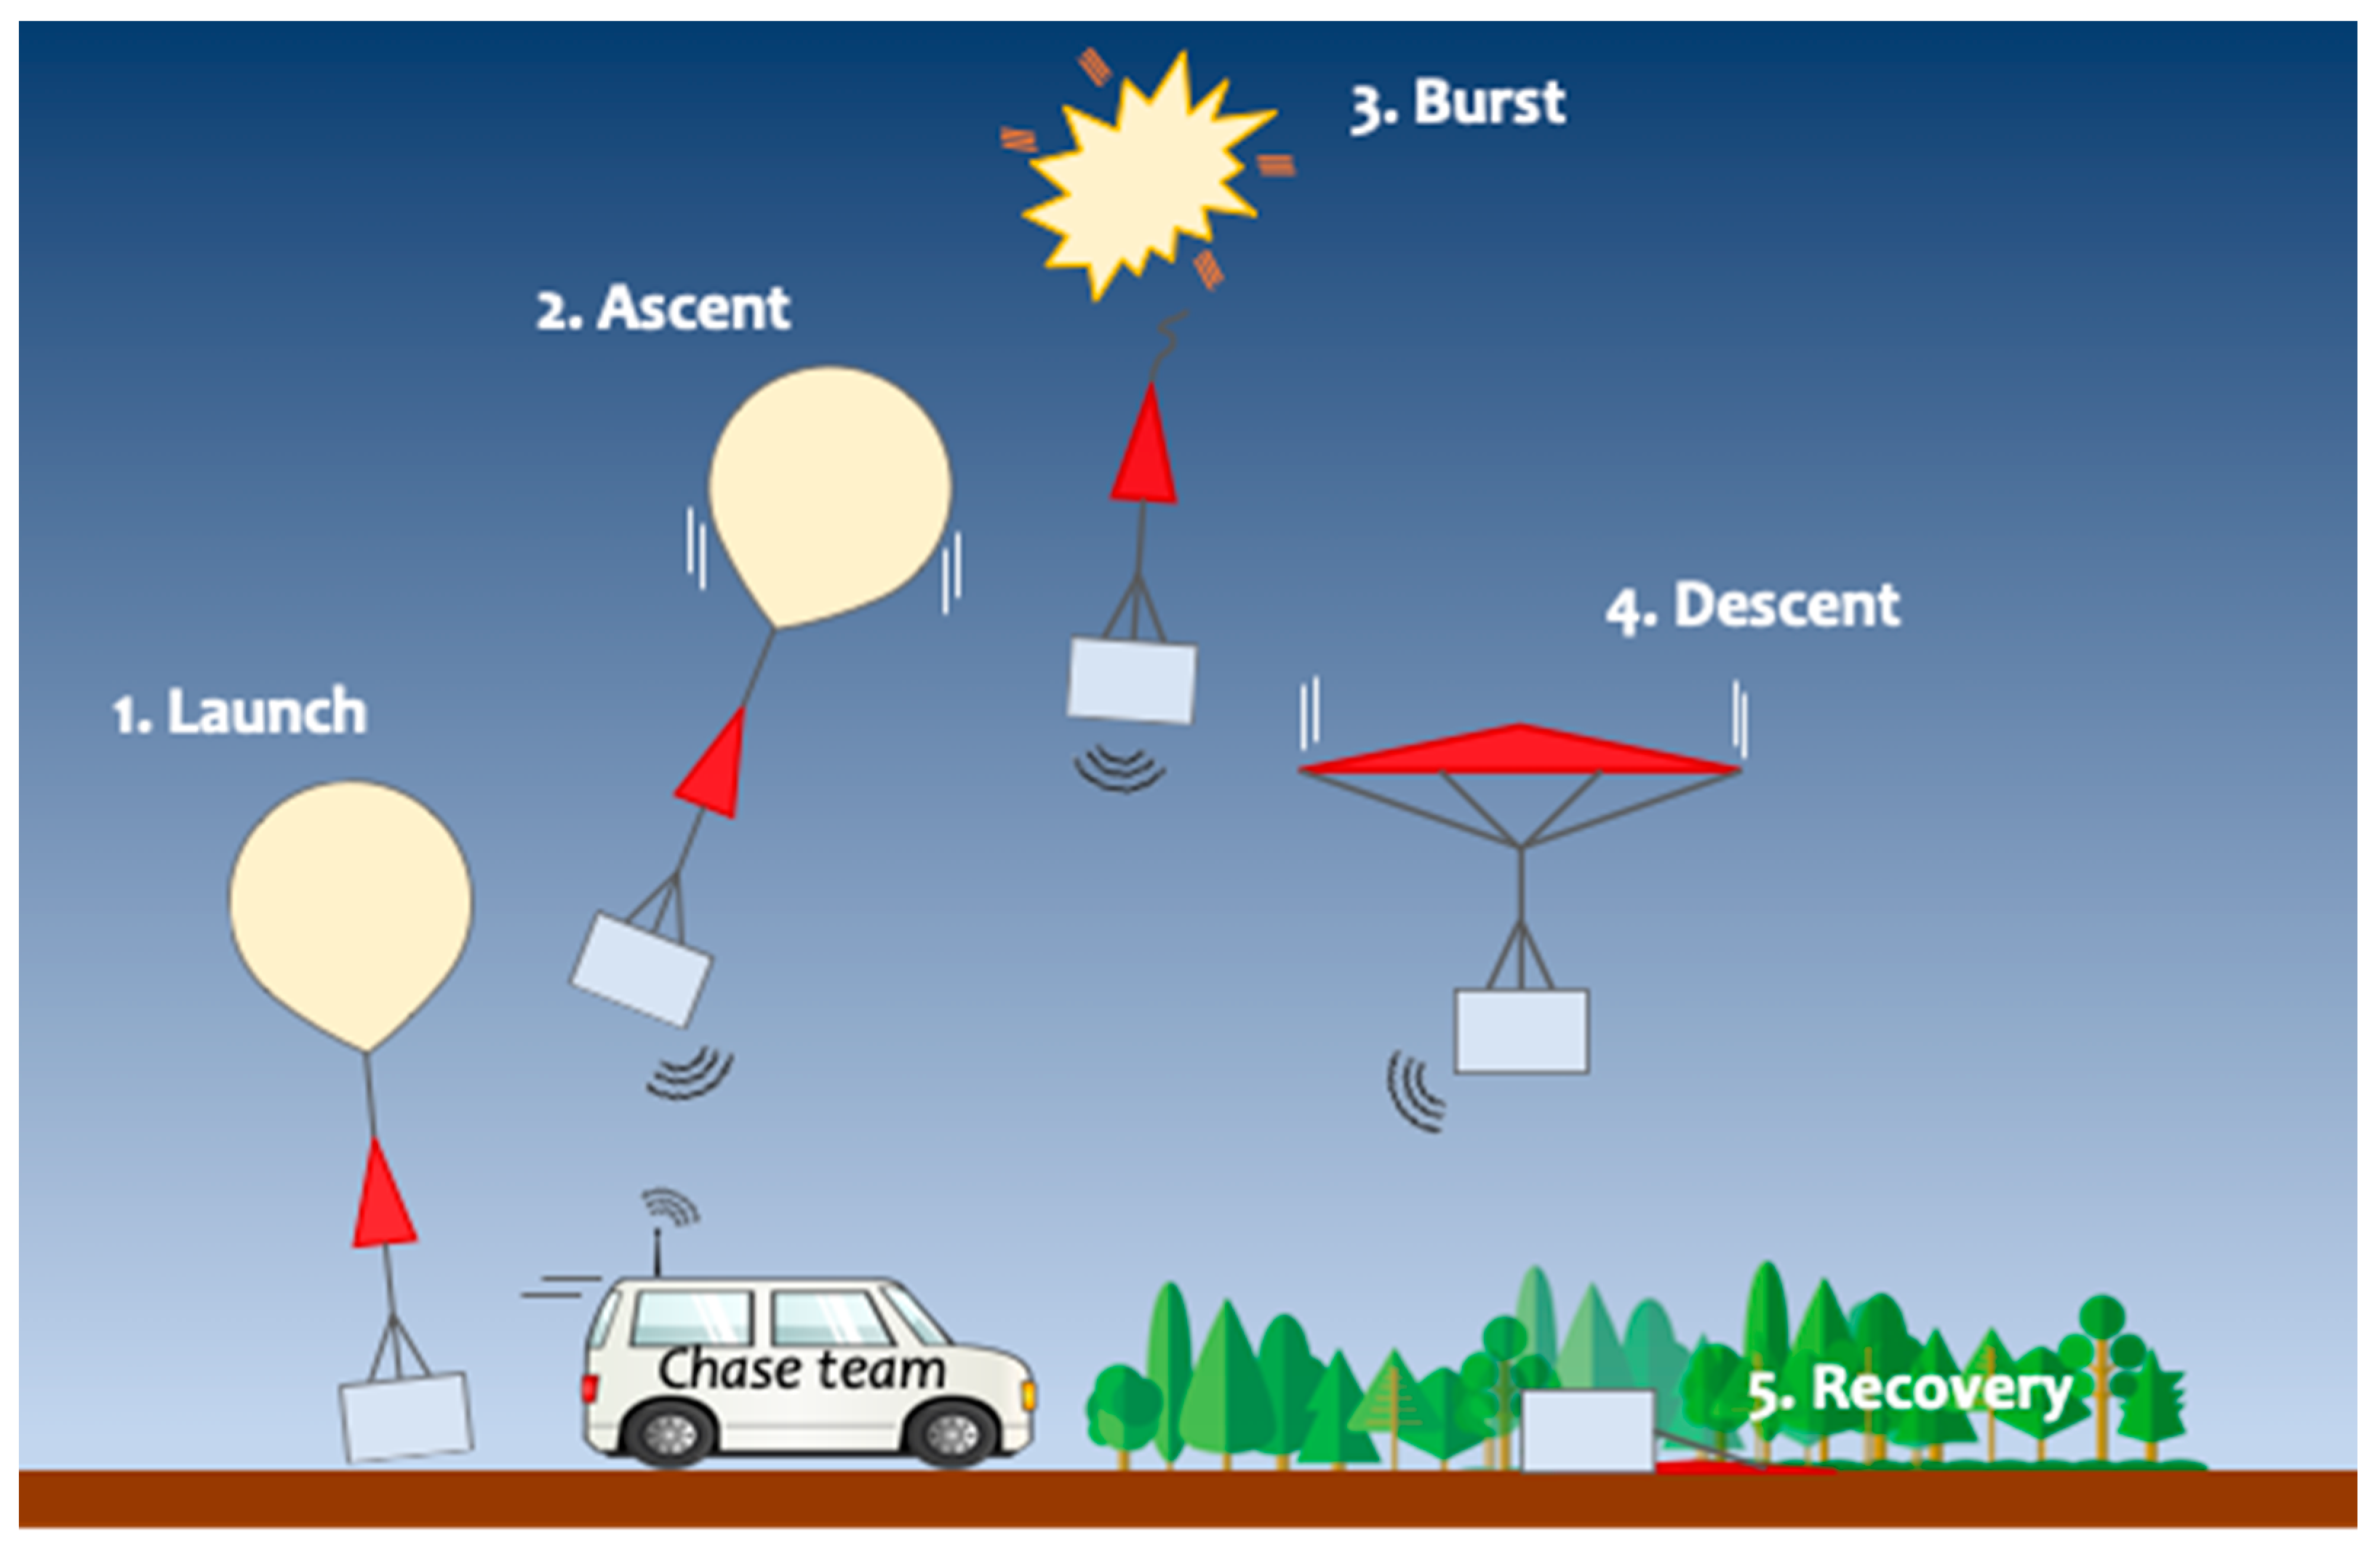
3.1. Mission Phases

Mission phases are summarized in Figure 8. First, the HAB is released into the atmosphere from the launch site (1); normally, the launch operations are carried out by a team of five people. Then, the balloon starts the ascent phase (2) up to when it reaches its maximum size and bursts (3). From this moment on, the payload starts the descent phase (4) under parachute braking. Finally, the payload is recovered (5) by the chase team and the various memory cards containing data collected by the on-board systems (tracking and RF payload) are recovered. The chase team relies both on the APRS data and the SPOT tracer position to follow the payload location throughout the flight.

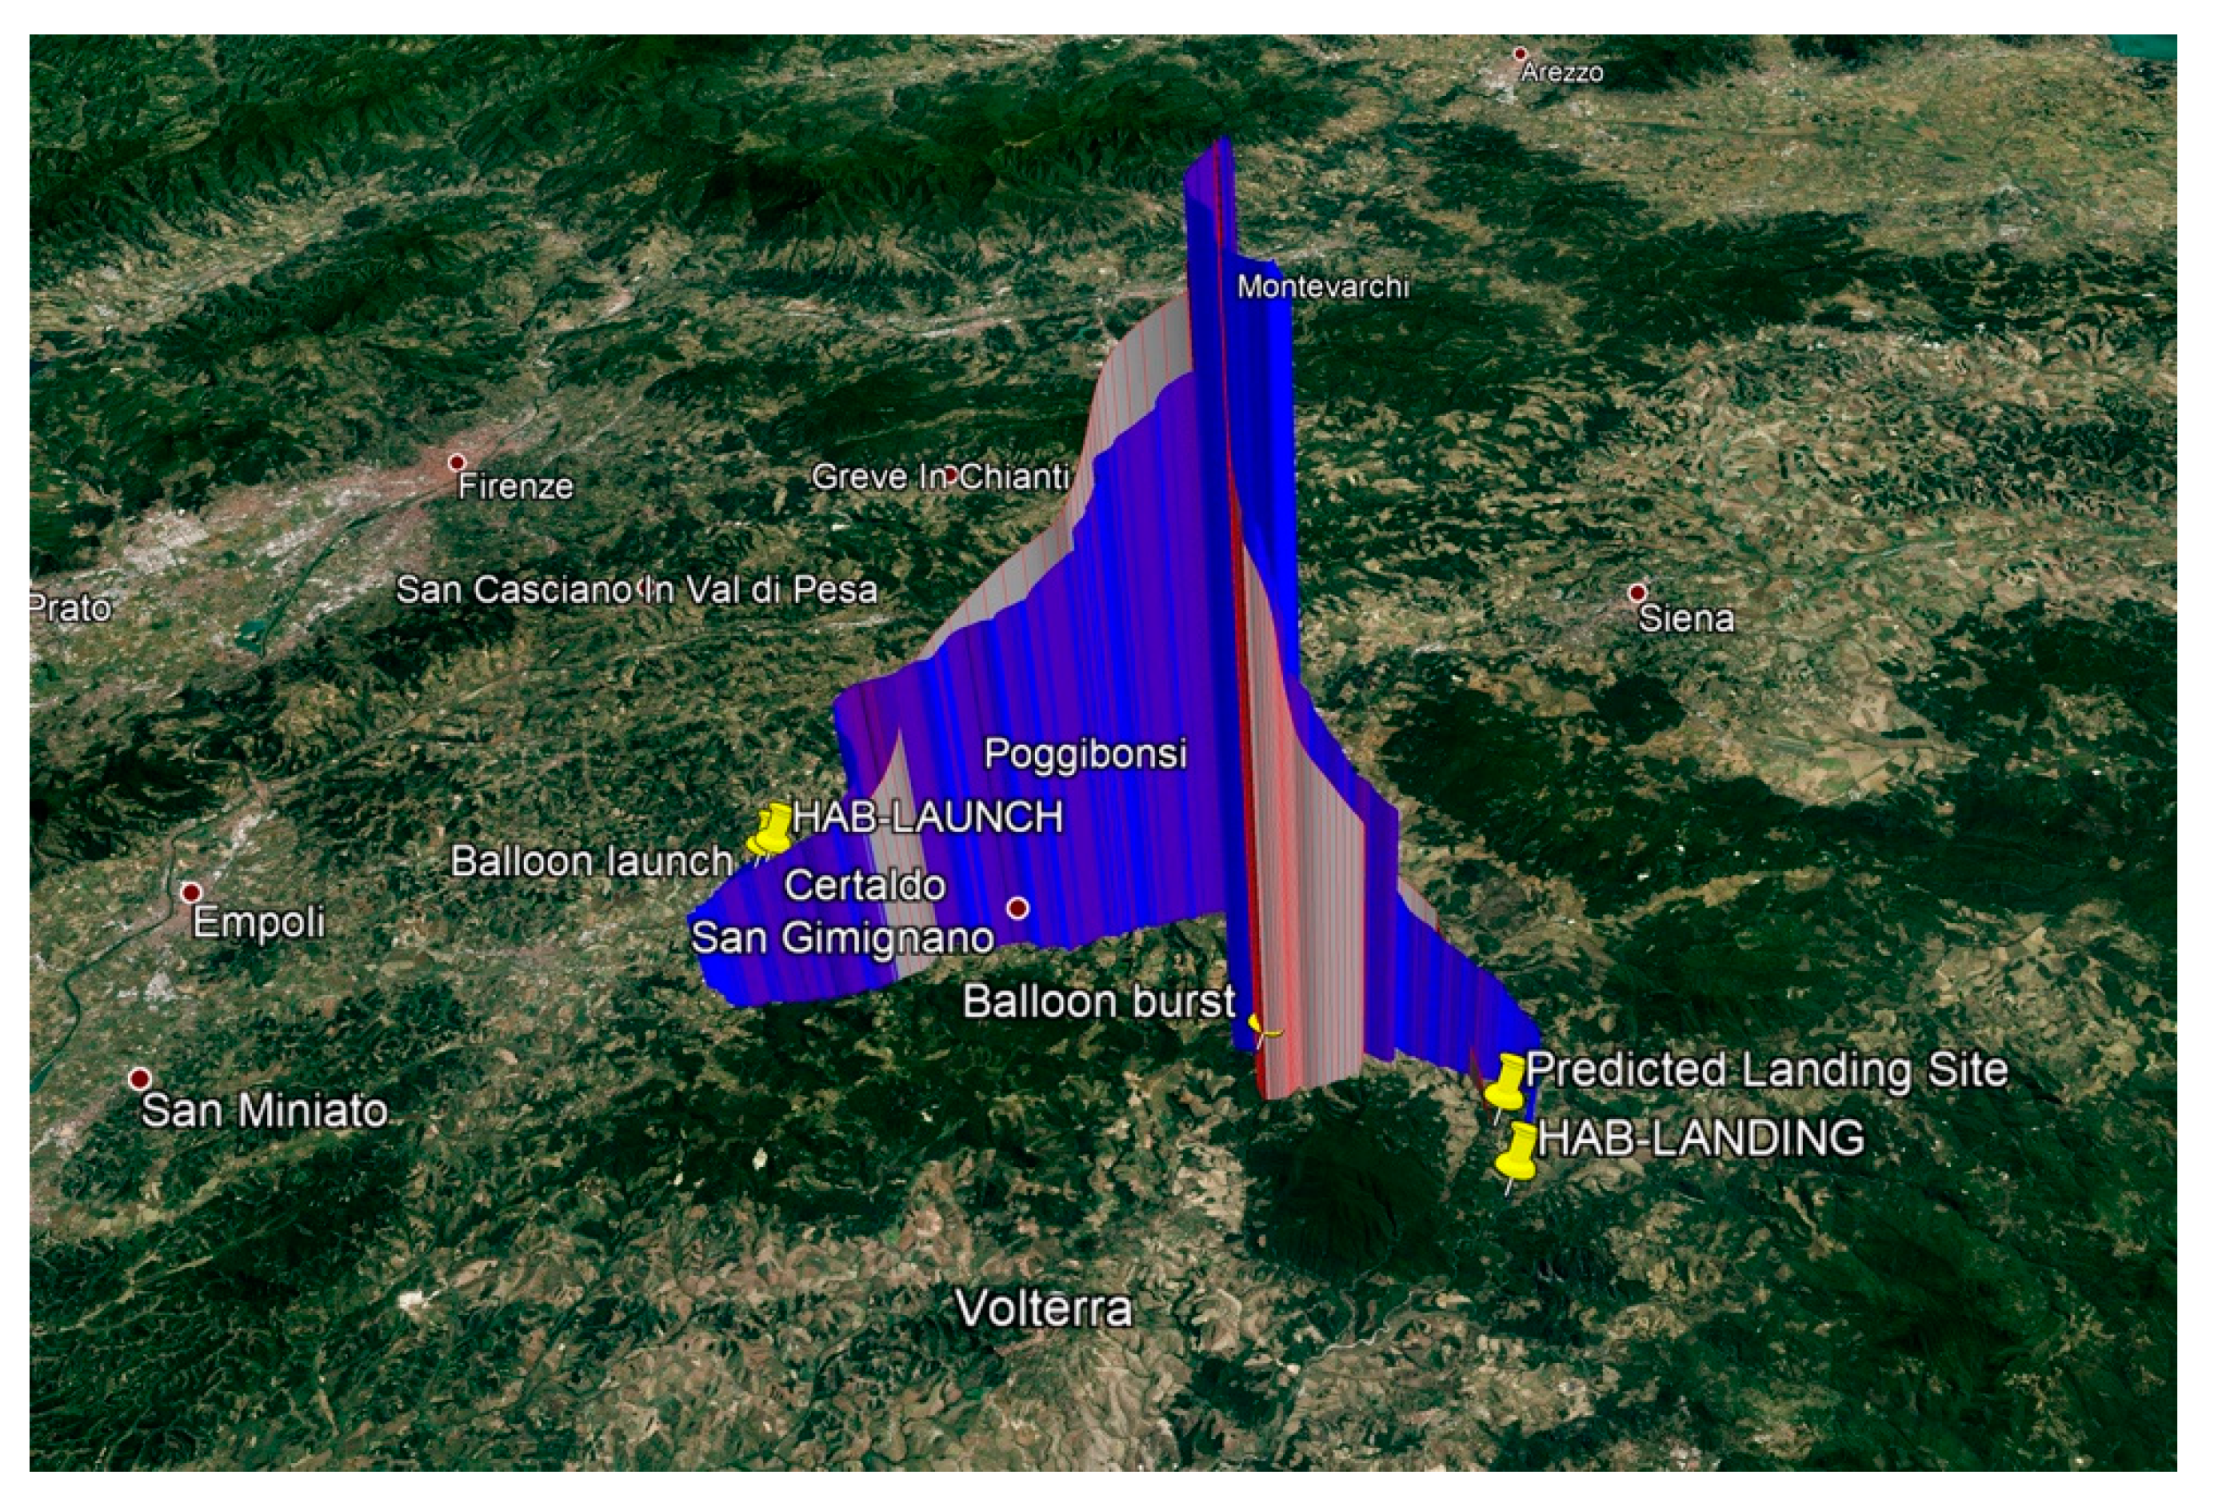
3.2. Flight Predictions

The measurement data collected during the mission are stored into a micro-SD memory card and cannot be transmitted while flying due to their large size. Recovery of the payload is mandatory for the mission success and accurate prediction of the flight path according to weather conditions and direction and strength of the winds is therefore of paramount importance, so as to allow for a choice of launch parameters (location, time, lift, etc.) that will avoid ending up in areas not accessible, such as deep woods, water or closed property.
All the existing landing predictors are based on calculation of the vertical and horizontal motion of the HAB and provide the landing site and the flight time as output [20]. A custom landing predictor was developed during this project in order to have a reliable prediction of the flying path. The predictor, written in Python, can be adjusted to fit different flight conditions, like flight in rainy conditions that typically are not accounted for by predictors available online. The code independently models the ascent and the horizontal motion [21,22,23,24] and uses data provided by the US National Oceanic and Atmospheric Administration (NOAA), to be manually imported [25].

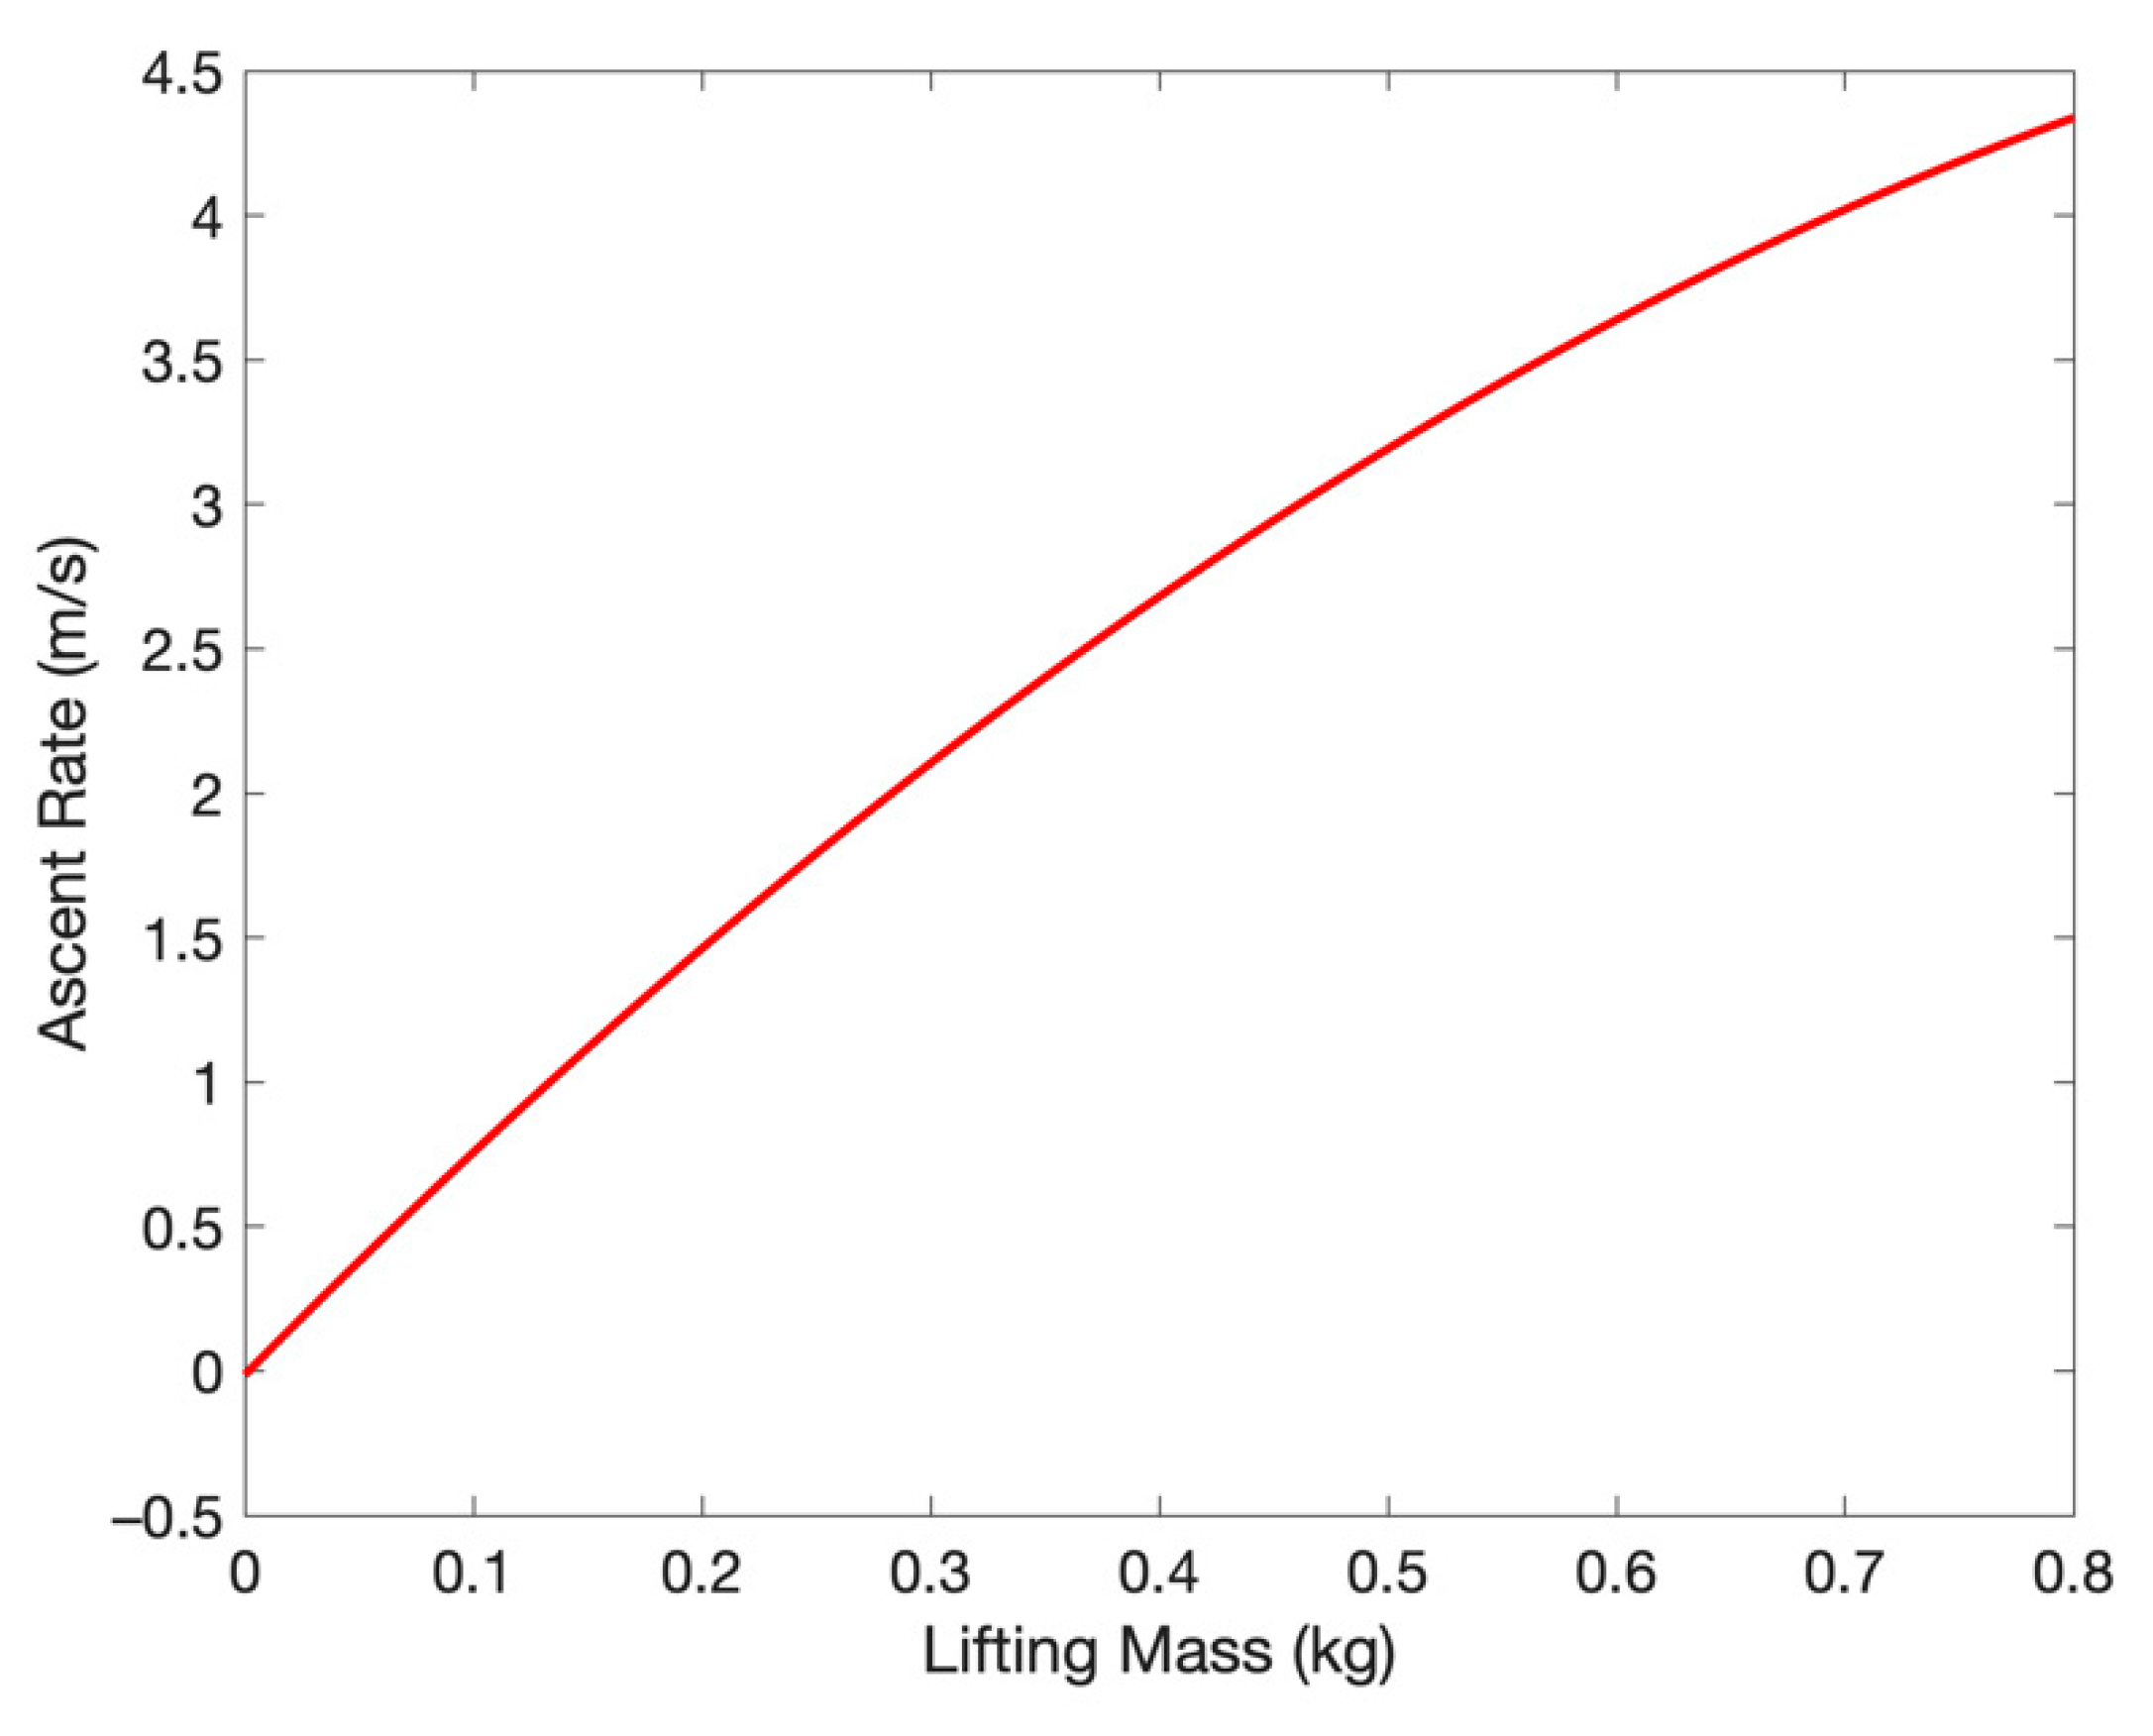
3.2.1. Modeling of the Ascent

In modeling the flight dynamics of the balloon, the forces of interest are gravity, buoyancy and drag. The buoyant force is equal to the weight of the air displaced by the balloon. Since lifting gases are by definition less dense than air, the buoyant force exceeds weight and propels the balloon upward. The buoyant force, which acts in the z direction, is:
F b ( z ) = V ( z )   ρ a i r ( z )   g ( z )   z ^
where V(z) is the balloon volume. Latex balloons can expand to a multiple of their launch site diameter at apogee, and the density ρ a i r of the atmosphere at typical burst altitudes can approach 1% of sea level density, while variations of the gravity acceleration g(z) are less than 1–2%. The buoyant force is opposed by the downward force of gravity on the balloon:
F g ( z ) = m t o t   g ( z )   z ^
where m t o t = m b a l l o o n + m p a y l o a d + m H e l i u m is the mass of the whole system. Finally, the drag force can be computed as follows:
F d ( z ) = 1 2 ρ a i r ( z )   C D   A ( z )   | V r e l |   V r e l
where:
V r e l = V V W
is the balloon’s velocity relative to the surrounding air, C D is the drag coefficient and A ( z ) is the cross-sectional area of the balloon in the direction of V r e l . The total force acting on the balloon is then:
F t ( z ) = [ V ( z )   ρ a i r ( z ) m t o t ]   g ( z )   z ^ 1 2   ρ a i r ( z )   C D   A ( z )   | V r e l |   V r e l
The vertical motion is then derived by integrating the total force using Newton’s law and imposing the initial conditions and the burst conditions. Two burst conditions can be set, i.e., either the burst altitude, or the burst diameter as provided by the manufacturer of the balloon.

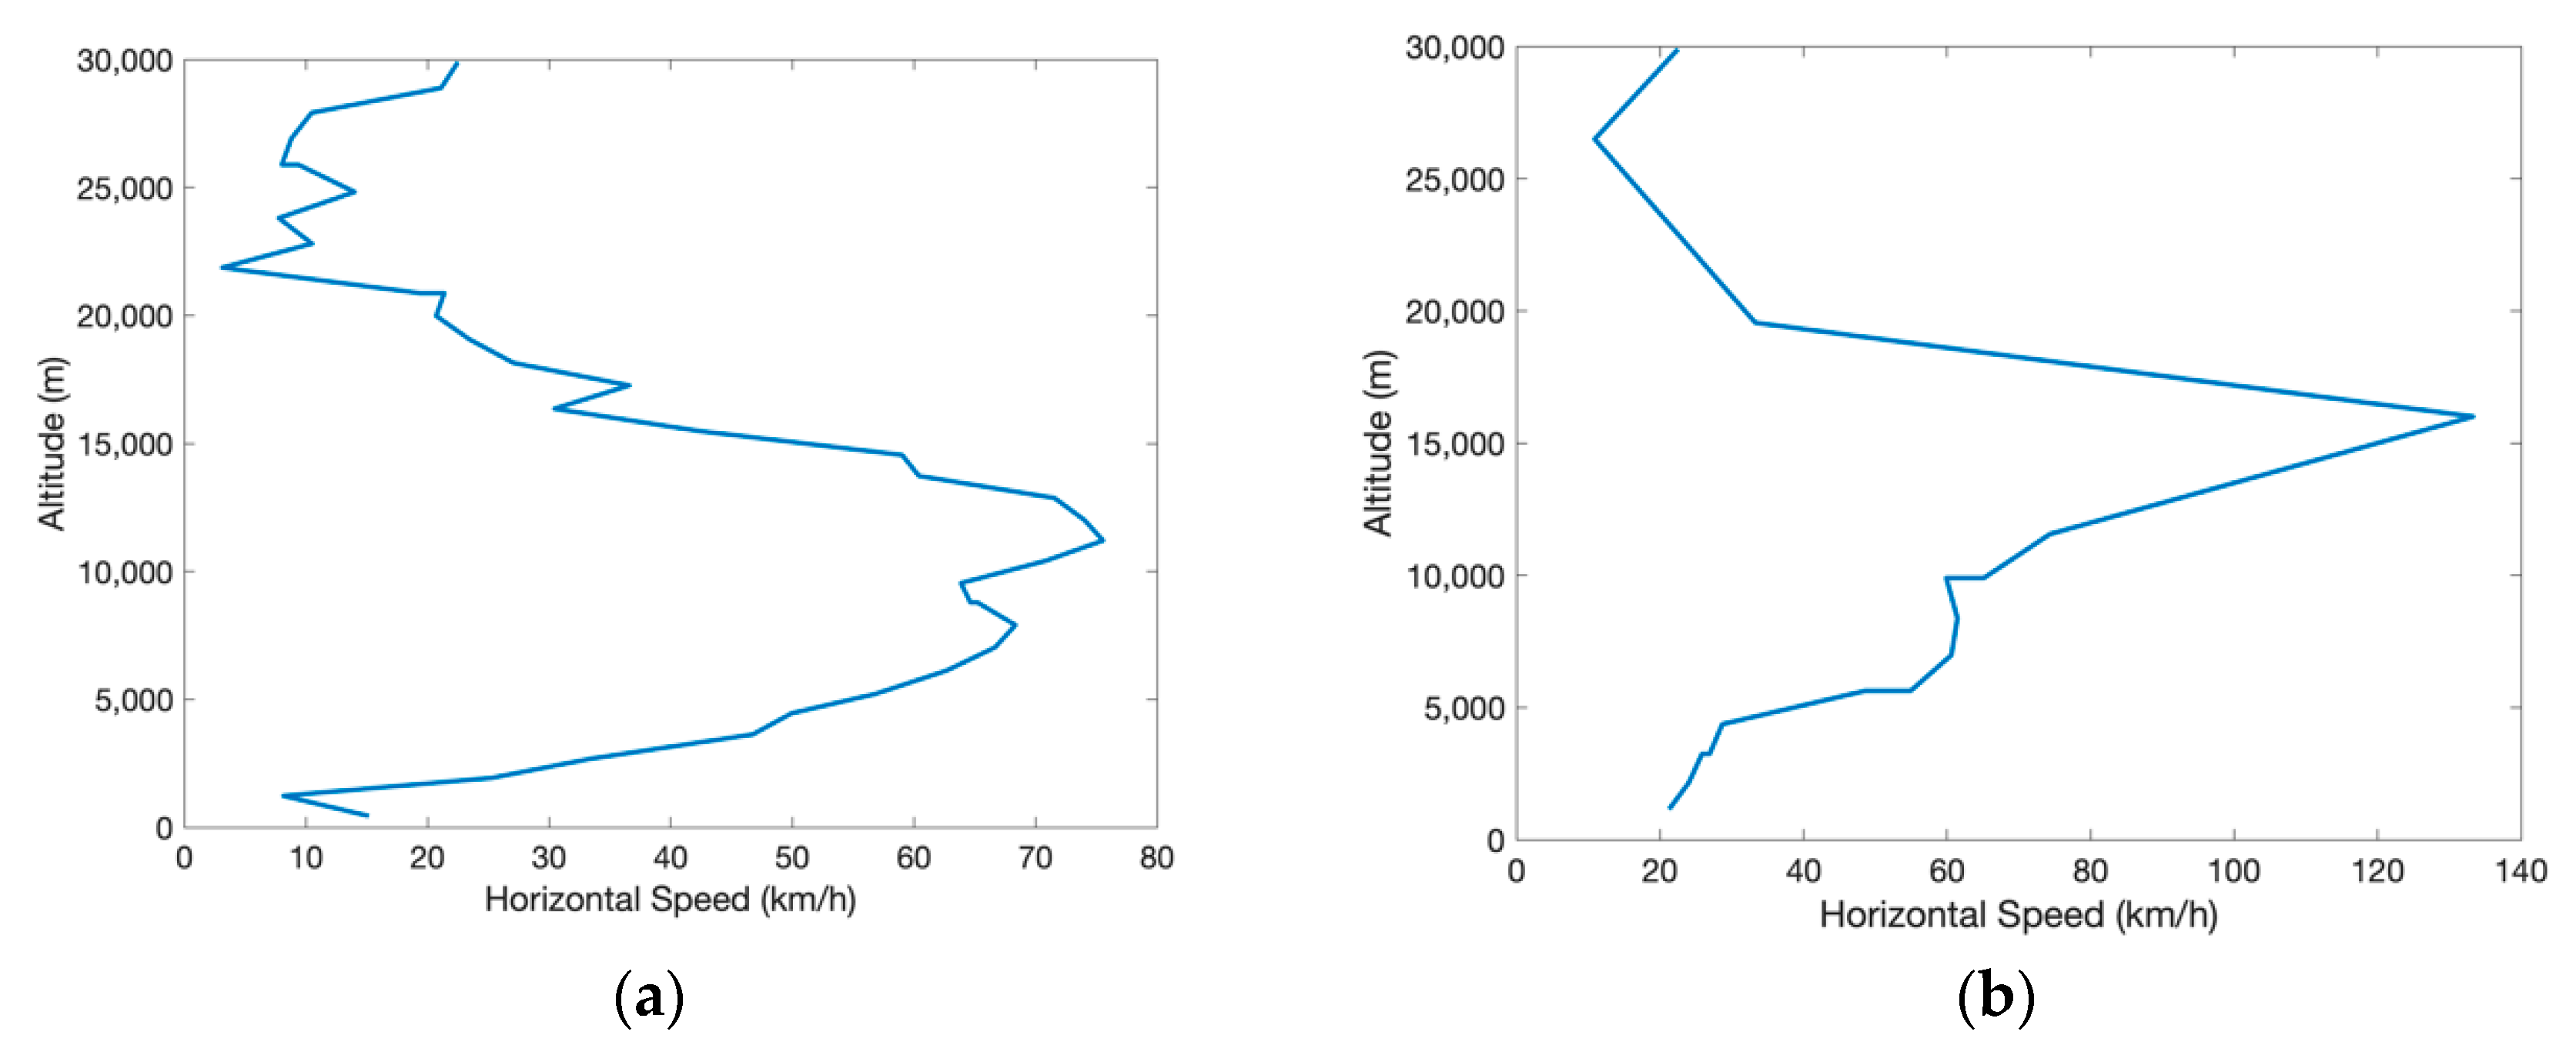
3.2.2. Modeling of the Horizontal Motion

The horizontal motion is modelled assuming that the x and y components of the HAB velocity are equal to the x and y components of winds. The x component is along the local parallel while the y component is parallel to the local meridian. Magnitudes of these winds’ components, often referred to as U v and U u , are made available for any location in the world by meteorological services, such as the American National Oceanic and Atmospheric Administration (NOAA), with resolution of 1° or 0.5°. If t is the integration time set by the simulator, the horizontal displacements can be computed as follows:
x = V x , W   t y = V y , W   t
while the changes of latitude and longitude are:
l a t = asin ( V x , W   t r e )
l o n g = asin ( V y , W   t r e     cos ( l a t ) )
where r e   cos ( l a t ) is the radius of the circle relative to the parallel with the considered latitude.
The predictor turned out to be fairly accurate if precisely tuned. Table 1 shows the displacement between predicted and actual landing sites for the five flights carried out (ISM-HAB #1 to ISM-HAB #5). The actual ground distance values are shown along with the percentage of the total distance traveled. Figure 9 shows the simulated trajectory and the real trajectory for a typical flight.

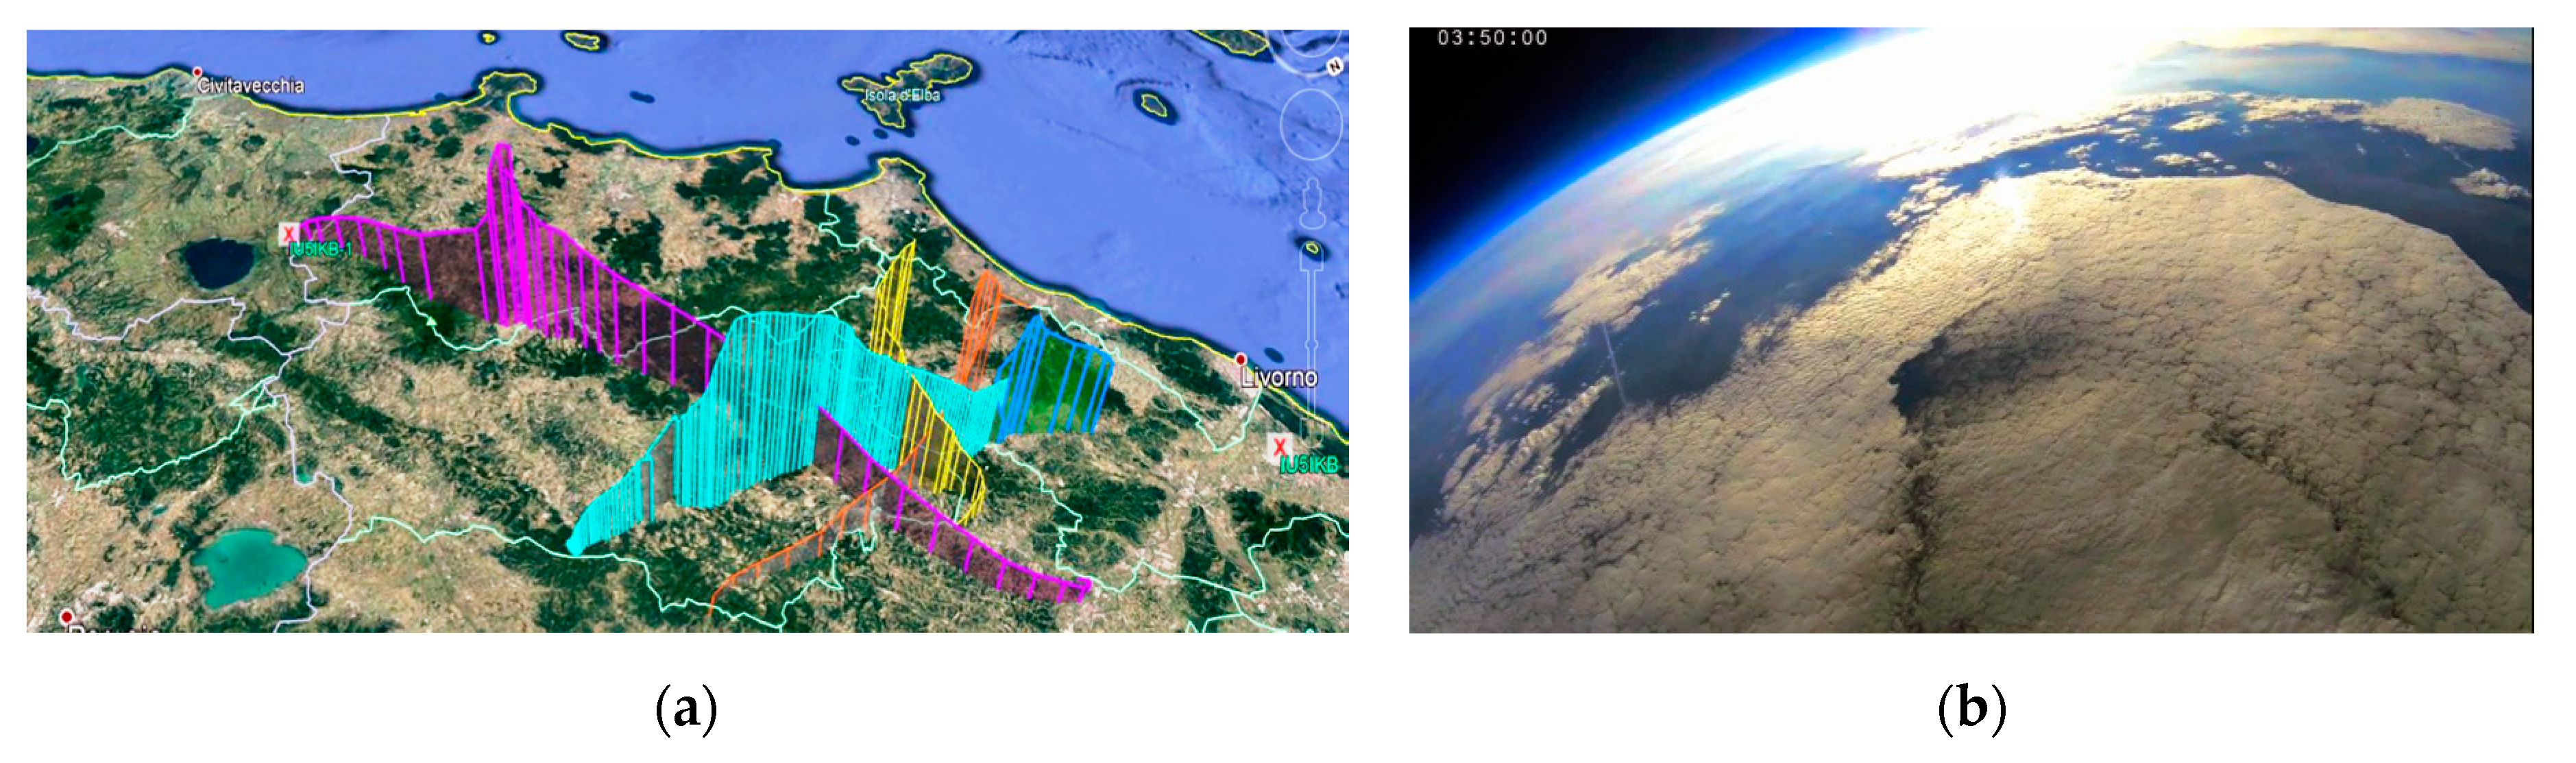
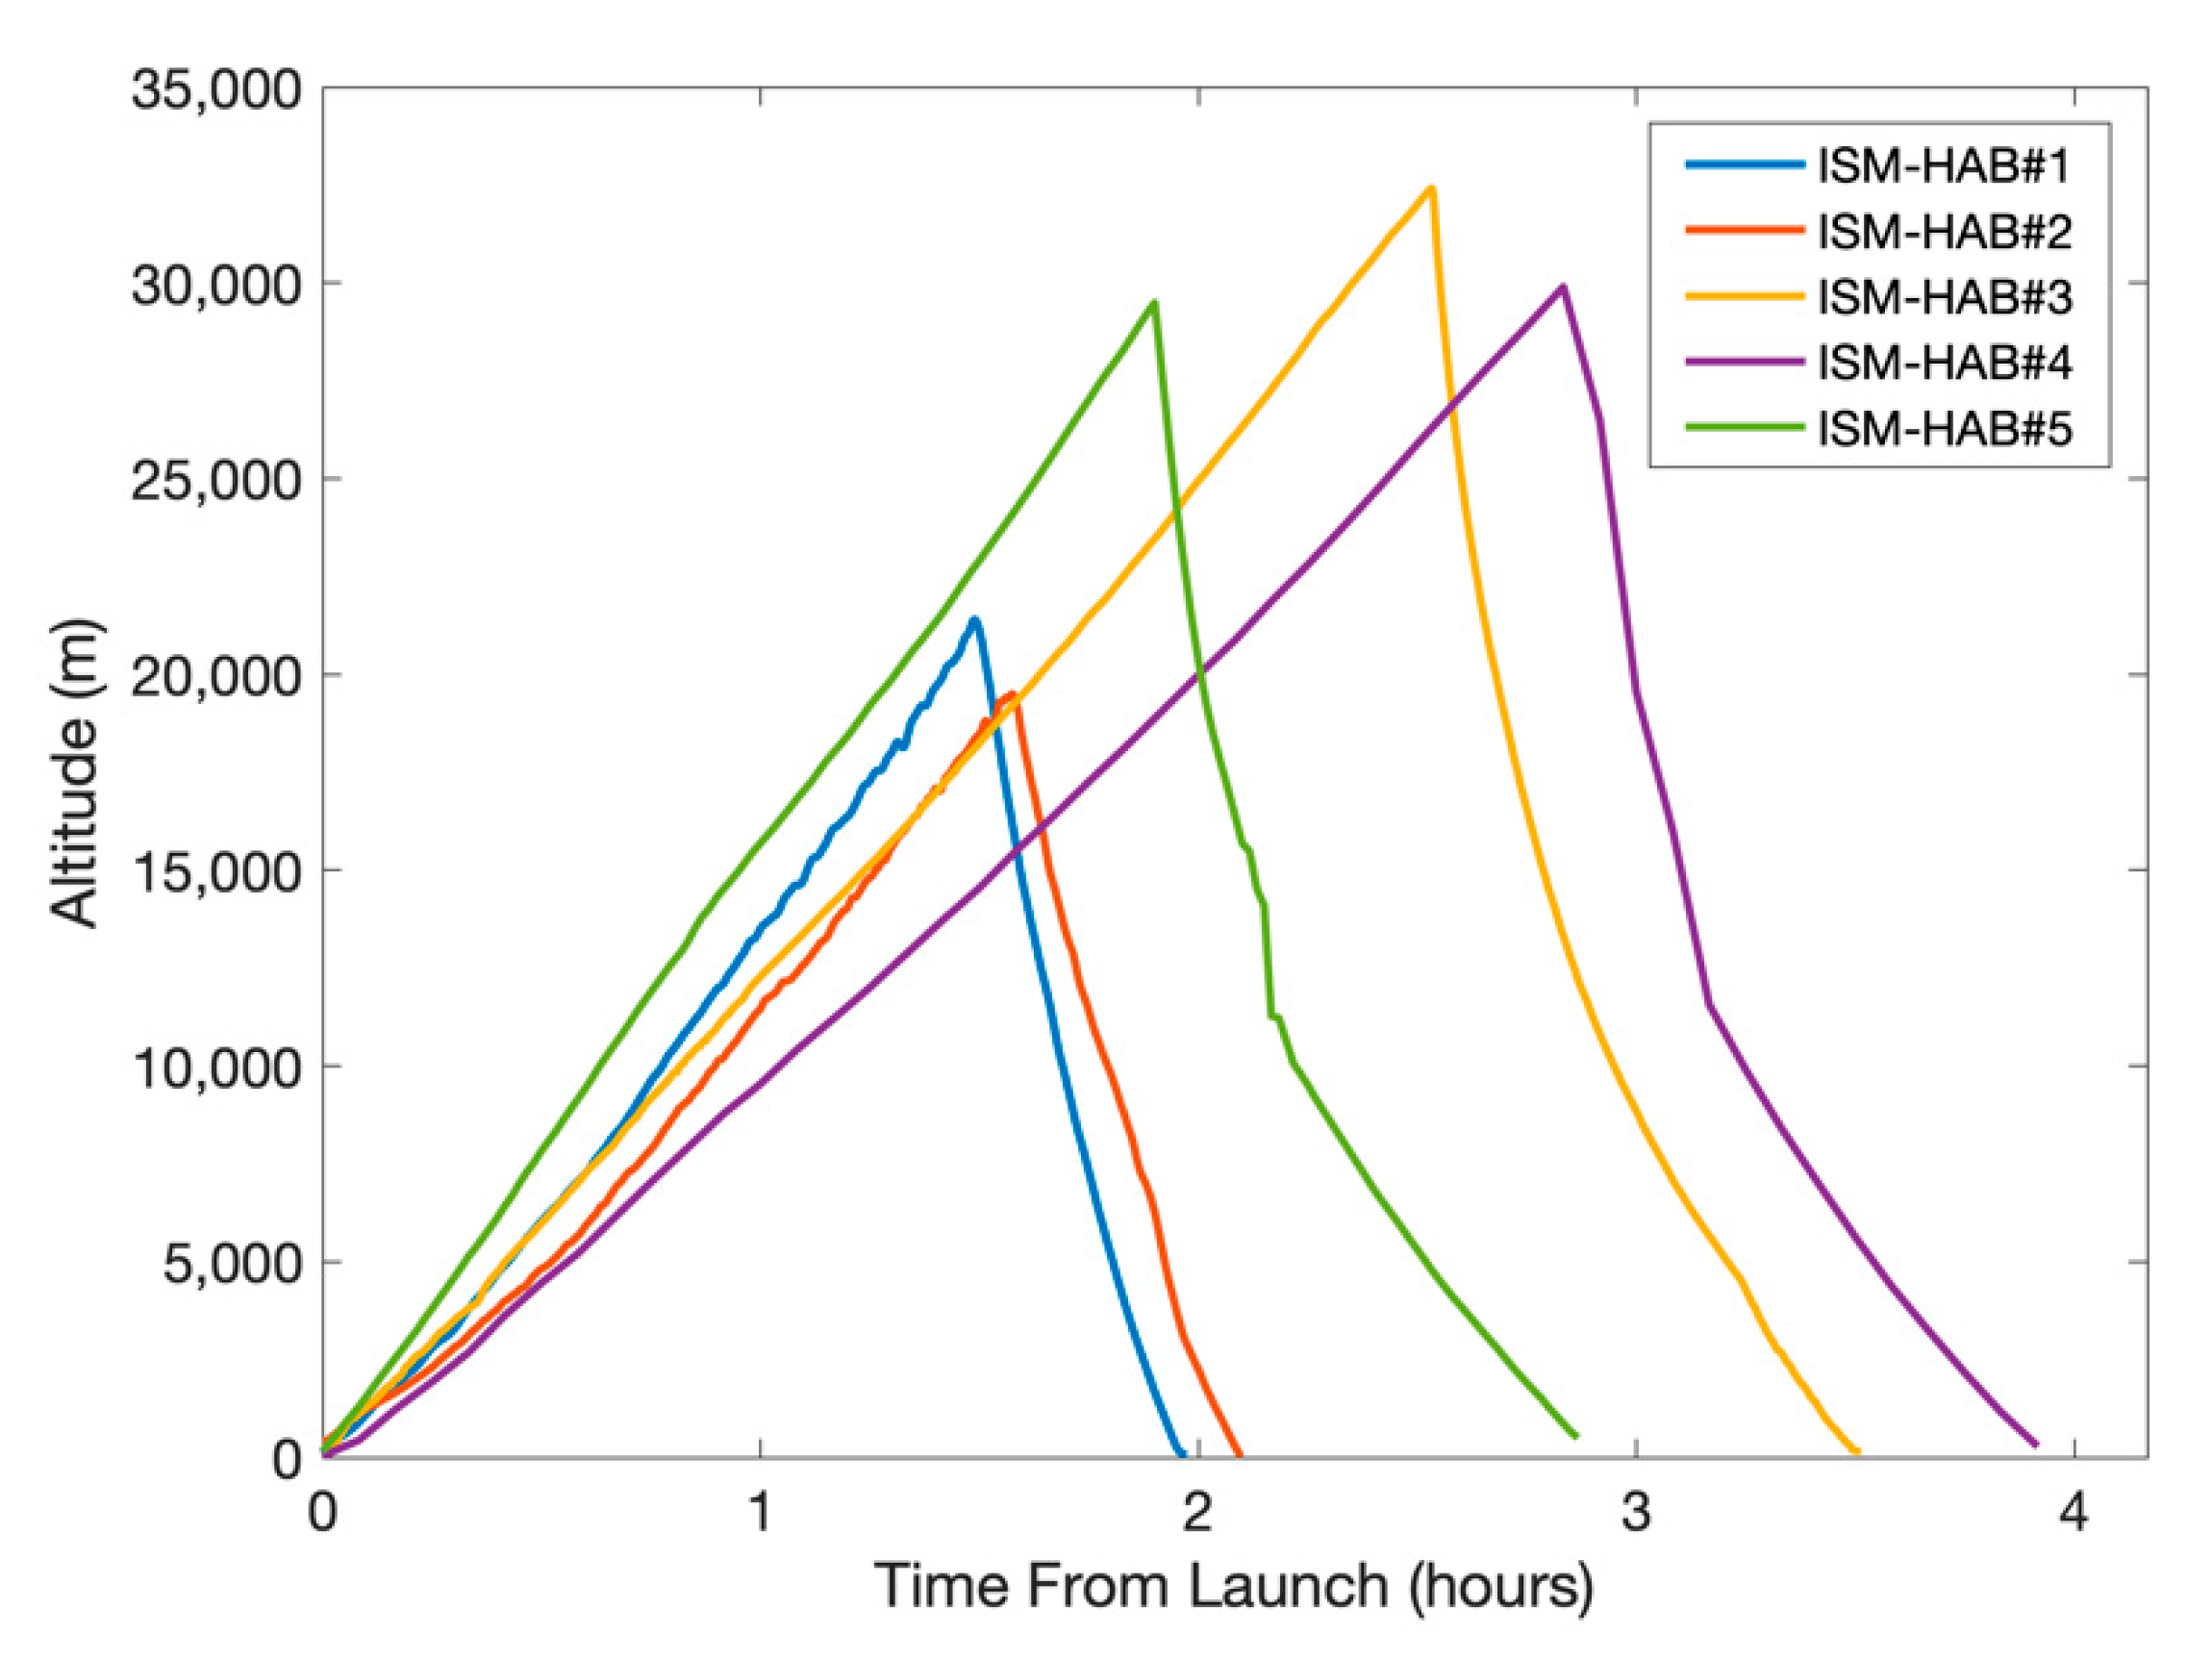
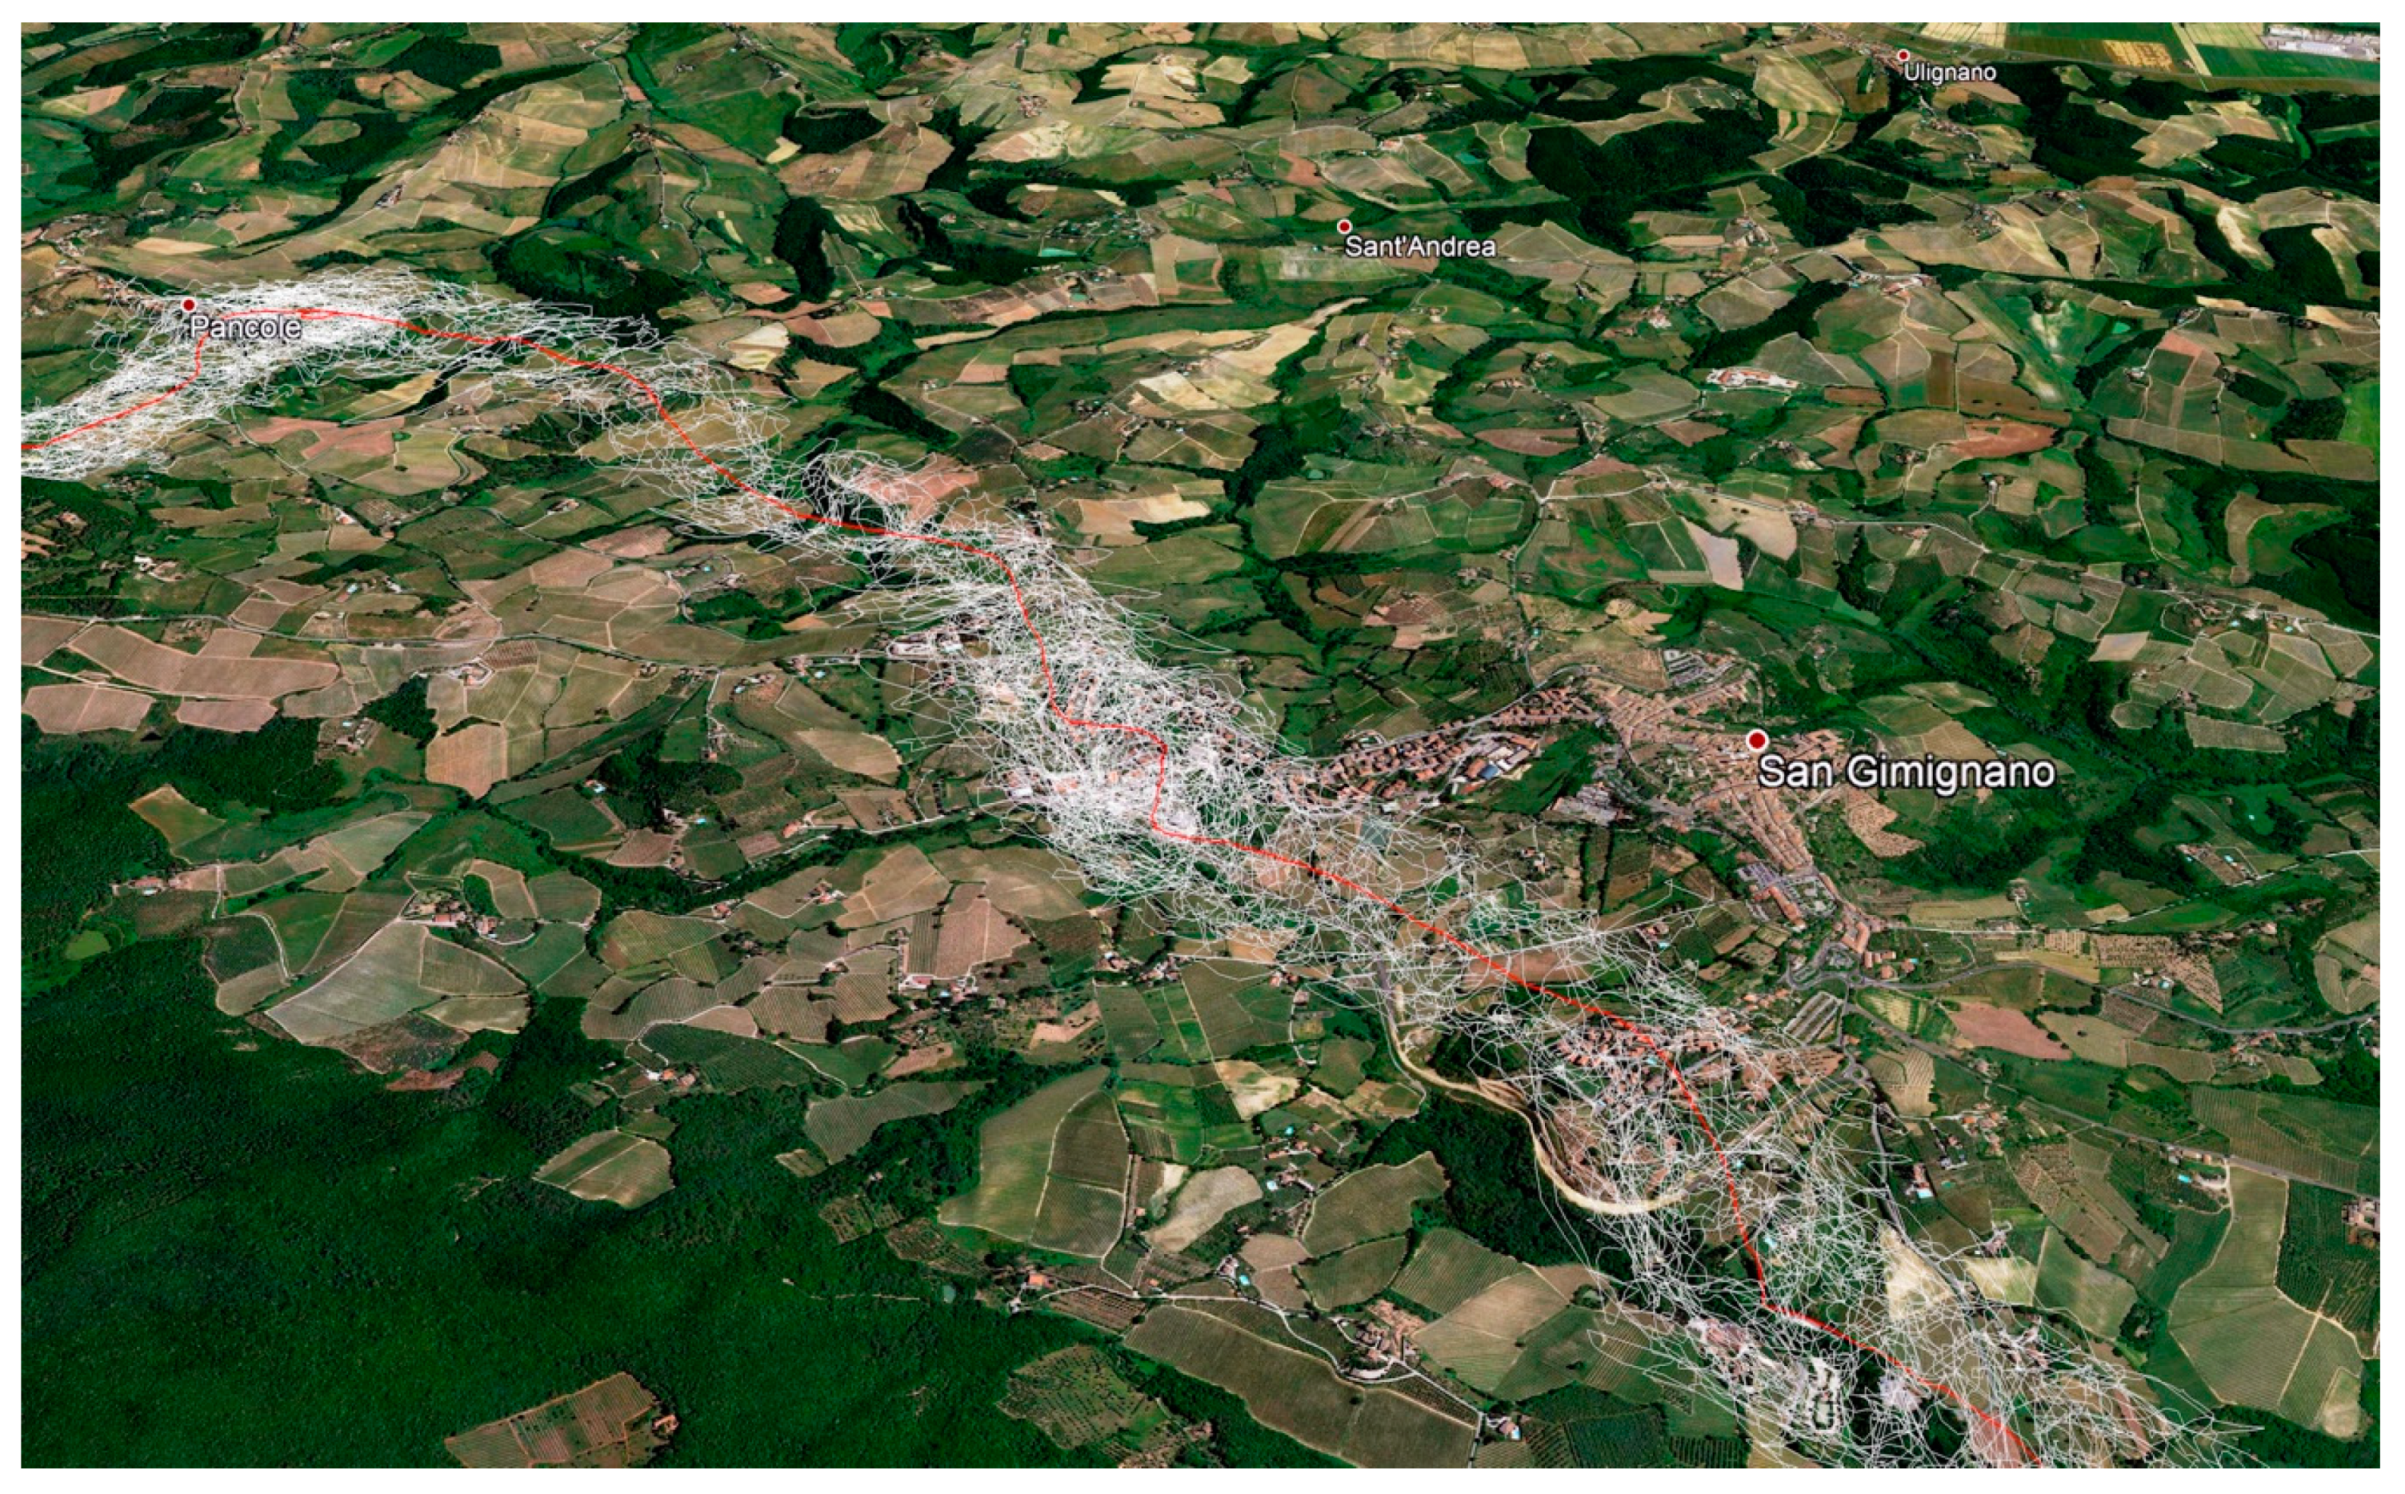
3.3. Overview of the ISM-HAB Flights

Figure 10a shows the trajectories of the five missions flown during the ISM-HAB project. The maximum altitude reached was 32 km. The payload was recovered in all flights. The missions’ key parameters are summarized in Table 2.
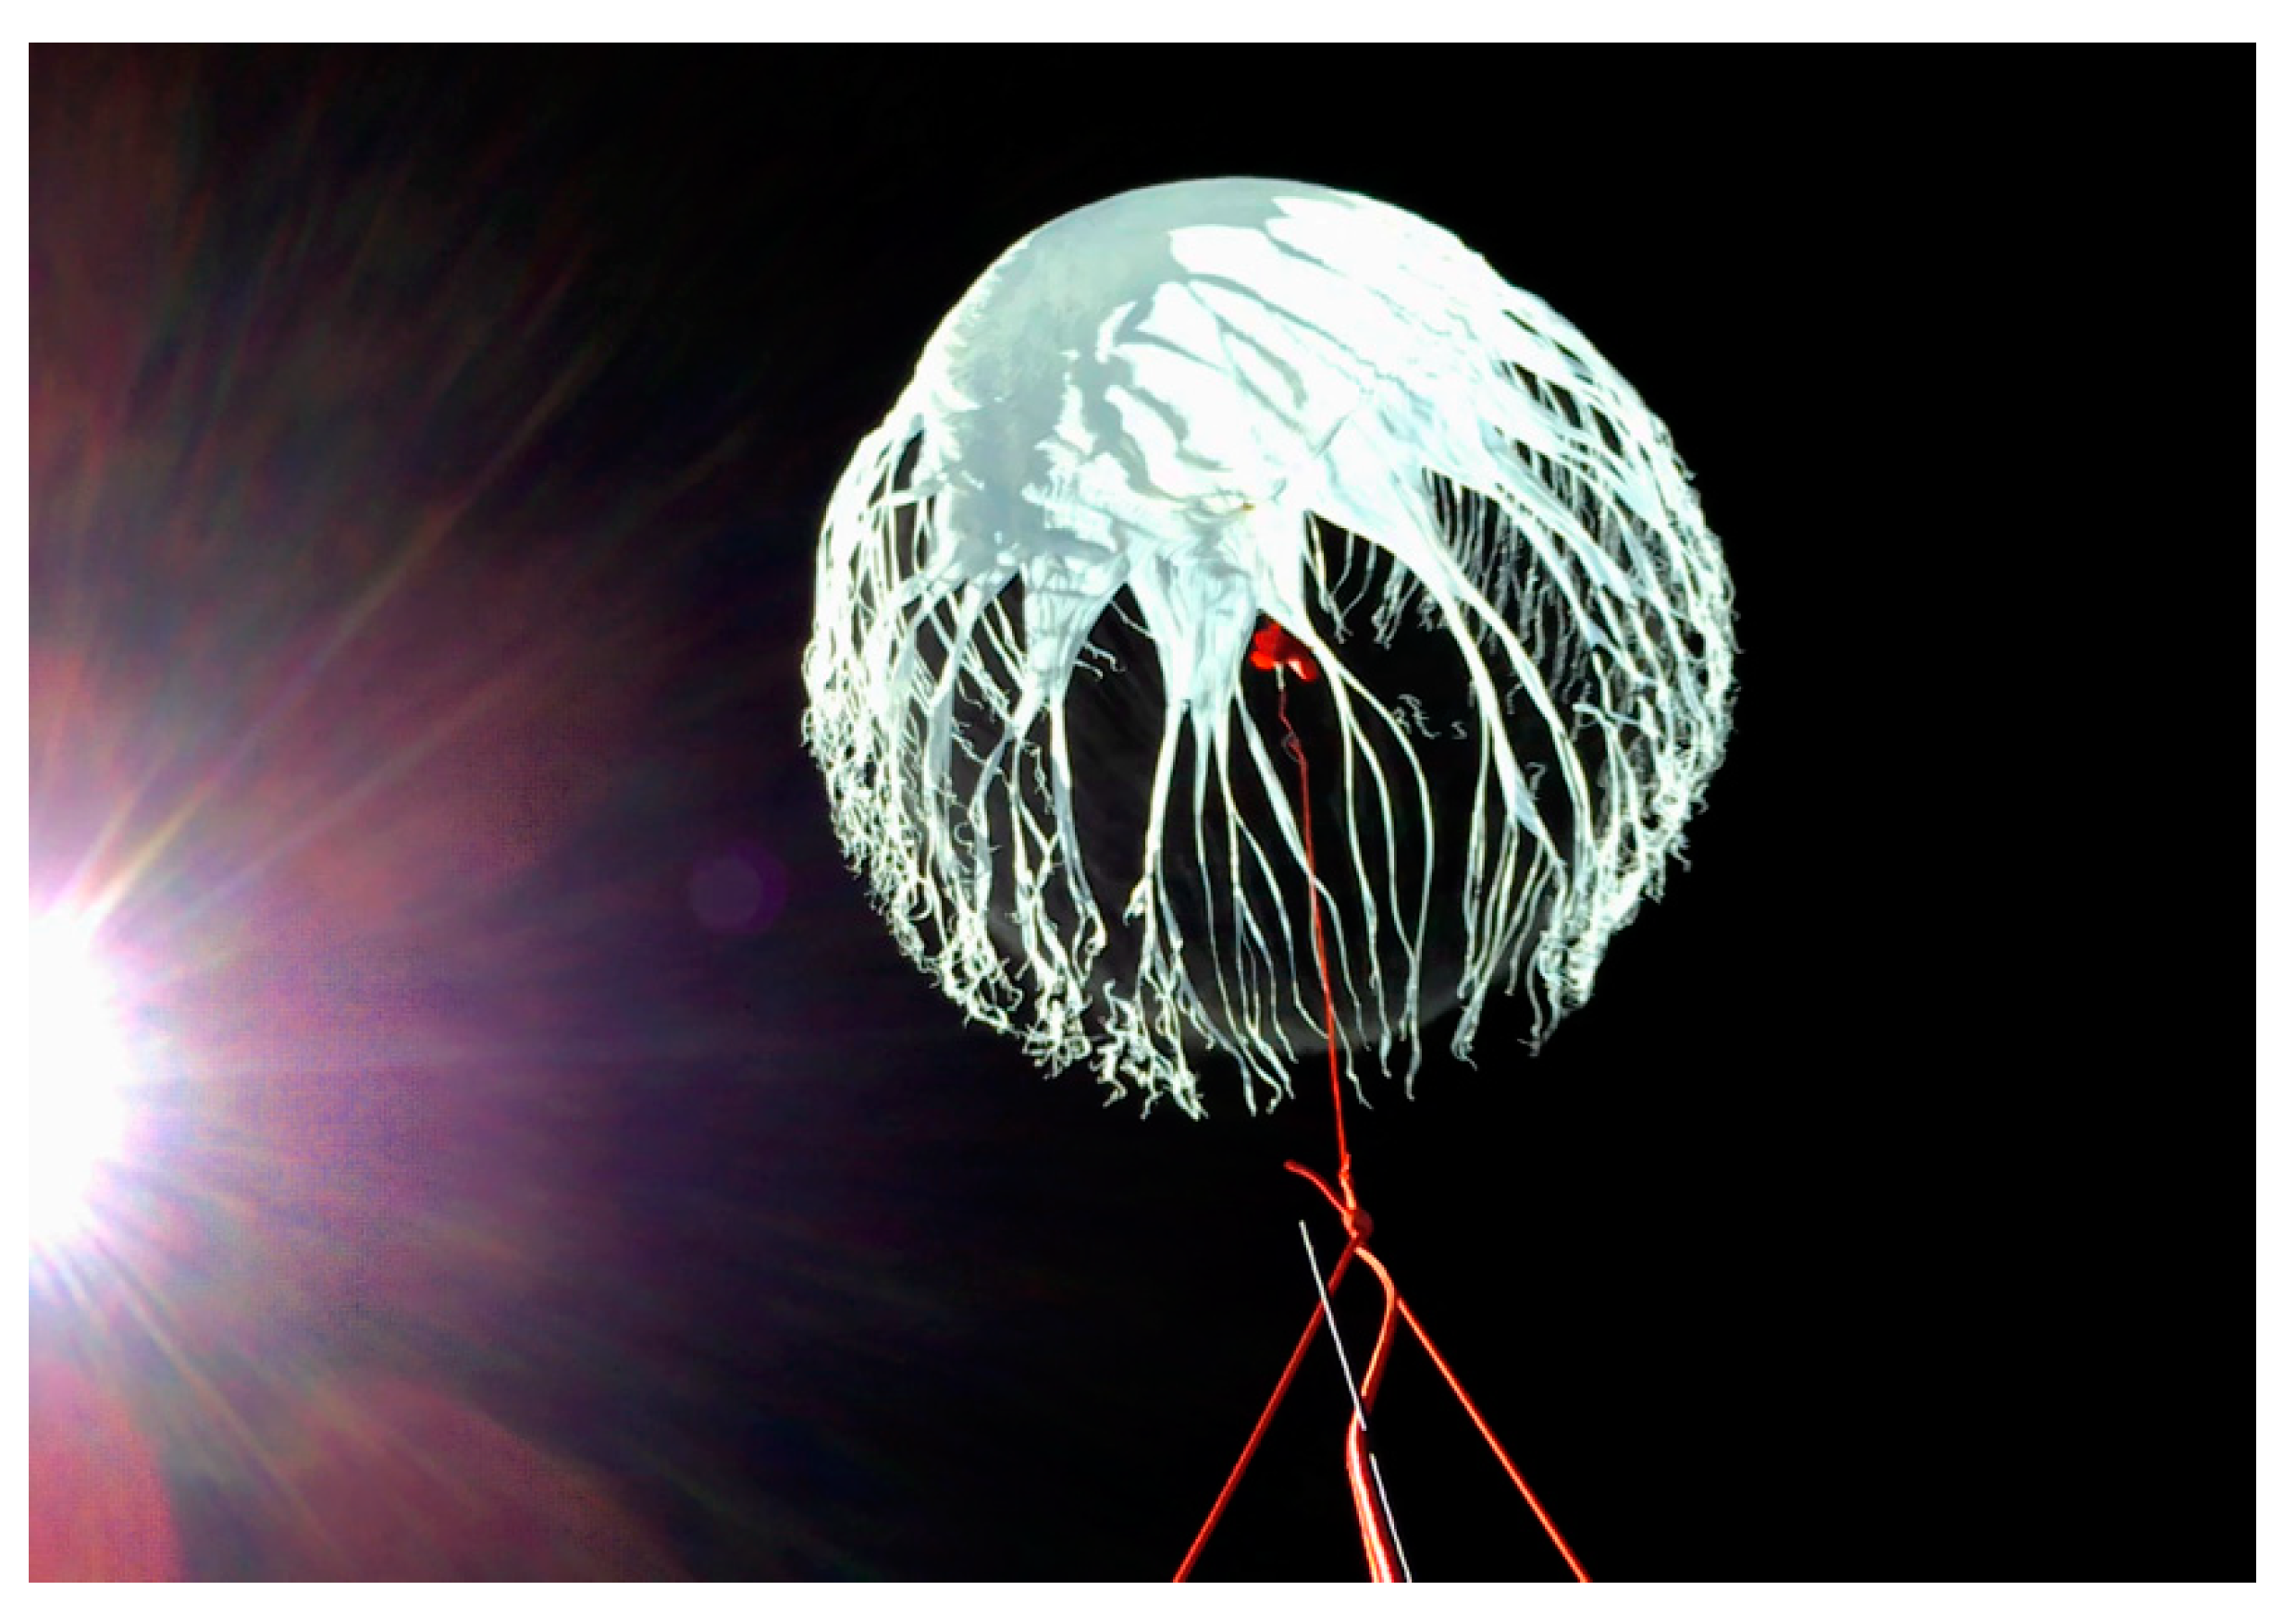
  • ISM-HAB#1: The balloon payload included only the tracking systems and the dynamics package. Burst altitude was about 10 km lower than expected. The reason for the early burst was later traced to the accumulation of ice on the balloon during ascent through a thick layer of clouds.
  • ISM-HAB#2: Full payload, including the RF measurement system. No RF measurement was recorded due to a software glitch. Once again, the balloon suffered from an early bursting, traced back to accumulation of ice due to launch in bad weather, with ground-level rain.
  • ISM-HAB#3: The flight was a complete success. A 1080p camera was placed on the base plate, producing excellent pictures (Figure 10b).
  • ISM-HAB#4: This launch worked perfectly as far as the recording of measurements was concerned; however, the balloon was inflated insufficiently due to a failed helium bottle. The initial lifting force was lower than optimal, resulting in a very slow ascent rate. The balloon spent a considerable amount of time inside strong lateral winds and landed about 140 km further than expected, making recovery more complex.
  • ISM-HAB#5: For the final launch, transmission from a ground station was received on the balloon, allowing to verify the proper working of the tracking and antenna pointing models.

4. Results and Analysis

In the next sections, the main outcomes of the ISM-HAB project are summarized. Selected results are presented which are representative of data collected in flights ISM-HAB #3 to #5.

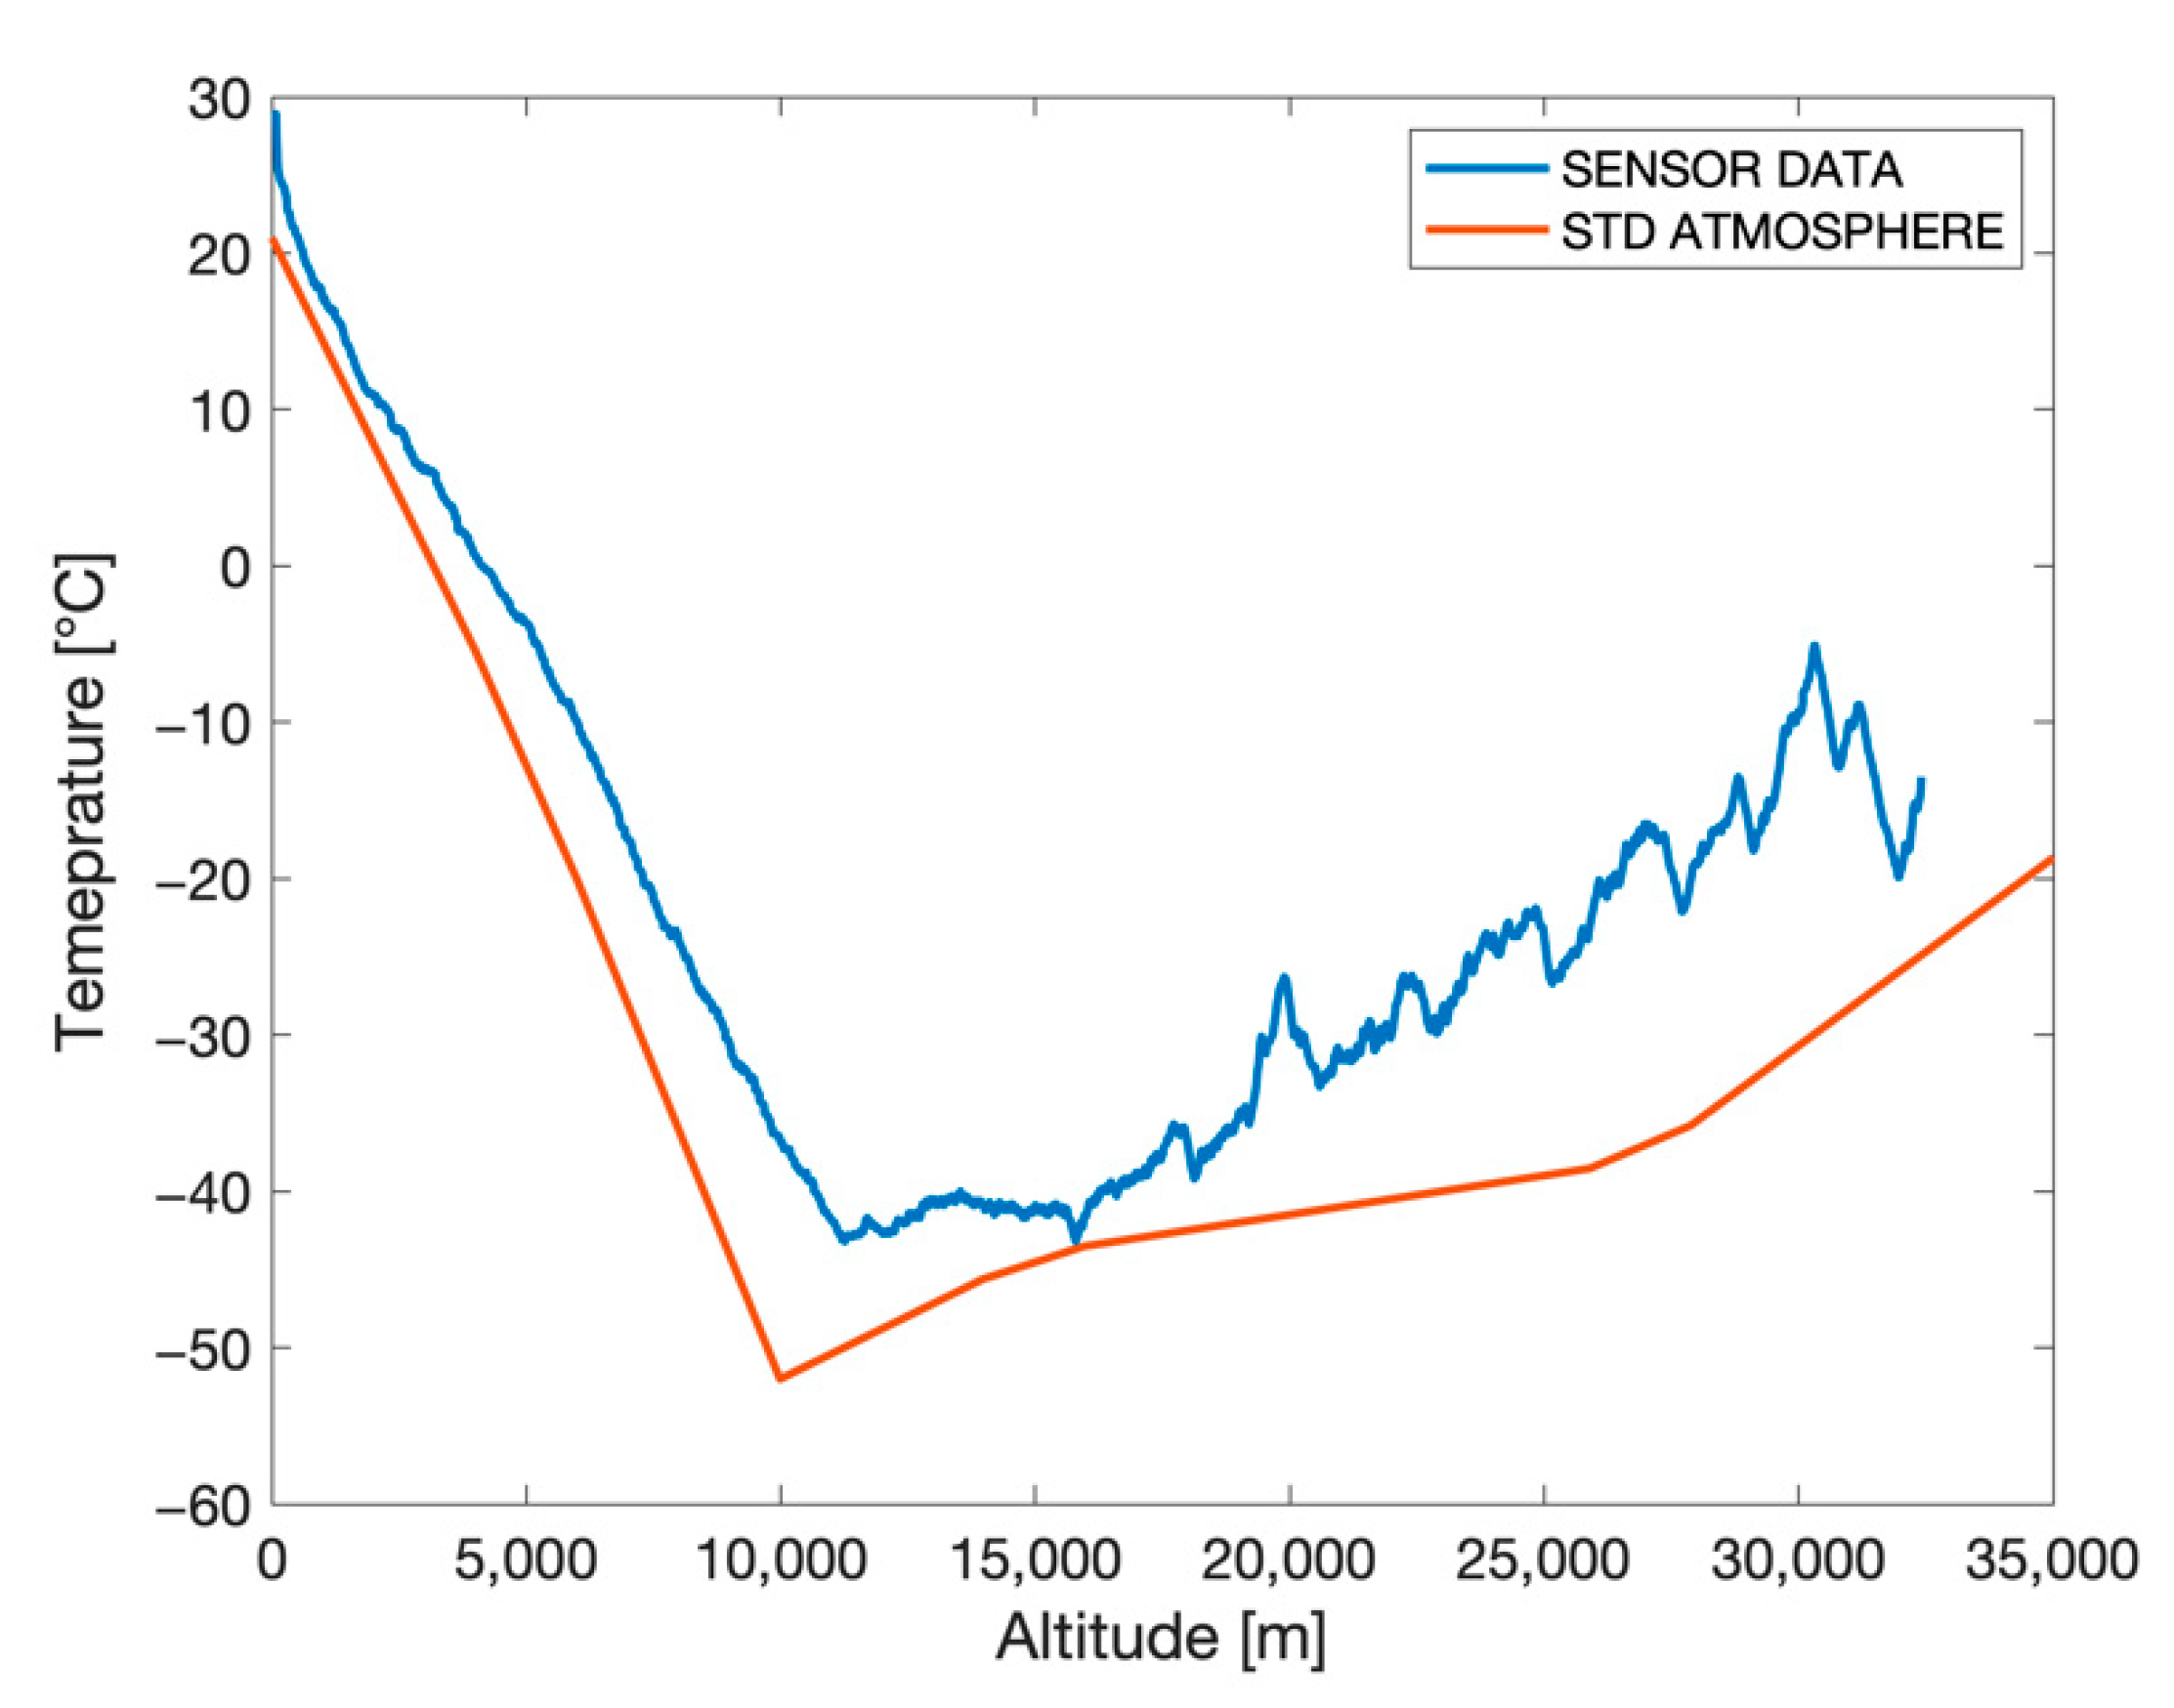
4.1. Internal and External Temperature

Ground tests revealed that the RF components dissipate a considerable amount of heat, so that no internal heater was needed for the other subsystems. During all five ISM-HAB flights, the temperature inside the payload stayed between 30 and 52 °C, while the outside temperature reached a minimum of 46 °C (Figure 11), with polystyrene proving to be quite effective as a thermal insulator. Therefore, all the electronic components inside the payload stayed well inside their operative temperature range.
Throughout the flights, the recorded external temperatures were consistently higher than those of the standard atmosphere (Figure 12). It remains to be assessed whether this corresponds to reality or it is due to a bias of some kind in the sensors.

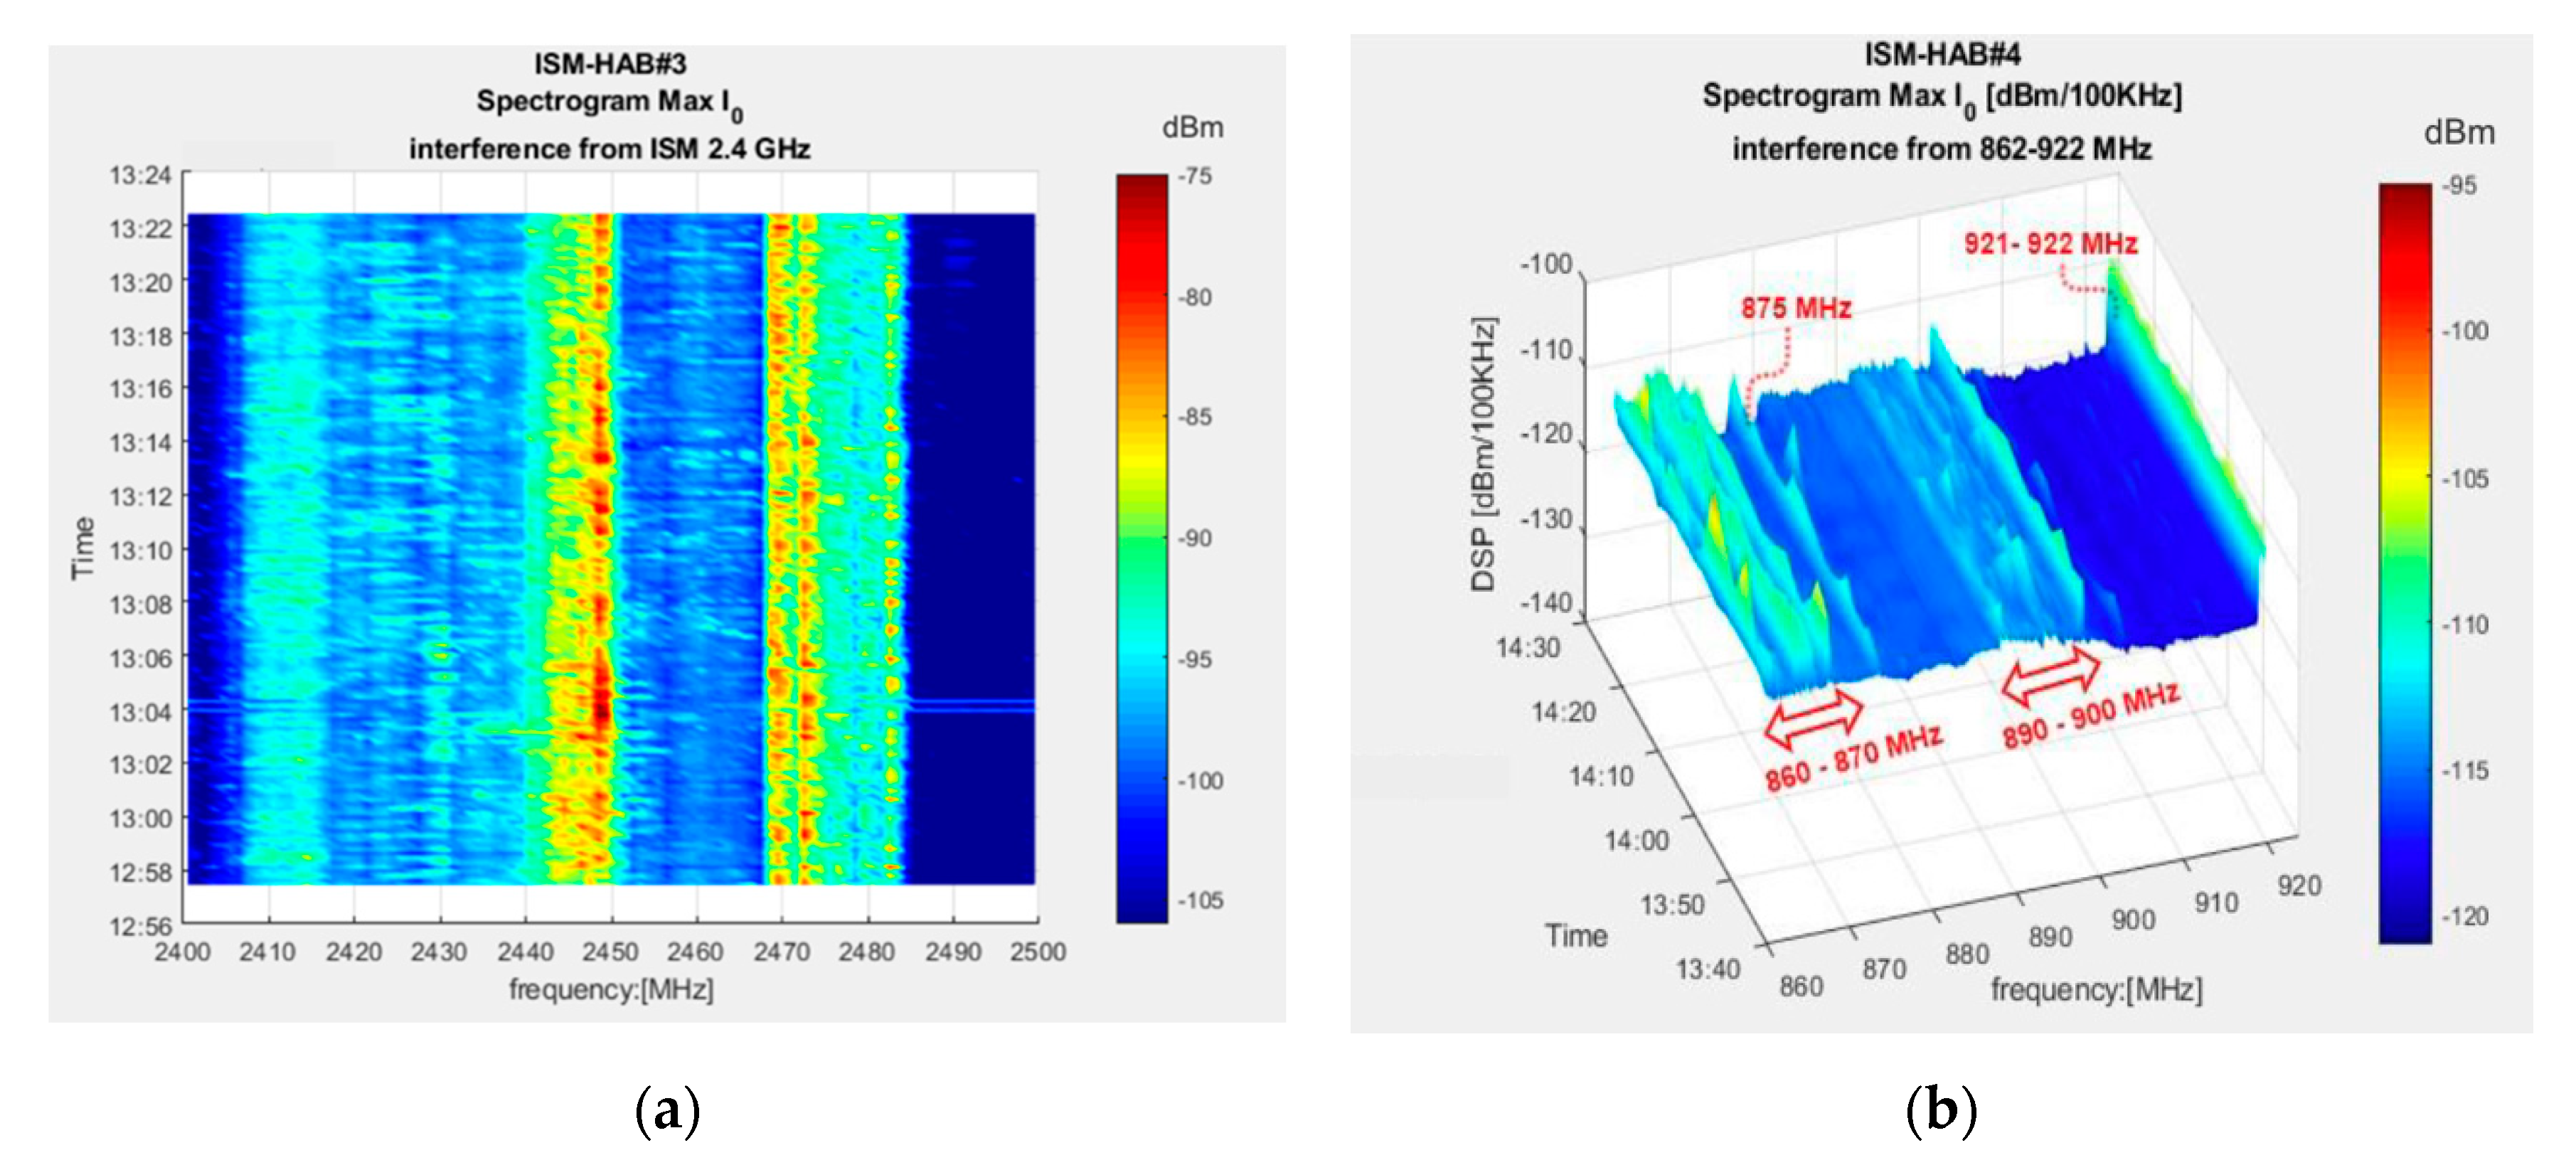
4.2. RF Measurements

Figure 13 shows the spectrograms of the recorded signals, reported at the antenna connector output, for the ISM 2.4 GHz band and for the 862–922 MHz band. The spectrograms show the spectral power density of the ground-produced ISM noise that was measured during the HAB flights. It can be seen that some frequency ranges are characterized by the near absence of interferent emissions, while others are associated with relatively high RF power. In particular, no significant emissions were recorded in the band 900–917 MHz (US-licensed band) and in the band 2.485–2.5 GHz, of common use in Europe. Such sub-intervals of the ISM bands are therefore potentially suited for a dedicated IoT application making use of the LEO satellite without little or no risk of being affected by ground-generated interference.
The interferences measured at 32 km can be appropriately scaled via software in order to estimate the interferences collected by a spacecraft in orbit at an altitude of 600 km (as in a typical LEO small satellite mission). This provides useful indications for the design of a future IoT constellation in LEO.

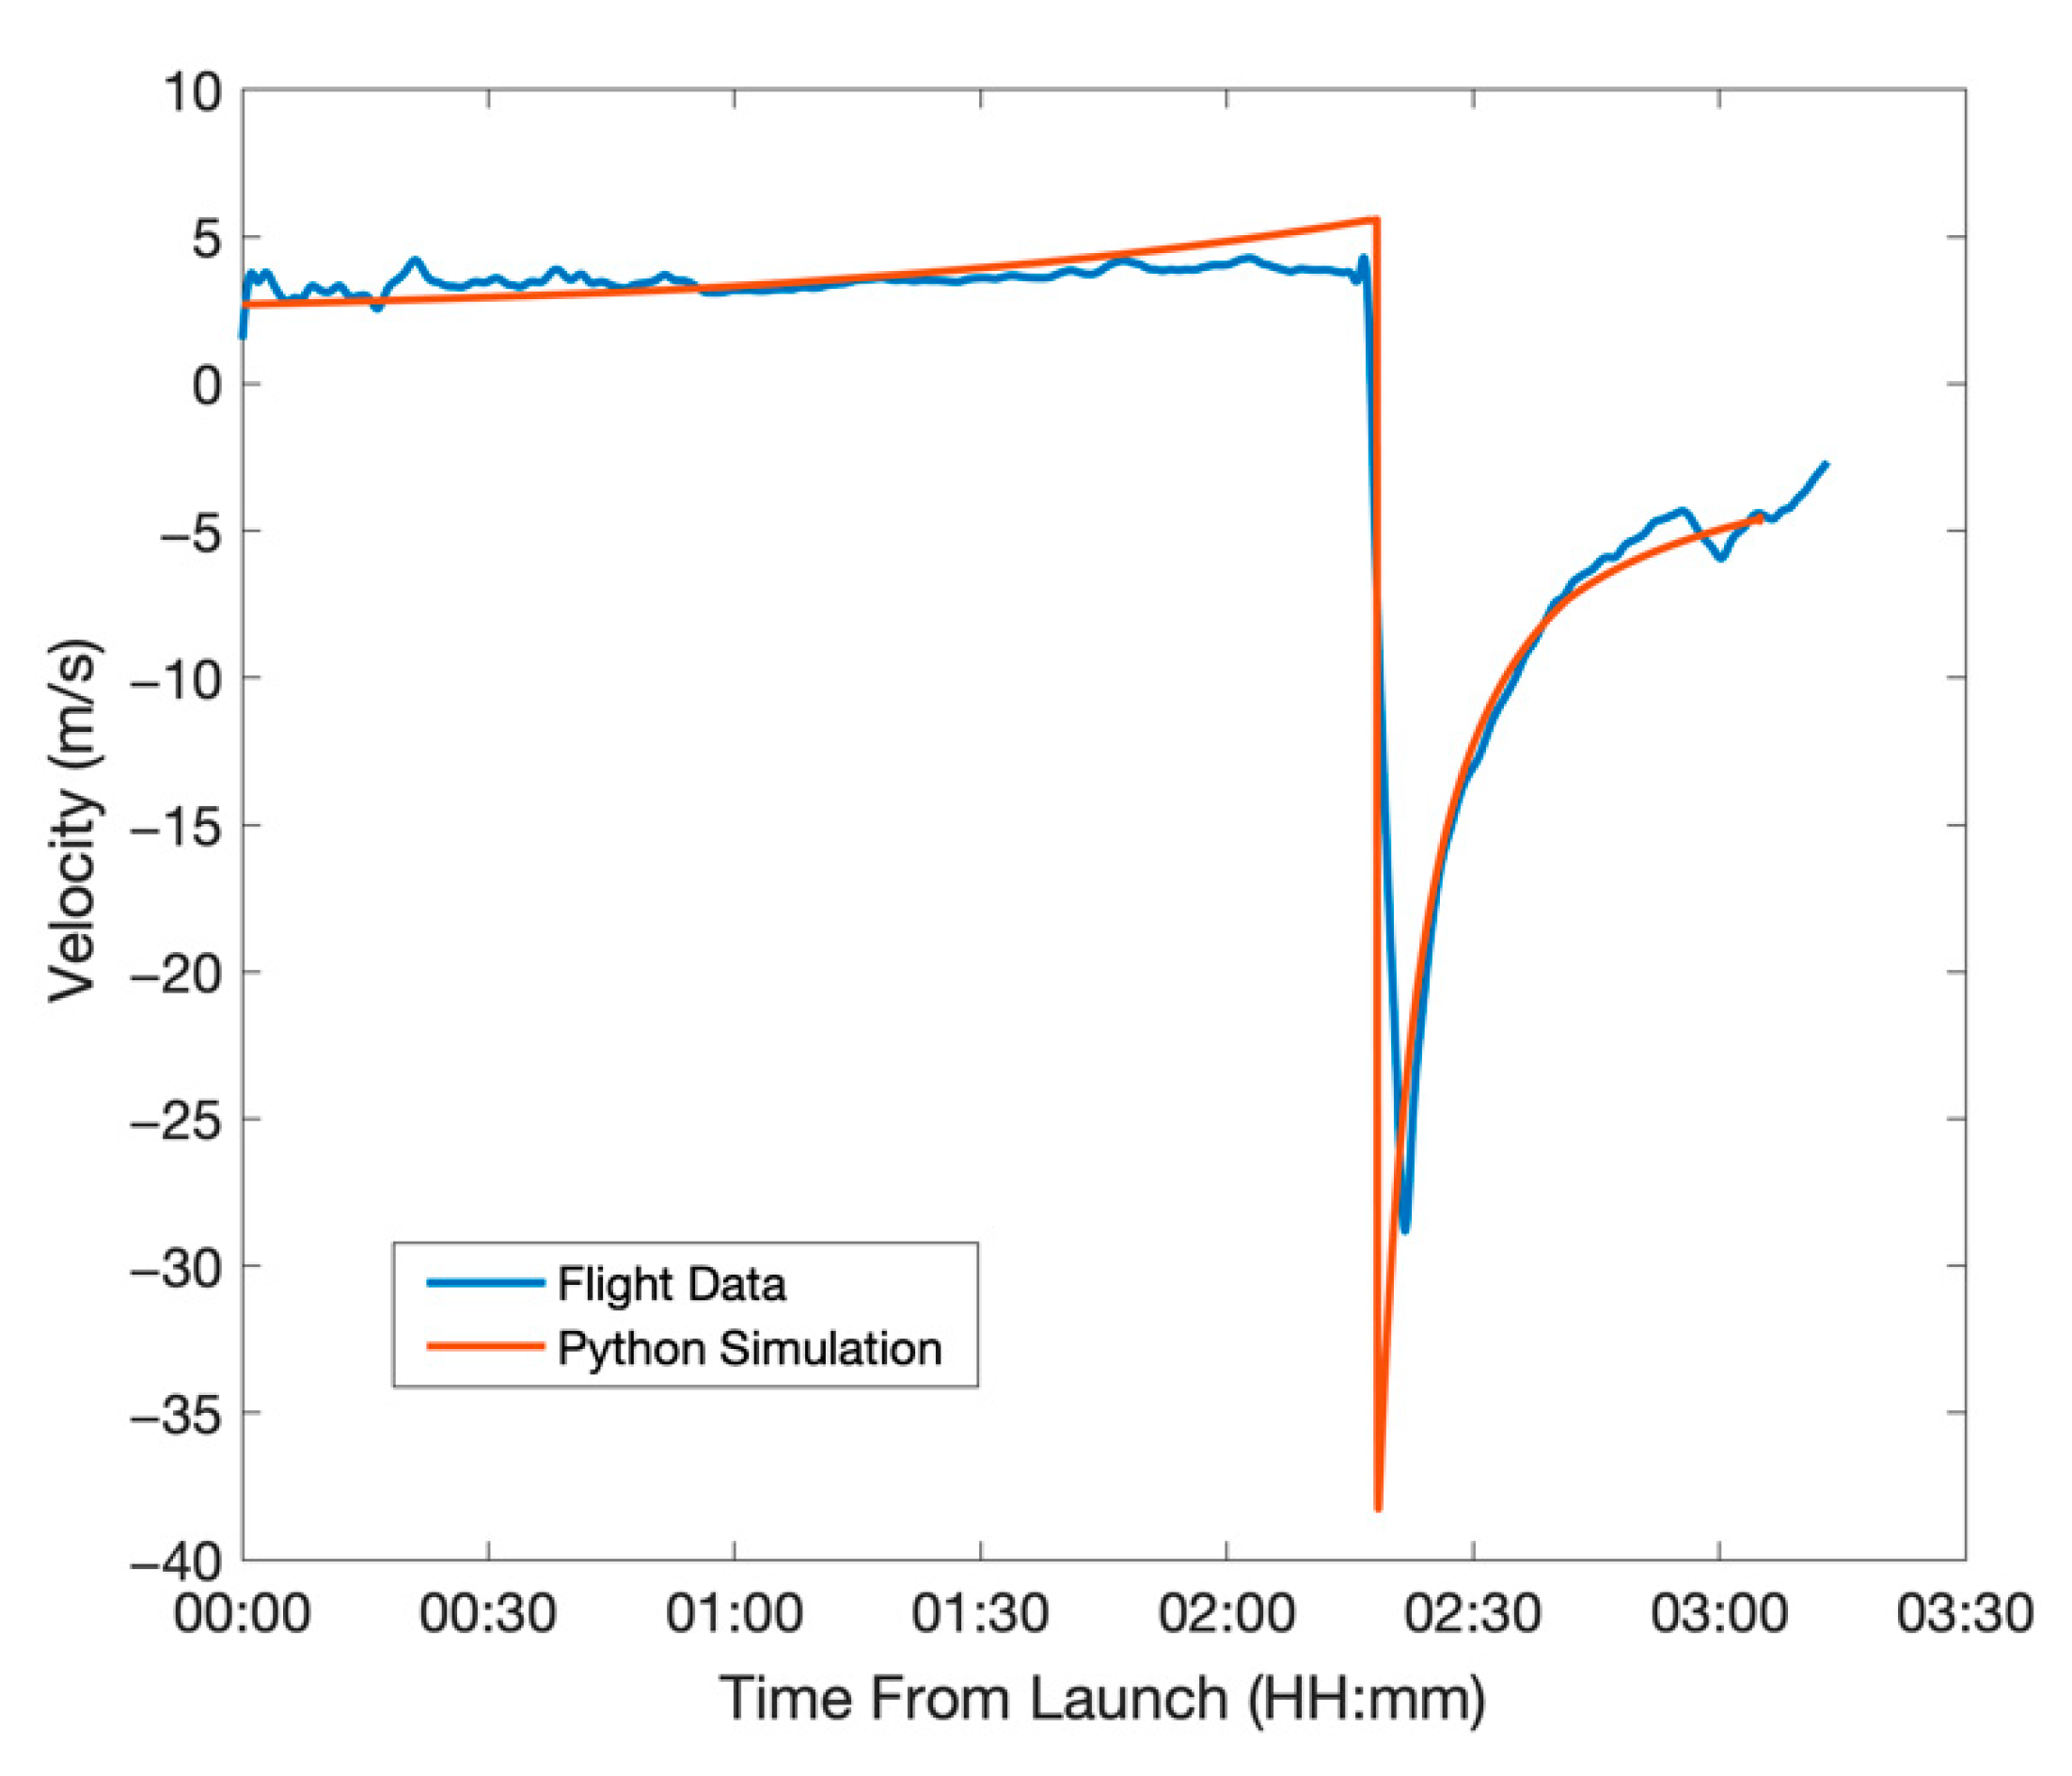
4.3. Vertical Motion

The rate of ascent of the balloons during all the missions was almost constant, as shown in Figure 14. This is believed to be due to the fact that while the balloon rises, the air becomes increasingly rarefied and its density drops. In the same way, the balloon expands, exposing a larger cross-section. The two effects roughly compensate each other so that the rising speed is almost constant; therefore, the ascent rate depends essentially on the amount of lift initially imposed on departure. If the weather is rainy or very cloudy, the water and the ice that the payload will encounter during ascent may cause an early burst at an altitude of about 20 km instead of the nominal 30–35 km.
Lower burst altitude means that the total distance travelled will be shorter, as happened with ISM-HAB#1 and ISM-HAB#2. If the burst happens too early, a larger portion of the balloon could remain attached to the payload, affecting the correct deployment of the parachute; in such conditions, the payload will descend more rapidly.
Some difficulties in predicting the ascent rate were encountered. Specifically, as it can be seen in Figure 15, the simulator slightly overpredicted the ascent rate, imposing an initial lift mass. Having set different lifts for each mission, and having achieved different ascent rates, we were eventually able to derive a calibration relationship for ascent rate vs. lift (Figure 16), that will be implemented in a future version of the predictor.

4.4. Horizontal Motion

Most of the distance travelled by the payload is covered inside the troposphere, where the strongest winds reside. This situation is clearly illustrated in Figure 17. The winds normally reach velocities of 80–90 km/h near 10 km altitude. With a limited amount of lift, the balloon will be subjected to these winds for a relatively long time, as it will reach its burst altitude only after much time, and this will make it travel for very long distances, thus reducing the likelihood of its recovery. We found that a good compromise is to set about 0.5 kg of lift, so that the balloon will reach its burst altitude as quickly as possible. This will reduce not only the distance traveled to the landing site but also the mission duration, making it more likely that the payload is recovered on the same day of the launch.

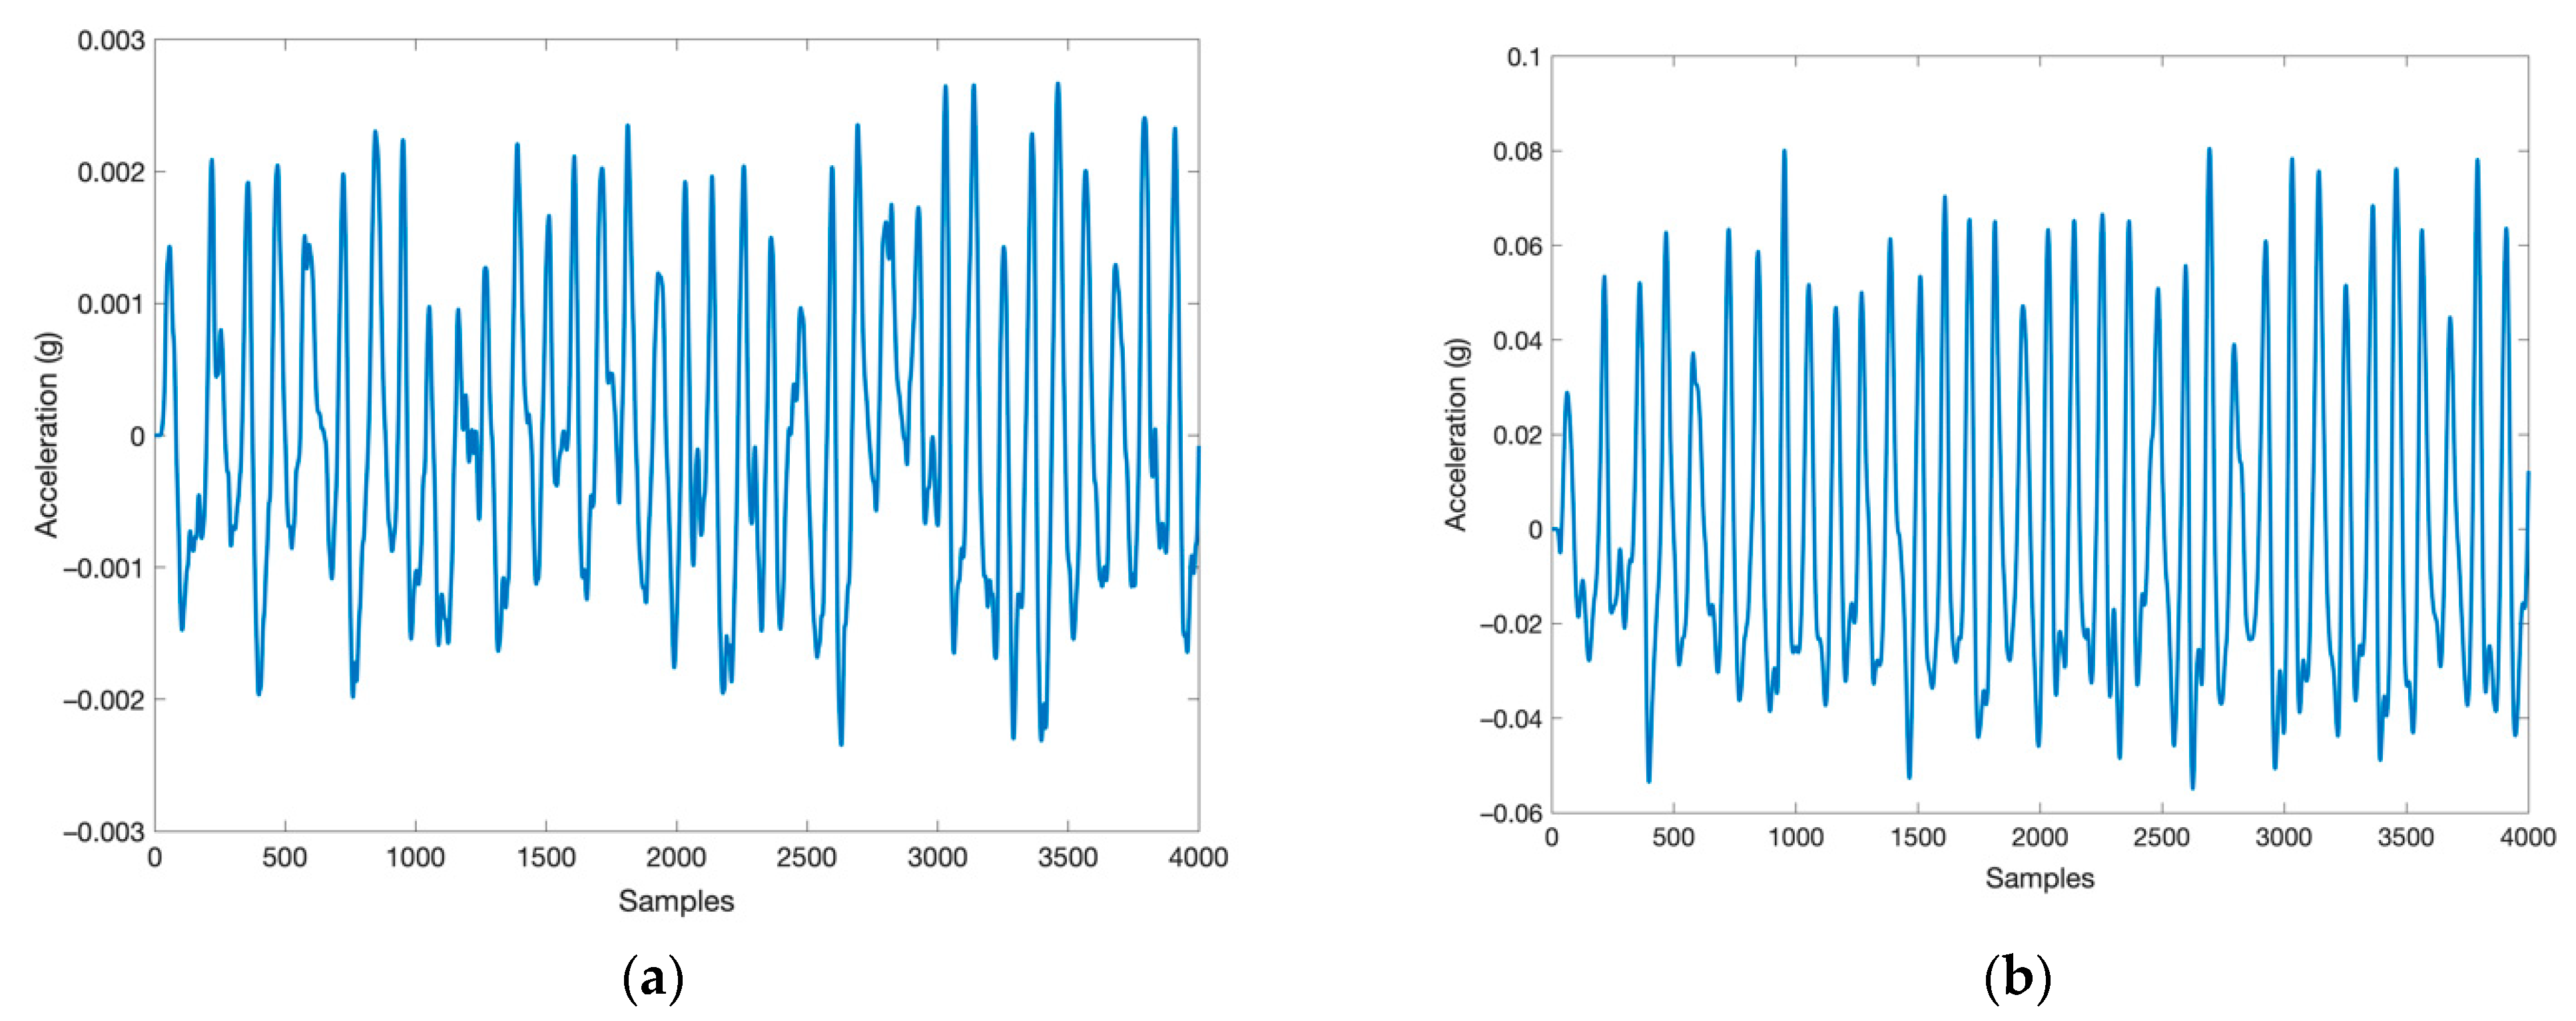
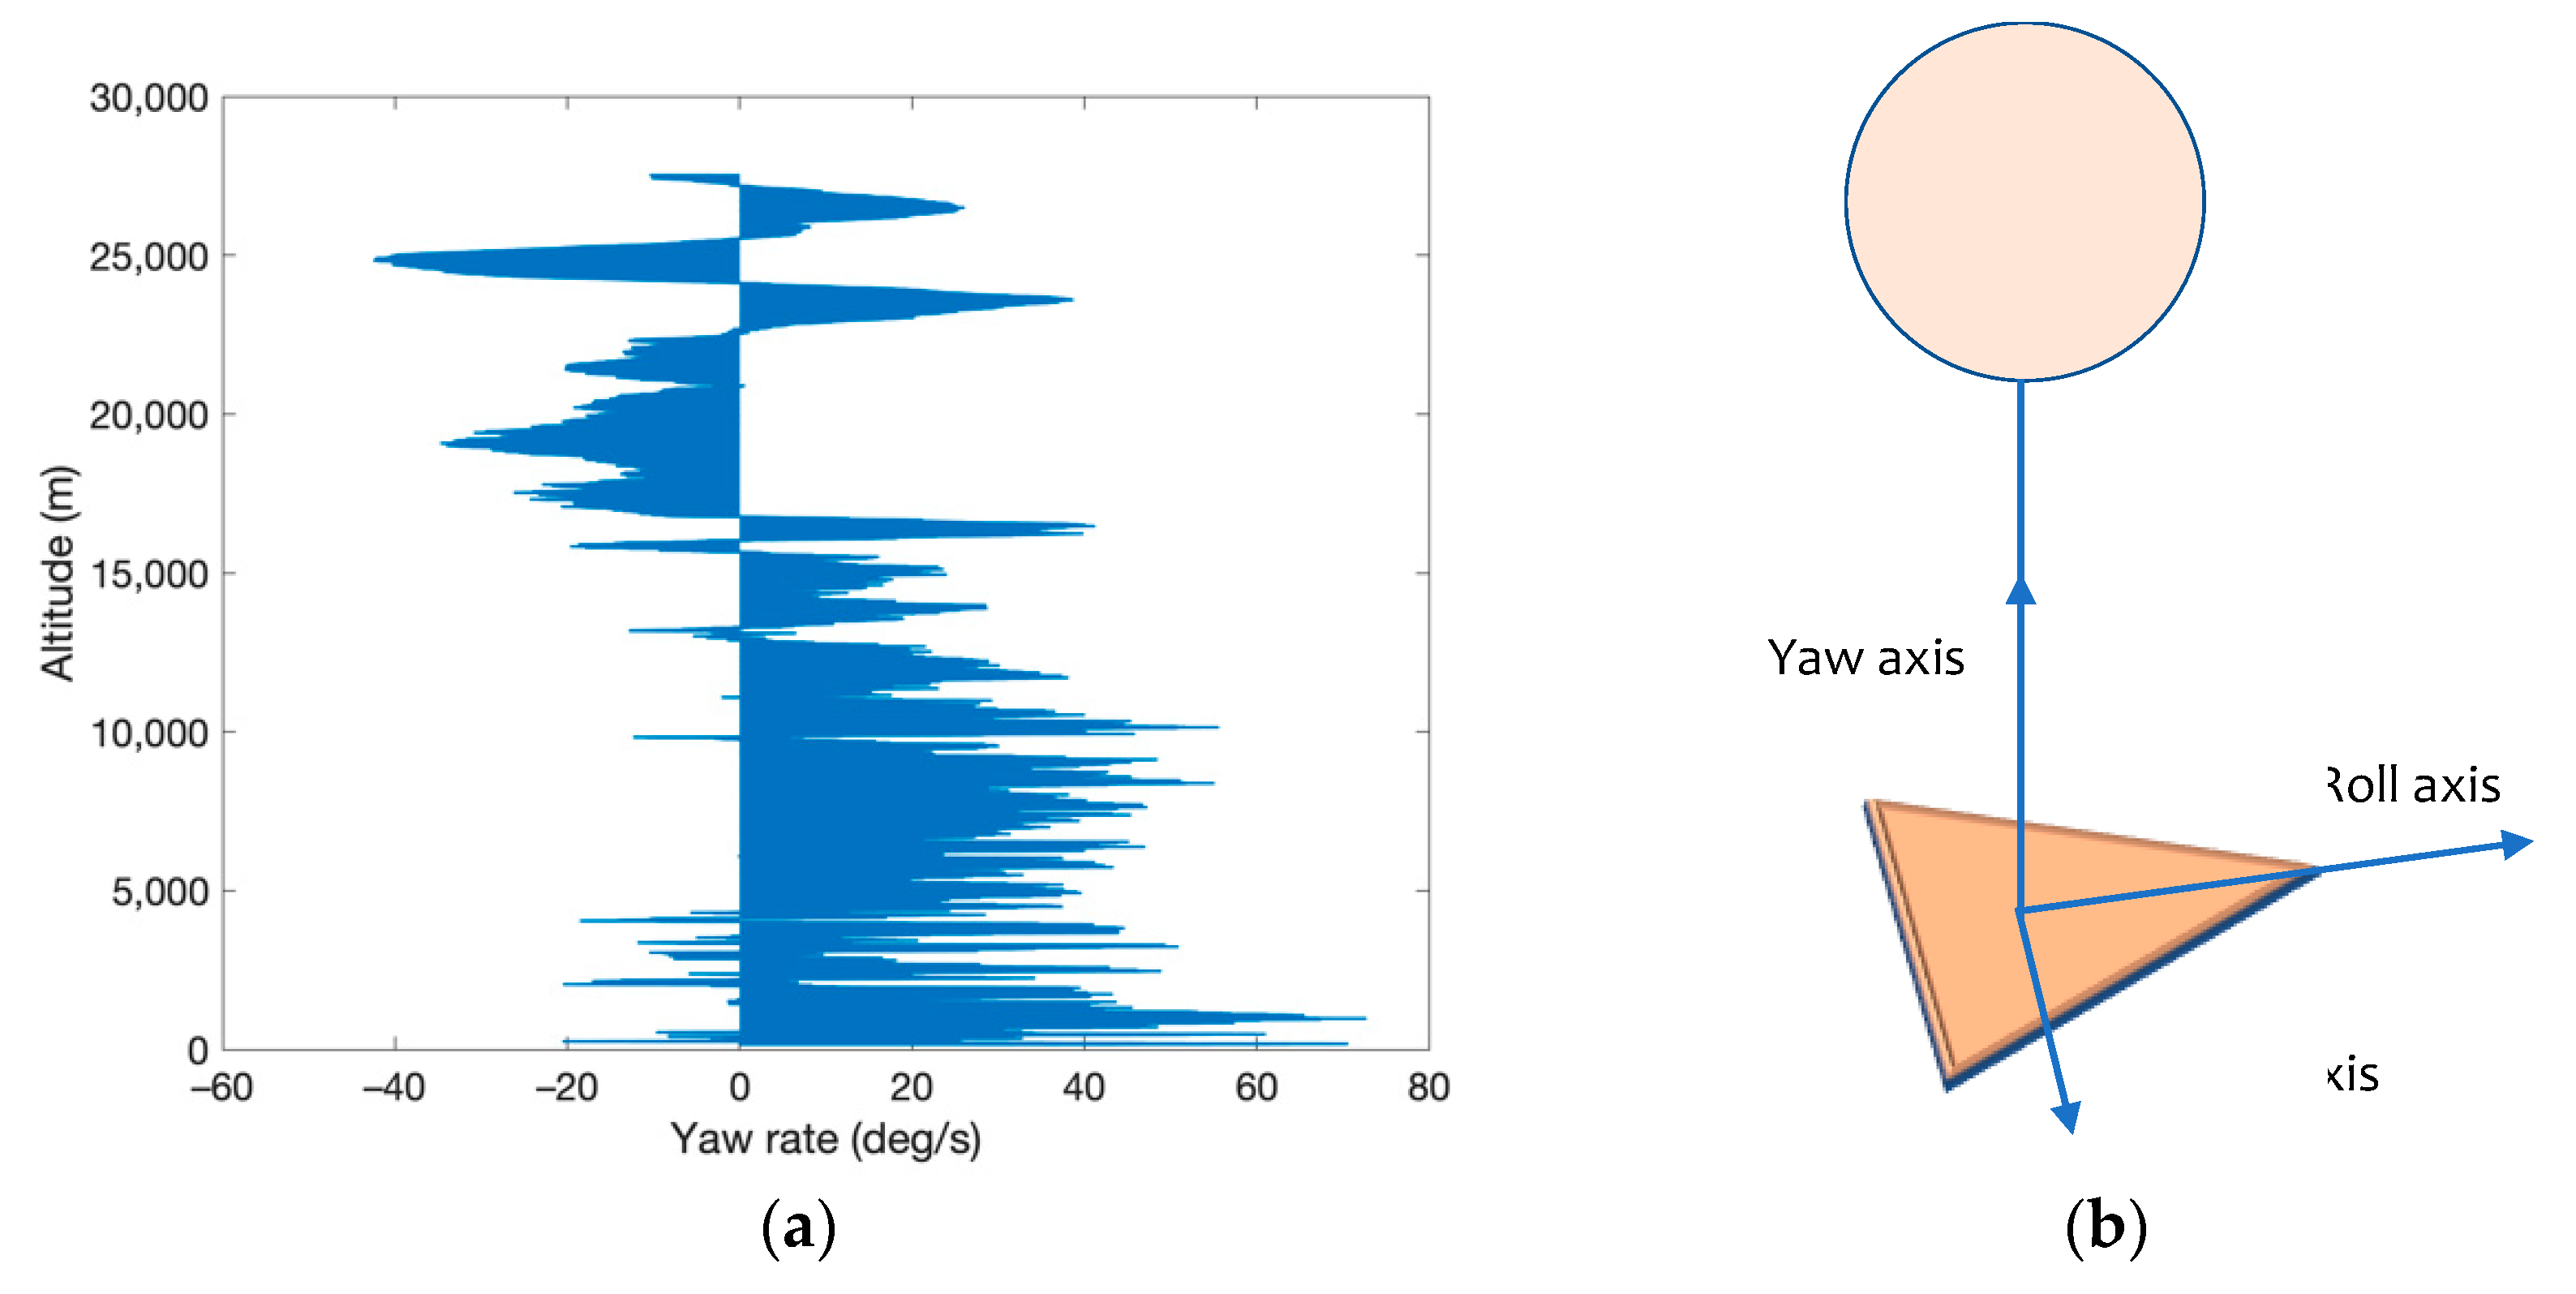
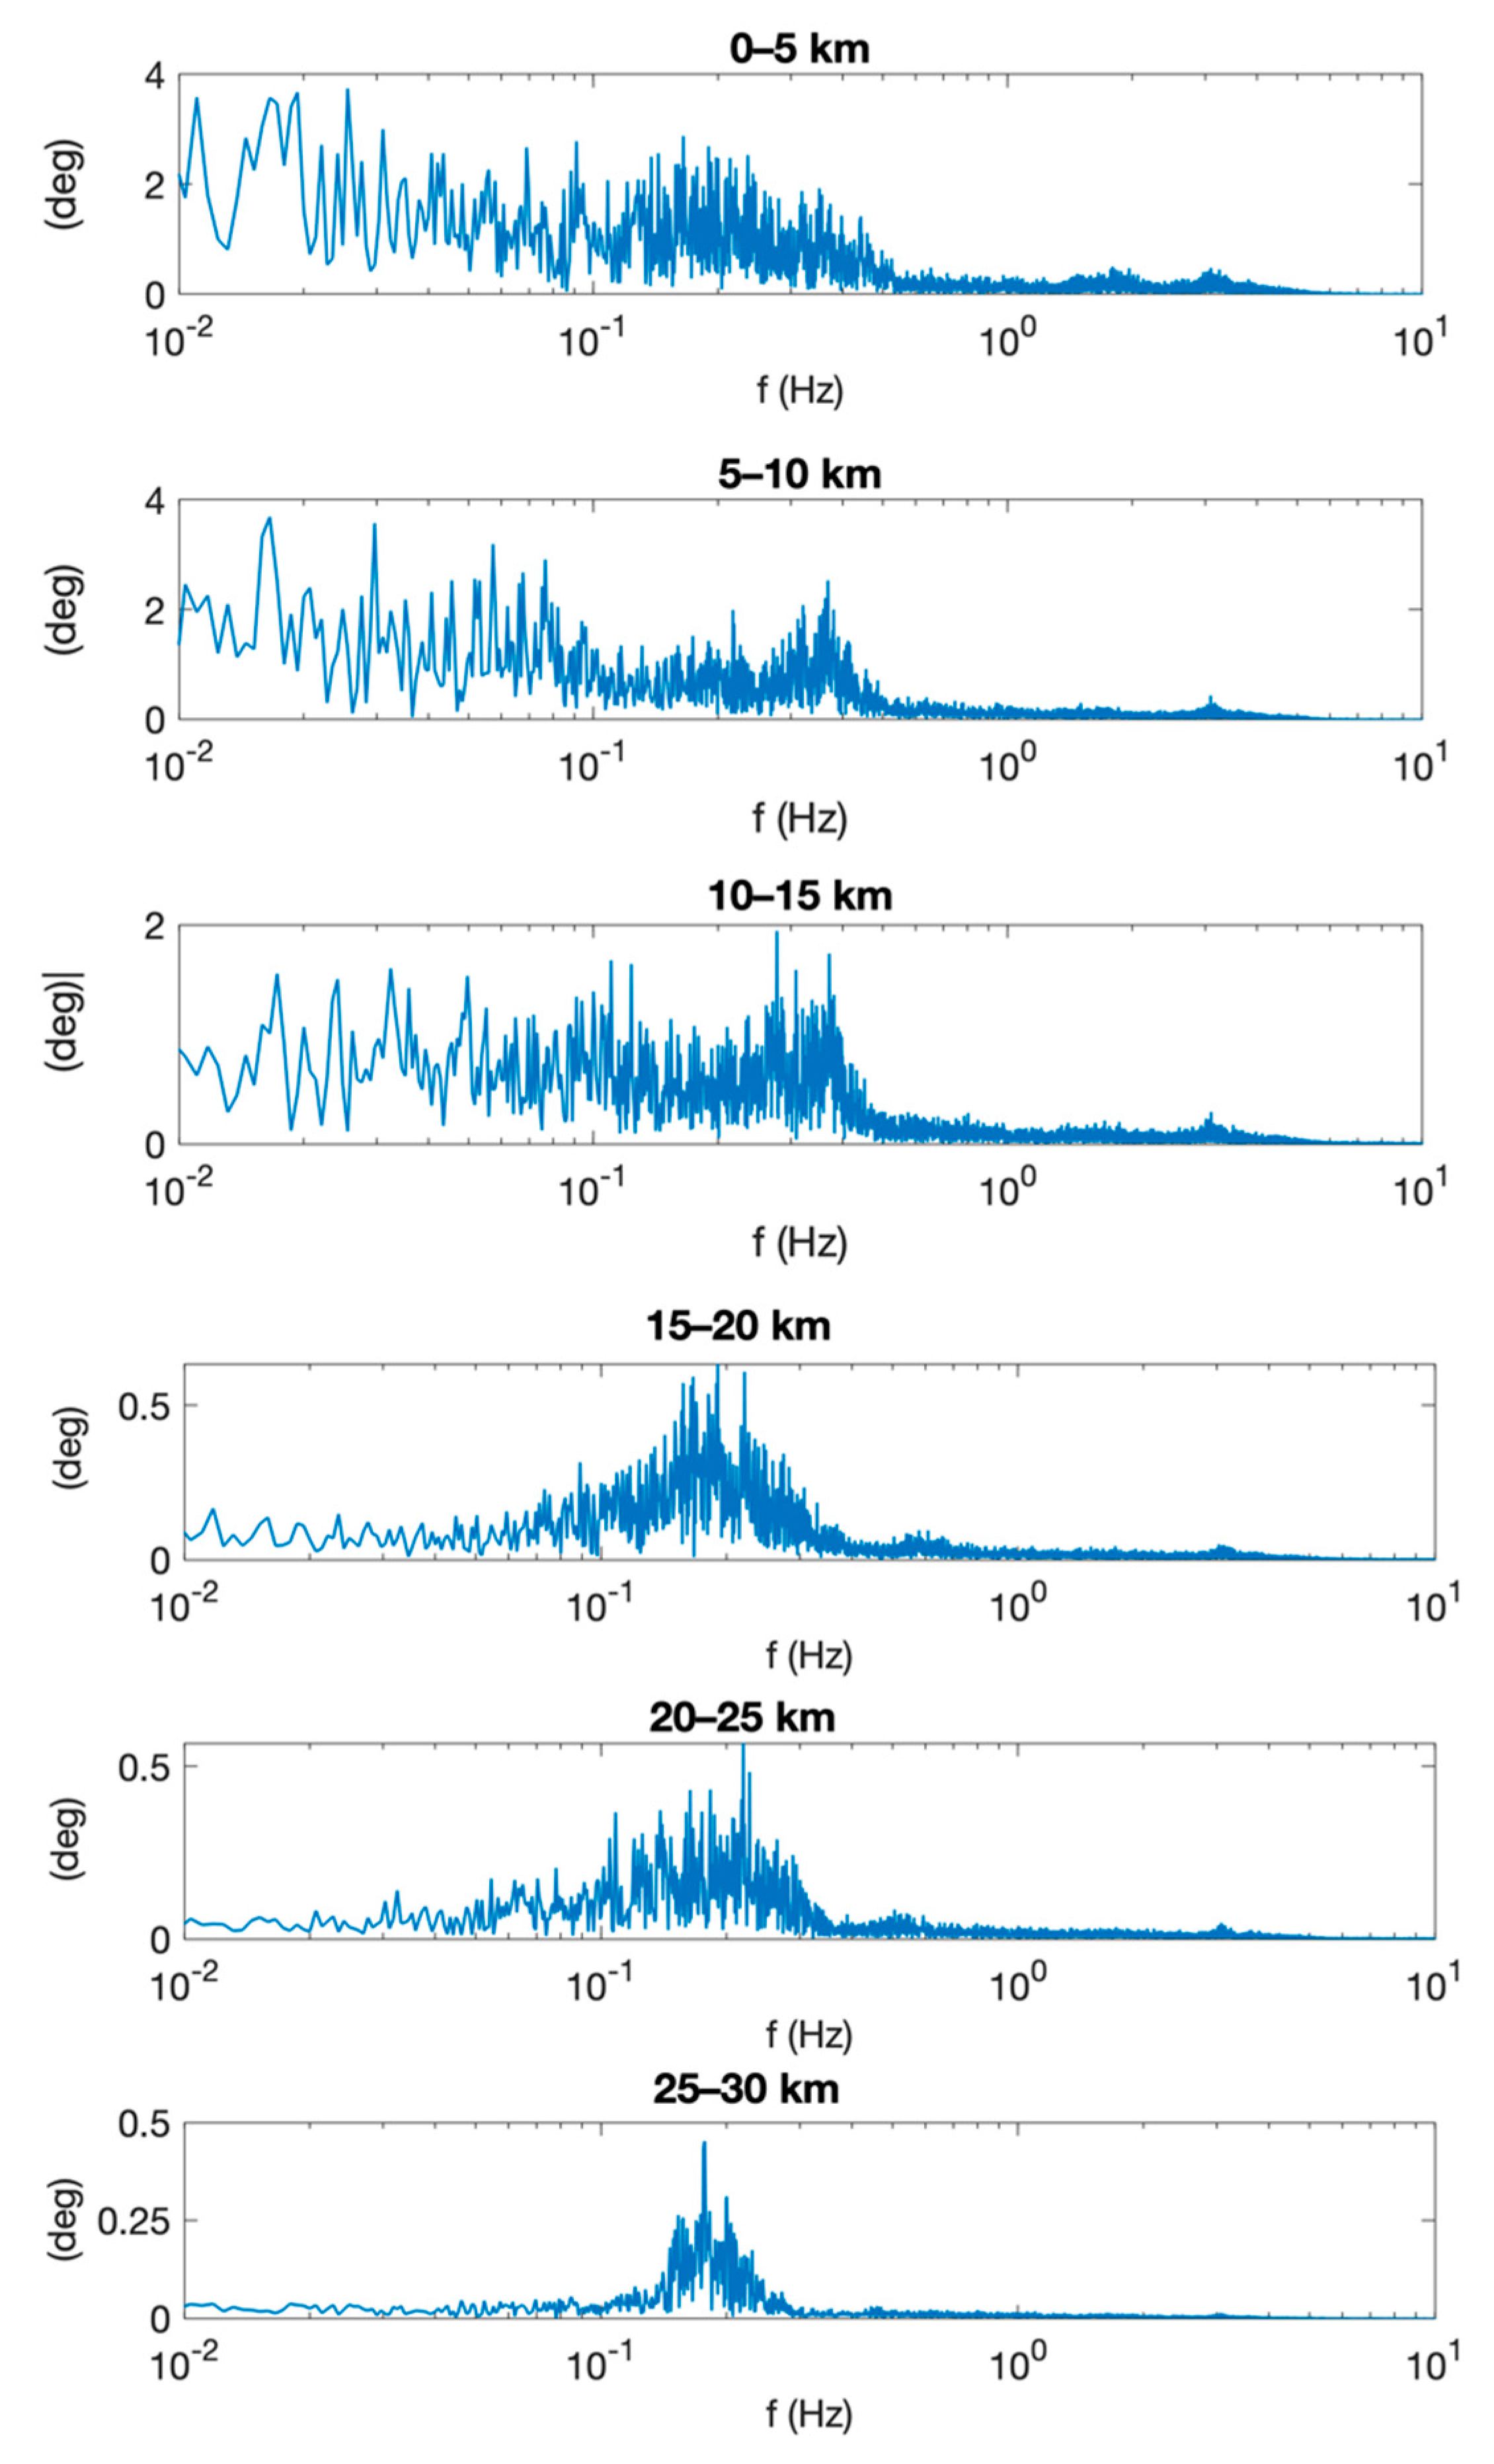
4.5. Dynamics: Acceleration, Spin, Oscillations

Accelerations were measured in the sensor body frame during all the mission duration with a sampling frequency of 15 Hz. The x and y axes correspond to horizontal accelerations, while the z-axis to the vertical acceleration (so that its average value is −1 g). The graph for the entire flight (Figure 18a) clearly shows the accelerations due to pre-launch handling; the ascent phase, characterized by a visible decrease in acceleration with increasing altitude and decreasing atmospheric density, and the balloon burst, followed by the turbulent descent phase that ends with the landing, with a sudden crash acceleration of up to almost 2.5 g.
By plotting the x-axis acceleration graph with respect to altitude (Figure 18b), it is noticeable that the amplitude of acceleration undergoes a significant decrease from about 12 km of altitude upwards, except for a brief turbulence around the altitude of 16 km.
To get a better understanding of the dynamics at high altitude, a signal composed of 4000 samples was extracted, corresponding to 274 s of flight close to the bursting altitude. The sample was then processed with a MATLAB script: first, de-trending was performed in order to assess the real amplitudes of the oscillations. De-trending was implemented by interpolating the signal with a low-order polynomial and then subtracting it from the original raw signal. Then, the high-frequency noise, which is typical of MEMS accelerometers, was removed with an exponential binomial filtering. The result was a periodic signal, with 35 peaks with values of 1.8 × 10⁻³ g and an average period of 5.82 s (Figure 19a). This is very close to the period of a pendulum in vacuum with a chord length equal to the distance between the balloon and the payload, showing that at altitudes above 23–24 km, the gondola essentially behaves like a free pendulum, unperturbed by atmospheric drag. For the z-axis, a similar analysis shows that the vertical motion follows a similar pattern but with amplitude peaks of up to 0.08 g (Figure 19b). As values were very similar for all flights, we conclude that during motion in near space, our sounding balloons exhibit an acceleration along the vertical body axis about 40 times larger than the acceleration on the horizontal axes. This is believed to be due to the coupling of buoyancy with the intrinsic elasticity of the natural rubber balloon. No method is presently available to suppress or compensate these vertical oscillations. If confirmed in future experiments, this issue shall be taken into account for future utilization of the HABs for applications where a stabilized platform is needed, such as astronomical observation or optical communications.
During the early stages of ascent, the yaw rate is very variable, although almost always in the same direction (Figure 20a). The motion is essentially random and there are no particular trends emerging from the data in the early stages of the ascent. Above 22.5 km, yaw amplitude decays from initial peaks of 40 deg/s to almost zero before burst, while direction reverses regularly. This behavior was also verified by the video recorded buy the onboard camera, showing rotation periods of 8–9 s, consistent with the measured yaw rate. The magnitude of the oscillations suggest that a reaction wheel might be used to stabilize yaw pointing at high altitudes.
During ascent, the payload is subjected to a variety of dynamic actions due to air drag and to the pull of the balloon, resulting in oscillations of the gondola. With respect to the axes shown in Figure 20b, the gondola undergoes pitch and roll oscillations while it rotates around the yaw axis. Within the IMU, a magnetometer is used, along with the gyro and rate sensors, to determine the heading of the roll axis and the rotation around the yaw axis. As shown in Figure 21a, the ascent phase is characterized by small oscillations of amplitude decreasing with altitude. Figure 21b shows a detail of pitch oscillation close to burst altitude. At burst, the payload undergoes a series of upturns, and this was also confirmed by the recorded videos. Contrary to ascent, the descent phase, which is dominated by the parachute dynamics, is quite shaky. Pitch and roll oscillations have a similar behavior.
Given the pitch, roll and yaw attitude angles measured by the IMU on the payload, it is possible to reconstruct the projected ground path as seen by the bottom side of the payload, where the antenna was mounted. To this end, a MATLAB script was written which first computes the deviation from the local vertical after pitch and roll, then projects it in the appropriate direction determined through the yaw measurement from the magnetometer, and finally outputs a .kml file that can be imported for visualization in Google Earth Pro. The end result, shown in Figure 22, is the ground track of the antenna boresight, which helps in determining the location of the source of the RF emission received.
From a Fourier analysis of the pitch oscillations, it appears that there are no clearly detectable, dominant characteristic frequencies in angular motion during the first phases of the ascent (Figure 23). At low altitude, the air turbulence produces a pitch signal that is essentially random. On the contrary, in the stratosphere, a characteristic frequency is clearly visible. As expected, this frequency (0.178 Hz) is equal to the free oscillation frequency of a pendulum in empty space with a length equal to the distance between the payload and the balloon. An attitude stabilization system would enhance the operational capability of the platform and make it well-suited to a large variety of technology experiments of interest for future space missions. If such attitude stabilization is to be introduced, the most suitable phase of the mission for it would definitely be over 25 km altitude, where environmental torque disturbances are at a minimum and attitude stabilization could prove most effective.

5. Conclusions and Future Work

The five ISM-HAB missions flew successfully, providing valuable data regarding ISM interference and the dynamics of the balloon with a moderate personnel effort and with relatively low-cost hardware. The payload was easily refurbished and updated from one mission to the other. We conclude that the sounding balloon platform concept is particularly well-suited for testing and experimentation in telecommunications.
The landing site location is impossible to predict with accuracy sufficient to ensure that the payload will be accessible for recovery; therefore, there is a clear need for active control of the payload gondola trajectory at re-entry, to ensure that undesired landing zones are avoided and, possibly, to land the payload in a pre-determined area. This could be achieved by placing the payload, or at least the data storage unit, on a recovery vehicle such as a fixed-wing glider or a multi-rotor drone, so that the final part of landing is performed in a controlled way. Such solution, however, would introduce a large penalty in the tiny mass budget of the sounding balloon system. A more attractive solution is the use of a steerable parafoil in place of the passive parachute, controlled by autonomous navigation during the last phase of descent. This is the object of future work to be carried out towards the achievement of a fully functional system. In case payload hardware recovery is not mandatory, data transfer can be done in near-real time with suitable low-mass radio equipment, such as S-band Cubesat-like transceivers, or—for small data rates—by means of low power, long-distance IoT telecommunication techniques, such as LoRa.
Within the frame of this project, a first attempt at the characterization of the dynamic oscillatory environment of the platform was made. For the future, we plan to enhance the collection of dynamic data using inertial sensors of better sensitivity and accuracy, with the ultimate goal of making available a payload attitude stabilization system for the high-altitude portion of the flight. With such a feature, the possibilities of this platform would extend to other research areas such as astronomy, Earth imaging and to space-related technology development and demonstration.

Author Contributions

Conceptualization, S.M. and M.G.; Data curation, M.G.; Investigation, M.G.; Methodology, S.M.; Project administration, S.M.; Writing—original draft, S.M. and M.G.; Writing—review and editing, S.M. All authors have read and agreed to the published version of the manuscript.

Funding

This research received no external funding.

Acknowledgments

This work was carried out in the frame of a collaboration between Eutelsat SA, MBI Srl and two Departments of the University of Pisa: DII-Information Engineering and DICI-Aerospace Division. The authors gratefully acknowledge the help of Marco Andrenacci, Attilio Vaccaro, Michele Gammone and Leonardo Nanna of MBI Srl.

Conflicts of Interest

The authors declare no conflict of interest.

References

  1. International Telecommunication Union. Radio Regulations; International Telecommunication Union: Geneva, Switzerland, 2016; Volume 1, p. 66. ISBN 978-92-61-19121-4. [Google Scholar]
  2. Centenaro, M.; Vangelista, L.; Zanella, A.; Zorzi, M. Long-range communications in unlicensed bands: The rising stars in the IoT and smart city scenarios. IEEE Wirel. Commun. 2016, 23, 60–67. [Google Scholar] [CrossRef] [Green Version]
  3. Sornin, N. LoRaWAN 1.1 Specification. Available online: https://lora-alliance.org/sites/default/files/2018-04/lorawantm_specification_-v1.1.pdf (accessed on 18 April 2020).
  4. What Is Sigfox? Available online: https://www.sigfox.com/en/what-sigfox/technology (accessed on 18 April 2020).
  5. Cassidy, M. Project Loon: GoogleX Lab’s Project to Bring Internet to the World via High Altitude Balloons. Presentation to the Space Technology Innovations Conference. 2014. Available online: https://livestream.com/internetsociety/spacetechnology/videos/40472692 (accessed on 18 April 2020).
  6. Lauridsen, M.; Vejlgaard, B.; Kovacs, I.Z.; Nguyen, H.; Mogensen, P. Interference Measurements in the European 868 MHz ISM Band with Focus on LoRa and SigFox. In Proceedings of the IEEE Wireless Communications and Networking Conference, San Francisco, CA, USA, 19–22 March 2017; pp. 1–6. [Google Scholar] [CrossRef] [Green Version]
  7. Mamadou, A.M.; Toussaint, J.; Chalhoub, G. Interference Study of Coexisting IEEE 802.11 and 802.15.4 Networks. In Proceedings of the 8th International Conference on Performance Evaluation and Modeling in Wired and Wireless Networks, Paris, France, 26–28 November 2019; pp. 1–5. [Google Scholar] [CrossRef]
  8. Polak, L.; Milos, J. Performance analysis of LoRa in the 2.4 GHz ISM band: Coexistence issues with Wi-Fi. Telecommun. Syst. 2020. [Google Scholar] [CrossRef]
  9. Sandoval, R.M.; Garcia-Sanchez, A.-J.; Garcia-Sanchez, F.; Garcia-Haro, J. Evaluating the More Suitable ISM Frequency Band for IoT-Based Smart Grids: A Quantitative Study of 915 MHz vs. 2400 MHz. Sensors 2017, 17, 76. [Google Scholar] [CrossRef] [PubMed] [Green Version]
  10. Eutelsat Commissions ELO, Its First Low Earth Orbit Satellite Designed for the Internet of Things. Available online: http://news.eutelsat.com/pressreleases/eutelsat-commissions-elo-its-first-low-earth-orbit-satellite-designed-for-the-internet-of-things-2440770 (accessed on 18 April 2020).
  11. Yajima, N.; Izutsu, N.; Imamura, T.; Abe, T. Scientific Ballooning, 1st ed.; Springer: New York, NY, USA, 2009; ISBN 978-0-387-09725-1. [Google Scholar] [CrossRef]
  12. Alexander, P.; de la Torre, A. Uncertainties in the measurement of the atmospheric velocity due to balloon-gondola pendulum-like motions. Adv. Space Res. 2011, 47, 736–739. [Google Scholar] [CrossRef]
  13. Aubin, F.; Bayman, B.; Hanany, S.; Franco, H.; Marsh, J.; Didier, J.; Miller, A.D. Torsional balloon flight line oscillations: Comparison of modelling to flight data. Adv. Space Res. 2017, 60, 702–708. [Google Scholar] [CrossRef] [Green Version]
  14. Safonova, M.; Nirmal, K.; Sreejith, A.G.; Satpodar, M.; Suresh, A.; Prakash, A.; Mathew, J.; Murthy, J.; Anand, D.; Kapardhi, B.V.N.; et al. Measurements of Gondola Motion on a Stratospheric Balloon Flight. Indian Institute of Astrophysics Report No. IIA-TRS-1616, Technical Report Series No. 16. 2016, pp. 1–9. Available online: https://arxiv.org/pdf/1607.06397.pdf (accessed on 18 April 2020).
  15. StratoGear, StratoTrack—Reliable Worldwide APRS Tracking: User Guide. Available online: https://www.stratogear.com/s/StratoTrack-User-Guide-V20.pdf (accessed on 20 April 2020).
  16. Globalstar: SPOT Trace. Available online: https://www.globalstar.com/en-gb/products/spot/spot-trace (accessed on 20 April 2020).
  17. High Altitude Science—Eagle Flight Computer. Available online: https://www.highaltitudescience.com/products/eagle-flight-computer (accessed on 20 April 2020).
  18. Ettus Research, USRP B200mini-i. Available online: https://www.ettus.com/all-products/usrp-b200mini-i-2/ (accessed on 20 April 2020).
  19. LSM9DS1—iNEMO Inertial Module: 3D Accelerometer, 3D Gyroscope, 3D Magnetometer. Available online: https://ozzmaker.com/wp-content/uploads/2017/11/LSM9DS1.pdf (accessed on 20 April 2020).
  20. Renegar, L.W. A Survey of Current Balloon Trajectory Prediction Technology. In Proceedings of the 2017 Academic High-Altitude Conference, University of Minnesota, Twin Cities, MN, USA, 27–28 October 2017; Available online: https://via.library.depaul.edu/ahac/2017/poster2/3/ (accessed on 18 April 2020).
  21. Fields, T.; Heninger, M.; LaCombe, J.; Wang, E. In-flight Landing Location Predictions using Ascent Wind Data for High Altitude Balloons. In Proceedings of the AIAA Balloon Systems Conference, Daytona Beach, FL, USA, 25–28 March 2013. [Google Scholar] [CrossRef] [Green Version]
  22. Farley, R.E. BalloonAscent: 3-D Simulation Tool for the Ascent and Float of High-Altitude Balloons. In Proceedings of the 5th ATIO and 16th Lighter-Than-Air Sys Tech. and Balloon Systems Conferences, Arlington, VA, USA, 26–28 September 2005. [Google Scholar] [CrossRef] [Green Version]
  23. Gallice, A.; Wienhold, F.G.; Hoyle, C.R.; Immler, F.; Peter, T. Modeling the ascent of sounding balloons: Derivation of the vertical air motion. Atmos. Meas. Tech. 2011, 4, 2235–2253. [Google Scholar] [CrossRef] [Green Version]
  24. Smith, T.P. Balloon Calculations. Available online: http://northstar-www.dartmouth.edu/~klynch/pmwiki-gc/uploads/BalloonCalulations.pdf (accessed on 18 April 2020).
  25. NOAA Air Resources Laboratory—Current & Forecast Meteorology. Available online: https://www.ready.noaa.gov/READYcmet.php (accessed on 18 April 2020).
Figure 1. The Industrial-Scientific-Medical High Altitude Balloon (ISM-HAB) sounding balloon flight train. (a) Immediately after release at launch. (b) Schematic.
Aerospace 08 00021 g001
Figure 2. Burst of the balloon, as captured by the onboard camera.
Aerospace 08 00021 g002
Figure 3. The ISM-HAB payload gondola: (a) the main payload Styrofoam box, and (b) arrangement of the box and other components on the base frame.
Aerospace 08 00021 g003
Figure 4. Schematics of the radio frequency (RF) payload and tracking payload arrangement.
Aerospace 08 00021 g004
Figure 5. (a) Automatic Packet Reporting System (APRS) transmitter, (b) SPOT Trace modem, (c) EAGLE flight computer, (d) Inertial Measurement Unit (IMU) board.
Aerospace 08 00021 g005
Figure 6. Schematic of the RF payload.
Aerospace 08 00021 g006
Figure 7. (a) S-band antenna, (b) Ultra High Frequency (UHF) antenna.
Aerospace 08 00021 g007
Figure 8. Mission operation sequence.
Aerospace 08 00021 g008
Figure 9. Simulated trajectory (red) vs. real trajectory (blue).
Aerospace 08 00021 g009
Figure 10. (a) Trajectories of the five missions. (b) Picture taken during ISM-HAB #3 at 30 km altitude. The curvature of the Earth is accentuated by the fisheye lens.
Aerospace 08 00021 g010
Figure 11. Environmental temperature and temperature inside of the payload gondola during the flight.
Aerospace 08 00021 g011
Figure 12. Measured external temperature as a function of altitude (blue line). The temperature predicted by the Standard Atmosphere model is shown for the sake of comparison (red line).
Aerospace 08 00021 g012
Figure 13. Interference spectrograms: (a) 2.4 GHz and (b) 862–922 MHz.
Aerospace 08 00021 g013
Figure 14. Altitude profiles as a function of time.
Aerospace 08 00021 g014
Figure 15. ISM-HAB#3 simulated speed vs. actual speed as a function of time.
Aerospace 08 00021 g015
Figure 16. Ascent rate as a function of lifting mass.
Aerospace 08 00021 g016
Figure 17. Horizontal speed during flight ISM-HAB #3: (a) during ascent and (b) during descent.
Aerospace 08 00021 g017
Figure 18. Gondola dynamics: (a) acceleration along the three body axes during the whole flight, and (b) acceleration along the x-axis as a function of altitude.
Aerospace 08 00021 g018
Figure 19. Acceleration close to burst altitude: (a) along x, (b) along z. Note the different vertical scale. The sampled interval is 274 s.
Aerospace 08 00021 g019
Figure 20. (a) Yaw rate as a function of altitude. (b) Orientation of the gondola body axes in the accelerations analysis, the x- and y-axes correspond to the pitch and roll axis respectively, while the z-axis corresponds to the yaw axis.
Aerospace 08 00021 g020
Figure 21. (a) Pitch oscillations vs. time registered by the IMU during flight ISM-HAB #3. (b) Low-pass filtered pitch oscillations signal at 27 km altitude.
Aerospace 08 00021 g021
Figure 22. Pointing path (white) and Global Positioning System (GPS) positions (red).
Aerospace 08 00021 g022
Figure 23. Single-sided amplitude spectrum pitch oscillations at different altitudes (note the different vertical scales for different altitudes).
Aerospace 08 00021 g023
Table 1. Predictor errors.
MissionISM-HAB #1ISM-HAB #2ISM-HAB #3ISM-HAB #4ISM-HAB #5
Landing displacement with respect to prediction1.2 km5 km2.9 km8 km3 km
−14%−6%−10%−6%−4%
Table 2. Mission parameters.
ISM-HAB#1ISM-HAB#2ISM-HAB#3ISM-HAB#4ISM-HAB#5
MissionTest launch without RF payload2.4 GHz, signal acquisition at 1 MHz sampling rate2.4 GHz, signal acquisition at 1 MHz sampling rate868 MHz, signal acquisition at 100 kHz sampling rate2.4 GHz, signal acquisition at 100 kHz sampling rate + sample recording
Launch Time (Central European Time)13:0515:3012:3811:3212:32
Launch site (City, District)Lajatico (PI)Montegonzi (AR)Certaldo (FI)Ponte a Elsa (FI)Lajatico (PI)
Landing site (City, District)Villamagna (PI)Cecina (LI)Monteguidi (SI)Latera (VT)Rapolano Terme (SI)
Landing site (type)WoodsWoodsWoodsGrasslandWoods
Payload RecoveredYesYesYesYesYes
Weather conditionsCloudyRainySunnySunnySunny
Peak Altitude (km)21.03819.11532.41230.40029.493
Total Distance Covered (km)8.378.328.813774
Total Flight Time (min)118123210236176
Ascent Time (min)9193152185114
Descent Time (min)2730585162
Mean Ascent Velocity (m/s)3.93.43.72.74.3
Mean Descent Velocity (m/s)13.010.59.29.77.9
Landing Velocity (m/s)9.965.33.43.4
Payload RecoveredYesYesYesYesYes
Publisher’s Note: MDPI stays neutral with regard to jurisdictional claims in published maps and institutional affiliations.

