Article

Icon Design for Representing Safety-Critical Aircraft Functions to Support Supervisory Control of Remotely Piloted Aircraft Systems

1
Institute of Flight Guidance, German Aerospace Center (DLR), 38108 Braunschweig, Germany
2
Frazer-Nash Consultancy, Dorking RH4 1HJ, UK
3
Department of Engineering and Traffic Psychology, Institute of Psychology, Technische Universität Braunschweig, 38106 Braunschweig, Germany
*
Author to whom correspondence should be addressed.
Submission received: 7 January 2022 / Revised: 11 March 2022 / Accepted: 21 March 2022 / Published: 25 March 2022
(This article belongs to the Section Air Traffic and Transportation)

Abstract

:
(1) Background: The transition from conventional to remote aircraft control will necessitate the development of novel human machine interfaces. When we consider the pilot interface, icons are traditionally used to associate meanings with functions on the flight deck, allowing the pilot to assimilate information effectively. Using established icon design principles, 18 icons, representing key safety-critical functions related to the operation of an aircraft, were designed for integration into a ground station. Pilots were then asked to evaluate these icons based on established icon characteristics. (2) Method: In an online questionnaire study, 29 pilots rated the icons on the icon characteristics of concreteness, complexity, familiarity, meaningfulness, and semantic distance. Alongside these metrics, concept and name agreement were captured for the icon set. (3) Results: Analysis indicated good icon-function fit overall. The findings show that emphasizing concreteness and familiarity improves icon-function fit, as long as the familiarity is directed at aviation-related artifacts. Further, concept agreement appears to be a better measure of icon-function fit in comparison to name agreement. (4) Conclusion: Most of the designed icons were well suited to represent their intended meaning. However, this study emphasizes the need for dedicated standardized icon characteristic norms for aviation systems.

1. Introduction

At present, the introduction of Remotely Piloted Aircraft Systems (RPAS) into controlled airspace and thus the shift from manned to unmanned aviation is underway. However, a seminal, cross-platform review on a large number of incidents and accidents from 2004 [1] found that RPAS tend to possess higher accident rates compared to conventional aviation [1]. Since this study, no such comprehensive updates at a comparable scale have been published. A major factor contributing to RPAS accidents and incidents was attributed to design deficiencies in the Ground Control Stations (GCS), the means by which the operator or remote pilot may control, supervise and monitor the RPAS [2,3,4,5,6]. Example design deficiencies include pop-up windows obscuring safety-critical information, the proliferation of display screens, complicated menu structures, the reliance on text displays, multifunctional controls and displays, inadequate feedback on the system settings and state, as well as overloading the remote pilots with raw data [4,5,6]. These design deficiencies were found to lead to confusion about the system’s behavior, automation surprises, as well as attentional and visual scanning failures [6]. In particular, attentional and visual scanning failures in turn can lead to the risk of remote pilots perceiving safety-critical information and warnings too late, and therefore increase the probability of human error. In addition, the lack of a standardized approach to display design led to an increasingly diverse number of GCS display examples, which tend to be composed of multiple screens with different orientations and adaptable configurations.
Future displays in GCSs should ensure that the remote pilot can effortlessly perceive the current states of safety-critical aircraft systems. When compared to written text, numerous studies have highlighted the advantages of icons in terms of recognition [7], cognitive processing [8], making errors [9] and learning and performance [10]. Many studies have also shown an increase in human performance when icons are used to assist with understanding the associated text [11]. In addition, icon-based interfaces have been shown to be effective in supporting good interaction between the remote pilot and the RPAS [12], and were proven to support the remote pilot in quickly perceiving safety-critical aircraft system states [13,14]. Examples of icon-based interfaces for RPAS are described by Friedrich and Lieb [13] and Friedrich and Vollrath [14]. The authors present and evaluate displays for a GCS (called U-FLY) that would enable a single remote pilot to control and supervise (via supervisory control [15]) multiple highly automated RPAS [13] or small unmanned aircraft systems [14]. 
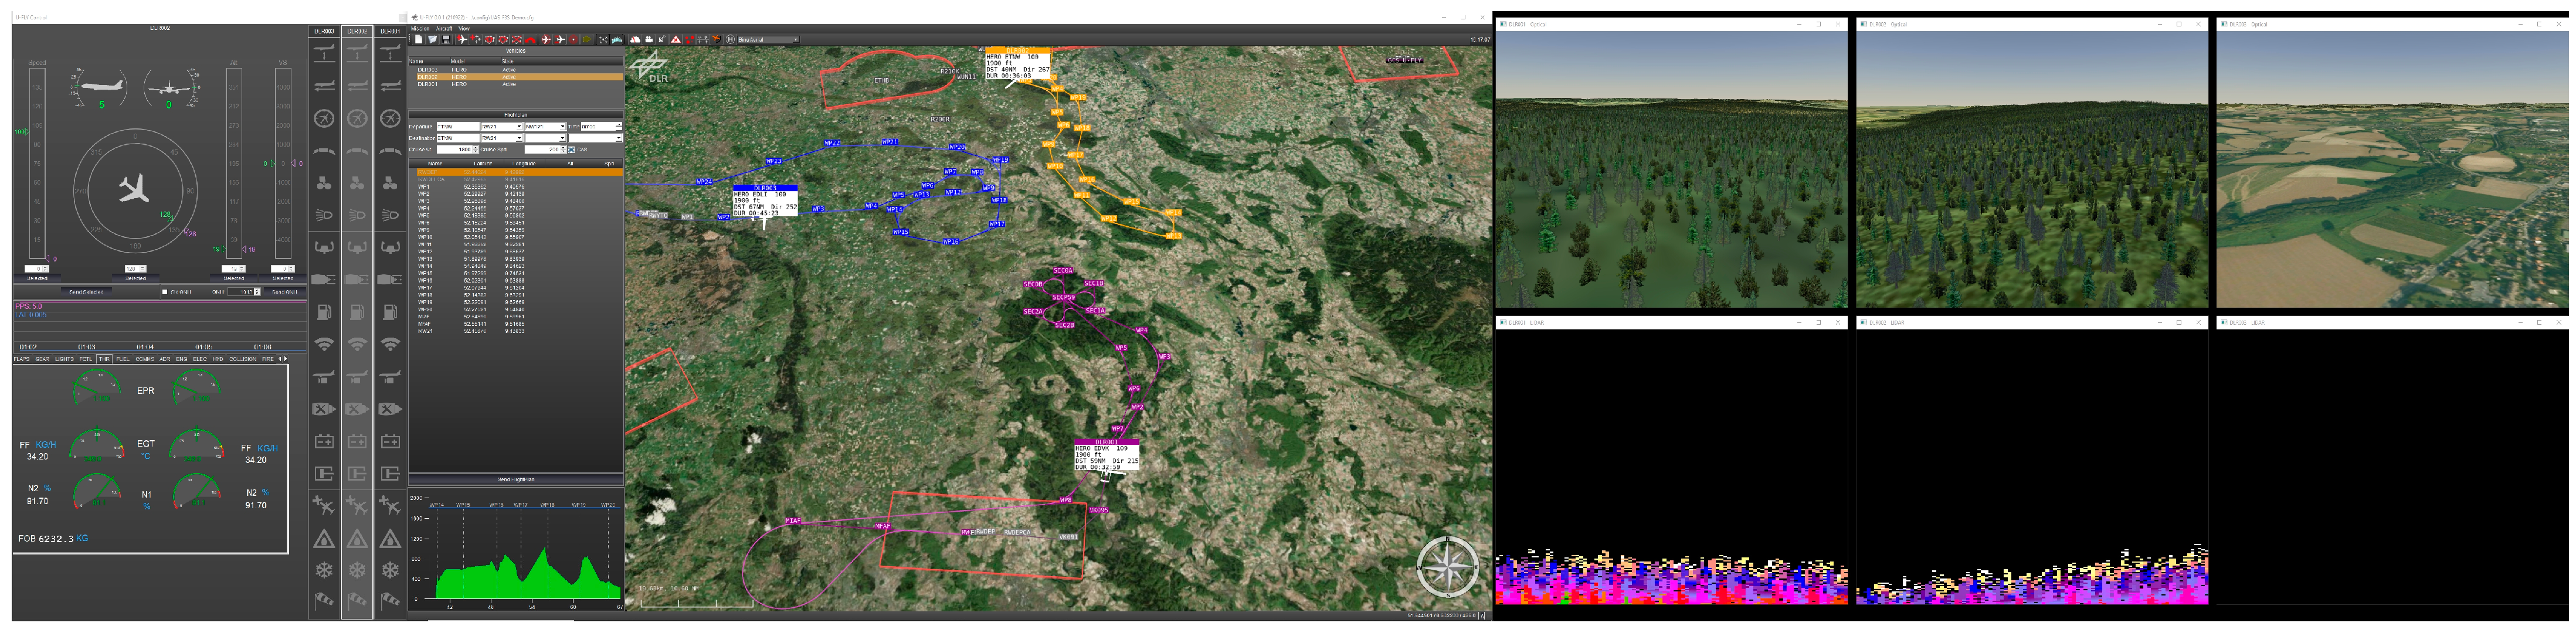
Figure 1 depicts the U-FLY GCS during an observation mission (incl. a simulation of electro-optical camera and a Lidar sensor payload [16]) with three RPAS.
Instead of relying on the text-based presentation of safety-critical information and warnings, the displays utilize hue changing icons to make the remote pilot aware of states of safety-critical system functions at a glance. The goal of using function-specific icons that change hue in accordance to the current system state is to enable the remote pilot to quickly perceive a critical situation without having to read and interpret textual indications, leading to additional workload. As such, the use of unambiguous icons aims to keep the demands on cognitive resources (particularly mental workload) at acceptable levels, especially in situations wherein workload is already high or vigilance is low, and the remote pilot is experiencing pressure or fatigue. It is, however, extremely important that the icons are unambiguous and easy to understand. Otherwise, an icon has the opposite effect and increases workload, because the pilot does not understand it and tries to interpret its meaning.
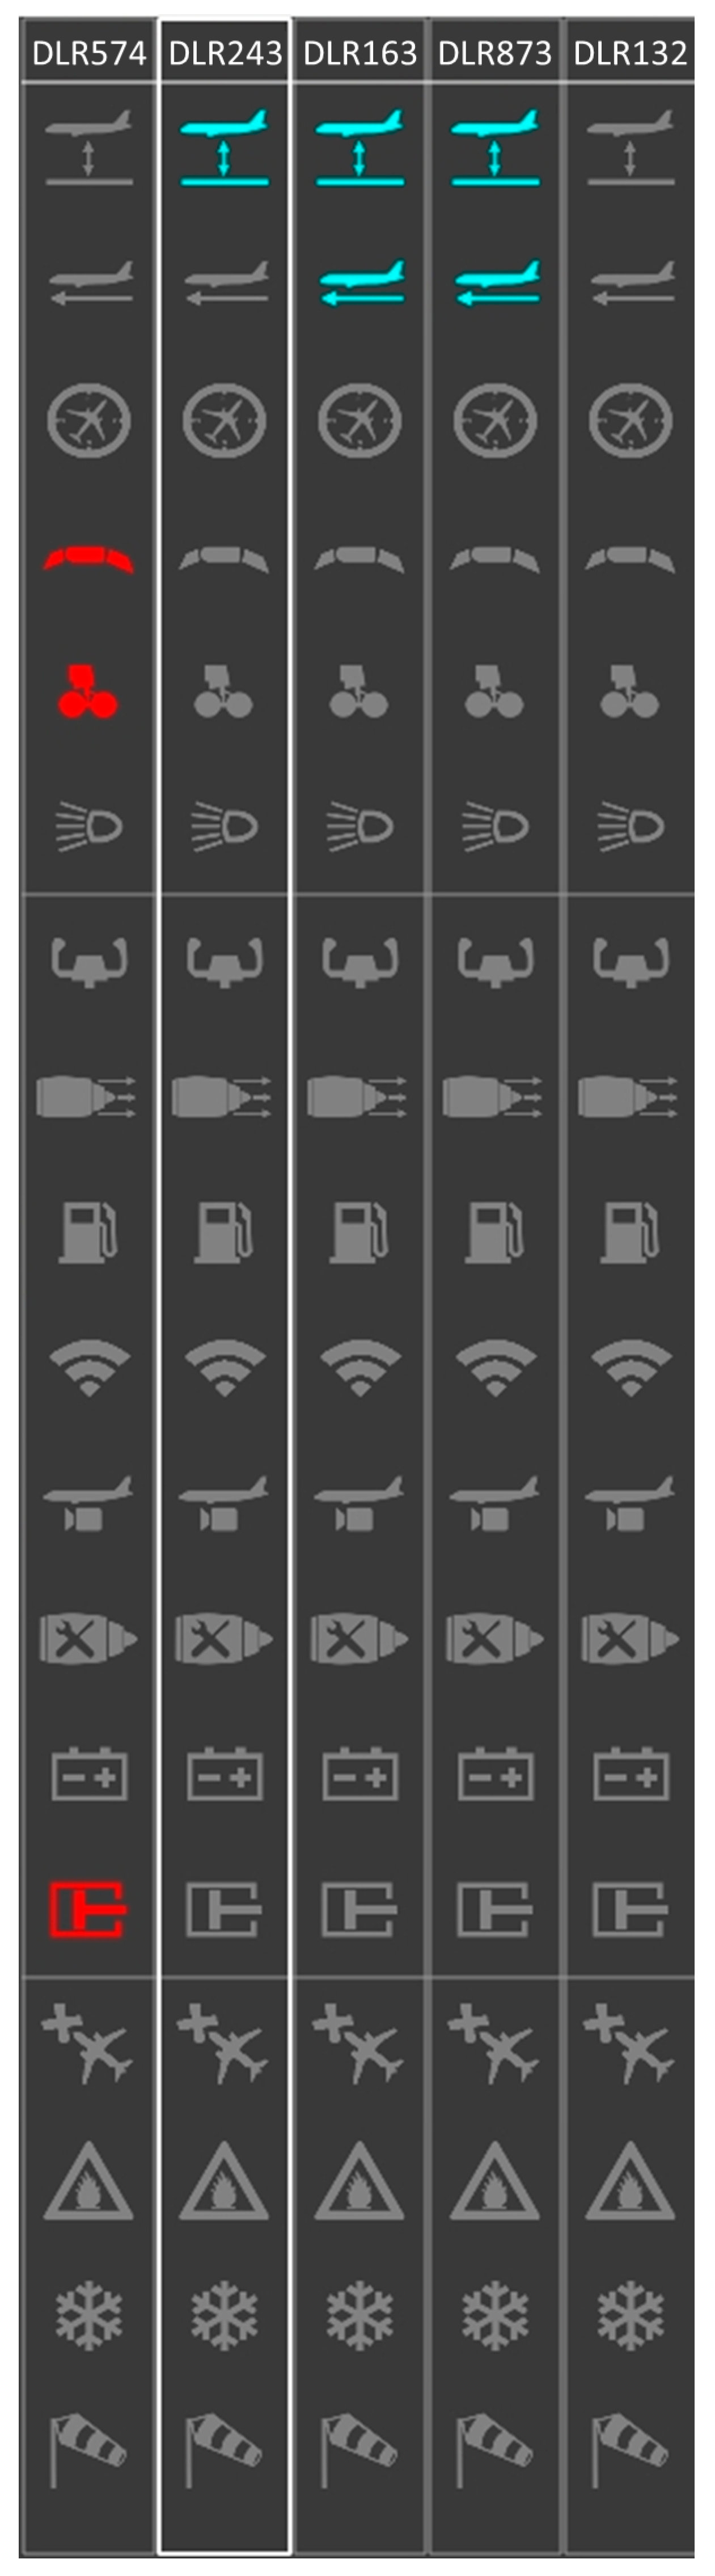
In the icon display (see left side of Figure 1 and Figure 2), each column represents a different RPAS, and each row a safety-critical system function. If the user (or remote pilot) hovers the mouse over the icon, a small text field occurs, showing the meaning of the icon (e.g., HYD for hydraulics or ALT for altitude). This feature was implemented to avoid potential confusion in case the icon is ambiguous for the user (which should be avoided). In order to indicate different system states, the icons change their hue from grey (indicating a non-critical, nominal system state) to either cyan, indicating an expected change (e.g., intended heading change), yellow for caution states (e.g., low fuel) or red for warning states (e.g., loss of hydraulic pressure). The system functions represented by the icons were derived through a work domain analysis of an Airbus A320 aircraft [17], and thus represent safety-critical functions related to the operation of an aircraft (e.g., altitude control or hydraulic supply). In a study by Friedrich and Lieb [13], pilots were able to quickly identify critical system failures and subsequent secondary failures (such as a hydraulic pump failure leading to the inability to deflect flaps and the landing gear; cf. Figure 2).

2. Icon Design Considerations

The design of intuitive icons that accurately represent their intended meaning is challenging. While icons may allow for the effective transmission of information, their meaning can sometimes be ambiguous if they are not chosen appropriately [18,19,20,21]. This is of significant concern when we consider safety-critical domains where it is necessary that icons transmit their intended meaning accurately. Therefore, it is important that icons are designed and used according to empirically established icon design principles. Numerous studies have investigated various icon characteristics that were found to significantly positively contribute to the performance of an icon. The performance of an icon can be measured by the so-called icon-function fit, which describes how well an icon intuitively represents a specified function [18,19,20,21,22].
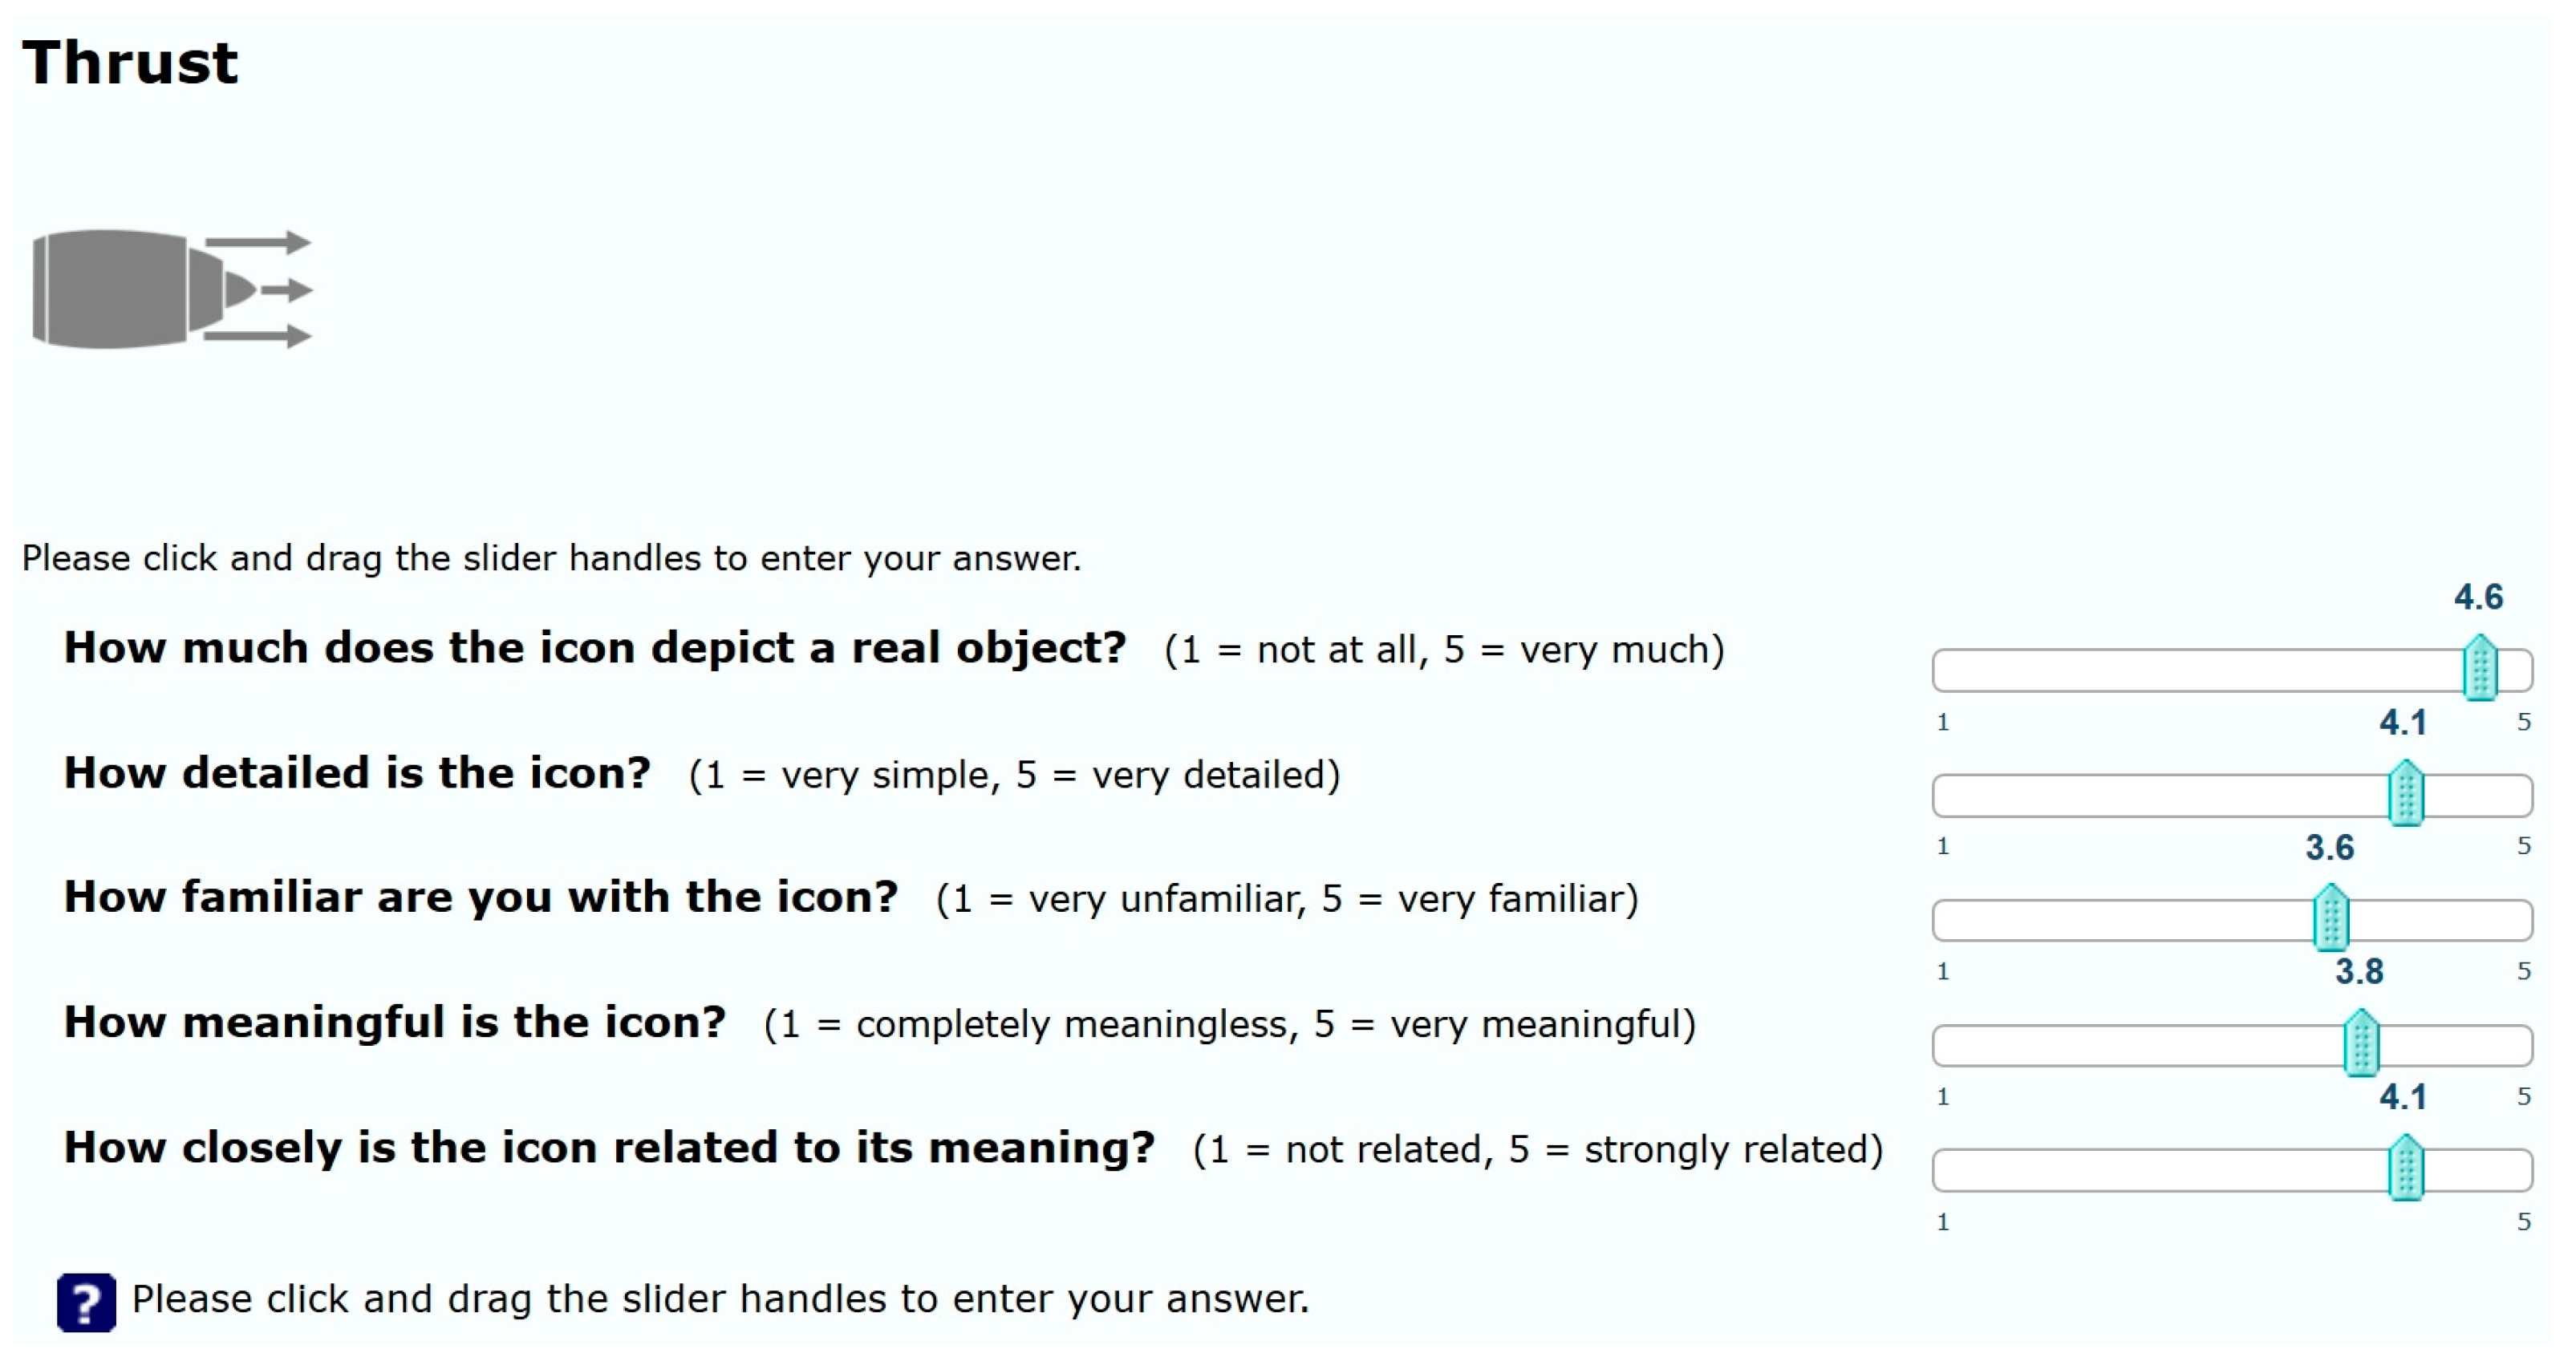
The most commonly reported icon characteristics are concreteness, complexity, familiarity, meaningfulness and semantic distance, all of which are obtained by subjective ratings. Concreteness describes how well an icon depicts the real-world object it intends to represent. Sometimes more detail within an icon can assist in conveying the icon’s meaning. However, an icon that is too complex cannot be perceived as quickly. Thus, it is important to also measure the complexity of the icon. The remaining three icon characteristics relate to how familiar the icon is in terms of how often it is encountered in everyday life (familiarity), how much meaning the icon conveys (meaningfulness) and how close the icon is perceived in relation to its meaning, i.e., what the icon is intended to represent (semantic distance). Measures for these icon characteristics are obtained by asking participants to rate an icon on a Likert scale from one to five. Table 1 describes each of the five icon characteristics in detail.
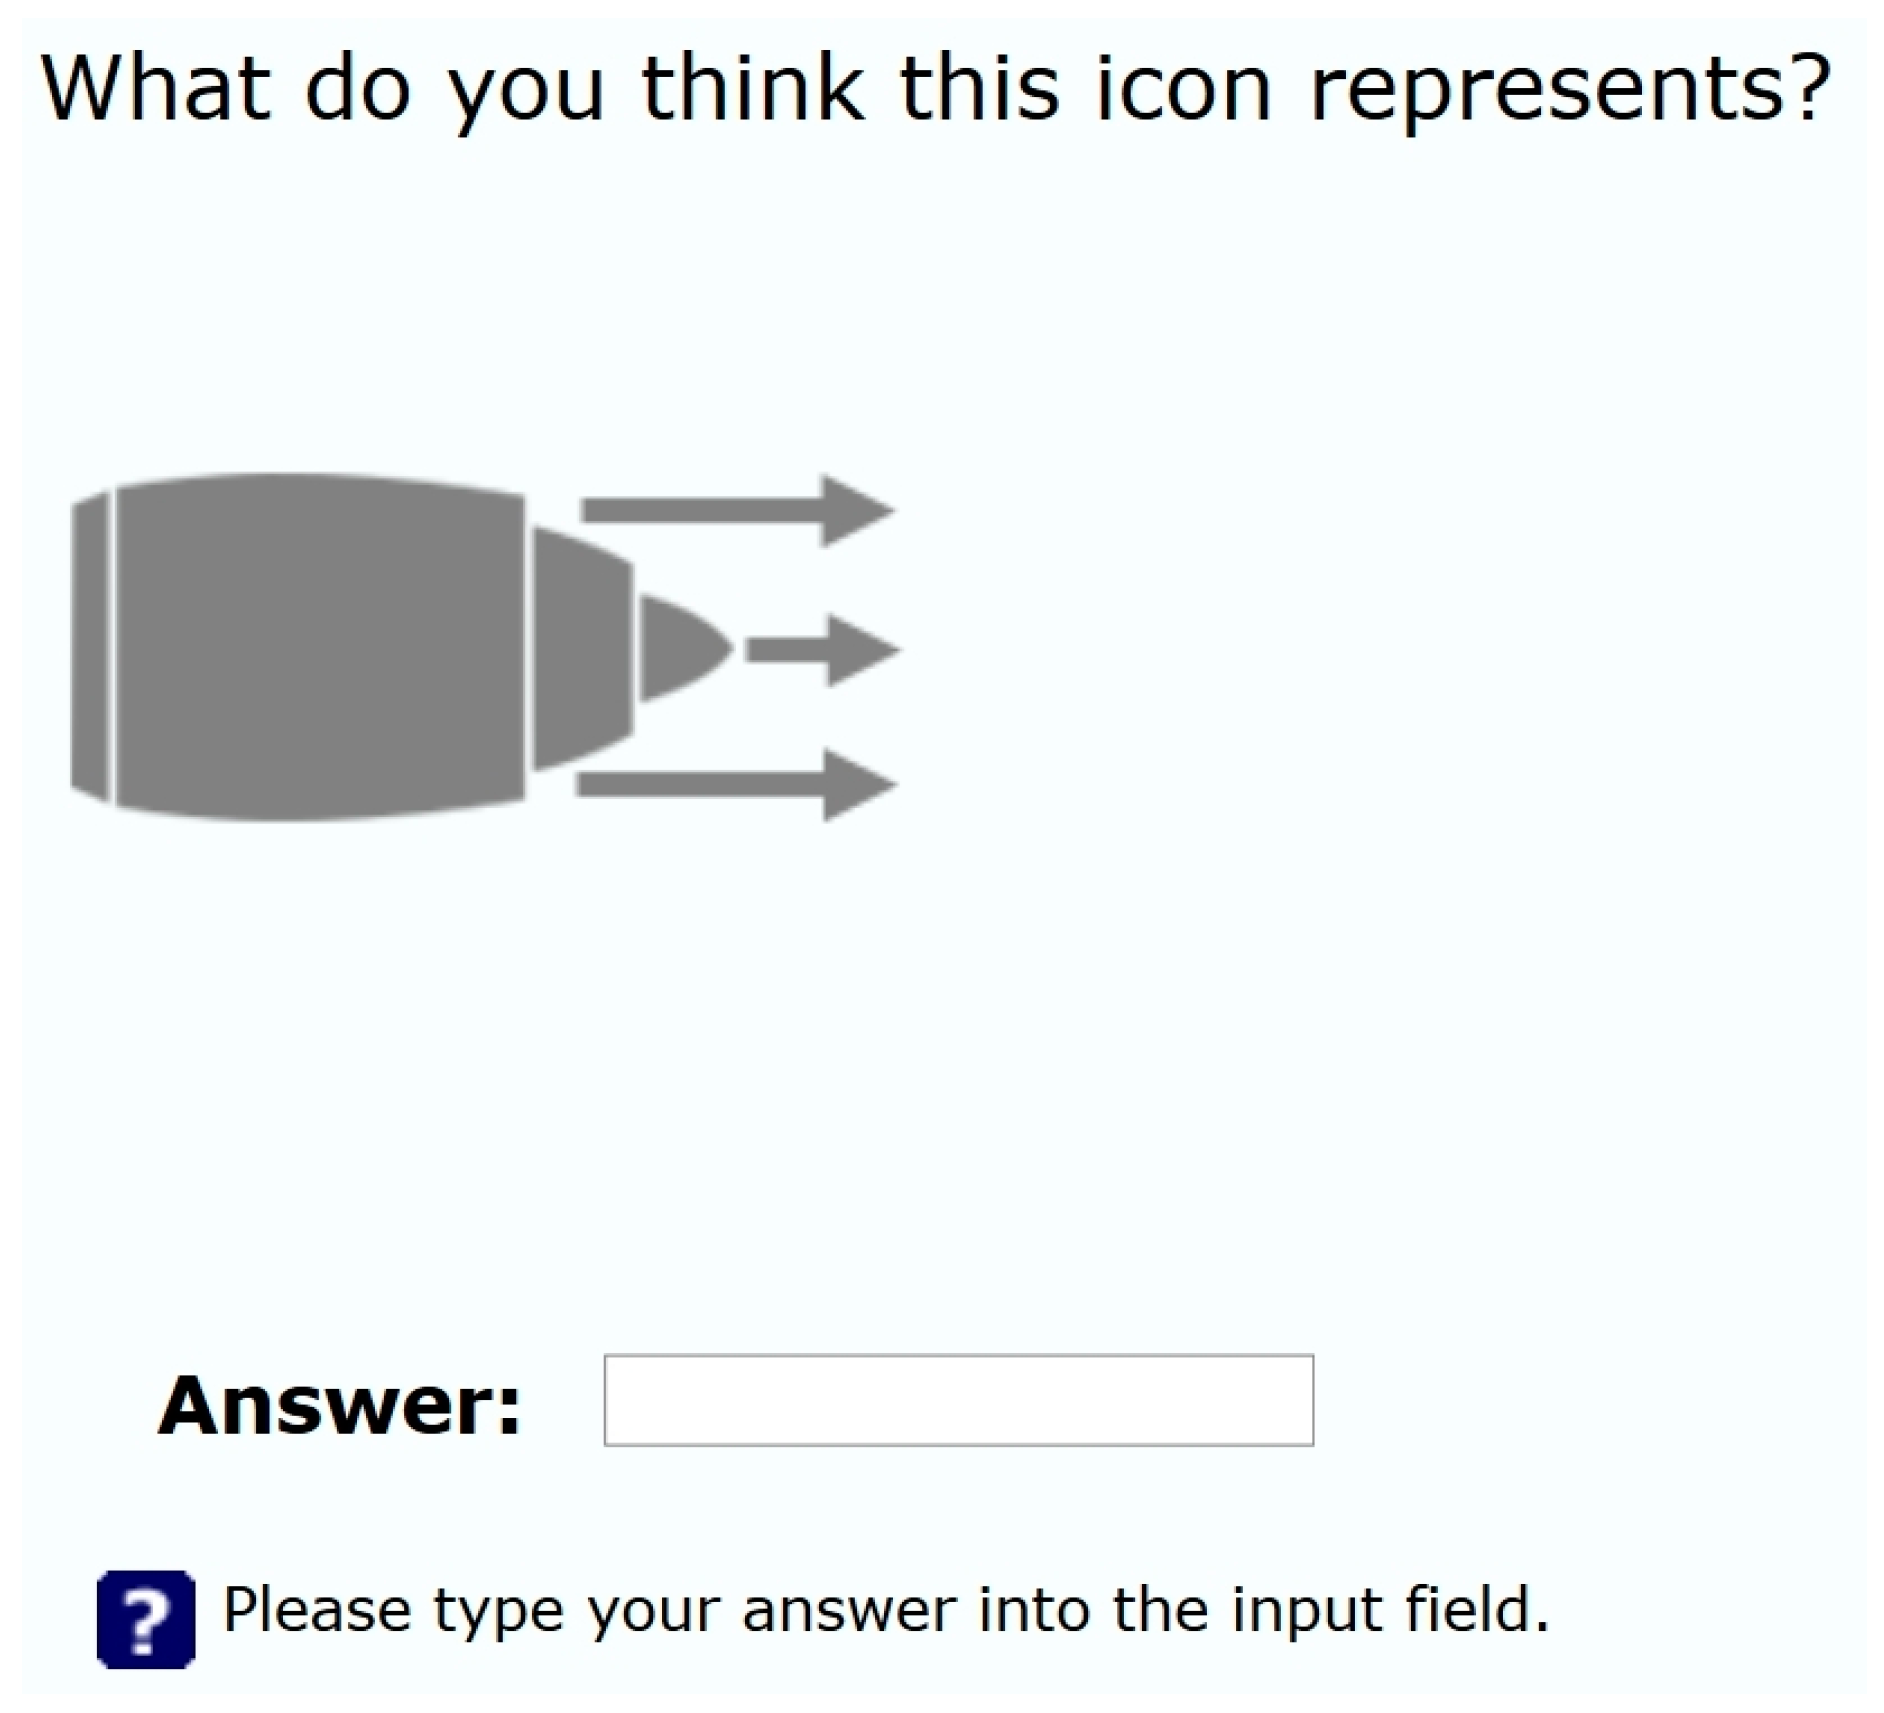
In addition to the icon characteristics that are measured via subjective ratings, various studies also investigated objective metrics for measuring icon-function fit. The most common objective icon-function fit metrics are name agreement and concept agreement [18,21]. These are measures for icon ambiguity and are obtained by asking participants to guess the meaning of each icon. Concept agreement is a measure of the percentage of participants who provided the actual intended meaning of the icon. Name agreement is commonly referred to as the percentage of participants who gave the same, most common name for an icon or a picture [22,23]. Sometimes, participants can attribute different names to icons. In these instances, we can calculate an agreement measure, which, in addition to name agreement, considers the number of alternative meanings that were provided for an icon. This agreement measure is the information statistic H [24,25]. H is defined as:
H = i = 1 k p i l o g 2 ( 1 / p i )  
In the equation, k refers to the number of different meanings and pi is the proportion of participants that provided the respective meaning. An icon for which only one meaning was given by all participants has an H value of 0. When two different meanings were given with an equal frequency, the icon has an H value of 1. An increasing H value would thus indicate a decrease in name agreement. As H accounts for the number of alternative meanings, it is considered a better indicator for name agreement than just using the name agreement metric alone [25].
Several studies have reported interdependencies between the icon characteristic and agreement metrics. McDougall et al. [18] found correlations between concreteness and meaningfulness (r = 0.82), as well as concreteness and semantic distance (r = 0.65). McDougall et al. [26,27] further suggested that concreteness was the best predictor for the successful transmission of the intended meaning, especially in situations that required rapid understanding of an icon, and also when icons were used infrequently. This would be especially relevant during the first exposures to the icons, with its effect diminishing with progressive icon exposure [26,27,28,29]. In addition to this, strong associations have been found between the icon characteristics of familiarity and meaningfulness (r = 0.93), as well as meaningfulness and name agreement (r = 0.86, [18]). However, the effect of icon familiarity, as a predictor of ease of icon identification, does not diminish with increasing experience with the icon [29,30]. Furthermore, McDougall et al. and Smythwood and Hadzikadic [31,32] reported that icon complexity negatively affected search efficacy, which would suggest that simple icons are detected faster than more detailed, complex icons.
Taking these previous findings into account, we can begin to suggest what represents a “good” icon. The icon should resemble the real-world object that is being represented as much as possible (concreteness), entail familiar features (familiarity) and be kept simple (complexity). Addressing these icon characteristics should then positively impact semantic distance, meaningfulness and name agreement (H). As a consequence, the icon will be less ambiguous, more distinct, interpretable, and easier to detect, thus enhancing the icon-function fit.

3. Icon Design Standards and Norms

Several design standards exist for aircraft display symbology, such as the U.S. Airforce (USAF) MIL-STD-1787D [33] and the Radio Technical Commission for Aeronautics (RTCA) standards DO-257A [34] and DO-365 [35]. These icon design standards define symbology requirements, describe fundamental relationships between symbol motion and aircraft system states (MIL-STD-1787D), and prescribe the shapes and colors of icons used to transmit specific meanings related to detect and avoid functionalities (DO-365) and for the depiction of navigation information (DO-257A). The standards thus tend to focus on the symbology used in displays for a specific purpose (such as a navigation or a detect and avoid display), but do not cover symbology used for representing broader safety-critical aircraft functions, such as hydraulic and electric supply or engine thrust. However, for the remote supervisory control of (multiple) RPAS, it is necessary to have a holistic overview of the states of safety-critical functions in order to always have an adequate understanding of the current state of the systems. The aforementioned standards are therefore not applicable to the design of icons representing safety-critical aircraft functions, such as the icons used in the U-FLY GCS [13].
Furthermore, no study so far has reported norms for icon characteristic and agreement metrics to measure icon-function fit (such as concreteness, semantic distance or name agreement) for aircraft cockpit symbology-related icons. However, for a quantitative icon-function fit evaluation, these norms would be essential. In order to evaluate how well a newly designed icon represents the intended function, its characteristic ratings and agreement measures would need to be compared against previously established norms for icons of the same domain (i.e., aircraft cockpit symbology).
Apart from the aviation domain, different studies report norms for icon characteristic and agreement metrics for standard icon sets, emojis and emoticons [18,22,23,25,36,37,38,39,40,41]. However, Souza et al. [42] found that the number of normative studies is still quite sparse. Most studies examining icon characteristic and agreement metrics have tended to focus on icon sets in general, and not on a specific domain. However, the context of using a given icon set is key when considering how the user interacts with them. This is especially pertinent when we examine safety-critical applications, where time and error are significant factors. Monitoring and controlling a single (or multiple) RPAS is one of these safety-critical applications where multiple information sources need to be presented to the remote pilot. The nature of the information that is needed to be conveyed to the remote pilot relates to not only the asset(s) they are in command of, but also to the associated sub-systems that may very well impact the safety and efficiency of the mission. This, along with considerations of varying flight conditions, presents a significant amount of information for a single person to process and act upon. Even with the introduction of automated (or autonomous) support, there is still the need to present the human with the appropriate amount of information. Through the use of icons, the information can be presented in a manageable way, if the icons can convey their meaning effectively.

4. Icon Design

Since none of the above-mentioned icon design standards and norms cover the required icons for representing safety-critical aircraft system functions, new icons were designed and evaluated. Due to the lack of appropriate norms for aircraft display symbology, it is not possible to evaluate newly designed icons by comparing their characteristic ratings and agreement scores to previously established norms.
In order to ensure good icon-function fit of the newly designed icons, a design that embraced an understanding of the introduced icon characteristics was adopted. The design especially considered concreteness, familiarity and complexity. Since the icons were designed to be used by pilots who would operate a GCS such as the U-FLY, an online evaluation study with pilots was conducted in order to gather their views on the icons. Alongside the subjective ratings on concreteness, familiarity, complexity, meaningfulness and semantic distance, objective measures on concept and name agreement were computed for each icon. The results of the analysis serve as a first step towards establishing norms for icon characteristic and agreement metrics for icons representing safety-critical aircraft systems.

5. Materials and Methods

5.1. Icons

In order to ensure the face validity and credibility of the icons, we involved a subject matter expert from the very beginning of the design process. The eighteen icons were thus developed in close cooperation with a pilot holding an Airline Transport Pilot License (ATPL). As concrete, simple and familiar icons should lead to better semantic distance, meaningfulness and name agreement (H), in the design, the three icon characteristics of familiarity, complexity and concreteness were emphasized. This means that we tried to include well-known and simple shapes to enhance the recognition and simplicity of the icons. Concreteness was emphasized by trying to resemble the real-world object as much as possible. The icons were created using Microsoft PowerPoint and the open source software Inkscape [43]. Table 2 presents the designed icons and the safety-critical aircraft system functions from [17] that they intend to represent, together with a description of the design rationale.

5.2. Online Questionnaire

The icons were presented to pilots via an online questionnaire. The questionnaire first detailed the purpose of the study, followed by demographic questions and the questionnaire instructions. These instructions informed the pilots that they would be presented with icons that are representative of aircraft functions/systems found in a typical cockpit. The pilots were instructed that the questionnaire would consist of two parts. In the first part, the icons were presented without an explanation about their meaning, and the pilots’ task was to indicate what they thought the icons represented (see Figure 3). In the second part, the pilots were presented with the same set of icons together with the intended meaning. The pilots were instructed to rate the icons on the five icon characteristics of concreteness, complexity, familiarity, meaningfulness and semantic distance (see Figure 4).
The pilots received a short explanation of each icon characteristic, similar to the descriptions in Table 1, which they could access at any time during the rating. After completing the ratings, the pilots had the opportunity to enter comments into a dedicated comment field.

5.3. Participants

The participants included 29 ATPL pilots (26 male) with a mean age of 44.5 years (SD = 12.4). They were recruited via opportunistic sampling via email. The pilots did not receive any compensation for their participation. Informed consent was obtained from each pilot.

5.4. Measures

We collected demographic data of the participants, since the process of opportunistic sampling strategy via email implied that we were not able to control who would participate in the study. Incomplete data were removed from the dataset (n = 26). Similarly, participants that were not deemed suitable for taking part in the study because of an inadequate aviation background (i.e., no ATPL license) were excluded from the analysis. However, all participants for which complete datasets could be obtained fulfilled the requirements. The demographic data collected included gender, age and information pertaining to the pilot’s aviation background. From the meanings that the pilots provided for each icon (cf. Figure 3), the concept agreement percentage, name agreement percentage and the name agreement measure H (see above) were computed. In the computation of concept and name agreement scores, synonyms were treated as equivalent; for example, landing gear and undercarriage were regarded as having the same meaning. Furthermore, if a meaning given by a pilot represented only a part of the entity that the icon was intended to represent, the answer was considered as correct in the computation of concept agreement, but the meanings were treated as different names in the computation of name agreement. For example, if a pilot gave the meaning battery for the electrics icon or hydraulic piston for the hydraulics icon, the answer was considered to sufficiently reflect the intended meaning. However, in the computation of name agreement, battery and electrics (for example) were counted as two different names. The five icon characteristics of complexity, familiarity, meaningfulness and semantic distance were obtained on a Likert scale of 1–5 with intervals of 0.1. The pilots gave their answer using a slider (cf. Figure 4). Except for complexity, higher numbers were considered to imply a better icon-function fit.

6. Results

6.1. Validation of Icon Design Approach

In order to validate the design approach of emphasizing concreteness, familiarity and complexity in the design of the icons, we investigated whether increasing icon concreteness and familiarity positively affected meaningfulness, semantic distance, as well as concept and name agreement. Further, a negative impact on name agreement H was expected, as for H, lower values indicate a better result. For each icon (n = 18), the mean scores over all pilots for the five icon characteristics of concreteness, familiarity, meaningfulness and semantic distance were computed. Spearman rank correlation coefficients (ρ) were computed between concreteness and name agreement H, concept agreement, meaningfulness and semantic distance. The same correlations were calculated for familiarity.
The results show that increasing icon concreteness and familiarity positively affected meaningfulness, semantic distance and concept agreement, and had a negative effect on name agreement H, thus confirming the derived icon design principles. Table 3 depicts the computed spearman rank correlation coefficients (ρ). All correlations were found to be significant and imply moderate to strong relationships. Figure 5 shows the scatterplots for concreteness and familiarity, each correlated with name agreement H, concept agreement, meaningfulness and semantic distance.

6.2. Icon Evaluation

6.2.1. Statistical Summary

Since comparisons of the obtained icon characteristic ratings and agreement measures to previously established norms were not possible, the icons were analyzed descriptively. For the subjective ratings of the icon characteristics of concreteness, complexity, familiarity, meaningfulness and semantic distance, the mean across all icons was computed for each pilot (n = 29). Concept agreement, name agreement and name agreement H were computed for each icon (n = 18).
For icons to be unambiguous, concept and name agreement percentages should not differ substantially. Further, the name agreement measure H should be close to zero, and preferably not higher than one (an icon has an H value of one if two different meanings were given with an equal frequency). For the current icon set, the first requirement is met with a mean concept agreement score over all icons of 61.11 and a mean name agreement score of 67.25. However, the mean name agreement H value was 1.35, and thus higher than one, meaning that on average, more than two meanings were provided for the icons (see Table 4). Further, the icons should display high concreteness, familiarity, meaningfulness and semantic distance scores, as well as low complexity scores, in order to be easily detectable on a display screen. The numbers in Table 5 show a mean rating for complexity of 2.73 (out of 5), and mean ratings between 3.43 and 3.59 for the other icon characteristics. Thus, all mean scores were located above the middle of possible values (i.e., above 2.5), which is favorable for concreteness, familiarity, meaningfulness and semantic distance, but unfavorable for complexity.

6.2.2. Individual Icon Evaluation

Table 6 shows the results for concept and name agreement (% and H), the difference between concept and name agreement scores, the most frequently given meaning and the number of different given meanings for each icon. The icons are ranked in descending order by the score for concept agreement. The best icons in terms of concept agreement, name agreement and H are the icons representing lights, gear, electrics, high lift and weather. For the gear and lights icons, all pilots gave the correct meaning, leading to 100% concept and name agreement. These results are also reflected in the rating scores for concreteness, familiarity, meaningfulness and semantic distance—with all showing considerably higher scores for theses icons than the remaining icons (cf. Figure 6 and Figure 7).
The three icons that performed worst for H were the icons representing collision avoidance (H = 3.3), hydraulics (H = 2.9) and flight controls (H = 2.3). These results are also reflected in the scores of the icons’ characteristic ratings, which are all lower than most of the other icons, except for the flight controls icon. This icon performed considerably better for concreteness, familiarity and meaningfulness than the icon for hydraulics and collision avoidance. All icons show mediocre complexity scores, on average (M = 2.73).
As Table 6 shows, the icons with the lowest concept agreement are the icons for ADIR, engine secondary, radio communication and collision avoidance. For the ADIR icon, concept agreement was 0, meaning that no participant offered a correct meaning. Compared to concept agreement, the name agreement scores for the ADIR, engine secondary and radio communication icons were considerably higher, suggesting that the pilots mostly agreed on different (as opposed to the intended) meanings. For the ADIR icon, the most frequent meaning was (outside) camera (n = 17), while for the radio communication it was WiFi (n = 20) and for engine secondary it was engine maintenance (n = 24).
The icons for which the pilots mostly gave a meaning that was different than intended but conceptually correct are the icons of electrics, weather and high lift. For the electrics icon, 96.6% gave the meaning battery, while for the weather icon 89.7% of the pilots guessed wind to be the intended meaning, and for high lift, 93.1% gave flaps as the name of the intended function (see Table 6). Since all of the meanings are conceptually related to the intended meanings, they were counted as correct in the computation of concept agreement, leading to scores of 89.7–100%. It is noted that all icons, apart from the collision avoidance, ADIR and radio communication icons, received fairly high ratings for concreteness (see Figure 7).
Figure 6 shows the means and standard deviations of the icon characteristic ratings for three example icons, namely, the landing gear icon, which received the best result, the collision avoidance icon, which received the worst result, and the altitude icon, which received a medium score with respect to the name agreement measure H. Figure 7 depicts the means and standard deviations of the icon characteristic ratings for each icon. The icons are presented in descending order of the scores computed for concept agreement.

7. Discussion

7.1. Discussion of Results

This study designed and evaluated eighteen icons that represent safety-critical aircraft system functions. The icons were designed using established icon design principles. This specifically took the icon characteristics of familiarity, complexity and concreteness into account, whilst also using these characteristics to reinforce the individual’s likelihood of relating to the icons—particularly in terms of icon-function fit. Previous research has suggested that by strictly adhering to these icon characteristics in the design, the resulting icon set would be less ambiguous, more distinct, more interpretable and easier to detect [21,27,32]. All icons in this study were evaluated via an online study, in which pilots guessed the meanings of the icons and rated each icon against the different icon characteristics.
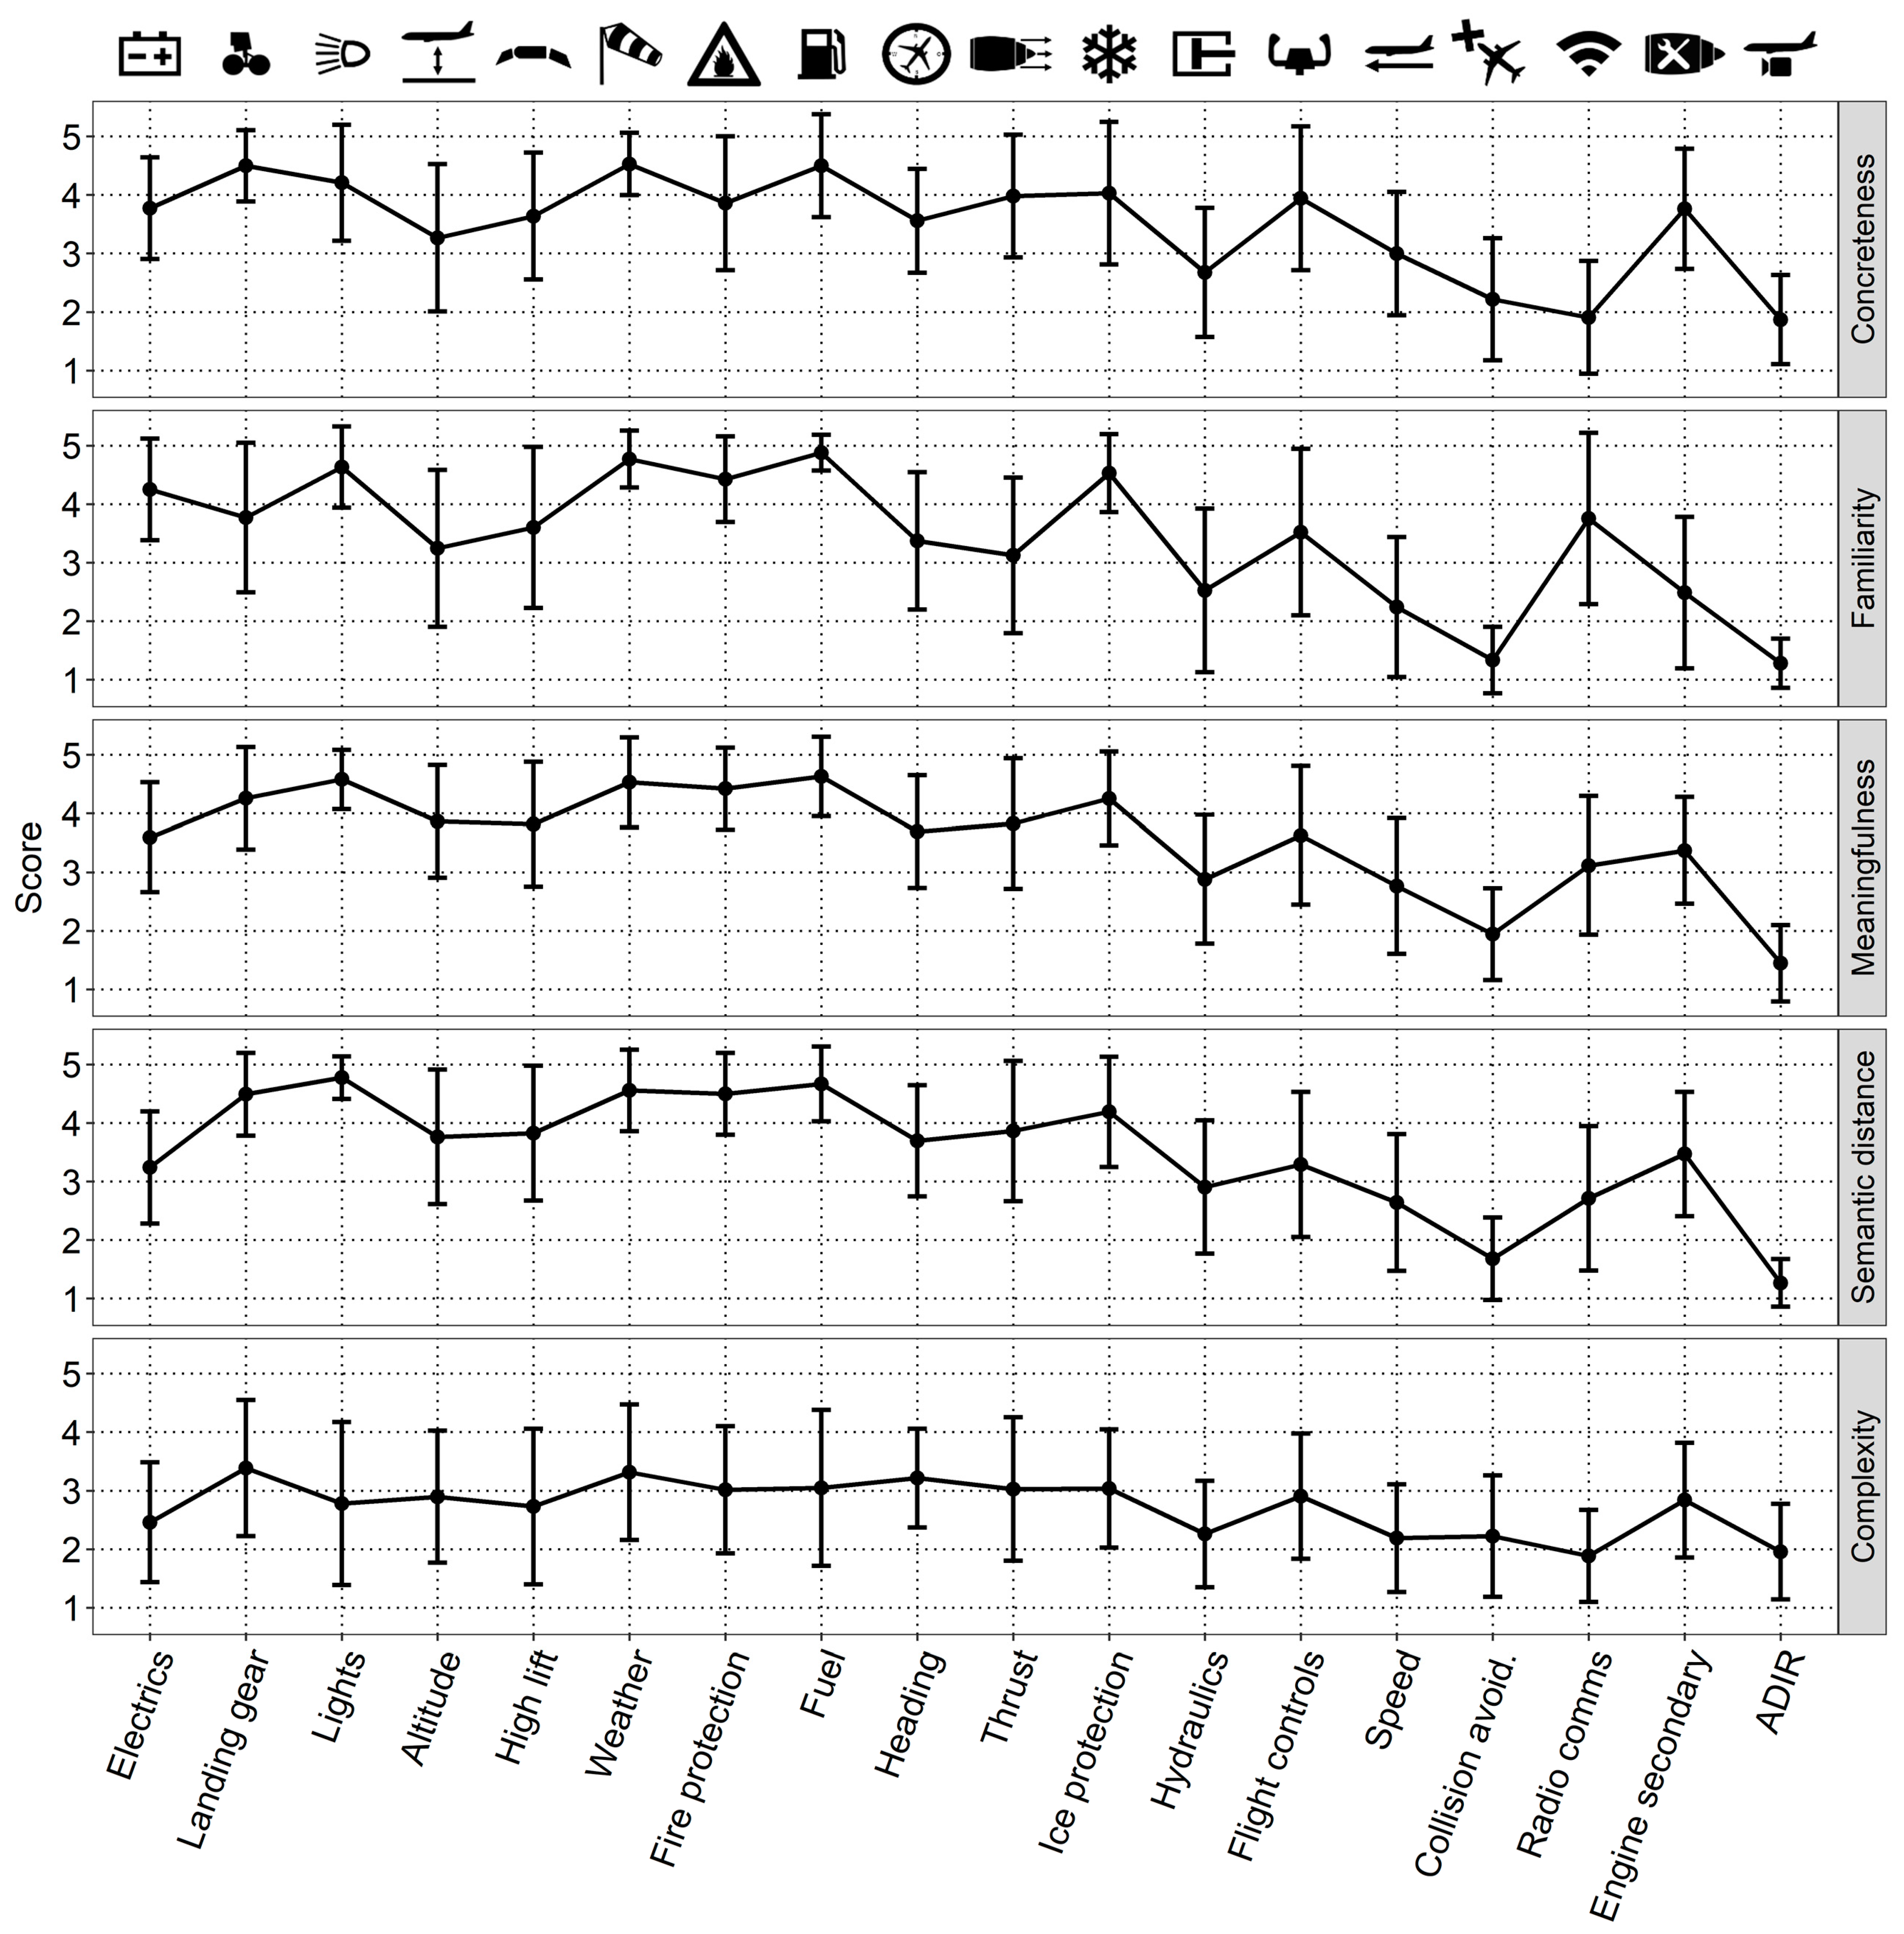
The best results in terms of name agreement H and concept agreement were observed for the electrics, landing gear and lights icons. For these icons, the agreement scores were the highest, and the differences between the name agreement and concept agreement scores were fairly low. Additionally, the icon characteristic ratings for these icons were among the highest in the icon set. The worst results for name agreement H were observed for the collision avoidance, hydraulics and flight controls icons, whereas for concept agreement the worst icons were collision avoidance, radio communications, engine secondary and ADIR. While all icons should transmit their intended meaning unambiguously, the severity of the consequences of misinterpreting an icon depends on the criticality of the function that the icon represents. For example, misinterpreting the radio communications or hydraulics icon poses a lower threat to safety than misinterpreting the collision avoidance, ADIR or flight control icons, particularly when they are used to capture the pilot’s attention in an emergency situation. As such, the collision avoidance, ADIR and flight controls icons in particular need to be redesigned. Further, icon characteristic norms may need to be adjusted in accordance with the safety threat that a misunderstood icon could pose. This means that, particularly for safety-critical icons, such as collision avoidance or fire warnings, the norms should be stricter than for icons representing less safety-critical functions.
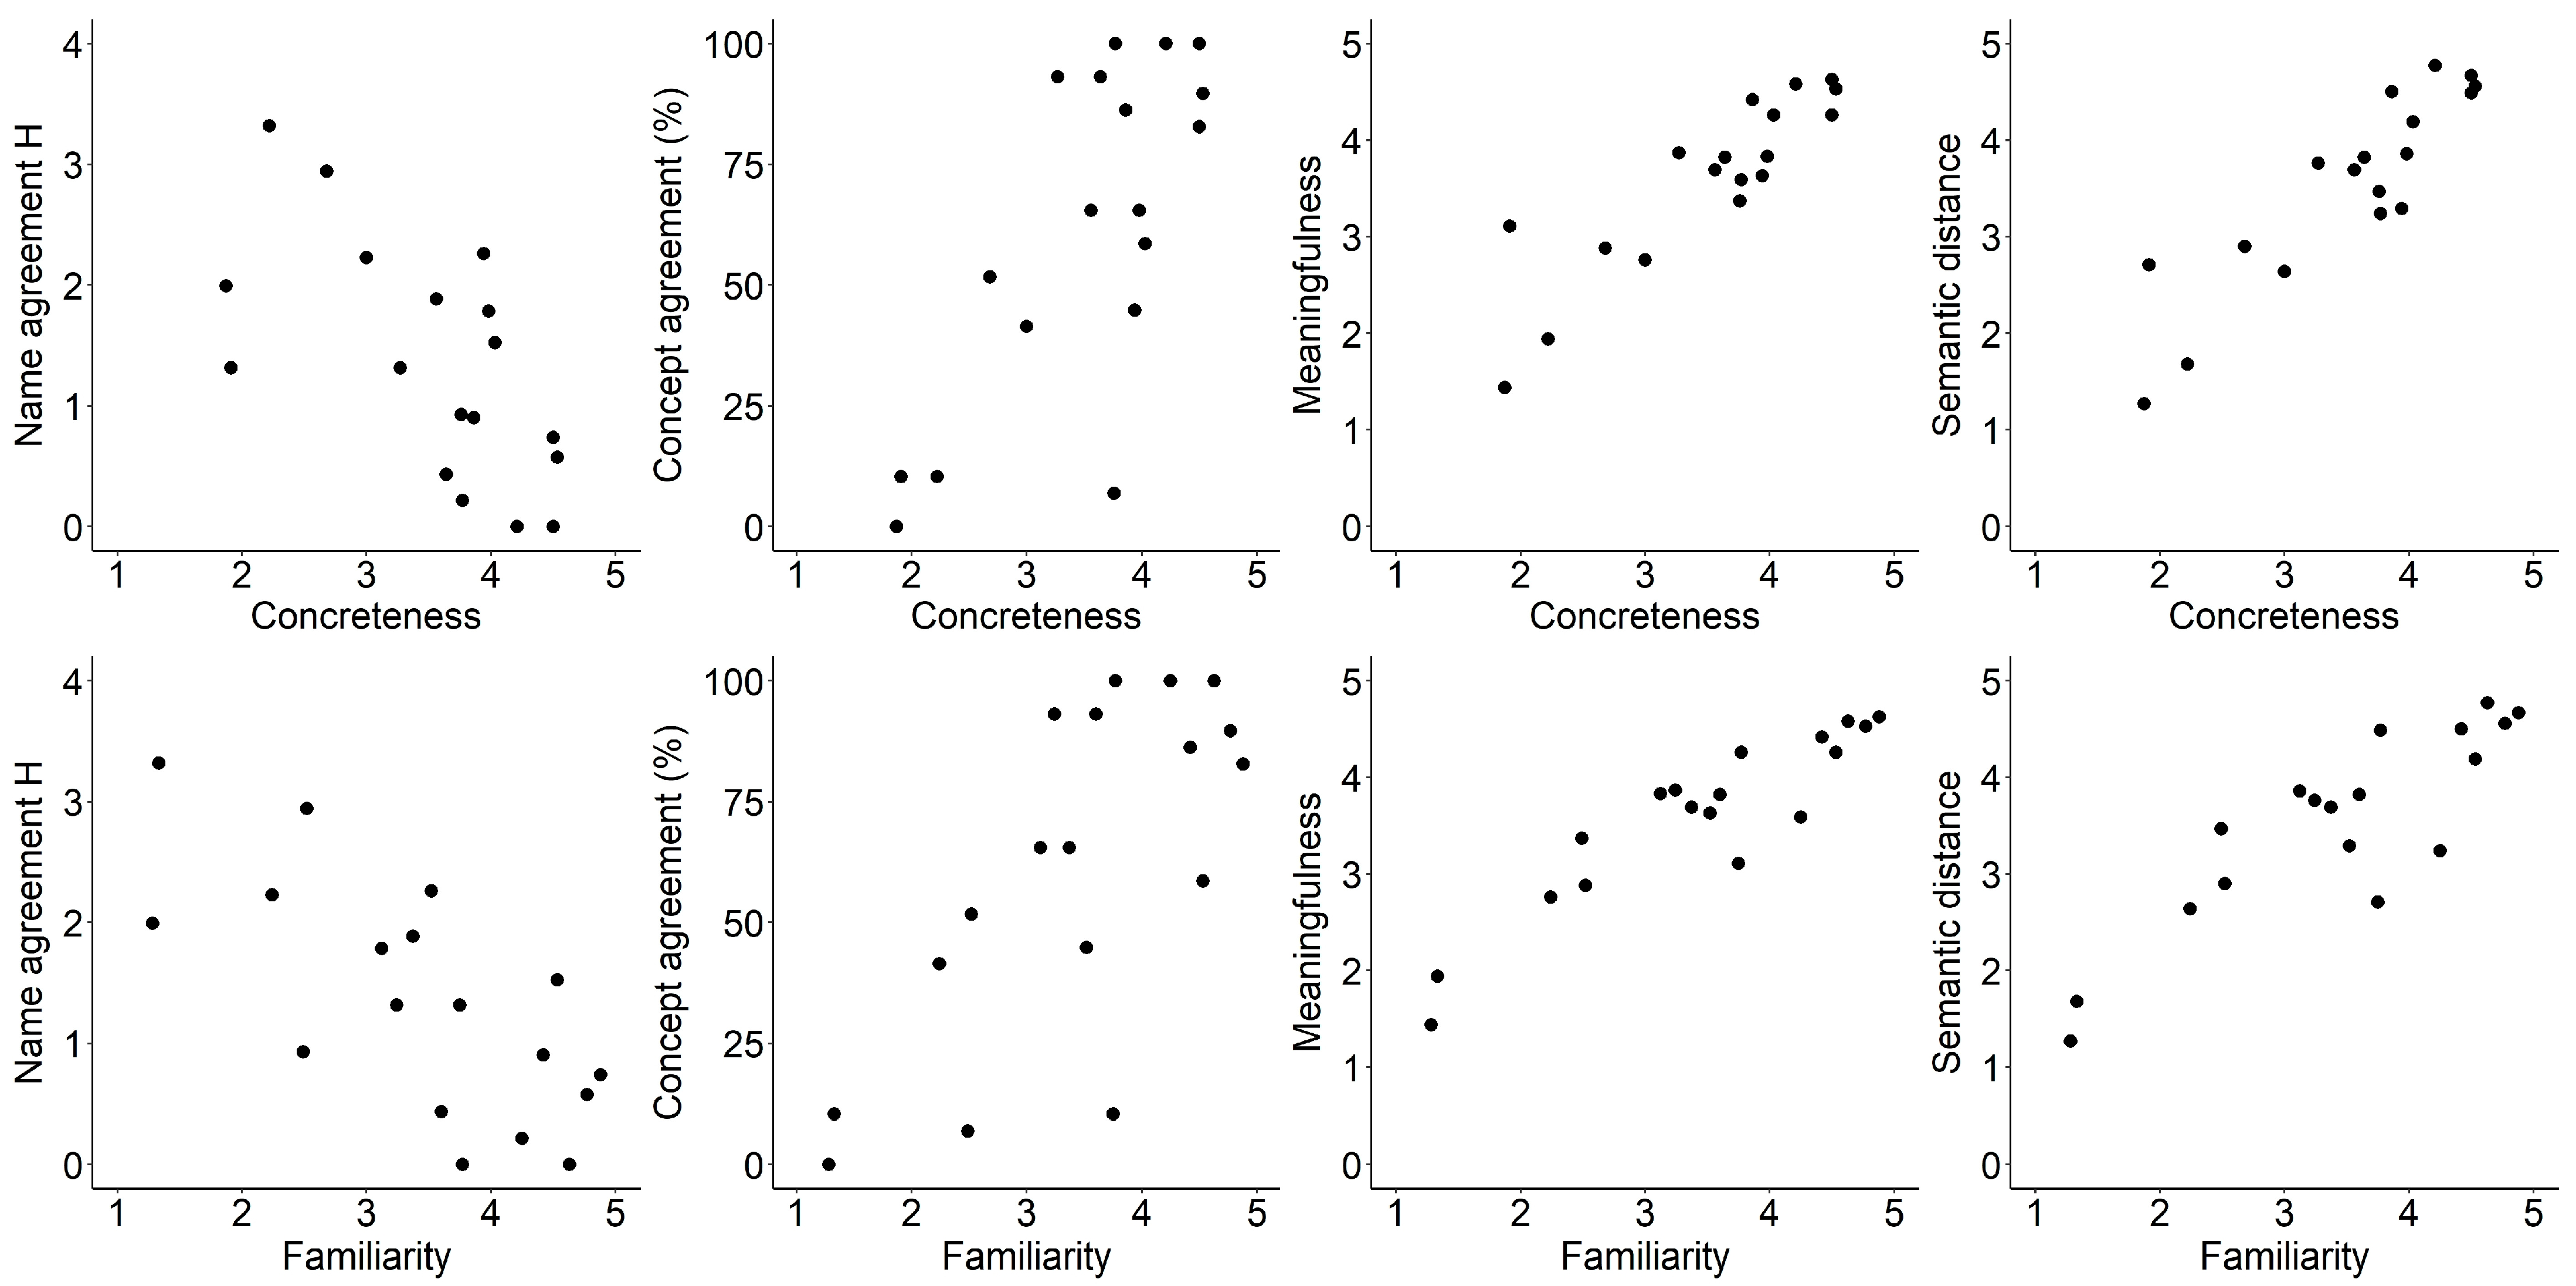
The results also show that emphasizing concreteness and familiarity in the design of the icons worked well, as can be seen, for example, in the results for the gear and altitude icons. The findings further show that with increasing concreteness and familiarity, the scores for concept and name agreement/H increase (cf. Figure 5). However, the findings also suggest that emphasizing familiarity only increased icon-function fit as long as the familiarity was directed at aviation-related artifacts. One should not use domain-spanning shapes to increase familiarity, as the results for the ADIR, radio communication and engine secondary icons show. These icons contain shapes familiar from other domains, such as photography (ADIR icon) or the IT domain (radio communication icon). As a consequence, the pilots mostly agreed on an unintended meaning, leading to high name but very low concept agreement scores. Additionally, one should not apply a part–whole design, as the use of the shapes of a hydraulic piston for representing the hydraulic systems or the use of a yoke for representing the flight controls demonstrates. The agreement scores for these icons are extremely low. The findings suggest that the design approach of showing only a part of the intended system function led to confusion with regard to the icon’s intended meaning. It is worth noting that despite the poor results for the hydraulics icon, the pilots in the study by Friedrich and Lieb [13] were able to quickly identify a hydraulic failure through the hue change of the icon, confirming that the effect of icon concreteness diminishes with progressive icon exposure [29]. The results further show that for some icons, the meaning was correctly recognized, but was misnamed. This is, for example, true for the altitude icon, for which various different yet correct meanings were given, such as height, altitude above reference or altitude or height which has to be flown. Since each of the given meanings is counted as a different name, name agreement decreases, although most given meanings represent the same concept—altitude. This example shows that when it comes to using icons to transmit (safety-critical) information, concept agreement seems to be more informative than name agreement or H.

7.2. Establishing Icon Characteristic Norms for Aviation

As mentioned before, the currently existing symbology standards in aviation focus on icons used in displays for specific purposes, such as detect and avoid. They do not cover the symbology requirements for representing safety-critical aircraft functions, such as hydraulic and electric supply or engine thrust. However, icons representing safety-critical aircraft functions are needed in order to provide a holistic overview of the states of safety-critical functions of the RPAS through an icon-based display.
Furthermore, no norms for the icon characteristics and agreement scores of icons representing safety-critical functions of aircraft exist. Consequently, it is currently not possible to evaluate newly designed icons representing safety-critical aircraft system functions by comparing their icon characteristic ratings and agreement scores to previously established norms. For standard icons, many studies have already proposed icon characteristic and agreement norms [18,25,38,41]. However, these studies used a wide array of different icons/picture stimuli, with no research being conducted on aerospace-specific icons that would establish norms for icons used in this domain. As such, there is a need to develop standardized norms of icon characteristics and agreement metrics for the aviation domain, against which newly designed icons can be compared. The results obtained in this study can serve as a first step in establishing such norms.
Further, various studies can be found in the literature that investigate the use of icons on the flight deck, for example, on head up displays [44,45,46]. The icons used in these studies, as well as the icons used on modern flight decks, prescribed for example by the DO-257A and DO-365 [34,35], could be used as icon sets to establish these norms.

7.3. Limitations and Next Steps

This study displays three main limitations. First, the fact that we consulted only one pilot in the design process and not several may have resulted in some less adequate icons in the icon set. This could have been avoided by asking for direct feedback from several other pilots. However, it was also somewhat intentional to have non-optimal designs in the icon set to create a greater variance in the ratings. Second, the discussed issue of the lack of appropriate norms to which the icons could be compared limits the significance of the results. Third, the relatively small sample sizes of 29 pilots and 18 icons limits the explanatory power of the findings. However, the adequacy of the sample size should be interpreted in terms of the size of the target population. Since the population of ATPL pilots tends to be small compared to the general population, one could argue that a sample size of 29 is adequate to represent the population of ATPL pilots. The same argumentation may be applied to the sample size of the icons. The number of plausible icons used to represent the intended functions is likely rather small, justifying the small sample size.
The icon set can now be used by other researchers, and potentially be validated further. For further evaluating the icons, additional performance data could be gathered within the operational environment in simulation studies, such as the study by Friedrich and Lieb [13]. It would also be worth investigating whether the evaluation results differ between ATPL pilots and pilots of large RPAS, such as the Global Hawk [47].

7.4. Implications

The findings of this study may well serve as a first step towards defining norms for icon characteristic and agreement metrics. They also provide relevant information for the design of icons representing safety-critical aircraft system functions, and reveal two central aspects that need to be taken into consideration for icon design. The use of shapes that remind the pilot of icons familiar from non-aviation domains may lead to confusion, and should thus be avoided. Further, reflecting only a part of an entity as a means to represent the whole entity (e.g., a piston to represent the hydraulic system) partially leads to a false understanding of the icon. This design approach should therefore be used with great caution.
Indeed, the icon ratings from this study can be used as a stepping stone for future developments in designing specific icon sets for remote pilots. Simply designing icons that are composed of good characteristics is only a single step within the design process. The icon set would then need to be considered against the complexity of how the user interacts with the system being designed, and the level of decision support (via automation/autonomy) that is provided. Adopting a cognitive engineering approach that understands how the individual would process icon information within the wider operational context would facilitate the wider design of the ground station. For example, presenting an icon as an important “anchor point”—from which the user may choose to interrogate or expand beyond the abstraction—that can sometimes be represented via a single icon [48].

8. Conclusions

In summary, this study demonstrates how established principles can be applied to design and evaluate icons representing safety-critical aircraft system functions for which no standards or norms currently exist. While the findings from the literature on icon design could be confirmed, and emphasizing concreteness and familiarity in the design of the icons led to more unambiguous and meaningful icons, some relevant icon design guidelines were discovered. First, the use of domain-spanning shapes to increase familiarity should be avoided. Second, showing only a part of the intended system in order to represent the entire function should also be avoided. Third, the findings suggest that for evaluating safety-critical icons, concept agreement seems to be a more informative measure than name agreement or H. Another important aspect that the findings revealed is that for the creation of icon characteristic standards and norms, the norms should potentially be stricter for safety-critical icons, such as collision avoidance or fire warnings, than for icons representing less safety-critical functions.
The findings of this study may well serve as a first step towards defining norms for icon characteristic and agreement metrics, and they provide relevant information for the design of icons representing safety-critical aircraft system functions. The icon set can now be used by other researchers, and be further validated and developed.

Author Contributions

Conceptualization, M.F. and D.R.; data curation, M.F.; formal analysis, M.F.; investigation, M.F. and D.R.; methodology, M.F. and D.R.; software, M.F.; supervision, D.R. and M.V.; visualization, M.F.; writing—original draft, M.F.; writing—review and editing, D.R. and M.V. All authors have read and agreed to the published version of the manuscript.

Funding

This research did not receive external funding.

Informed Consent Statement

Informed consent was obtained from all subjects involved in the study.

Acknowledgments

The authors would like to thank all pilots who participated in this study and enriched it with their professional knowledge.

Conflicts of Interest

The authors declare no conflict of interest.

Abbreviations

ADIRAir Data and Inertial Reference
ATPLAirline Transport Pilot License
GCSGround Control Station
RTCARadio Technical Commission for Aeronautics
RPASRemotely Piloted Aircraft System
USAFUnited States Airforce

References

  1. Williams, K.W. A summary of unmanned aircraft accident/incident data: Human factors implications. (DOT/FAA/AM-04/24). Federal Aviation Administration, Civil Aerospace Medical Institute. 2004. Available online: https://apps.dtic.mil/sti/pdfs/ADA460102.pdf (accessed on 7 January 2022).
  2. Hobbs, A.; Lyall, B. Human Factors Guidelines for Unmanned Aircraft Systems. Ergon. Des. 2016, 24, 23–28. [Google Scholar] [CrossRef] [Green Version]
  3. Hobbs, A. Human Factors in Aviation. In Unmanned Aircraft Systems, 2nd ed.; Salas, E., Maurino, D., Eds.; Elsevier: New York, NY, USA, 2010; pp. 505–531. [Google Scholar] [CrossRef]
  4. Hobbs, A. The Human Challenges of Remotely Piloted Aircraft Systems. In Proceedings of the International Symposium of the Australian Aviation Psychology Association (AAvPA); Adelaide, Australia, 7–10 November 2016. Available online: https://ntrs.nasa.gov/citations/20190025893 (accessed on 7 January 2022).
  5. Hobbs, A. Remotely Piloted Aircraft. In Handbook of Human Factors in Air Transportation Systems; Landry, S., Ed.; CRC Press: Boca Raton, FL, USA, 2017; pp. 379–396. [Google Scholar]
  6. Tvaryanas, A.P.; Thompson, W.T. Recurrent Error Pathways in HFACS Data: Analysis of 95 Mishaps with Remotely Piloted Aircraft. Aviat. Space Environ. Med. 2008, 79, 525–532. [Google Scholar] [CrossRef] [PubMed]
  7. Ells, J.G.; Dewar, R.E. Rapid Comprehension of Verbal and Symbolic Traffic Sign Messages. Hum. Factors J. Hum. Factors Ergon. Soc. 1979, 21, 161–168. [Google Scholar] [CrossRef]
  8. Rogers, Y. Evaluating the meaningfulness of icon sets to represent command operations. In People and Computers: Designing for Usability; Harrison, M.D., Monk, A.F., Eds.; Cambridge University Press: Cambridge, UK, 1983; pp. 586–603. [Google Scholar]
  9. Lodding, K.N. Iconic Interfacing. IEEE Comput. Graph. Appl. 1983, 3, 11–20. [Google Scholar] [CrossRef]
  10. Khanom, S.; Heimbürger, A.; Kärkkäinen, T. Can icons enhance requirements engineering work? J. Vis. Lang. Comput. 2015, 28, 147–162. [Google Scholar] [CrossRef] [Green Version]
  11. Hou, G.; Hu, Y. Designing Combinations of Pictogram and Text Size for Icons: Effects of Text Size, Pictogram Size, and Familiarity on Older Adults’ Visual Search Performance. Hum. Factors J. Hum. Factors Ergon. Soc. 2021, 00187208211061938. [Google Scholar] [CrossRef]
  12. Howitt, S.L.; Richards, D. The Human Machine Interface for Airborne Control of UAVs. In Proceedings of the 2nd AIAA “Unmanned Unlimited” Conference and Workshop and Exhibit, San Diego, CA, USA, 15–18 September 2003. [Google Scholar] [CrossRef]
  13. Friedrich, M.; Lieb, J. A Novel Human Machine Interface to Support Supervision and Guidance of Multiple Highly Automated Unmanned Aircraft. In Proceedings of the 2019 IEEE/AIAA 38th Digital Avionics Systems Conference (DASC), San Diego, CA, USA, 8–12 September 2019. [Google Scholar] [CrossRef]
  14. Friedrich, M.; Vollrath, M. Human Machine Interface Design for Monitoring Safety Risks Associated with Operating Small Unmanned Aircraft Systems in Urban Areas. Aerospace 2021, 8, 71. [Google Scholar] [CrossRef]
  15. Ferrell, W.R.; Sheridan, T.B. Supervisory control of remote manipulation. IEEE Spectr. 1967, 4, 81–88. [Google Scholar] [CrossRef]
  16. Peinecke, N.; Lueken, T.; Korn, B. Lidar simulation using graphics hardware acceleration. In Proceedings of the 2008 IEEE/AIAA 27th Digital Avionics Systems Conference (DASC), Saint Paul, MN, USA, 26–30 October 2008. [Google Scholar] [CrossRef]
  17. Friedrich, M.; Papenfuß, A.; Hasselberg, A. Transition from Conventionally to Remotely Piloted Aircraft—Investigation of Possible Impacts on Function Allocation and Information Accessibility Using Cognitive Work Analysis Methods. In Proceedings of the 8th International Conference on Applied Human Factors and Ergonomics, Los Angeles, CA, USA, 17–21 July 2017. [Google Scholar] [CrossRef]
  18. McDougall, S.J.P.; Curry, M.B.; De Bruijn, O. Measuring symbol and icon characteristics: Norms for concreteness, complexity, meaningfulness, familiarity, and semantic distance for 239 symbols. Behav. Res. Methods Instrum. Comput. 1999, 31, 487–519. [Google Scholar] [CrossRef] [Green Version]
  19. Isherwood, S. Graphics and Semantics: The Relationship between What Is Seen and What Is Meant in Icon Design. In Engineering Psychology and Cognitive Ergonomics. EPCE 2009. Lecture Notes in Computer Science; Harris, D., Ed.; Springer: Berlin/Heidelberg, Germany, 2009; Volume 5639, pp. 197–205. [Google Scholar] [CrossRef]
  20. McDougall, S.; Isherwood, S. What’s in a name? The role of graphics, functions, and their interrelationships in icon identification. Behav. Res. Methods 2009, 41, 325–336. [Google Scholar] [CrossRef] [Green Version]
  21. Silvennoinen, J.M.; Kujala, T.; Jokinen, J.P.P. Semantic distance as a critical factor in icon design for in-car infotainment systems. Appl. Ergon. 2017, 65, 369–381. [Google Scholar] [CrossRef] [PubMed] [Green Version]
  22. Martein, R. Norms for name and concept agreement, familiarity, visual complexity and image agreement on a set of 216 pictures. Psychol. Belg. 1995, 35, 205–225. [Google Scholar] [CrossRef]
  23. Tsaparina, D.; Bonin, P.; Méot, A. Russian norms for name agreement, image agreement for the colorized version of the Snodgrass and Vanderwart pictures and age of acquisition, conceptual familiarity, and imageability scores for modal object names. Behav. Res. Methods 2011, 43, 1085–1099. [Google Scholar] [CrossRef] [PubMed] [Green Version]
  24. Shannon, C.E. A Mathematical Theory of Communication. Bell Syst. Tech. J. 1948, 27, 379–423. [Google Scholar] [CrossRef] [Green Version]
  25. Snodgrass, J.G.; Vanderwart, M. A standardized set of 260 pictures: Norms for name agreement, image agreement, familiarity, and visual complexity. J. Exp. Psychol. Hum. Learn. Mem. 1980, 6, 174–215. [Google Scholar] [CrossRef]
  26. McDougall, S.J.P.; De Bruijn, O.; Curry, M.B. Exploring the effects of icon characteristics on user performance: The role of icon concreteness, complexity, and distinctiveness. J. Exp. Psychol. Appl. 2000, 6, 291–306. [Google Scholar] [CrossRef] [PubMed]
  27. McDougall, S.J.P.; Curry, M.B.; de Bruijn, O. The Effects of Visual Information on Users’ Mental Models: An Evaluation of Pathfinder Analysis as a Measure of Icon Usability. Int. J. Cogn. Ergon. 2001, 5, 59–84. [Google Scholar] [CrossRef] [Green Version]
  28. Green, A.J.K.; Barnard, P.J. Graphical and iconic interfacing: The role of icon distinctiveness and fixed or variable screen locations. In INTERACT ’90 Proceedings of the IFIP TC13 Third Interational Conference on Human-Computer Interaction; Diaper, D.G., Gilmore, G., Cockton, G., Shackel, B., Eds.; Elsevier Science & Technology: Oxford, UK, 1990; pp. 457–462. [Google Scholar]
  29. Isherwood, S.J.; McDougall, S.J.P.; Curry, M.B. Icon Identification in Context: The Changing Role of Icon Characteristics with User Experience. Hum. Factors J. Hum. Factors Ergon. Soc. 2007, 49, 465–476. [Google Scholar] [CrossRef]
  30. Shen, Z.; Xue, C.; Wang, H. Effects of Users’ Familiarity with the Objects Depicted in Icons on the Cognitive Performance of Icon Identification. I-Perception 2018, 9, 204166951878080. [Google Scholar] [CrossRef] [Green Version]
  31. McDougall, S.; Tyrer, V.; Folkard, S. Searching for signs, symbols, and icons: Effects of time of day, visual complexity, and grouping. J. Exp. Psychol. Appl. 2006, 12, 118–128. [Google Scholar] [CrossRef]
  32. Smythwood, M.; Hadzikadic, M. The Effects of Icon Characteristics on Search Time. In Proceedings of the 9th International Conference on Applied Human Factors and Ergonomics, Orlando, FL, USA, 21–25 July 2018. [Google Scholar] [CrossRef]
  33. USAF. MIL-STD-1787D Aircraft Display Symbology. 2018. Available online: https://standards.globalspec.com/std/10286851/MIL-STD-1787D%20CONT.%20DIST (accessed on 7 January 2022).
  34. RTCA. Minimum Operational Performance Standards for the Depiction of Navigational Information on Electronic Maps. 2003. Available online: https://standards.globalspec.com/std/13105456/RTCA%20DO-257 (accessed on 7 January 2022).
  35. RTCA. Minimum Operational Performance Standards (MOPS) for Detect and Avoid (DAA) Systems. 2017. Available online: https://standards.globalspec.com/std/14374050/rtca-do-365 (accessed on 7 January 2022).
  36. Rossion, B.; Pourtois, G. Revisiting Snodgrass and Vanderwart’s Object Pictorial Set: The Role of Surface Detail in Basic-Level Object Recognition. Perception 2004, 33, 217–236. [Google Scholar] [CrossRef] [PubMed] [Green Version]
  37. Dimitropoulou, M.; Duñabeitia, J.A.; Blitsas, P.; Carreiras, M. A standardized set of 260 pictures for Modern Greek: Norms for name agreement, age of acquisition, and visual complexity. Behav. Res. Methods 2009, 41, 584–589. [Google Scholar] [CrossRef] [PubMed] [Green Version]
  38. Janssen, N.; Pajtas, P.E.; Caramazza, A. A set of 150 pictures with morphologically complex English compound names: Norms for name agreement, familiarity, image agreement, and visual complexity. Behav. Res. Methods 2011, 43, 478–490. [Google Scholar] [CrossRef] [PubMed] [Green Version]
  39. Raman, I.; Raman, E.; Mertan, B. A standardized set of 260 pictures for Turkish: Norms of name and image agreement, age of acquisition, visual complexity, and conceptual familiarity. Behav. Res. Methods 2013, 46, 588–595. [Google Scholar] [CrossRef]
  40. Prada, M.; Rodrigues, D.; Silva, R.R.; Garrido, M.V. Lisbon Symbol Database (LSD): Subjective norms for 600 symbols. Behav. Res. Methods 2015, 48, 1370–1382. [Google Scholar] [CrossRef]
  41. Rodrigues, D.; Prada, M.; Gaspar, R.; Garrido, M.V.; Lopes, D. Lisbon Emoji and Emoticon Database (LEED): Norms for emoji and emoticons in seven evaluative dimensions. Behav. Res. Methods 2018, 50, 392–405. [Google Scholar] [CrossRef]
  42. Souza, C.; Garrido, M.V.; Carmo, J.C. A Systematic Review of Normative Studies Using Images of Common Objects. Front. Psychol. 2020, 11, 1–23. [Google Scholar] [CrossRef]
  43. Inkscape. Available online: https://inkscape.org/de/ (accessed on 17 September 2021).
  44. Martin-Emerson, R.; Wickens, C.D. Superimposition, Symbology, Visual Attention, and the Head-Up Display. Hum. Factors J. Hum. Factors Ergon. Soc. 1997, 39, 581–601. [Google Scholar] [CrossRef]
  45. Foyle, D.; Hooey, B.; Wilson, J.; Johnson, W. HUD Symbology for Surface Operations: Command Guidance vs. Situation Guidance Formats. SAE Trans. 2002, 111, 647–658. [Google Scholar]
  46. Richards, D.; Lamb, P. Functional Symbology—Evaluation of task-specific Head-Up Display information for use on a commercial flight deck. In Proceedings of the AIAA Modeling and Simulation Technologies Conference, Washington, DC, USA, 13–17 June 2016. [Google Scholar] [CrossRef]
  47. Northrop Grumman. Global Hawk. Available online: https://www.northropgrumman.com/what-we-do/air/global-hawk/ (accessed on 17 September 2021).
  48. Richards, D. Abstraction and intent: Human Factors for controlling multiple UAS. In Proceedings of the Association for Unmanned Vehicle Systems International: Xponential 2018, Colarado Convention Centre, Denver, CO, USA, 1–3 May 2018. [Google Scholar]
Figure 1. Illustration of the U-FLY GCS. Left: flight technical parameters and icon display; middle: flight plan widget and map display; right: payload screens for electro-optical cameras (upper screens) and Lidar sensors (lower screens).
Aerospace 09 00181 g001
Figure 2. Icon display of the U-FLY GCS during a hydraulic pump failure for the RPAS-labeled DLR574, leading to the inability to deflect flaps and the landing gear, which is indicated by the red hue of the corresponding icons.
Aerospace 09 00181 g002
Figure 3. Example question from the first part of the online questionnaire.
Aerospace 09 00181 g003
Figure 4. Example question from the second part of the questionnaire.
Aerospace 09 00181 g004
Figure 5. Scatterplots with concreteness and familiarity on the x-axes, and name agreement H, concept agreement, meaningfulness and semantic distance on the y-axes.
Aerospace 09 00181 g005
Figure 6. Means and standard deviations for the icon characteristic ratings of the icons representing landing gear (H = 0.0), altitude (H = 1.3) and collision avoidance (H = 3.3).
Aerospace 09 00181 g006
Figure 7. Means and standard deviations for the obtained ratings of each icon characteristic and icon. The icons are ordered by concept agreement. ADIR = Air Data and Inertial Reference.
Aerospace 09 00181 g007
Table 1. Explanations of the icon characteristics.
Icon CharacteristicDescription
ComplexityDescribes the amount of detail in the icon.
ConcretenessDescribes how well the icon depicts an object in the real world. The icon is concrete if it depicts an object well and it is abstract if it does not.
FamiliarityDescribes how familiar you are with the depicted icon in terms of how often you encounter the icon in your everyday life. The icon is unfamiliar if you feel that you never encounter it and familiar if you feel that you encounter it frequently.
MeaningfulnessDescribes how meaningful you perceive the icon to be. High ratings (4 or 5) mean that it conveys a great deal of meaning, and low ratings (1 or 2) mean that it conveys little meaning.
Semantic DistanceDescribes the distance as a measure of closeness between the icon and its meaning, i.e., what the icon is intended to represent. For example, a picture of a printer used as an icon for printing documents is closely related to its meaning. In contrast, a triangle used to indicate “hazard ahead” is much less closely related to its meaning.
Table 2. Designed icons and descriptions of the design rationales.
FunctionIconDesign Rationale
Altitude Aerospace 09 00181 i001Section of an aircraft and vertical arrow and ground reference to illustrate altitude.
Speed Aerospace 09 00181 i002Section of an aircraft and horizontal arrow representing forward speed.
Heading and track Aerospace 09 00181 i003Aircraft on a compass representing direction of flight of the aircraft.
High lift Aerospace 09 00181 i004Section of an aircraft wing with extended flaps and slats. A wing should be familiar to pilots.
Landing gear Aerospace 09 00181 i005Section of an aircraft main gear. The view of the gear should be familiar to pilots.
Lights Aerospace 09 00181 i006Shapes similar to a head light icon that should be familiar from a car display.
Primary flight controls Aerospace 09 00181 i007A yoke for representing flight controls. A yoke should be a familiar sight for pilots.
Thrust—engine primary Aerospace 09 00181 i008Engine producing thrust, indicated by the arrows.
Fuel Aerospace 09 00181 i009Gasoline pump representing fuel. The icon is frequently used in everyday life and should thus be familiar.
Radio communication Aerospace 09 00181 i010Curved bars representing radio waves using shapes similar to a Wireless LAN icon, which should be familiar.
Air data and inertial reference (ADIR) Aerospace 09 00181 i011Section of an aircraft and a camera, representing observation of the outside environment.
Engine—engine secondary Aerospace 09 00181 i012Engine with spanner and screwdriver indicating a malfunction in the secondary engine parameters.
Electrics Aerospace 09 00181 i013A battery icon for representing the electric systems.
Hydraulics Aerospace 09 00181 i014Shapes of a hydraulic cylinder to illustrate a part of the hydraulic system.
Collision avoidance Aerospace 09 00181 i015Aircraft and a cross representing an object ahead of the aircraft.
Fire protection Aerospace 09 00181 i016Warning triangle, familiar from warning signs and shapes representing fire.
Ice protection Aerospace 09 00181 i017Snowflake representing icy conditions. The icon is very general and should be familiar.
Meteorological conditions (weather) Aerospace 09 00181 i018Windsock representing weather. Windsocks should be familiar to pilots and easily relatable to wind and weather conditions.
Table 3. Computed spearman rank correlations.
MetricsSpearman Rho
ConcretenessName agreement Hrs(16) = −0.61, p < 0.01
Concept agreementrs(16) = 0.61, p < 0.01
Meaningfulnessrs(16) = 0.86, p < 0.001
Semantic distancers(16) = 0.87, p < 0.001
FamiliarityName agreement Hrs(16) = −0.71, p < 0.001
Concept agreementrs(16) = 0.65, p < 0.01
Meaningfulnessrs(16) = 0.86, p < 0.001
Semantic distancers(16) = 0.81, p < 0.001
Table 4. Descriptive statistics for the agreement metrics across all 18 icons.
MetricnMMdnSDMinMax
Concept agreement (%)1861.1165.5035.250.00100.00
Name agreement (%)1867.2563.8024.3724.10100.00
Name agreement (H)181.351.310.970.003.32
Table 5. Descriptive statistics for the five icon characteristics across all 18 icons and 29 pilots.
MetricnMMdnSDMinMax
Complexity292.732.870.451.883.39
Concreteness293.513.770.851.874.53
Familiarity293.433.561.101.284.88
Meaningfulness293.593.760.891.444.63
Semantic Distance293.533.721.001.274.77
Table 6. Results for H, name agreement (Name a.) and concept agreement (Concept a.) (%), the difference between concept and name agreement scores (Diff.), the most frequently given meaning and the number of different meanings given for each icon (n). The icons are ranked in descending order by the score for concept agreement.
IconHName a.Concept a.Diff.Most Frequent Meaningn
Electrics0.296.6100.03.4Battery2
Landing gear0.0100.0100.00.0Gear/undercarriage1
Lights0.0100.0100.00.0Lights1
Altitude1.358.693.134.5Height4
High lift0.493.193.10.0Flaps3
Weather0.689.789.70.0Wind (indication/information)3
Fire protection0.982.886.23.4Fire (status/present/danger)4
Fuel0.779.382.83.5Fuel2
Heading1.955.265.510.3(Magnetic) heading6
Thrust1.858.665.56.9Thrust7
Ice protection1.551.758.66.9Ice/icing5
Hydraulics2.934.551.717.2Hydraulics/hydraulic actuator11
Flight controls2.334.544.810.3Yoke/control column7
Speed2.241.441.40.0(Forward) speed (vector)8
Collision avoid.3.324.110.313.8Forbidden/prohibited14
Radio comms.1.369.010.358.7WiFi/WLAN/wireless connection4
Engine secondary0.982.86.975.9Engine (needs) maintenance (status)4
ADIR2.058.60.058.6(Outside) camera8
Publisher’s Note: MDPI stays neutral with regard to jurisdictional claims in published maps and institutional affiliations.

