Why the Par Value of Share Matters to Investors


Faculty of Computer Science and Management, Wrocław University of Science and Technology, 50-370 Wrocław, Poland
*
Author to whom correspondence should be addressed.
Int. J. Financial Stud. 2021, 9(1), 16; https://0-doi-org.brum.beds.ac.uk/10.3390/ijfs9010016
Submission received: 24 January 2021
/
Revised: 9 March 2021
/
Accepted: 12 March 2021
/
Published: 16 March 2021
Abstract
:The purpose of the study is the analysis of the relationship between the par value (also known as nominal value or face value) and the parameters influencing a company’s financing. Additionally, the utility of the par value as a manipulation tool for equity offerings is examined. The study is based on a sample of IPO firms which went public on the Warsaw Stock Exchange. The study finds that an excess supply of shares has a negative impact on their valuation. In contrast, decreasing the par value prompts perceptual biases among investors beneficial to the success of the issuance. Moreover, share capital is found to be a useful signaling tool to improve the company’s position on the financial market.
Keywords:
par value; financing; share premium; share capital; signaling; face value; nominal value; share price psychology; IPO; WSE1. Introduction
The concept of par value (hereinafter PaV) was created to protect the public against fraud in the sale of stocks (Cook 1921). Par value is given to each share to represent the amount of capital contributed by each shareholder (Kee and Luh 1999), which cannot be redistributed during the existence of a corporation, and new shares cannot be sold below par value. Par value, often referred to as face or nominal value, multiplied by the number of shares equals the share capital of the company. Share capital in its original design should be the financial basis of the company and guarantee the satisfaction of creditors’ claims. Share capital is the foundation for the capital maintenance principle, created to protect corporate creditors against the “extra” risks associated with limited shareholder liability (Armour 2000).
Although the concept of par value has been criticized since its inception, it has become the cornerstone of company law in many countries. Today, there is a tendency to abandon the par value regime in many countries, but it still has a strong position in the European Union and in the European Economic Area. The par value regime was supported by the Second Council Directive of 13 December 1976 and later analyses presented in both the Reforming capital report prepared by the Interdisciplinary Group on Capital Maintenance (Rickford 2004) and the Feasibility study on an alternative to the capital company’s regime undertaken by KPMG on behalf of the European Commission (KPMG 2008). The reports stated that the alternative legal solutions to the par value regime do not unambiguously present better features. In response to the findings of these studies, the European Commission’s Directorate General of Internal Markets and Services does not foresee any imminent changes to the Second Directive. Therefore, the par value regime will not disappear from the economic law of many countries in the near future, which will require further research into its functioning and usefulness. And although the par value regime as the main part of the principle of maintaining capital is normally considered to be a technical issue for lawyers and accountants, it can significantly affect the financing of a company (Rickford 2004) because it represents a conjunction between shareholders’ and creditors’ interests (Santella and Turrini 2008). In addition, research has suggested that creditor protection has an impact on companies’ capital structure (Cho et al. 2014) and post-IPO operating performance (Espenlaub et al. 2020).
When a company is set up, capital needs are crucial and determine the size of the share capital. According to the Second Council Directive, however, it cannot be lower than EUR 25,000. The decision on the number of shares into which it will be divided determines the nominal value of one share. At that time, shareholders buy shares at their nominal value, and the capital accumulated in this way determines the company’s creditworthiness and its ability to obtain debt. The capital contributed at this time by shareholders increases the share capital and determines the size of their shares in the company’s property, the number of votes and the rights to profit. At the next stage of the company’s life, if it generates profits, it may accumulate them, and partly must do so, according to existing law, increasing the reserve capital that is part of the company’s equity. However, this does not affect the shareholders’ shares but increases the book value of one share and affects its market value. Thus, three types of stock values—the nominal value, book value and market value—start to diverge. Another important stage of the company’s life is the decision to raise capital by issuing new shares. The issue of new shares has an impact on the shares of individual shareholders. For primary shareholders, it is crucial to obtain as much capital as possible while simultaneously selling the shares as little as possible to avoid losing control over the company. Therefore, primary shareholders are interested in selling new shares at an issue price that is higher than the nominal value according to the mechanism presented in Table 1. In the example in Table 1, there is a share capital of EUR 25,000 which is divided into 10,000 shares and reserves of EUR 20,000. Thus, the nominal value of 1 share is EUR 2.5, and the book value is EUR 4.50 (Column 2). Suppose the company then issues 2500 new shares at the issue price of EUR 20. As we can see, the new shareholders receive 20% of the shares in the company, and at the same time the company increases its share capital by 25%, receives a 43,750 EUR portion of share premium and increases the total equity by 111%. The new issue increases the book value of 1 share of the existing shareholders by 69%.
As already mentioned, the key to such success is the company’s acquisition of an issue price that exceeds the nominal value. The high valuation of newly issued shares is undoubtedly related to the company’s good financial standing and perspectives. However, from the above example, we can see that PaV has an impact on many aspects related to the new issue.
First, it determines the number of shares issued. Second, it is a benchmark for other types of share values, being their lower limit. Third, the resulting share capital cannot be distributed during the existence of the company and is a formal guarantee for the company’s creditors. Therefore, the question arises of whether PaV can be used as a tool to improve the success of the issue.
The focus of this study is on analyzing the relationship between the PaV and the parameters influencing a company’s financing. The utility of the PaV as a manipulation tool for equity offerings is examined. The research is carried out during an initial public offering (IPO), which is a good laboratory for studying many phenomena functioning on the capital market.
Our paper contributes to the strand of literature called the psychology of stock price levels by Baker et al. (2009). Previous research in this area focused mainly on the reasons for and consequences of stock splits, and the main theories include the trading range hypothesis and signalling theories. The trading range hypothesis assumes that there is an “optimal” trading range (Baker and Gallagher 1980; Lakonishok and Lev 1987; Huang and Weingartner 2000; Dyl and Elliott 2006; Huang et al. 2009). Share prices are equalised to this range by a stock split, which improves their liquidity and contributes to expanding the ownership base. In turn, signalling theory uses a split to reduce information asymmetry between managers and investors. Through a stock split, managers convey private information about future earnings growth to investors, which may translate into an increase in the price of shares (Lakonishok and Lev 1987; Huang et al. 2006; Kunz and Rosa-Majhensek 2008). However, according to Baker et al. (2009), the psychology of stock price levels remains unexplored. In our research, we analyze the problem from a different perspective. We examine how companies can influence the behavior of investors by setting a nominal share price arbitrarily in order to contribute to the success of the new issue. In other words, we analyze how the nominal price affects the relationship of market valuation of shares with their fundamentals. Thus, we fill the gap signaled by Baker et al. (2009, p. 2562) in their question of “why nominal share prices matter to investors”. The detailed contribution of this paper is summarized as follows. First, to the best of our knowledge, this is the first article presenting empirical research on the functioning of the PaV regime in practice. Although the concept of PaV has a long history, previous discussion of its functioning in practice has taken place on the basis of theoretical considerations in the field of accounting and law. Second, we show that PaV, through its internal functioning mechanism, can be an effective tool for financing the company. Third, we enrich the theory of the influence of the nominal value of shares on price with the theory of supply. The literature includes such theories as the optimal price range and signaling theory. We show that the share price is also affected by the number of shares issued, which may be characteristic only for small exchanges with low liquidity. Fourth, we show that theories such as the illusion of money and the effect of face value, which work well with the prices of goods, also function in the case of share prices. Perceptual biases that lie in focusing only on the number printed on the banknote or label and ignore the actual value of money or commodity also occur when valuing shares. Fifth, we confirm the effectiveness of share capital as a useful signaling tool for the company to increase the success of a new issue. Moreover, the study is conducted based on the performance on the Warsaw Stock Exchange, which belongs to one of the fastest growing markets. During the global financial crisis, the Polish stock market, in contrast to other European stock exchanges, became a regional leading bourse that saw the highest increment in market capitalization thanks to large IPOs, improved transparency, investor protection and liquidity (Prorokowski and Roszkowska 2014). It is described as a regional giant and a European dwarf (Kolany 2017). The dynamic development of the Polish capital market led to its upgrade to developed market status by FTSE Russell on 24 September 2018. However, on the one hand it still has unique features in the European market, and on the other hand, as noted by Prorokowski and Roszkowska (2014), this market is arguably under-researched, and practitioners express strong interest in a study that would facilitate a peer review of approaches to equity investments in this market. This is important also because stock market equity financing with a strong risk tolerance capacity plays a more important role in supporting technological innovation than bank debt financing in terms of both economic uptrend and economic downtrend (Zhang et al. 2019). As a result, such a study can contribute to reducing the technological gap in Eastern Europe.
2. Literature Review and Research Hypotheses
2.1. Background
Share capital contributed at the time of incorporation of a company is the basis of the capital maintenance principle created to protect corporate creditors against the “extra” risks associated with limited shareholder liability. Therefore, the capital maintenance doctrine can be understood as a means of reducing the costs of post-contractual opportunism by shareholders (Armour 2000). The legal capital may be treated as a financial cushion for creditors by acting as capital adequacy provisions similar to those governing financial institutions (Bachner 2009; Handschin 2012). From an organizational point of view, it is closely related to shareholders’ voting rights and rights to dividends, as well as their rights to participate in liquidation proceeds (Santella and Turrini 2008). Despite its potential benefits, it is also not free from criticism. For example, Enriques and Macey (2001) consider that legal capital rules impose unjustifiable burdens on companies and society as a whole, while they do not significantly benefit creditors and in some cases even harm them. The PaV regime, although designed with the intention of protecting creditors, may be used as a tool to influence the company’s financing (Rickford 2004). There are two types of such influence, the first of which is behavioral and the second is related to signaling theory.
The first impact results from both the number of shares being issued and the PaV, which may induce perceptual biases among investors. The decision on the declared PaV determines the number of shares, as well as having an impact on other prices. Therefore, PaV can be a “price management” tool (Baker et al. 2009). There are theories that the market prefers specific share prices. Weld et al. (2009) show that the average annual share price on all US stock exchanges over the 1933–2007 period was approximately constant and equal to about 25$ and 36$ in the case of equally weighted average and value-weighted average, respectively. Of course, the real price was systematically falling during this period. The authors suggest norms as a potential explanation of this phenomenon. Baker and Gallagher (1980) surveyed 100 chief financial officers (CFOs) and found that managers use a split to keep a share in the optimal price range. However, the optimal trade range of shares varies across firms (Dyl and Elliott 2006). Baker and Gallagher (1980) find that lower share prices are more attractive to investors, and consequently companies can broaden their ownership base. Dyl and Elliott (2006), Fernando et al. (1999) and D’Mello et al. (2003) also find evidence supporting the marketability of the equity offering to individual investors. Less wealthy investors prefer lower stock prices so they can more easily diversify their portfolios. Large companies, on the other hand, have a large investor base, so they are not concerned about the optimal price range and place an emphasis on liquidity and transaction costs (Huang et al. 2009; Muscarella and Vetsuypens 1996). These features are preferred by large investors, above all institutions (Dyl and Elliott 2006). Moreover, Lakonishok et al. (1992) and Gompers and Metrick (2001) find that individual investors prefer lower-priced shares more than do institutions, suggesting a somewhat segmented market. In turn, management may prefer small investors, as such investors exercise comparatively less control over company operations and thus management may create an ownership mix (Powell and Baker 1993). Low share prices also contribute to an increase in liquidity (Huang et al. 2009).
The second type of impact results from the value of the entire share capital and its signaling function. According to the signaling hypothesis, as an alternative theory related to a split, stock splits are associated with the announcement of positive excess returns because managers use the split to provide promising private information about future company results (Huang et al. 2006). Although the origins of this theory can be found in Lakonishok and Lev (1987), few authors have confirmed it. Huang et al. (2008) show that firms that split their shares infrequently signal their future prospects more often than firms that split the shares frequently. Although in the year of split announcement firms have the highest operational results, the authors do not find evidence that the split provides a reliable signal about the future increase of the firms’ achievements (Huang et al. 2006; 2009). On the contrary, the split is negatively correlated with the company’s operating results. The exceptions are firms that have a split factor less than 0.5 and also pay dividends (Huang et al. 2006). More evidence to confirm the signaling hypothesis was found by Kunz and Rosa-Majhensek (2008), who conclude that the split is an important signal about the future rise in share prices but does not explain a large part of the observed price increase.
2.2. Hypotheses
This study examines whether the price of shares is influenced by their supply on the market. Assuming that a given market has a certain number of active investors who want to diversify their portfolios, they will be interested in buying only a certain number of shares regardless of their price. Fernando et al. (1999) present this problem vividly by quoting Yogi Berra, who, when asked if he wanted his pizza cut into four or six pieces, said, “You’d better make it four; I don’t think I can eat six pieces”. In this case, an increase in the number of shares can have a negative impact on their price. Therefore, managers strive to issue the optimal range for the number of shares. These arguments lead to the formulation of the following hypothesis:
Hypothesis 1 (H1).
There is an optimal range for the number of shares issued by the company.
PaV is assumed to be the lowest of share prices, because shares cannot be sold below PaV. It is therefore a natural reference for other prices. If a new issue is sold above PaV, a share premium will be created, increasing the reserve capital (Böcskei et al. 2020). Primary shareholders are interested in obtaining as high a share premium as possible during new issuance. Therefore, they will take action to maximize the share premium, and systematic perceptual biases among investors, such as the illusion of money, make it easier. Investors focusing on the number reflecting the share price ignore the fundamentals of valuation (Svedsater et al. 2007). The “face value” effect known in the theory of marketing works in a similar manner (Lowe et al. 2012). The same applies to the catering theory of nominal share prices formulated by Baker et al. (2009), according to which the nominal prices matter to investors and help managers obtain high valuations of shares. For this reason, share splits are used as manipulation tools for equity offerings (D’Mello et al. 2003). Thus, we can formulate our second hypothesis as follows:
Hypothesis 2 (H2).
A small par value affects the systematic perceptual biases among investors and thus affects the valuation of shares.
The proponents of legal capital emphasize that it functions as a signal by providing a valuable signaling device for corporations to improve their position in the credit markets; it signals that shareholders have confidence in their firm and intend to work hard to succeed in the venture (Mulbert and Birke 2002). Therefore, it is assumed that its level will influence the valuation of new issues, leading to the third hypothesis:
Hypothesis 3 (H3).
Share capital provides a positive signal for investors and influences the valuation of new issues.
3. Sample Description and Research Methods
3.1. Sample
The study is based on a sample of IPO firms which went public on the Warsaw Stock Exchange from 1998 to 2013, but because the analysis covers not only the IPO year but also three subsequent years, the study covers years 1998–2016 (total number of IPOs reported in Panel A of Table 2). This initial sample of 496 IPOs was reduced by excluding:
- Financial institutions (e.g., banks and insurance companies);
- IPOs which were not connected with new common stock issuance;
- IPOs for which data were incomplete.
The final sample thus consists of 259 IPOs. Panel A of Table 2 shows the variations in the sample number of IPOs over these 16 years. As can be seen, after a decline from 51 IPOs in 1998 to five and six IPOs in 2002 and 2003, respectively, before the financial and economic crisis, the number of IPOs increased again to 81 IPOs in 2007.
The primary source of data used in this study was Notoria Service, but due to sometimes incomplete or incorrect data in the database, other supplementary sources of data were also used, such as IPO prospectuses and annual reports available on the companies’ websites and at www.gpwinfostrefa.pl. The main focus of this study is the impact of PaV on the financing parameters. The distribution of PaV in the sample is presented in Figure 1. Panel B of Table 2 reports the basic characteristics of the sample firms, such as total assets and sales, one year before IPO. The variables used in this study are defined in Table 3.
3.2. Research Methods
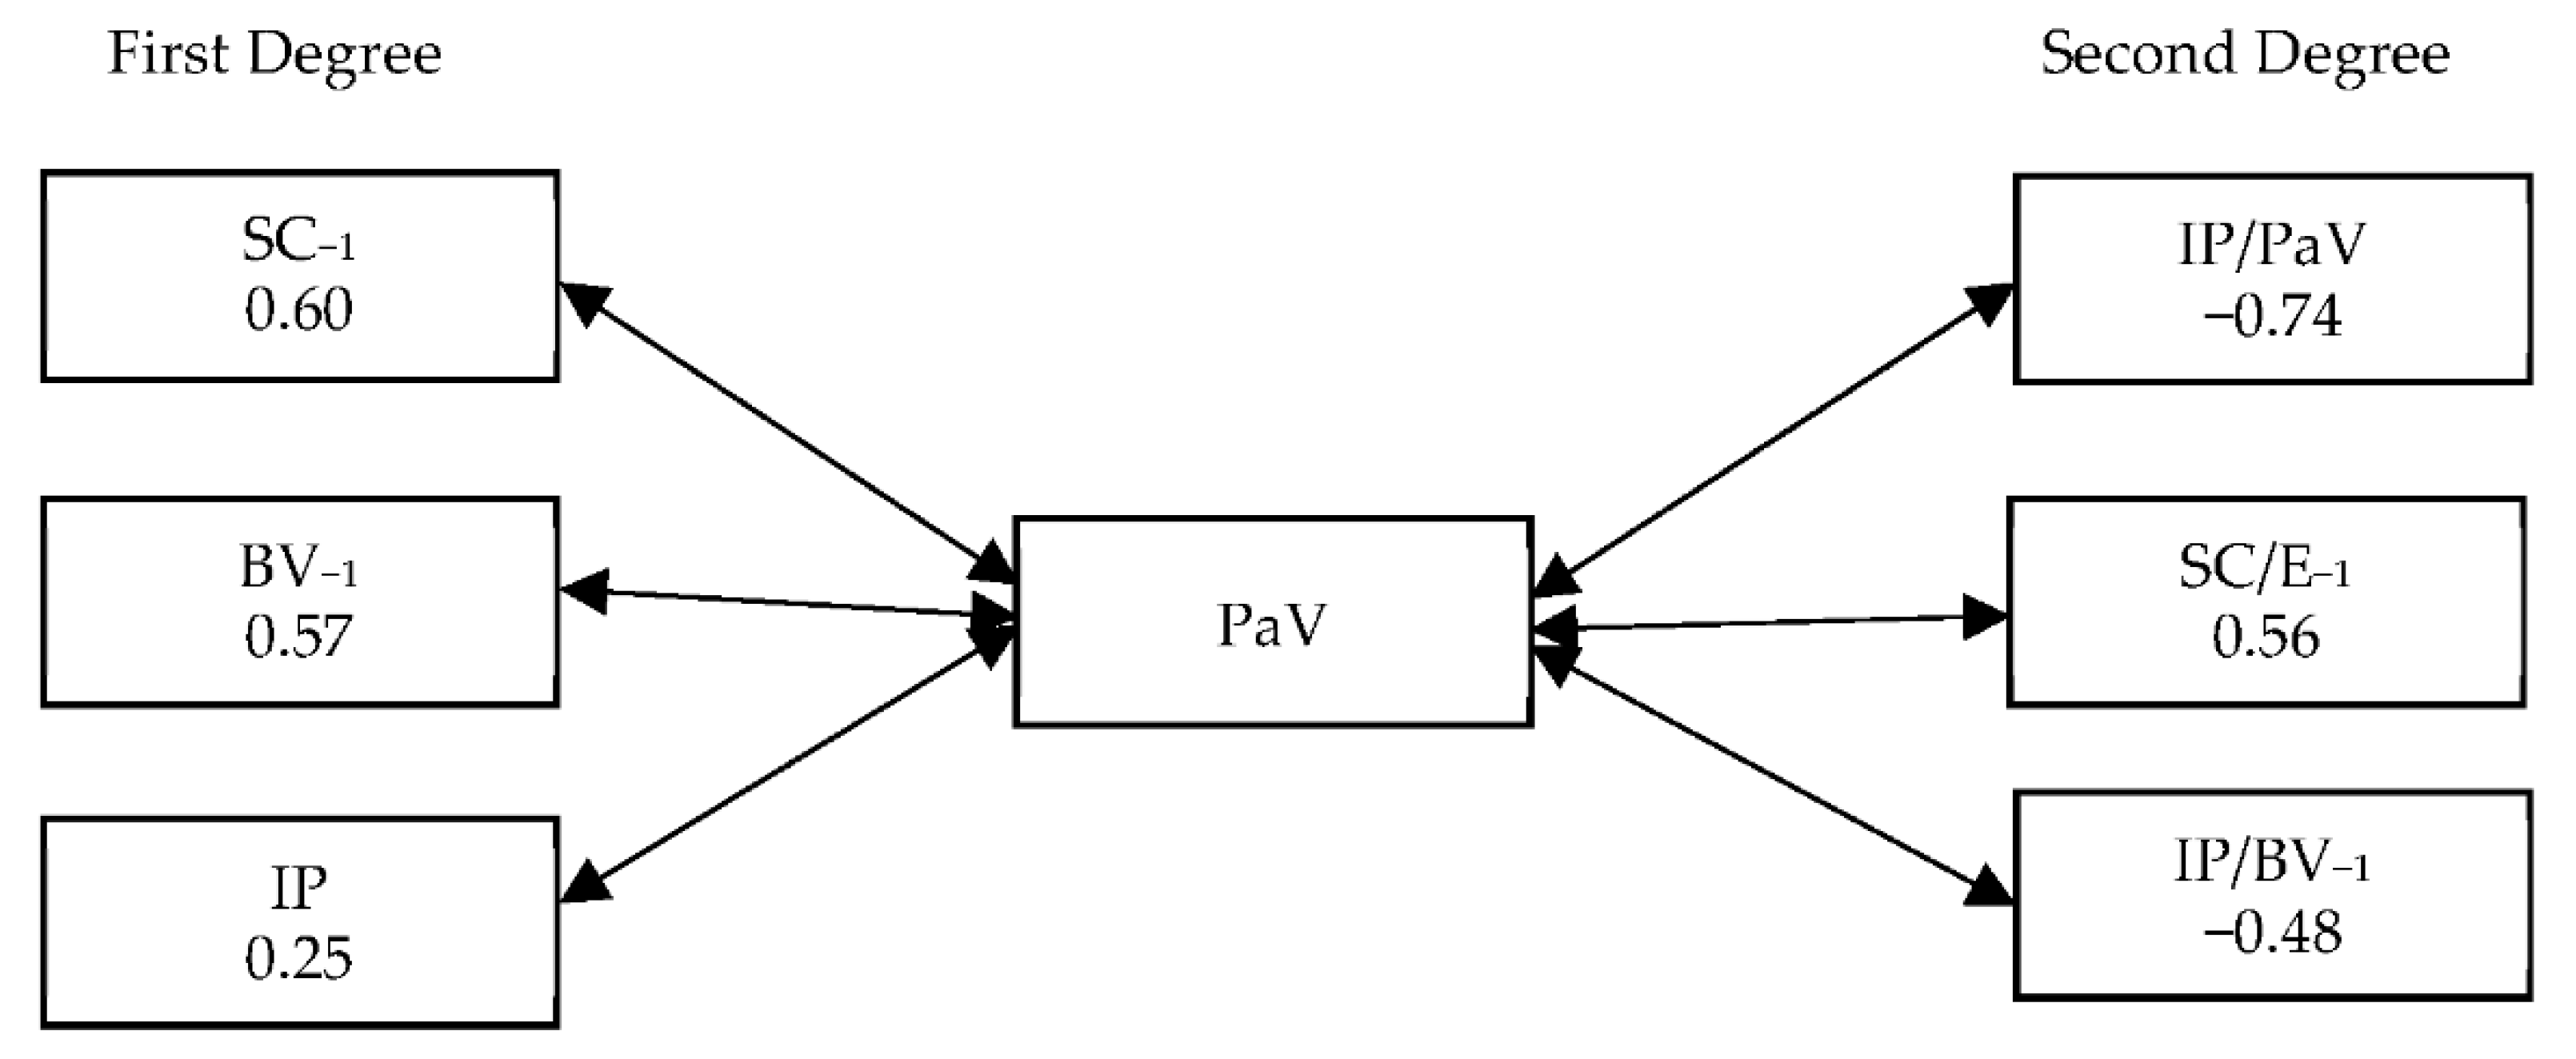
In the first step, the correlation between PaV and financing parameters was examined using a non-parametric Spearman’s rank correlation test. The financing parameters were divided into two types: first degree (or primary): SC, IP, BV, and second degree (or secondary): SC/E, IP/PaV, IP/BV, and the results are presented in Figure 2. In the next step, to provide a better illustration of the nature of the relationship between PaV and financing parameters, the sample was arbitrarily divided into six groups on the basis of PaV (Table 4) and for each parameter a Kruskal–Wallis test was used to investigate differences among the six groups. The results of these comparisons are presented in Tables 6, 8 and 10, and also, for a more synthetic presentation of results, graphically in Figure 3, Figure 4 and Figure 5. In the next step, to deepen the analysis, a regression analysis was conducted in which the financing parameters were the dependent variables and the following variables were used as explanatory variables:
- Profitability: return on equity (ROE);
- Asset productivity: sales-to-assets ratio (S/A);
- Leverage: debt ratio (D/A) and the shareholder equity-to-fixed assets ratio (E/FA);
- Liquidity: cash ratio (CR);
- Market timing: Warsaw Stock Exchange WIG Index (WIG);
- Number of shares issued: natural logarithm of number of shares issued (Ln(NrSh));
- Size: natural logarithm of total assets (Ln(Assets));
- Accounting characteristics of the shares: natural logarithm of PaV (Ln(PaV)) and natural logarithm of book value of shares (Ln(BV));
- Sector of the economy: 12 sectors (Sector) were distinguished and assigned numbers from 1 to 12, respectively: architecture, trade, information technology and telecommunications, chemical and pharmaceutical industry, metal industry, raw material industry, light industry, power engineering, food industry, non-financial services and financial services, media;
- To test the signaling function of share capital, the ratio of share capital in equity (SC/E) was used. (Note: SC/E was also used as a dependent variable.)
Primary parameters in nominal values were applied in logarithmic form to improve their symmetry. The variables used were analyzed for mutual correlation (Table 5), and those showing high collinearity with others used in the analysis were excluded. The results of the regression analysis are presented in Tables 7 and 9.
4. Results and Discussion
Par value shows a correlation with many parameters characterizing the company’s financing. Figure 2 shows the relations of the first degree (primary) and second degree (secondary).
4.1. Analysis of the First-Degree Parameters
In the first-degree relationships (Figure 2), PaV shows the strongest correlation with SC (RS = 0.60), slightly less with BV (RS = 0.57) and the weakest with IP (RS = 0.25). A more detailed view of these relationships is presented in Table 6 and Figure 3. Analyzing the nature of these relations of particular parameters in Table 6, Panel A, a clear tendency can be seen between PaV and SC. When SC is low, it is divided into shares with low PaV, and when its value increases, companies tend to divide it into shares with higher PaV. As a result, the proportionality between SC and the number of shares issued is disturbed and there is a tendency to equalize the number of shares issued regardless of the size of the SC introduced in the company. This is not in line with the suppositions of Baker et al. (2009) that investors mistakenly believe that share capital divided into more shares is worth more, as is also suggested by the psychology heuristics “numerosity”, according to which people evaluate the value of something based on the number of units without taking into account the size or value of these units (Pelham et al. 1994). This may indicate that there is an expected range of the number of shares to be issued that companies are seeking. Analyzing the relationship of other variables with SC in Table 7, we see that SC is positively correlated with SC/E. Therefore, it can be concluded that the value of SC results not only from the need for financing assets but also the strategy adopted in the field of equity structure. On the one hand, companies with low SC set PaV at a low level to obtain the desired number of shares; on the other hand, to meet the demand for capital, they strive for components of equity other than SC, so SC/E decreases. In contrast, companies with a large SC divide it into shares with a higher PaV, and to satisfy the demand for capital the companies do not need so much equity other than SC, so SC/E grows.
Another parameter showing rather less correlation with PaV is BV (Figure 2). This correlation stems from the fact that when stocks are issued with a low PaV, the number of issued shares increases, and because equity is divided into a larger number of shares, BV decreases. On the other hand, when PaV is high, the number of shares decreases, and because equity is divided into a smaller number of shares, BV increases.
In Panel B of Table 6 we can see that the relationship between PaV and BV is clear for companies from the fifth and sixth group, i.e., when PaV is higher than 1.5 (Table 4). An analysis of other variables affecting BV (Table 7) shows that there are no surprising phenomena. In addition to the correlation between BV and PaV, there is a negative relationship between BV and SC/E, which results from the fact that BV grows with an increasing share of components other than share capital in equity. Therefore, the smaller the SC/E, the more equity other than SC calculated per share, and the BV grows. This is characterized by large companies that have accumulated more equity, which is why the size of the company, Ln(Assets), has a positive correlation with BV. In addition, BV is correlated with timing (WIG). As shown previously, there is a positive correlation between BV and the size of the company; therefore, the negative correlation between WIG and BV may be due to the fact that larger companies tend to go public in times of a bear market rather than in a bull market. Large companies in Poland are often controlled by the State Treasury, and therefore the decision-making process about going public is longer and determined by administrative and political factors, which in turn means that these companies use timing to a lesser extent in entering the stock exchange.
The third parameter from the first relationship level is IP, which shows the weakest correlation with PaV. In Table 6, Panel C and Figure 3, we cannot observe a clear trend that a higher PV is connected to a higher IP, but we can see that only between companies belonging to the fifth and sixth group, from the one side, and companies belonging to the second and fourth group, from the other side, are the differences in the average IP statistically significant. This means that investors pricing a new issue behave irrationally—they probably have perceptual biases analogous to the known phenomenon of money illusion (Svedsater et al. 2007) or the “face value” effect (Lowe et al. 2012). Focusing only on a low number, they do not match the price they are willing to pay for shares (IP) with the PaV. Therefore, they do not take into account that the surplus of IP over PaV is booked on the reserve capital as a share premium and does not affect the size of their shares in the company. Prior to 1915, NYSE stock prices were not quoted in dollars but as a percentage of the nominal price (Angel 1997). The beginnings of the separation between the market share price and its nominal value can be traced back to the crisis in 1929 (Weld et al. 2009). Today, as you can see, these two values walk their own independent paths. Analyzing other variables determining IP, we can see in Table 7 that the IP is most strongly determined by BV. It is also influenced by timing, which is approximated by the WIG and a small supply of shares, Ln(NrSh). The fewer shares issued by the company, the better the share valuation. Moreover, IP is positively related to financial results (ROE and CR), as already reported by Brycz et al. (2017). Leverage (D/A) also has a positive impact on the valuation of shares, which may result from the fact that if the lender, as a third party, is convinced of the good prospects of the company, it is a positive signal for investors affecting the valuation of shares. In addition, higher indebtedness increases the leverage effect for the benefit of shareholders (Mulbert and Birke 2002). Very weak, but also statistically significant for the valuation of new issue shares (IP), is SC/E, which may indicate that from the investors’ point of view SC increases the company’s credibility.
4.2. Analysis of the Second-Degree Parameters
In the second-degree relationships (Figure 2), the strongest, although negative, correlation is between PaV and IP/PaV (RS = −0.74). Then there is a positive correlation with SC/E−1 (RS = 0.56), and a negative one with IP/BV−1 (RS = −0.48). The IP/PaV is related to the part of the capital of the new issue booked as share premium and as SC. The higher the IP/PaV, the more the capital acquired as a share premium (shown in capital reserves). From the point of view of primary investors, it is beneficial for as much of the acquired capital as possible to be booked as a share premium. The capital belongs to all investors, existing and new, and thus contributes to the increase in the book value of shares of primary investors (Table 1). In Table 8, Panel A and Figure 4, we see that IP/PaV is highest at the lowest PaV level and decreases with increasing PaV. This phenomenon probably results from the perceptual biases among investors (discussed earlier) who evaluate IP in isolation from PaV. Investors rate IP in isolation from PaV, and therefore issuers setting low PaV may induce perceptual biases among investors and thus maximize IP/PaV. A detailed analysis of other variables determining IP/PaV in Table 9 shows a relatively weak relationship between IP/PaV and ROE and timing (WIG) (R2 of model = 0.145). Thus, the two parameters do not only affect the valuation of the new issue (IP) (as already indicated) but also have an effect, albeit weaker, on IP/PaV. This means that the IP/PaV change is to a small part explained by the company’s fundamentals, which is in line with the suggestions of Baker et al. (2009), but in our opinion the IP/PaV change is explained much more by behavioural biases made by investors. In addition, IP/PaV shows a negative correlation with SC/E, which is also not a surprise, as IP/PaV and SC/E include the same capital, and the negative relationship results from the reverse relation of the respective capitals in these parameters.
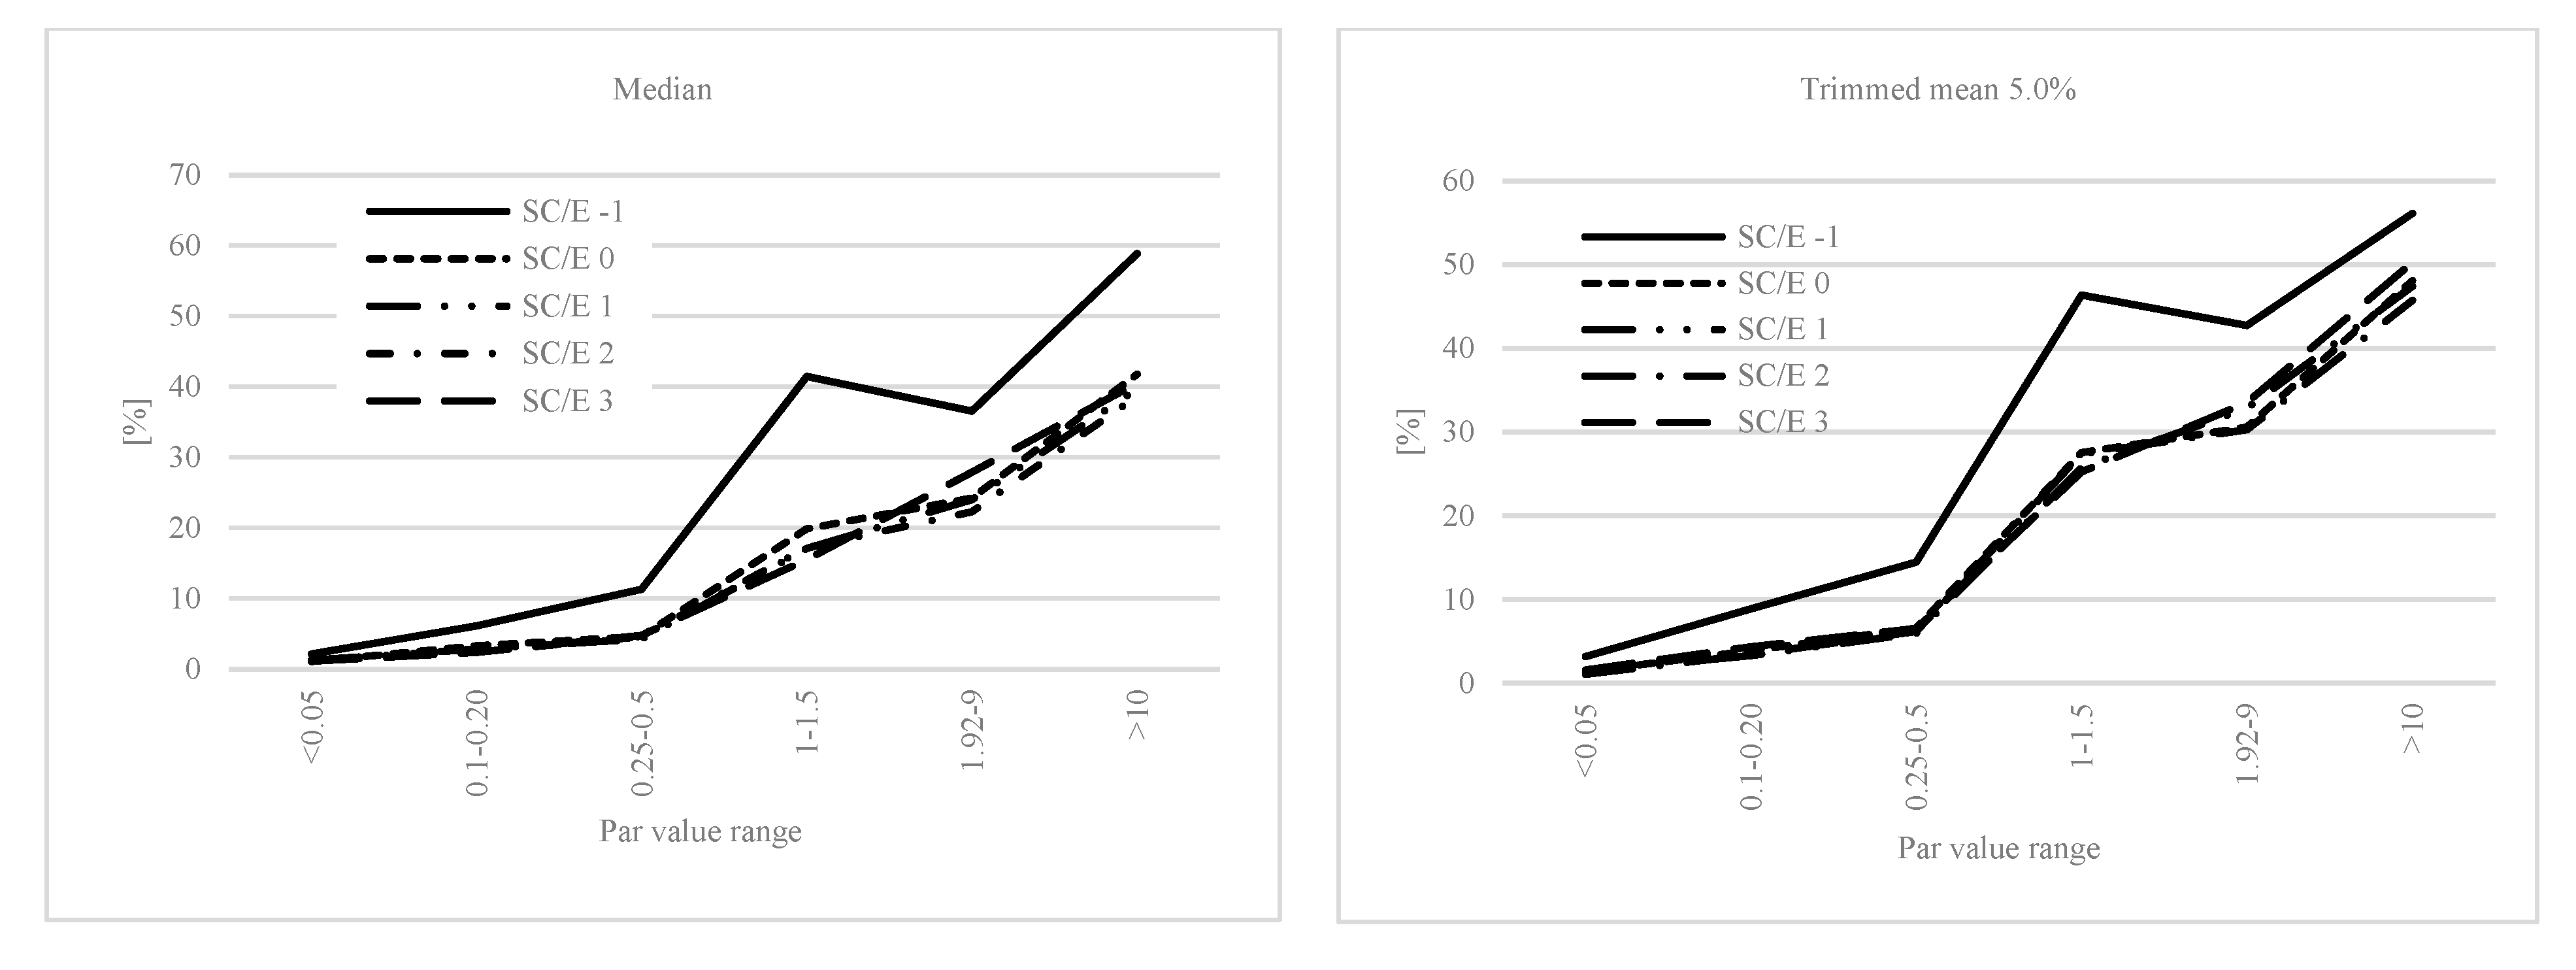
Another second-degree parameter in terms of the strength of the relationship with PaV is SC/E. In Table 8, Panel B, we see that companies issuing shares of low PaV are characterized by a low share of SC in equity, and with an increase in PaV, this share increases. Combining the data from Table 6, Panel A with the data from Table 9, Panel B, we see that companies with low SC divide it into shares with lower PaV to obtain the desired number of shares (as mentioned above) and use equity other than share capital to finance the assets to a greater extent, so SC/E is relatively low. In contrast, companies with high SC tend to divide it into shares with higher PaV (also to obtain the desired number of shares) and to a lesser extent use equity other than SC, so SC/E increases. This strategy of companies in the field of equity structure is constant and does not change after going public and raising capital from the new issue (Table 10, Panels A, B, C, D and Figure 5). However, after acquiring new capital in the IPO year, SC/E decreases (Figure 5), and for the next three years the new equity structure is relatively stable. This means that the capital obtained from the stock market is not distributed in significant amounts to investors, for example in debt repayments, as suggested by Huyghebaert and Van Hulle (2006), or payment of dividends. On the other hand, there are no significant effects of accumulation of profits in subsequent years after IPO. In Table 9, we can see that the SC/E before IPO is negatively correlated with the company size, Ln(Assets), which confirms earlier observations that larger companies accumulate more non-SC equity and thus have lower SC/E. The positive correlation with WIG also confirms earlier observations that smaller companies characterized by a higher SC/E go public in times of bull markets, whereas larger companies characterized by a lower SC/E do so in bear markets. SC/E is also related to the type of sector in which the company operates, but although the relationship is statistically significant, it is very weak.
The last second-degree parameter is IP/BV, which is one of the determinants of issuance success. The more accurately investors assess the company’s ability to generate cash flows from its assets, the more they will be willing to pay for the book value of assets. This relation is also used as a measure of the company’s intellectual capital, as it shows the surplus of the market value over the book value of the new issue (Edvinsson and Malone 1997). IP/BV shows a lower correlation with PaV (RS = −0.48) than IP/PaV (RS = −0.74; Figure 2). However, in this case we can also see the effects of perceptual biases among investors. Lower PaV entails lower BV, which clearly indicates lower IP (high correlations between PaV and BV as well as BV and IP, as shown in Table 7). In the case of lower IP, the price seems so attractive to investors (charm price) that they no longer pay sufficient attention to the fundamentals and as a result pay more for the book value of assets than in the case of higher IP. This does not coincide with Dewing’s (1934) suggestions that the low share price may raise suspicions about the company’s difficult credit situation. Baker et al. (2009) call this effect the “low-price premium” and presume that investors suffer from a nominal illusion, i.e., they perceive that the low stock price has more “room to grow” or “less to lose”. In Table 8, Panel C we can see that there are statistically significant differences in the average IP/BV between companies with PaV lower than 1.5 (the first, second, third and fourth group), from the one side, and companies with PaV higher than 1.5 (the fifth and sixth group), from the other side. A detailed analysis of the determinants of IP/BV (Table 9) shows that this relationship presents a positive correlation with the company’s financial performance (ROE) and leverage (D/A).Therefore, among the analyzed financial parameters, ROE is the one that best signals the company’s potential, which makes investors believe that the effectiveness after IPO will be at the same level or higher, but this belief turns out to be illusory (Brycz et al. 2017). In contrast, positive correlation with leverage results from the fact that, as already mentioned, lenders as third parties provide investors with an objective assessment of the company. IPO success, manifested among other factors by the high IP/BV ratio, depends on the choice of the right time window in which investors’ optimism ensures a high valuation of the issuance. This phenomenon is widely reported in the literature (Pástor and Veronesi 2005; Ritter 1984; Ritter and Welch 2002; Taggart 1977), and this is also confirmed by the current research because IP/BV is positively correlated with WIG. Moreover, IP/BV is also determined by the number of shares issued. The correlation is reversed, which means that placing too many shares on the market has a negative impact on their valuation, and this phenomenon was already visible when analyzing the variables determining IP. This explains the desire of issuers to issue the expected number of shares, resulting from a previous analysis. Issuing and placing too many shares on the market worsens their valuation and threatens loss of control over the company. Therefore, from this study, it appears that a better strategy is to issue a smaller number of shares, which will ensure a better valuation, enhance the amount of capital raised and incur less risk of losing control over the company, while obtaining a higher share premium. However, the largest correlation is between IP/BV and SC/E. This is a clear signal that SC has more value for investors than other equity types. Its larger share in equity improves the valuation of issuance. It can be presumed that with a higher share of SC in equity, investors perceive a greater involvement of primary investors in the company resulting from trust in the company and thus lower risk. This will also translate into their determination and dedication to act for the good of the company. This means that SC can be used as a signaling tool to improve the company’s position on the capital market.
5. Conclusions
The PaV regime imposes the obligation to ascribe value to each share, which reflects the cash payments or value of assets contributed by the shareholders and represents their liability for the company’s obligations. The results of the research presented in this article lead to two basic conclusions. First, PaV (also known as nominal value or face value) and the corresponding share capital are more important for investors than other types of equity. The increase in the share of share capital in equity strongly affects the valuation of new issues. Therefore, companies can use it as a signaling tool to improve their position on the capital market. Second, by setting PaV for a single share, one can influence the behaviour of investors in a manner that is beneficial to the success of the issue.
The PaV of a single share determines the number of shares to be issued. The results of our research show that the decision on the number of issued shares is dictated on the one hand by the desire to obtain the number within the expected range. As a result, larger share capital is divided into shares with higher PaV, and smaller share capital into shares with lower PaV. On the other hand, it can be seen that lowering PaV (and thus increasing the number of shares issued) prompts investors to make perceptual biases; namely, they focus on a figure reflecting the IP value and ignore both PaV and the fundamentals of price. As a result, companies lowering PaV can maximize both IP/PaV (thus maximizing share premium beneficial for primary investors) and IP/BV as a key parameter for the success of the issue. In addition, the research shows that companies are not interested in issuing an excessive number of shares because this has a negative impact on their valuation. A smaller supply of shares increases their valuation. To reconcile these phenomena, i.e., to issue a small number of shares with a low PaV value, companies must set a low value for share capital, and remaining capital needs to be recorded as additional paid-in capital. This research shows that this equity structure strategy is implemented before the IPO and continues in the years following the IPO. Companies with low share capital to a greater extent use components of equity other than share capital (thus having a low ratio of share capital to equity) than do companies with high share capital (giving rise to a high ratio of share capital to equity). The benefits of such a strategy are the positive impact of a small supply of shares on their valuation (IP), thus IP/PaV maximization and obtaining a large share premium, IP/BV maximization, as well as a positive impact on the liquidity of shares. The negative side of this strategy is the low share of share capital in equity (SC/E), which is a very important parameter (the most important from the study) for investors. In contrast, companies that set high share capital and adopt a strategy for maintaining a high share of share capital in equity significantly improve their position in the market and the valuation of the issue. However, to issue a number of shares within the expected range, they divide share capital into shares with higher PaV. The small supply of shares also has a positive impact on the valuation, but higher PaV has less impact on investors’ behavior, which is beneficial to the success of the issue.
Practical Implications and Future Research
The research has important implications for companies, investors and the functioning of capital markets. For companies, the research provides knowledge about the possibilities of using the nominal price as a tool to influence the valuation of new shares. Together with previous studies in the literature (Dudycz and Brycz 2017), this study shows that in addition to fundamental factors, choosing the right time to issue shares and its good preparation have a significant impact on the success of the new issue. For investors, the research provides less optimistic information because it shows how reduction in par value stimulates perceptual biases among investors, disturbing the sound assessment of the company’s fundamentals. However, this knowledge can help investors avoid the negative effects. The research has negative implications also for capital markets because it shows that valuation of shares is determined by behavioral biases made by investors, which may be reinforced by the issuers. This may cause a deviation of stock prices from fundamentals and have a negative impact on the efficient allocation of capital.
Therefore, further research should focus on examining the extent to which the valuation of shares is determined by factors not related to the company’s fundamentals such as behavioral biases made by investors or other phenomena such as “short-termism”, that is, the focus of investors on short-term benefits. Since the behavioral biases made by investors have an impact on the price of the new share issue, further research should test the predictive value of information from before the IPO against the results achieved after the IPO.
Author Contributions
Idea initiation, T.D.; funding acquisition, T.D.; Resources, B.B. and T.D.; Investigation, B.B. and T.D.; Data Curation, B.B. and T.D.; writing—original draft, B.B. and T.D.; writing—review and editing, B.B. and T.D. All authors have read and agreed to the published version of the manuscript.
Funding
This research was funded by the National Science Centre Poland [grant number: 2017/25/B/HS4/01374].
Conflicts of Interest
The authors declare no conflict of interest. The funders had no role in the design of the study; in the collection, analyses, or interpretation of data; in the writing of the manuscript; or in the decision to publish the results.
References
- Angel, James J. 1997. Tick Size, Share Prices, and Stock Splits. Journal of Finance 52: 655–81. [Google Scholar] [CrossRef]
- Armour, John. 2000. Share Capital and Creditor Protection: Efficient Rules for a Modern Company Law. The Modern Law Review 63: 355–78. [Google Scholar] [CrossRef] [Green Version]
- Bachner, Thomas. 2009. Creditor Protection in Private Companies: Anglo-German Perspectives for a European Legal Discourse. New York: Cambridge University Press. [Google Scholar]
- Baker, H. Kent, and Patricia L. Gallagher. 1980. Management’s View of Stock Splits. Financial Management 9: 73–77. [Google Scholar] [CrossRef]
- Baker, Malcolm, Robin Greenwood, and Jeffrey Wurgler. 2009. Catering Through Nominal Share Prices. The Journal of Finance 64: 2559–90. [Google Scholar] [CrossRef] [Green Version]
- Böcskei, Elvira, László Vértesy, and András Bethlendi. 2020. The Accounting and Legal Issues of Capital Reserve, with Particular Emphasis on Capital Increase by Share Premium. Public Finance Quarterly 2: 225–44. [Google Scholar]
- Brycz, Bogumiła, Tadeusz Dudycz, and Michał Kowalski. 2017. Is the Success of an Issuer an Investor Success? Evidence from Polish IPOs. Baltic Journal of Economics 17: 57–77. [Google Scholar] [CrossRef]
- Cho, Seong-Soon, Sadok El Ghoul, Omrane Guedhami, and Jungwon Suh. 2014. Creditor Rights and Capital Structure: Evidence from International Data. Journal of Corporate Finance 25: 40–60. [Google Scholar] [CrossRef]
- Cook, William W. 1921. Stock Without Par Value. American Bar Association Journal 7: 534–37. [Google Scholar]
- D’Mello, Ranjan, Oranee Tawatnuntachai, and Devrim Yaman. 2003. Why Do Firms Issue Equity after Splitting Stocks? The Financial Review 38: 323–50. [Google Scholar] [CrossRef]
- Dewing, Arthur S. 1934. The Financial Policy of Corporations, 3rd rev. ed. New York: Ronald Press. [Google Scholar]
- Dudycz, Tadeusz, and Bogumiła Brycz. 2017. What Drives the Amount of Capital Raised at IPO? Evidence from the Warsaw Stock Exchange. Argumenta Oeconomica 2: 61–89. [Google Scholar] [CrossRef] [Green Version]
- Dyl, Edward A., and William B. Elliott. 2006. The Share Price Puzzle. The Journal of Business 79: 2045–66. [Google Scholar] [CrossRef]
- Edvinsson, Leif, and Michael S. Malone. 1997. Intellectual Capital: Realizing Your Company’s True Value by Finding Its Hidden Brainpower. New York: Harper Business. [Google Scholar]
- Enriques, Luca, and Jonathan R. Macey. 2001. Creditors Versus Capital Formation: The Case Against the European Legal Capital Rules. Cornell Law Review 86: 1165–204. [Google Scholar]
- Espenlaub, Susanne, Abhinav Goyal, and Abdulkadir Mohamed. 2020. The Impact of Shareholders and Creditors Rights on IPO Performance: An International Study. The British Accounting Review 52: 100872. [Google Scholar] [CrossRef]
- Fernando, Chitru S., Srinivasan Krishnamurthy, and Paul A. Spindt. 1999. Is Share Price Related to Marketability? Evidence from Mutual Fund Share Splits. Financial Management 28: 54–67. [Google Scholar] [CrossRef]
- Gompers, Paul A., and Andrew Metrick. 2001. Institutional Ownership and Equity Prices. The Quarterly Journal of Economics 116: 229–59. [Google Scholar] [CrossRef]
- Handschin, Lukas. 2012. Risk-Based Equity Requirements: How Equity Rules for the Financial Sector Can Be Applied to the Real Economy. Journal of Corporate Law Studies 12: 255–93. [Google Scholar] [CrossRef] [Green Version]
- Huang, Roger D., and H. Martin Weingartner. 2000. Do Market Makers Suffer from Splitting Headaches? Journal of Financial Services Research 17: 105–26. [Google Scholar] [CrossRef]
- Huang, Gow-Cheng, Kartono Liano, and Ming-Shiun Pan. 2006. Do Stock Splits Signal Future Profitability? Review of Quantitative Finance and Accounting 26: 347–67. [Google Scholar] [CrossRef]
- Huang, Gow-Cheng, Kartono Liano, Herman Manakyan, and Ming-Shiun Pan. 2008. The Information Content of Multiple Stock Splits. The Financial Review 43: 543–67. [Google Scholar] [CrossRef]
- Huang, Gow-Cheng, Kartono Liano, and Ming-Shiun Pan. 2009. The Information Content of Stock Splits. Journal of Empirical Finance 16: 557–67. [Google Scholar] [CrossRef]
- Huyghebaert, Nancy, and Cynthia Van Hulle. 2006. Structuring the IPO: Empirical Evidence on the Portions of Primary and Secondary Shares. Journal of Corporate Finance 12: 296–320. [Google Scholar] [CrossRef]
- Kee, Ho Yew, and Lan Luh Luh. 1999. The Par Value of Shares: An Irrelevant Concept in Modern Company Law. Singapore Journal of Legal Studies 1999: 552–72. [Google Scholar]
- Kolany, Krzysztof. 2017. GPW to regionalny gigant i europejski karzeł. Bankier.pl. February 28. Available online: https://www.bankier.pl/wiadomosc/GPW-to-regionalny-gigant-i-europejski-karzel-7501816.html (accessed on 12 July 2019).
- KPMG. 2008. Feasibility Study on an Alternative to the Capital Maintenance Regime Established by the Second Company Law Directive 77/91/EEC of 13 December 1976 and an Examination of the Impact on Profit Distribution of the New EU-Accounting Regime. Berlin: KPMG. [Google Scholar]
- Kunz, Roger M., and Sandro Rosa-Majhensek. 2008. Stock Splits in Switzerland: To Signal or Not to Signal? Financial Management 37: 193–226. [Google Scholar] [CrossRef]
- Lakonishok, Josef, and Baruch Lev. 1987. Stock Splits and Stock Dividends: Why, Who, and When. Journal of Finance 42: 913–32. [Google Scholar] [CrossRef]
- Lakonishok, Josef, Andrei Shleifer, and Robert W. Vishny. 1992. The Impact of Institutional Trading on Stock Prices. Journal of Financial Economics 32: 23–43. [Google Scholar] [CrossRef] [Green Version]
- Lowe, Ben, Bradley R. Barnes, and Robert Rugimbana. 2012. Discounting in International Markets and the Face Value Effect: A Double-Edged Sword? Psychology and Marketing 29: 144–56. [Google Scholar] [CrossRef]
- Mulbert, Peter O., and Max Birke. 2002. Legal Capital—Is There a Case Against the European Legal Capital Rules? European Business Organization Law Review 3: 695–732. [Google Scholar] [CrossRef]
- Muscarella, Chris J., and Michael R. Vetsuypens. 1996. Stock Splits: Signaling or Liquidity? The Case of ADR “Solo Splits”. Journal of Financial Economics 42: 3–26. [Google Scholar] [CrossRef]
- Pástor, Ľuboš, and Pietro Veronesi. 2005. Rational IPO Waves. Journal of Finance 60: 1713–57. [Google Scholar] [CrossRef]
- Pelham, Brett W., Tin T. Sumarta, and Laura Myaskovsky. 1994. The Easy Path from Many to Much: The Numerosity Heuristic. Cognitive Psychology 26: 103–33. [Google Scholar] [CrossRef] [Green Version]
- Powell, Gary E., and H. Kent Baker. 1993. The Effects of Stock Splits on the Ownership Mix of a Firm. Review of Financial Economics 3: 70–88. [Google Scholar] [CrossRef]
- Prorokowski, Lukasz, and Paulina Roszkowska. 2014. Comparison of Practitioners’ Views on Managing Equity Investments. Baltic Journal of Management 9: 153–67. [Google Scholar] [CrossRef]
- Rickford, Jonathan. 2004. Reforming Capital—Report of the Interdisciplinary Group on Capital Maintenance. European Business Law Review 15: 920–1027. [Google Scholar]
- Ritter, Jay R. 1984. The “Hot Issue” Market of 1980. Journal of Business 57: 215–40. [Google Scholar] [CrossRef]
- Ritter, Jay R., and Ivo Welch. 2002. A Review of IPO Activity, Pricing, and Allocations. Journal of Finance 57: 1795–828. [Google Scholar] [CrossRef] [Green Version]
- Santella, Paolo, and Riccardo Turrini. 2008. Capital Maintenance in the EU: Is the Second Company Law Directive Really That Restrictive? European Business Organization Law Review 9: 427–61. [Google Scholar] [CrossRef]
- Svedsater, Henrik, Amelie Gamble, and Tommy Gärling. 2007. Money Illusion in Intuitive Financial Judgments: Influences of Nominal Representation of Share Prices. Journal of Socio-Economics 36: 698–712. [Google Scholar] [CrossRef]
- Taggart, Robert A. 1977. A Model of Corporate Financing Decisions. Journal of Finance 32: 1467–84. [Google Scholar] [CrossRef]
- Weld, William C., Roni Michaely, Richard H. Thaler, and Shlomo Benartzi. 2009. The Nominal Share Price Puzzle. Journal of Economic Perspectives 23: 121–42. [Google Scholar] [CrossRef] [Green Version]
- Zhang, Ling, Sheng Zhang, and Yingyuan Guo. 2019. The Effects of Equity Financing and Debt Financing on Technological Innovation. Evidence from Developed Countries. Baltic Journal of Management 14: 698–715. [Google Scholar] [CrossRef]
Figure 1.
Par value distribution.
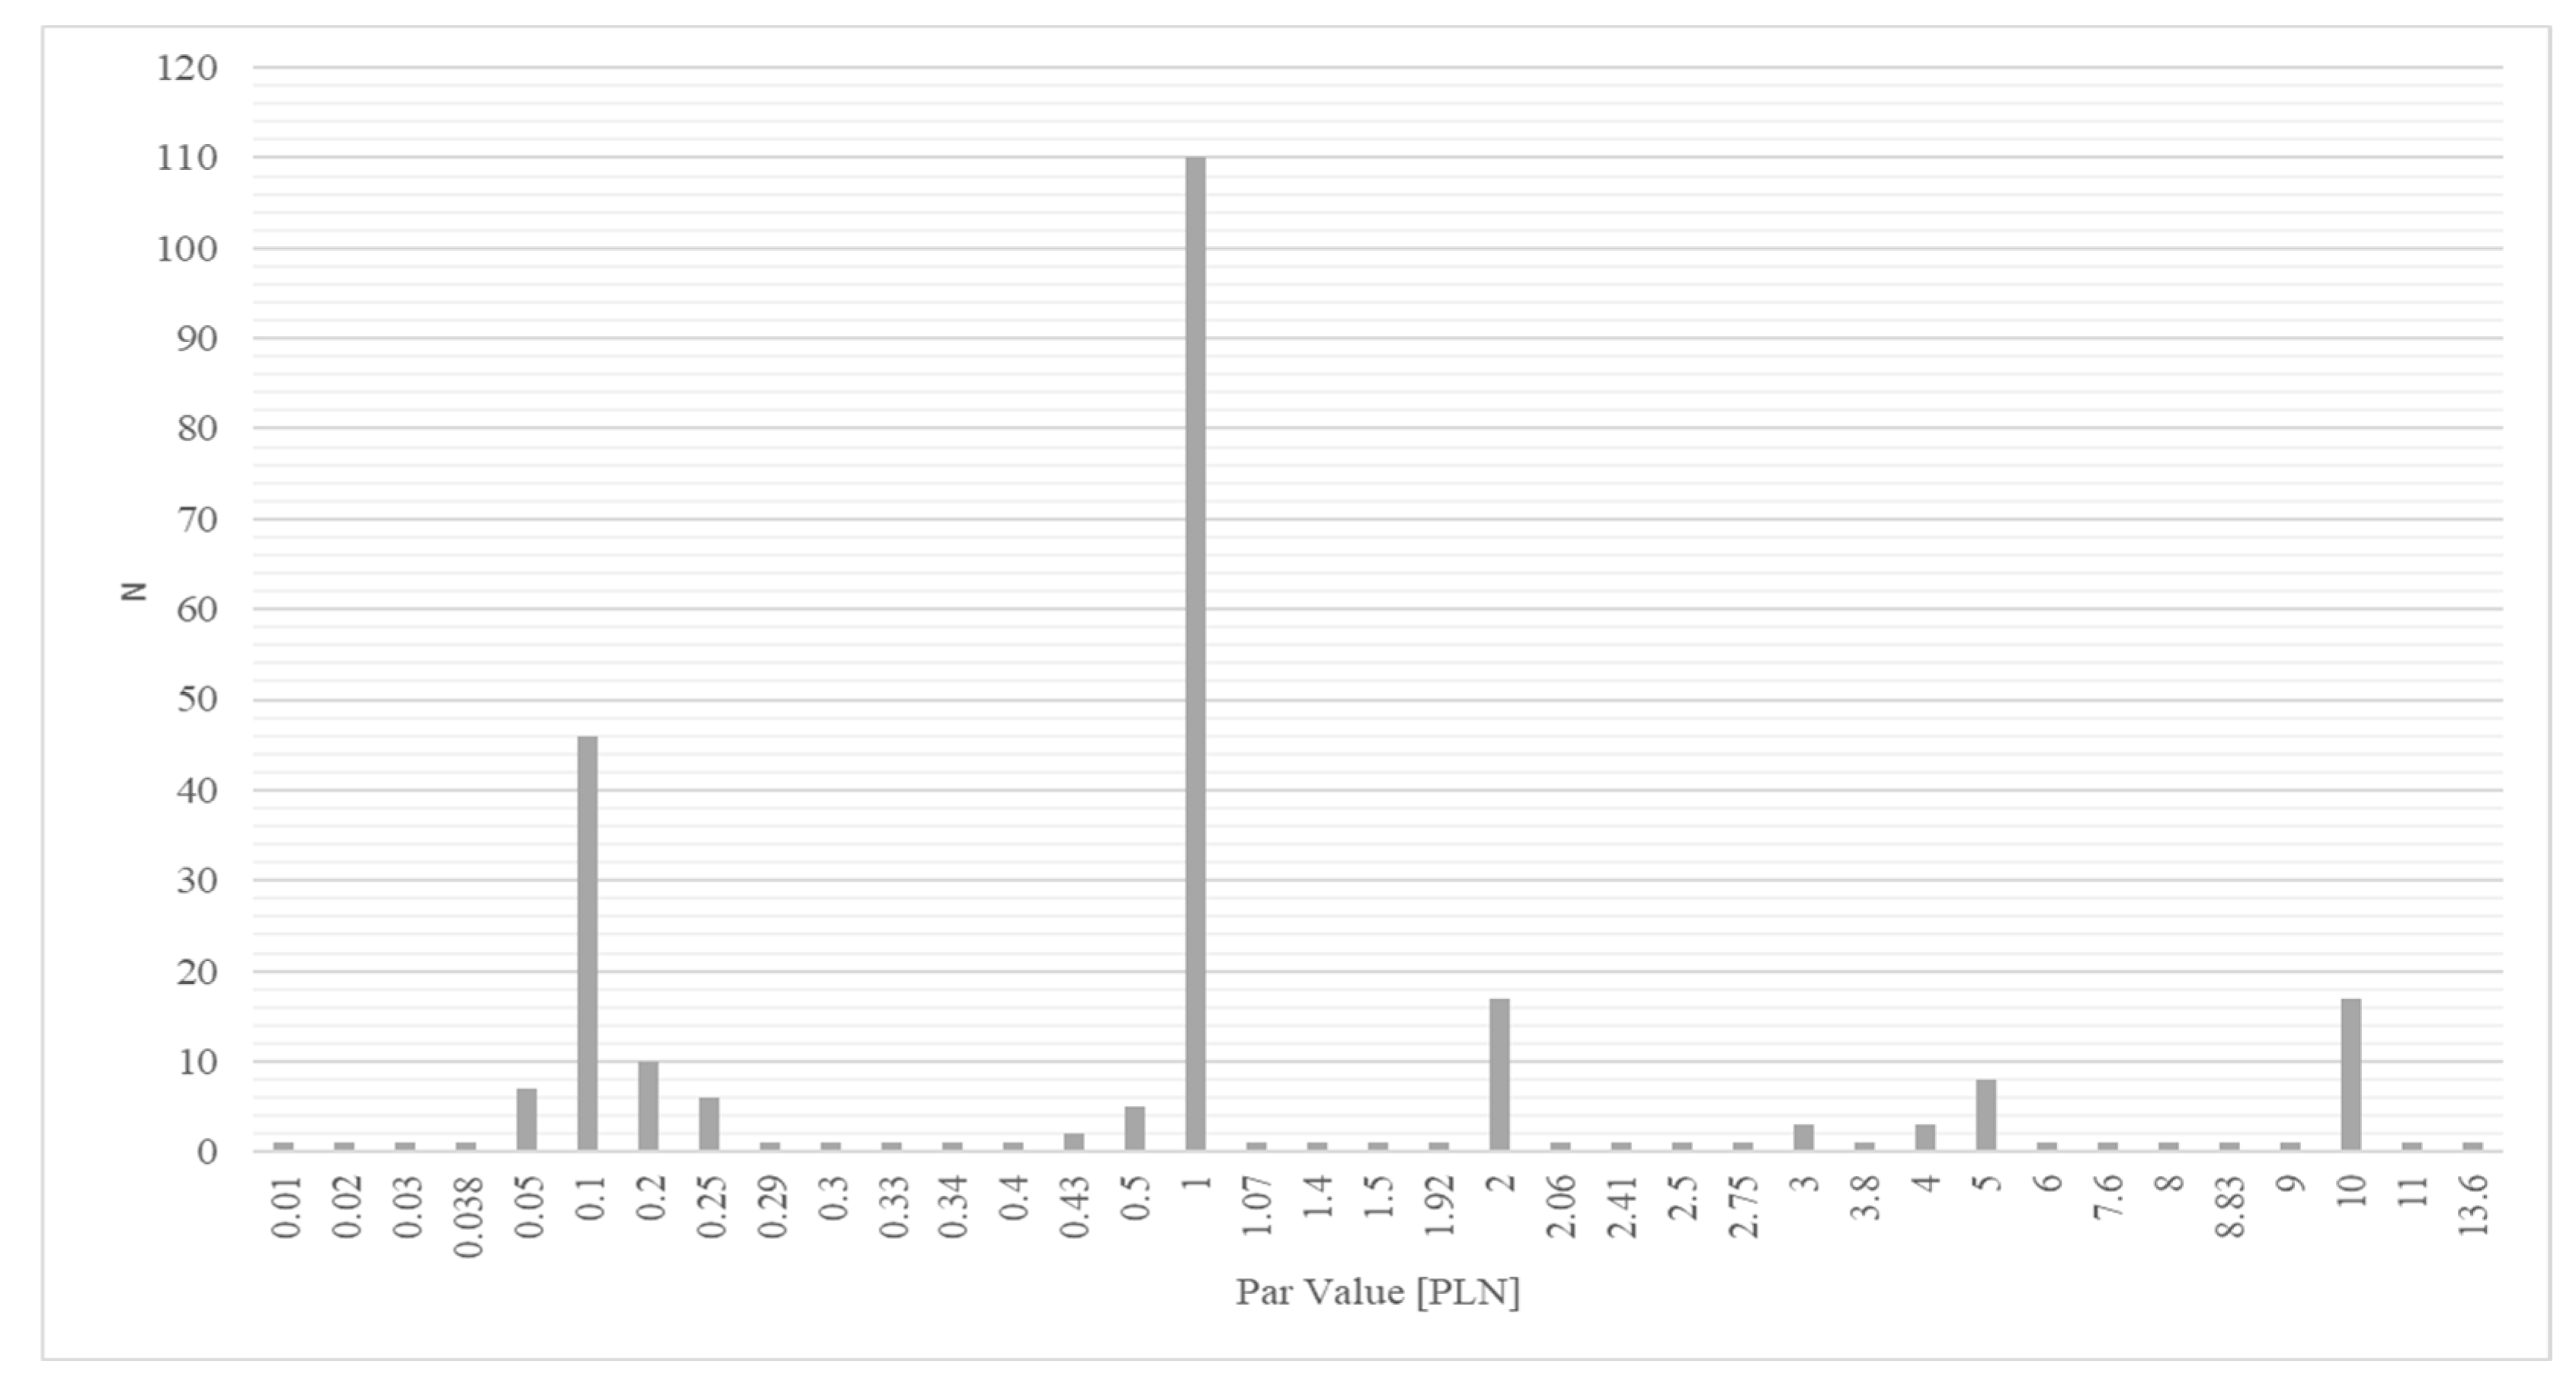
Figure 2.
Spearman’s correlation (RS) between par value and financing parameters.

Figure 3.
First-degree financing parameters depending on PaV.
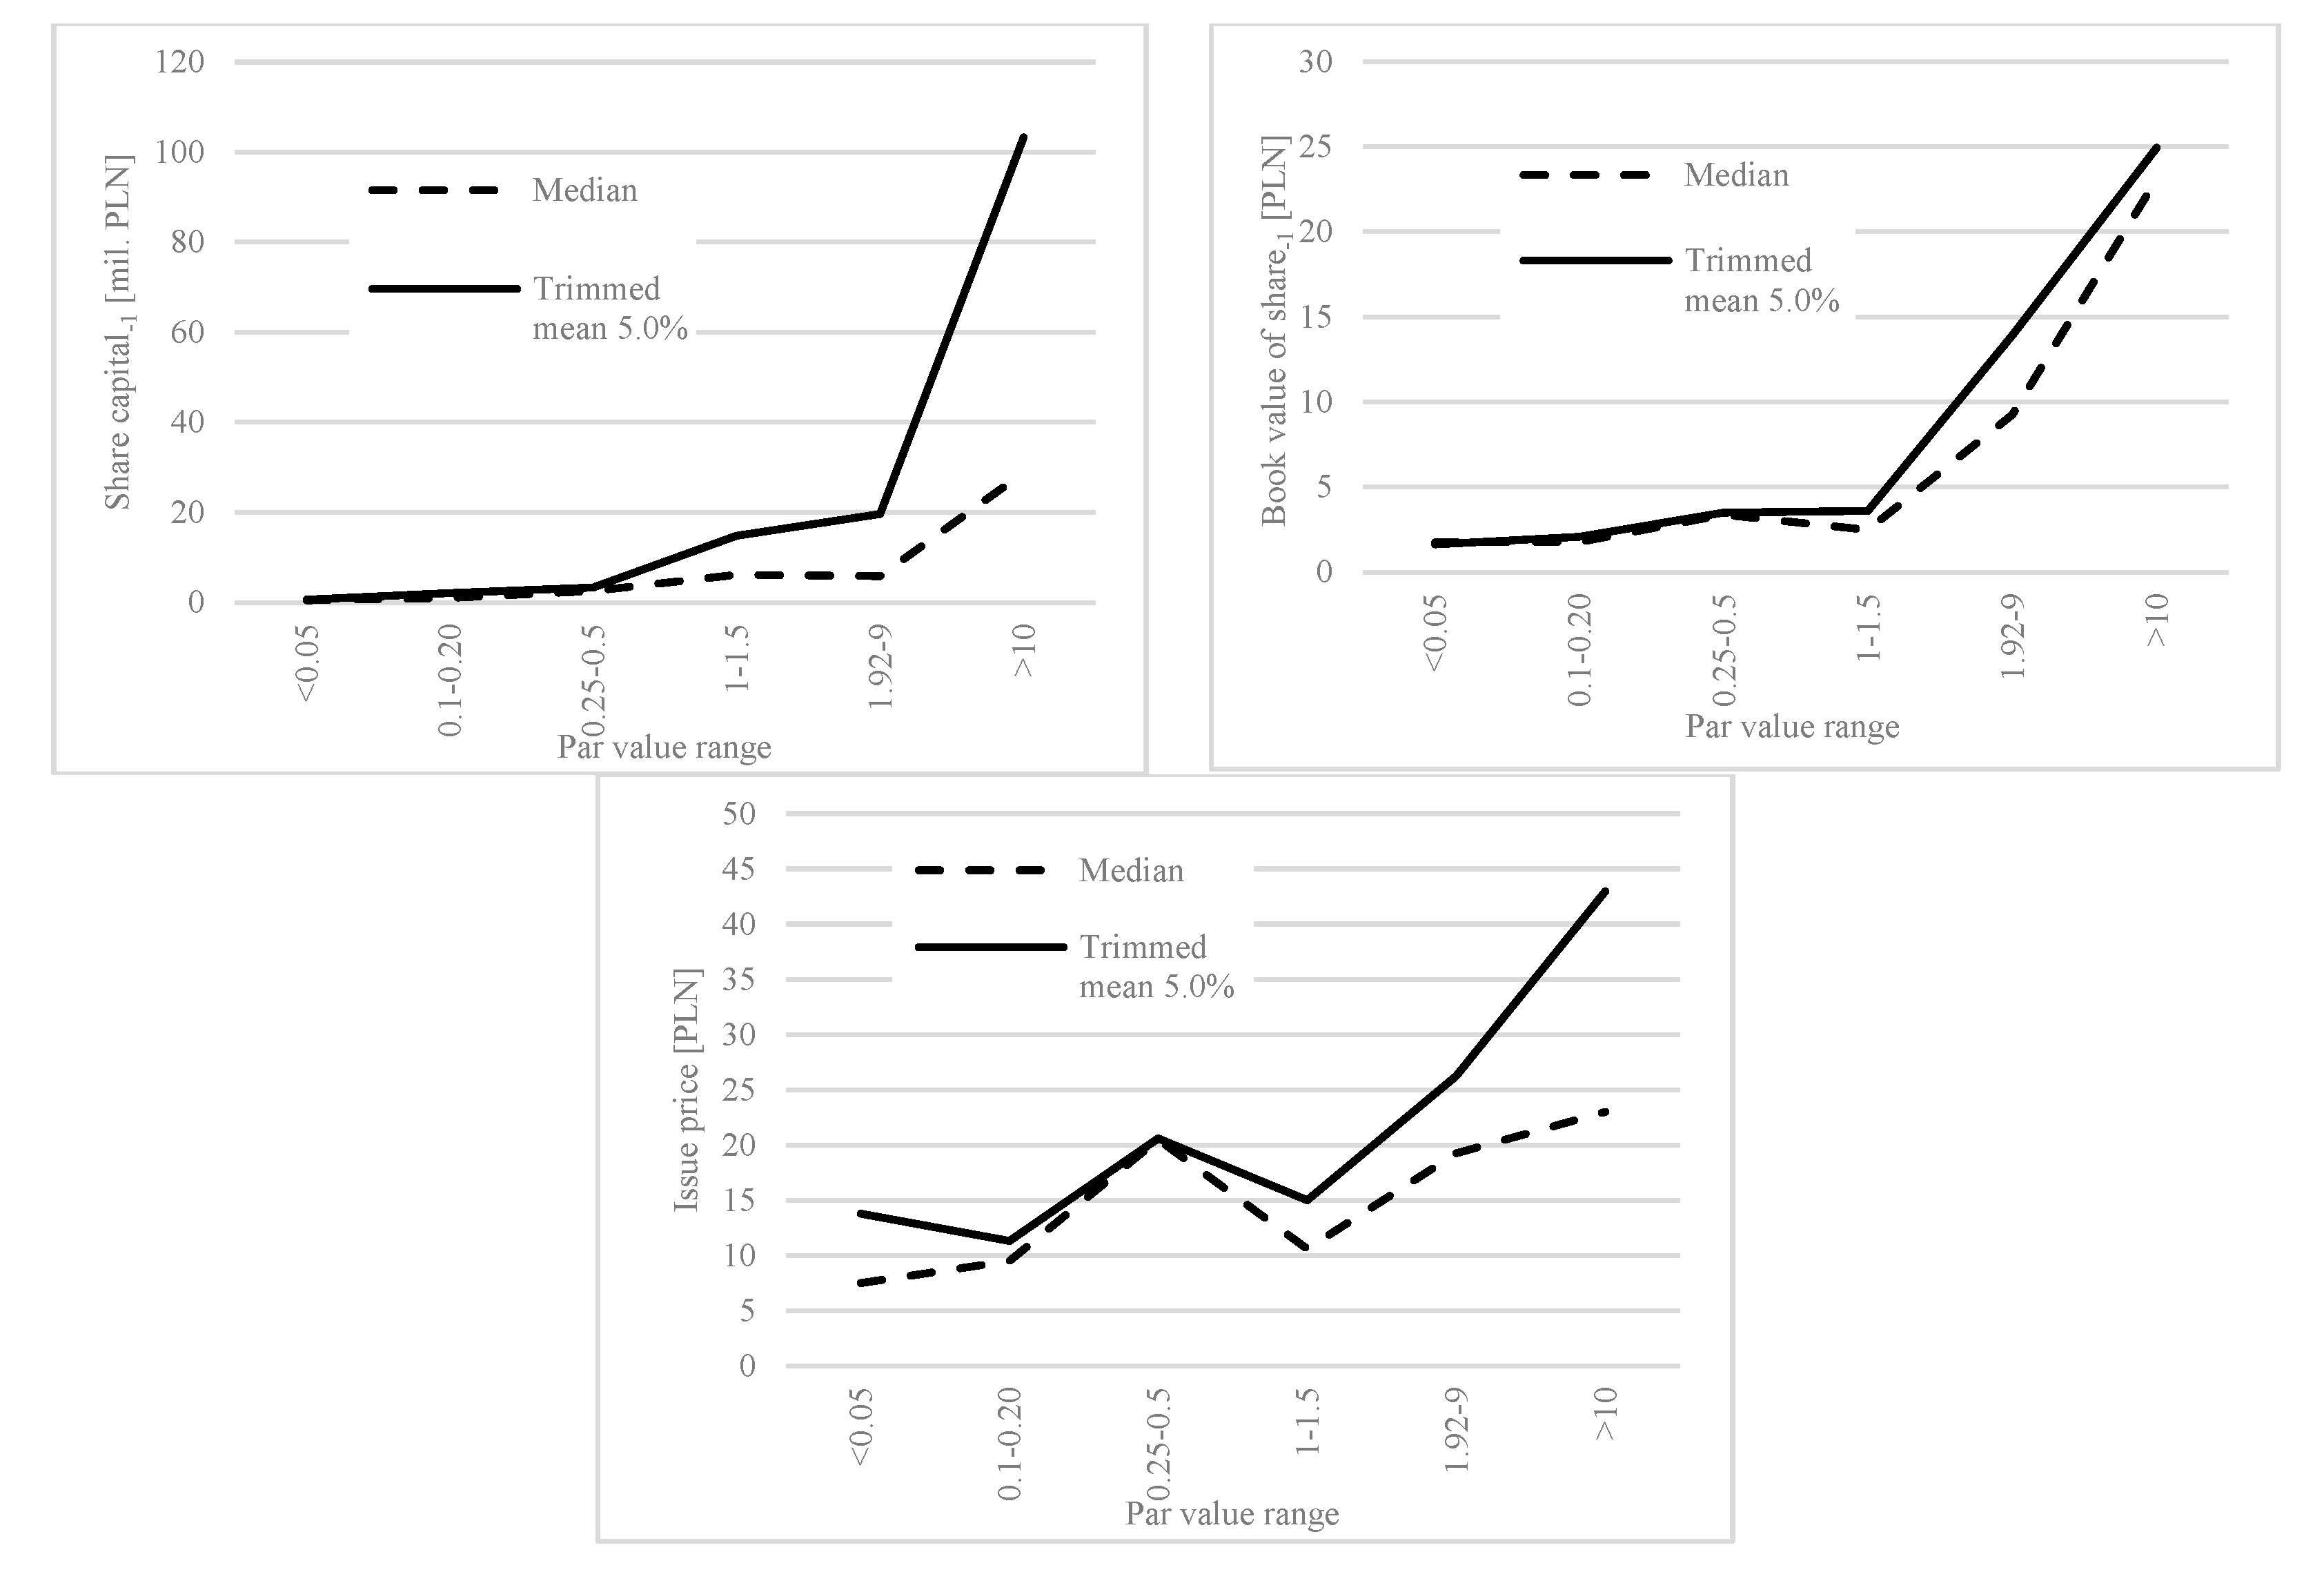
Figure 4.
Second-degree financing parameters depending on PaV.
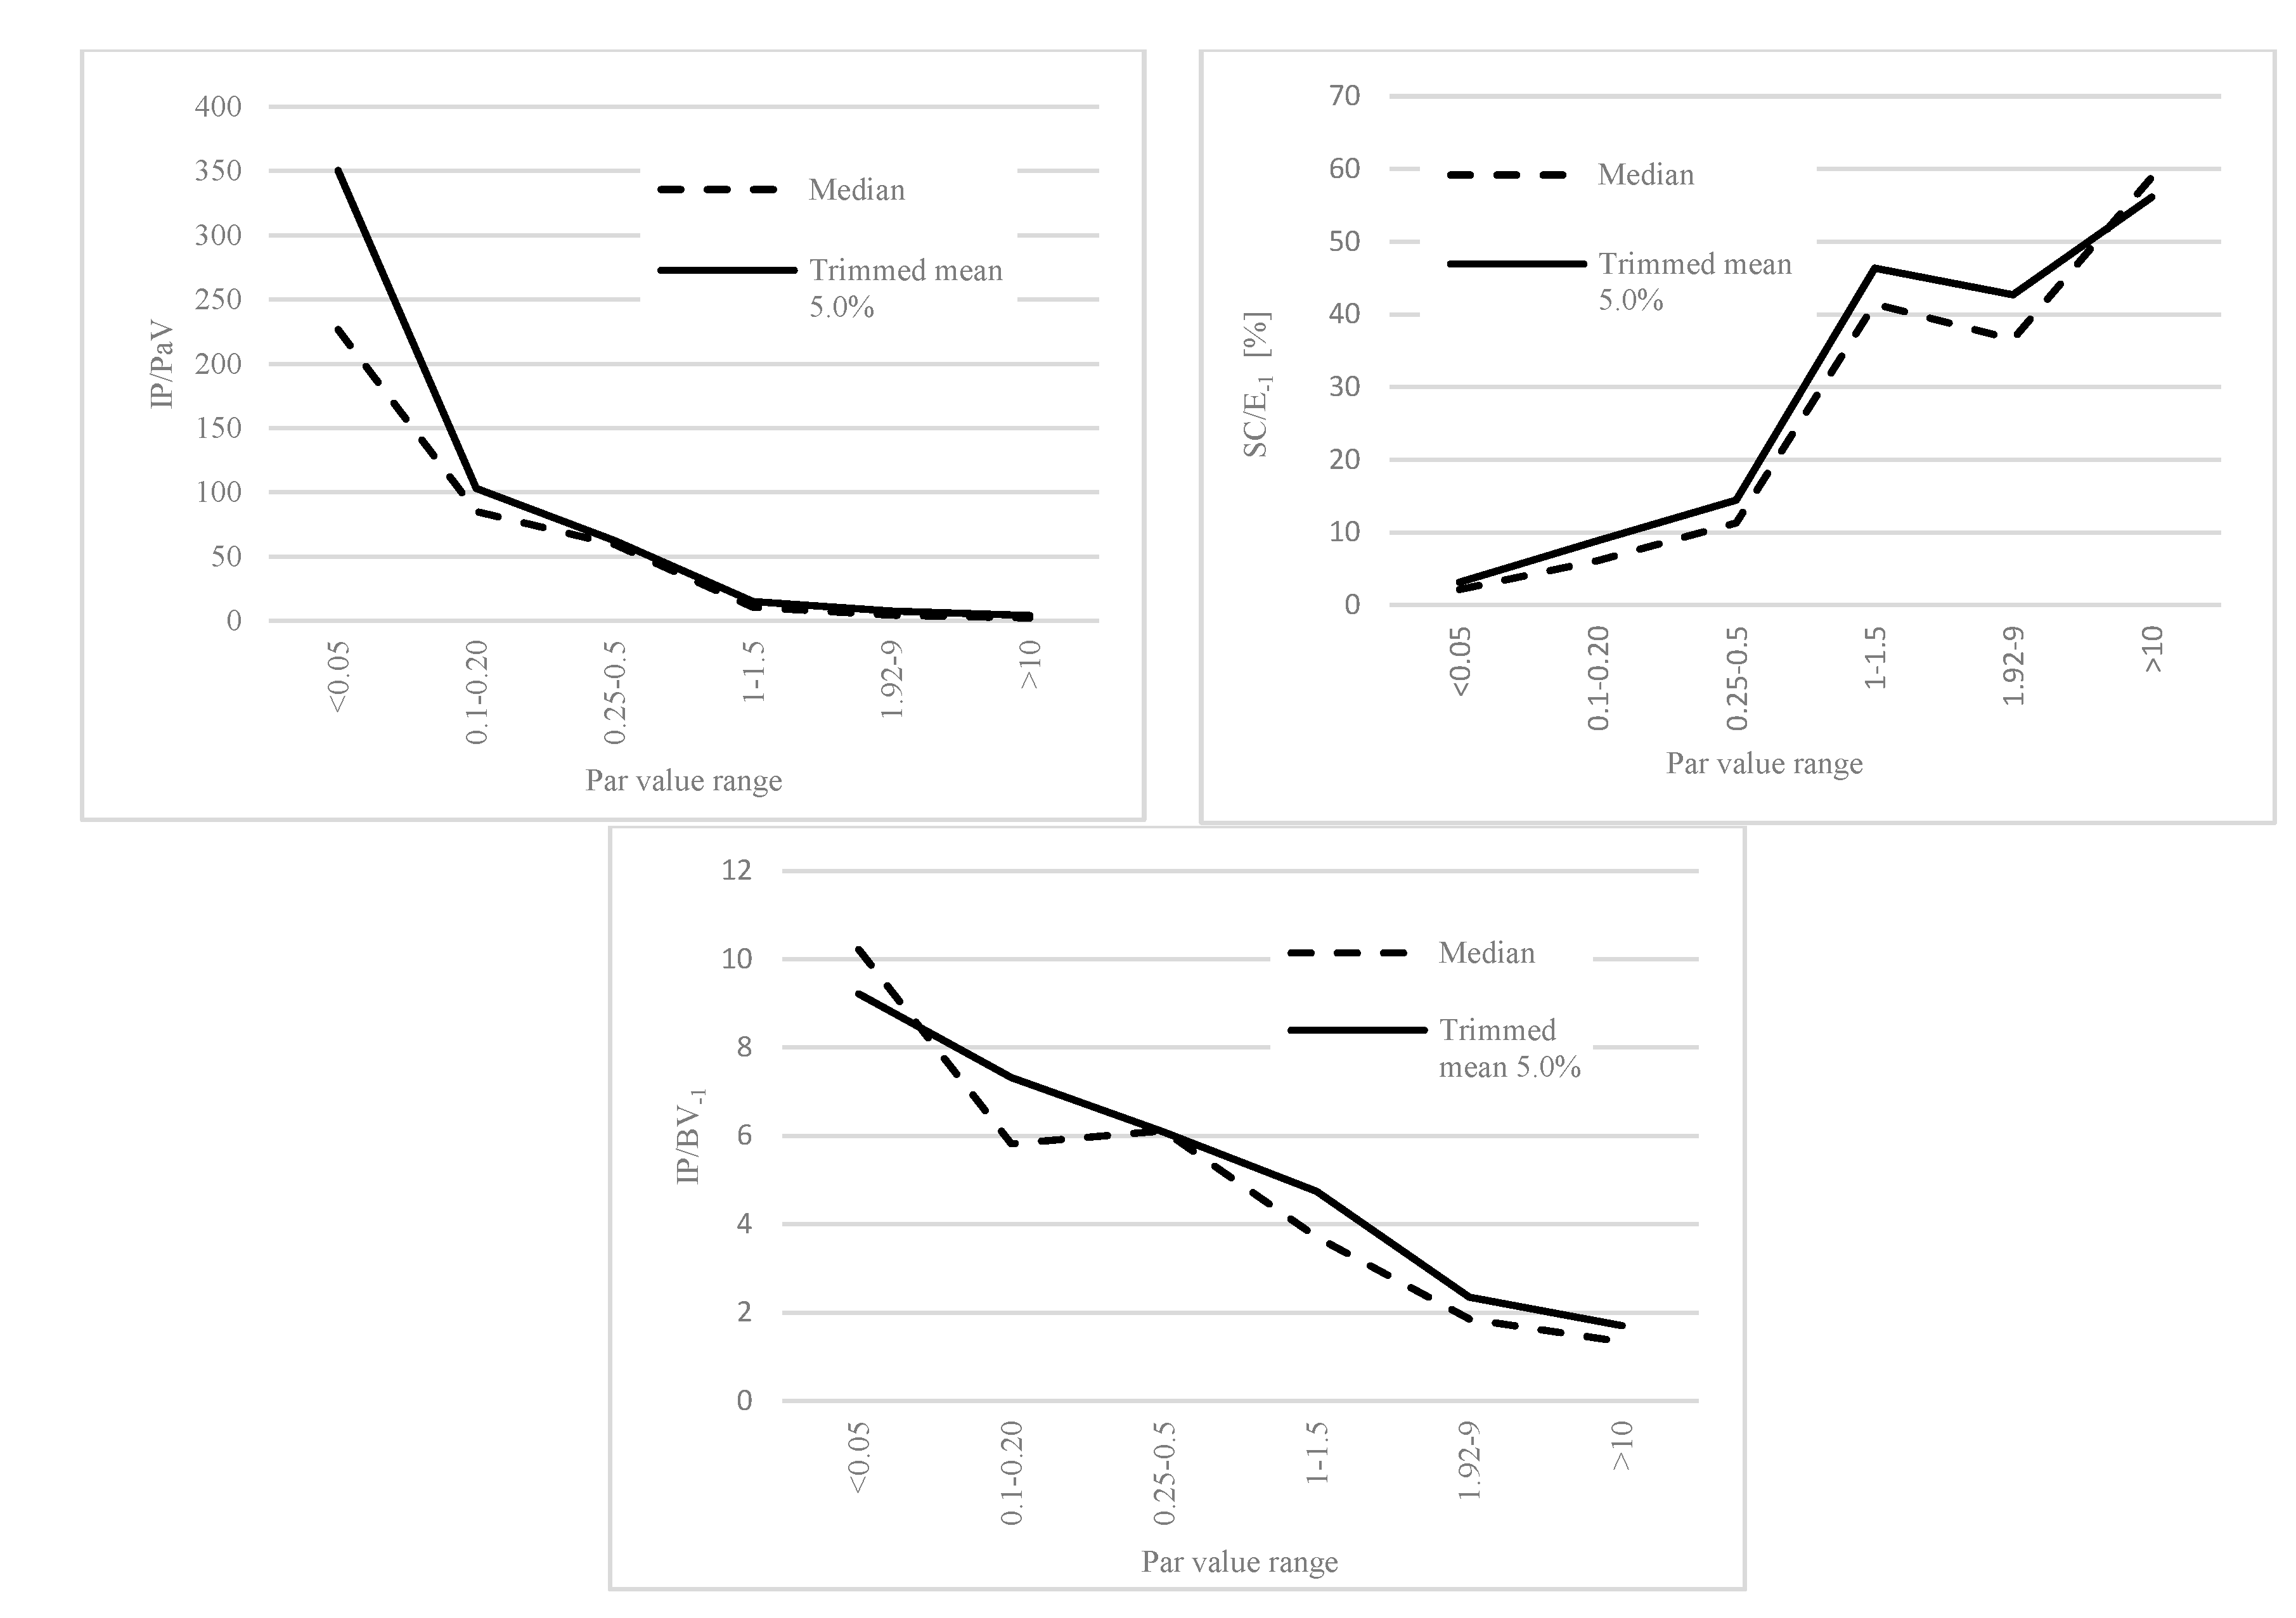
Figure 5.
Share-capital-to-equity ratio in subsequent years of issue depending on PaV.


Table 1.
Accounting consequences of the new share issue.
| Equity | Before New Issue | After New Issue | Growth | Share of the New Issue |
|---|---|---|---|---|
| 1 | 2 | 3 | 4 | 5 |
| Share capital | 25,000.00 | 31,250.00 | 25% | 20% |
| Share premium | 43,750.00 | |||
| Reserves | 20,000.00 | 20,000.00 | 0% | 0% |
| Total equity | 45,000.00 | 95,000.00 | 111% | 53% |
| Number of shares | 10,000 | 12,500 | 25% | 20% |
| Nominal value of shares | 2.50 | 2.50 | 0% | 0% |
| Book value of shares | 4.50 | 7.60 | 69% | 41% |
Table 2.
Sample characteristics.
| 1998 | 1999 | 2000 | 2001 | 2002 | 2003 | 2004 | 2005 | 2006 | 2007 | 2008 | 2009 | 2010 | 2011 | 2012 | 2013 | 1998–2013 | ||
|---|---|---|---|---|---|---|---|---|---|---|---|---|---|---|---|---|---|---|
| Panel A | ||||||||||||||||||
| Total number of IPOs | 51 | 20 | 11 | 7 | 5 | 6 | 36 | 58 | 63 | 81 | 31 | 13 | 34 | 38 | 19 | 23 | 496 | |
| Sample number of IPOs | 25 | 15 | 9 | 5 | 2 | 5 | 24 | 22 | 25 | 52 | 22 | 9 | 21 | 12 | 4 | 7 | 259 | |
| Ratio, sample number of IPOs to total number of IPOs [%] | 49.0 | 75.0 | 81.8 | 71.4 | 40.0 | 83.3 | 66.7 | 37.9 | 39.7 | 64.2 | 71.0 | 69.2 | 61.8 | 31.6 | 21.1 | 30.4 | 52.2 | |
| GDP growth [%] | 5.0 | 4.5 | 4.3 | 1.2 | 1.4 | 3.9 | 5.3 | 3.6 | 6.2 | 6.8 | 5.1 | 1.6 | 3.8 | 4.3 | 1.9 | 1.6 | 74.5 | |
| WIG | 12,795.6 | 18,083.6 | 17,847.6 | 13,922.2 | 14,366.7 | 20,820.1 | 26,636.2 | 35,600.8 | 50,411.8 | 55,648.5 | 27,228.6 | 39,986.0 | 47,489.9 | 37,595.4 | 47,460.6 | 51,284.3 | ||
| Change in WIG [%] | −12.8 | 41.3 | −1.3 | −22.0 | 3.2 | 44.9 | 27.9 | 33.7 | 41.6 | 10.4 | −51.1 | 46.9 | 18.8 | −20.8 | 26.2 | 8.1 | ||
| Panel B | ||||||||||||||||||
| Assets −1 [PLN million] | Mean | 44.8 | 142.5 | 596.2 | 43.1 | 86.1 | 134.9 | 130.5 | 1044.6 | 118.9 | 97.9 | 496.1 | 2719.5 | 129.7 | 115.2 | 312.9 | 183.3 | 331.9 |
| SD | 35.9 | 172.4 | 1158.3 | 33.8 | 52.8 | 57.0 | 212.7 | 3134.6 | 168.5 | 152.6 | 1868.1 | 7160.0 | 146.2 | 85.6 | 253.5 | 123.5 | 1736.8 | |
| Median | 34.8 | 52.5 | 39.4 | 41.7 | 86.1 | 122.0 | 74.2 | 52.4 | 55.9 | 52.1 | 29.0 | 69.9 | 93.9 | 96.3 | 329.3 | 161.6 | 54.7 | |
| Sales −1 [PLN million] | Mean | 91.4 | 235.8 | 174.0 | 47.5 | 269.4 | 162.8 | 107.3 | 966.3 | 144.5 | 118.3 | 343.6 | 1243.6 | 90.6 | 98.1 | 144.0 | 82.0 | 253.5 |
| SD | 101.9 | 260.9 | 249.5 | 67.7 | 299.5 | 85.1 | 221.2 | 2215.7 | 256.9 | 130.9 | 1072.9 | 3190.0 | 114.5 | 88.5 | 156.8 | 141.8 | 961.8 | |
| Median | 52.8 | 78.5 | 63.1 | 23.1 | 269.4 | 189.3 | 49.2 | 77.7 | 50.0 | 62.5 | 26.8 | 36.5 | 53.7 | 69.2 | 120.7 | 8.0 | 54.9 |
Table 3.
Variable definitions.
| Variable | Definition |
|---|---|
| PaV | Par value is the per-share amount appearing on stock certificates |
| SC | Share capital = number of shares outstanding multiplied by PaV |
| IP | Issue price is the price at which a new issue of shares is offered to the public |
| BV | Book value of shares, calculated as shareholders’ equity, estimated as the difference between total assets and total liabilities divided by number of shares outstanding |
| Ln(Assets) | Natural logarithm of total assets |
| Ln(PaV) | Natural logarithm of par value |
| Ln(SC) | Natural logarithm of share capital |
| Ln(BV) | Natural logarithm of book value of share |
| SC/E | Ratio of share capital to the total shareholders’ equity |
| S/A | Ratio of sales to total assets |
| ROE | Return on equity, defined as net income divided by shareholders’ equity calculated as the difference between total assets and total liabilities |
| D/A | Debt ratio, defined as total debt (the sum of current liabilities and long-term liabilities) divided by total assets |
| CR | Cash ratio, defined as short-term investments divided by current liabilities |
| E/FA | Shareholders’ equity-to-fixed-assets ratio, defined as shareholders’ equity to total fixed assets |
| Ln(NrSh) | Natural logarithm of number of shares issued |
| IP/PaV | Ratio of issue price to the par value of shares |
| IP/BV | Ratio of issue price to the book value of shares |
| WIG | Value of the Warsaw Stock Exchange Index, comprising all companies listed on the main market; the initial value of the WIG Index on 16 April 1991 was 1000 points |
| GDP growth | Gross domestic product growth rate, defined as the percentage change in GDP in one year |
| Sector | Sector of the economy |
| Subscripts: −1, 0, 1, 2, 3 | Indicates the year in relation to the year of issue (0 is the year of issue) |
Table 4.
Par value range.
| Number of the Par Value Group | Range |
|---|---|
| 1 | <0.05 |
| 2 | 0.1–0.20 |
| 3 | 0.25–0.5 |
| 4 | 1–1.5 |
| 5 | 1.92–9 |
| 6 | >10 |
Table 5.
Descriptive statistics and correlation matrix for explanatory variables on the financing parameters.
Table 5.
Descriptive statistics and correlation matrix for explanatory variables on the financing parameters.
| Mean | SD | 1 | 2 | 3 | 4 | 5 | 6 | 7 | 8 | 9 | 10 | 11 | 12 | 13 | |
|---|---|---|---|---|---|---|---|---|---|---|---|---|---|---|---|
| 1. Sector | 4.97 | 3.75 | 1.00 | ||||||||||||
| 2. ROE −1 | 0.22 | 0.24 | −0.03 (0.633) | 1.00 | |||||||||||
| 3. S/A −1 | 1.88 | 5.45 | −0.09 (0.133) | 0.12 (0.048) | 1.00 | ||||||||||
| 4. D/A −1 | 0.52 | 0.22 | −0.12 (0.053) | 0.19 (0.002) | 0.02 (0.746) | 1.00 | |||||||||
| 5. CR −1 | 0.69 | 2.88 | 0.03 (0.607) | −0.19 (0.002) | −0.01 (0.852) | −0.14 (0.025) | 1.00 | ||||||||
| 6. E/FA | 2.21 | 7.47 | 0.13 (0.041) | 0.05 (0.418) | −0.01 (0.888) | −0.15 (0.016) | 0.34 (0.000) | 1.00 | |||||||
| 7. Ln(Assets) −1 | 11.02 | 1.50 | −0.01 (0.925) | −0.26 (0.000) | −0.17 (0.006) | 0.04 (0.528) | 0.09 (0.152) | −0.13 (0.032) | 1.00 | ||||||
| 8. Ln(NrSh) −1 | 15.83 | 1.43 | 0.00 (0.991) | −0.15 (0.019) | −0.13 (0.036) | −0.17 (0.005) | 0.09 (0.168) | −0.06 (0.308) | 0.62 (0.000) | 1.00 | |||||
| 9. Ln(PaV) | −0.33 | 1.47 | 0.11 (0.081) | −0.30 (0.000) | −0.01 (0.837) | −0.14 (0.025) | 0.10 (0.106) | 0.00 (0.938) | 0.16 (0.010) | −0.29 (0.000) | 1.00 | ||||
| 10. Ln(IP) | 2.54 | 1.04 | −0.04 (0.560) | 0.14 (0.023) | −0.03 (0.601) | 0.13 (0.038) | 0.05 (0.445) | 0.00 (0.991) | 0.18 (0.004) | −0.42 (0.000) | 0.26 (0.000) | 1.00 | |||
| 11. Ln(BV) −1 | 1.23 | 1.23 | 0.03 (0.669) | −0.21 (0.001) | −0.06 (0.315) | −0.18 (0.005) | 0.05 (0.420) | −0.03 (0.628) | 0.45 (0.000) | −0.33 (0.000) | 0.58 (0.000) | 0.65 (0.000) | 1.00 | ||
| 12. WIG | 36,769.81 | 15,187.29 | −0.01 (0.858) | 0.08 (0.204) | −0.10 (0.127) | 0.08 (0.209) | −0.02 (0.701) | 0.08 (0.204) | 0.02 (0.750) | 0.32 (0.000) | −0.42 (0.000) | −0.06 (0.334) | −0.36 (0.000) | 1.00 | |
| 13. SC/E −1 | 0.40 | 0.57 | 0.14 (0.024) | −0.12 (0.050) | 0.02 (0.804) | −0.07 (0.286) | 0.03 (0.621) | 0.01 (0.839) | −0.25 (0.000) | 0.03 (0.584) | 0.30 (0.000) | −0.25 (0.000) | −0.33 (0.000) | 0.03 (0.685) | 1.00 |
p-values are reported in parentheses.
Table 6.
Financing parameters of first-degree relationships depending on PaV.
| Number of the Par Value Group | N | Mean Value | Kruskal–Wallis test. p-Value for Multiple Comparisons (Bilateral) | ||||||||
|---|---|---|---|---|---|---|---|---|---|---|---|
| Mean | SD | Median | Trimmed Mean 5.0% | 1 | 2 | 3 | 4 | 5 | 6 | ||
| Panel A | Share Capital (SC) (PLN million) | ||||||||||
| 1 | 11 | 0.66 | 0.25 | 0.51 | 0.63 | ||||||
| 2 | 56 | 3.54 | 8.75 | 1.00 | 2.05 | 1.000 | |||||
| 3 | 18 | 3.60 | 3.49 | 2.51 | 3.27 | 0.317 | 1.000 | ||||
| 4 | 113 | 69.30 | 472.38 | 6.14 | 14.79 | 0.000 | 0.000 | 0.027 | |||
| 5 | 42 | 27.49 | 48.42 | 5.82 | 19.61 | 0.000 | 0.000 | 0.020 | 1.000 | ||
| 6 | 19 | 866.56 | 3 355.30 | 28.83 | 103.30 | 0.000 | 0.000 | 0.000 | 0.030 | 0.275 | |
| Panel B | Book Value (BV) [PLN] | ||||||||||
| 1 | 11 | 1.75 | 1.25 | 1.76 | 1.64 | ||||||
| 2 | 56 | 2.40 | 2.35 | 1.77 | 2.08 | 1.000 | |||||
| 3 | 18 | 3.73 | 2.55 | 3.36 | 3.49 | 0.814 | 0.625 | ||||
| 4 | 113 | 5.12 | 8.68 | 2.48 | 3.59 | 0.810 | 0.143 | 1.000 | |||
| 5 | 42 | 16.75 | 20.59 | 9.24 | 13.91 | 0.000 | 0.000 | 0.026 | 0.000 | ||
| 6 | 19 | 26.01 | 17.25 | 23.09 | 24.95 | 0.000 | 0.000 | 0.000 | 0.000 | 0.888 | |
| Panel C | Issue Price (IP) [PLN] | ||||||||||
| 1 | 11 | 14.80 | 11.80 | 7.50 | 13.78 | ||||||
| 2 | 56 | 13.04 | 11.94 | 9.50 | 11.31 | 1.000 | |||||
| 3 | 18 | 21.21 | 13.54 | 20.50 | 20.59 | 1.000 | 0.298 | ||||
| 4 | 113 | 20.82 | 36.98 | 10.60 | 14.98 | 1.000 | 1.000 | 0.718 | |||
| 5 | 42 | 31.50 | 39.22 | 19.25 | 26.25 | 1.000 | 0.035 | 1.000 | 0.096 | ||
| 6 | 19 | 50.94 | 65.57 | 23.00 | 42.97 | 0.173 | 0.001 | 1.000 | 0.002 | 1.000 | |
This table presents basic statistics for the first-degree financing parameters divided into groups separated on the basis of par value. The Kruskal–Wallis test was used to test the significance of differences between groups. The results of these comparisons are presented in the multiple-comparison system. p-values less than 0.1 are in bold.
Table 7.
Regression analysis of the determinants of first-degree financing parameters.
| Variables | Ln SC−1 | Ln BV−1 | Ln IP |
|---|---|---|---|
| ROE −1 | −0.020 (0.494) | 0.010 (0.813) | 0.242 *** (0.000) |
| S/A −1 | −0.000 (0.998) | −0.012 (0.755) | −0.031 (0.428) |
| D/A −1 | −0.206 *** (0.000) | −0.127 *** (0.001) | 0.184 *** (0.000) |
| CR −1 | 0.004 (0.876) | −0.041 (0.300) | 0.111 *** (0.008) |
| E/FA −1 | 0.009 (0.758) | 0.005 (0.895) | −0.026 (0.524) |
| WIG | 0.028 (0.337) | −0.083 ** (0.045) | 0.263 *** (0.000) |
| SC/E −1 | 0.345 *** (0.000) | −0.463 *** (0.000) | 0.072 * (0.085) |
| Ln(NrSh) | −0.265 *** (0.000) | ||
| Sector | −0.011 (0.691) | 0.008 (0.828) | −0.052 (0.180) |
| Ln(PaV) | 0.358 *** (0.000) | 0.632 *** (0.000) | |
| Ln(Assets) −1 | 0.701 *** (0.000) | 0.246 *** (0.000) | |
| Ln(BV) −1 | 0.778 *** (0.000) | ||
| R | 0.914 | 0.825 | 0.807 |
| R2 | 0.836 | 0.680 | 0.651 |
| Adjusted R2 | 0.829 | 0.667 | 0.637 |
| F | 126.46 | 52.781 | 46.309 |
This table reports the results of the regressions from the following models:
The constant term is not reported. Subscript −1 denotes one year before IPO. p-values are reported in parentheses. (*), (**) and (***) indicate that coefficients are significant at the 10, 5 and 1 percent levels of significance, respectively.
Table 8.
Second-degree financing parameters depending on PaV.
| Number of the Par Value Group | N | Mean Value | Kruskal–Wallis Test. p-Value for Multiple Comparisons (Bilateral) | ||||||||
|---|---|---|---|---|---|---|---|---|---|---|---|
| Mean | SD | Median | Trimmed Mean 5.0% | 1 | 2 | 3 | 4 | 5 | 6 | ||
| Panel A | IP/PaV | ||||||||||
| 1 | 11 | 455.28 | 501.63 | 226.67 | 350.45 | ||||||
| 2 | 56 | 114.84 | 95.85 | 85.00 | 102.98 | 1.000 | |||||
| 3 | 18 | 64.85 | 46.12 | 59.31 | 62.35 | 0.586 | 1.000 | ||||
| 4 | 113 | 20.57 | 35.40 | 10.60 | 14.91 | 0.000 | 0.000 | 0.001 | |||
| 5 | 42 | 10.37 | 16.87 | 4.25 | 7.56 | 0.000 | 0.000 | 0.000 | 0.346 | ||
| 6 | 19 | 4.98 | 6.54 | 2.30 | 4.17 | 0.000 | 0.000 | 0.000 | 0.007 | 1.000 | |
| Panel B | SC/E−1 | ||||||||||
| 1 | 11 | 4.56 | 5.94 | 2.17 | 3.16 | ||||||
| 2 | 56 | 10.98 | 13.99 | 6.12 | 8.86 | 1.000 | |||||
| 3 | 18 | 15.00 | 10.94 | 11.30 | 14.42 | 0.675 | 1.000 | ||||
| 4 | 113 | 56.99 | 76.04 | 41.44 | 46.37 | 0.000 | 0.000 | 0.001 | |||
| 5 | 42 | 45.41 | 35.58 | 36.55 | 42.70 | 0.000 | 0.000 | 0.015 | 1.000 | ||
| 6 | 19 | 56.62 | 30.81 | 58.89 | 56.14 | 0.000 | 0.000 | 0.001 | 1.000 | 1.000 | |
| Panel C | IP/BV−1 | ||||||||||
| 1 | 11 | 10.30 | 7.18 | 10.22 | 9.21 | ||||||
| 2 | 56 | 8.71 | 9.10 | 5.82 | 7.32 | 1.000 | |||||
| 3 | 18 | 6.20 | 3.04 | 6.12 | 6.09 | 1.000 | 1.000 | ||||
| 4 | 113 | 6.10 | 8.74 | 3.72 | 4.75 | 0.103 | 0.168 | 1.000 | |||
| 5 | 42 | 2.58 | 2.19 | 1.86 | 2.36 | 0.000 | 0.000 | 0.001 | 0.001 | ||
| 6 | 19 | 1.83 | 1.41 | 1.34 | 1.71 | 0.000 | 0.000 | 0.000 | 0.001 | 1.000 | |
This table presents basic statistics for the second-degree financing parameters divided into groups separated on the basis of par value. The Kruskal–Wallis test was used to test the significance of differences between groups. The results of these comparisons are presented in the multiple-comparison system. p-values less than 0.1 are in bold.
Table 9.
Regression analysis of the determinants of second-degree financing parameters.
| Variables | SC/E−1 | IP/PaV | IP/BV−1 |
|---|---|---|---|
| ROE −1 | −0.101 (0.106) | 0.262 *** (0.000) | 0.262 *** (0.000) |
| S/A −1 | 0.001 (0.986) | −0.007 (0.905) | −0.018 (0.709) |
| D/A −1 | 0.019 (0.738) | −0.069 (0.259) | 0.176 *** (0.000) |
| CR −1 | 0.020 (0.734) | 0.020 (0.754) | 0.081 (0.110) |
| E/FA −1 | −0.056 (0.345) | −0.048 (0.458) | −0.039 (0.439) |
| WIG | 0.216 *** (0.001) | 0.189 *** (0.002) | 0.148 *** (0.007) |
| SC/E −1 | −0.178 *** (0.005) | 0.514 *** (0.000) | |
| Ln(NrSh) | −0.177 *** (0.001) | ||
| Sector | 0.095 * (0.091) | 0.028 (0.638) | −0.018 (0.707) |
| Ln(PaV) | 0.402 *** (0.000) | −0.311 *** (0.000) | |
| Ln(Assets) −1 | −0.363 *** (0.000) | 0.061 (0.355) | |
| R | 0.491 | 0.381 | 0.685 |
| R2 | 0.241 | 0.145 | 0.469 |
| Adjusted R2 | 0.213 | 0.114 | 0.448 |
| F | 8.774 | 4.670 | 21.924 |
This table reports the results of the regressions from the following models:
The constant term is not reported. Subscript −1 denotes one year before IPO. p-values are reported in parentheses. (*) and (***) indicate that coefficients are significant at the 10, 5 and 1 percent levels of significance, respectively.
Table 10.
Share-capital-to-equity ratio in subsequent years of issue depending on PaV.
| Number of the Par Value Group | N | Mean Value | Kruskal–Wallis Test. p-Value for Multiple Comparisons (Bilateral) | ||||||||
|---|---|---|---|---|---|---|---|---|---|---|---|
| Mean | SD | Median | Trimmed Mean 5.0% | 1 | 2 | 3 | 4 | 5 | 6 | ||
| Panel A | SC/E0 | ||||||||||
| 1 | 11 | 1.72 | 1.87 | 1.09 | 1.38 | ||||||
| 2 | 56 | 4.70 | 4.99 | 3.31 | 3.85 | 1.000 | |||||
| 3 | 18 | 6.97 | 5.10 | 4.65 | 6.54 | 0.624 | 1.000 | ||||
| 4 | 113 | 30.07 | 27.01 | 19.88 | 27.53 | 0.000 | 0.000 | 0.001 | |||
| 5 | 42 | 31.74 | 23.12 | 24.23 | 30.55 | 0.000 | 0.000 | 0.000 | 1.000 | ||
| 6 | 19 | 48.45 | 24.64 | 41.77 | 48.08 | 0.000 | 0.000 | 0.000 | 0.149 | 1.000 | |
| Panel B | SC/E1 | ||||||||||
| 1 | 11 | 1.66 | 1.78 | 1.27 | 1.42 | ||||||
| 2 | 55 | 5.35 | 12.32 | 2.86 | 3.27 | 1.000 | |||||
| 3 | 18 | 6.32 | 4.52 | 4.28 | 5.93 | 0.727 | 1.000 | ||||
| 4 | 113 | 29.83 | 31.81 | 17.08 | 25.74 | 0.000 | 0.000 | 0.001 | |||
| 5 | 41 | 36.04 | 31.68 | 23.97 | 32.83 | 0.000 | 0.000 | 0.000 | 1.000 | ||
| 6 | 19 | 48.40 | 27.97 | 39.71 | 47.41 | 0.000 | 0.000 | 0.000 | 0.139 | 1.000 | |
| Panel C | SC/E2 | ||||||||||
| 1 | 11 | 1.27 | 1.19 | 1.20 | 1.05 | ||||||
| 2 | 53 | 6.86 | 15.79 | 2.41 | 3.39 | 1.000 | |||||
| 3 | 18 | 6.43 | 4.40 | 4.58 | 6.17 | 0.338 | 1.000 | ||||
| 4 | 108 | 35.29 | 56.81 | 17.19 | 27.35 | 0.000 | 0.000 | 0.003 | |||
| 5 | 40 | 39.90 | 63.78 | 22.28 | 30.27 | 0.000 | 0.000 | 0.001 | 1.000 | ||
| 6 | 19 | 48.85 | 32.07 | 38.69 | 45.75 | 0.000 | 0.000 | 0.000 | 0.170 | 1.000 | |
| Panel D | SC/E3 | ||||||||||
| 1 | 10 | 2.32 | 3.26 | 1.13 | 1.58 | ||||||
| 2 | 51 | 12.80 | 40.40 | 2.38 | 4.32 | 1.000 | |||||
| 3 | 15 | 6.61 | 4.14 | 4.79 | 6.49 | 0.898 | 1.000 | ||||
| 4 | 102 | 41.28 | 140.29 | 15.50 | 25.23 | 0.000 | 0.000 | 0.050 | |||
| 5 | 38 | 37.47 | 34.50 | 27.90 | 33.49 | 0.000 | 0.000 | 0.002 | 0.946 | ||
| 6 | 19 | 56.58 | 54.25 | 40.54 | 50.26 | 0.000 | 0.000 | 0.000 | 0.158 | 1.000 | |
This table presents basic statistics of the SC/E ratio in the period starting one year before the IPO up to three years after the IPO. The ratio was divided into groups separated on the basis of par value. The Kruskal–Wallis test was used to test the significance of differences between groups. The results of these comparisons are presented in the multiple-comparison system. p-values less than 0.1 are in bold.
Publisher’s Note: MDPI stays neutral with regard to jurisdictional claims in published maps and institutional affiliations. |
© 2021 by the authors. Licensee MDPI, Basel, Switzerland. This article is an open access article distributed under the terms and conditions of the Creative Commons Attribution (CC BY) license (http://creativecommons.org/licenses/by/4.0/).
Share and Cite
MDPI and ACS Style
Dudycz, T.; Brycz, B. Why the Par Value of Share Matters to Investors. Int. J. Financial Stud. 2021, 9, 16. https://0-doi-org.brum.beds.ac.uk/10.3390/ijfs9010016
AMA Style
Dudycz T, Brycz B. Why the Par Value of Share Matters to Investors. International Journal of Financial Studies. 2021; 9(1):16. https://0-doi-org.brum.beds.ac.uk/10.3390/ijfs9010016
Chicago/Turabian StyleDudycz, Tadeusz, and Bogumiła Brycz. 2021. "Why the Par Value of Share Matters to Investors" International Journal of Financial Studies 9, no. 1: 16. https://0-doi-org.brum.beds.ac.uk/10.3390/ijfs9010016
Note that from the first issue of 2016, this journal uses article numbers instead of page numbers. See further details here.