Detection of Physical Strain and Fatigue in Industrial Environments Using Visual and Non-Visual Low-Cost Sensors

 , , and
Abstract
:1. Introduction
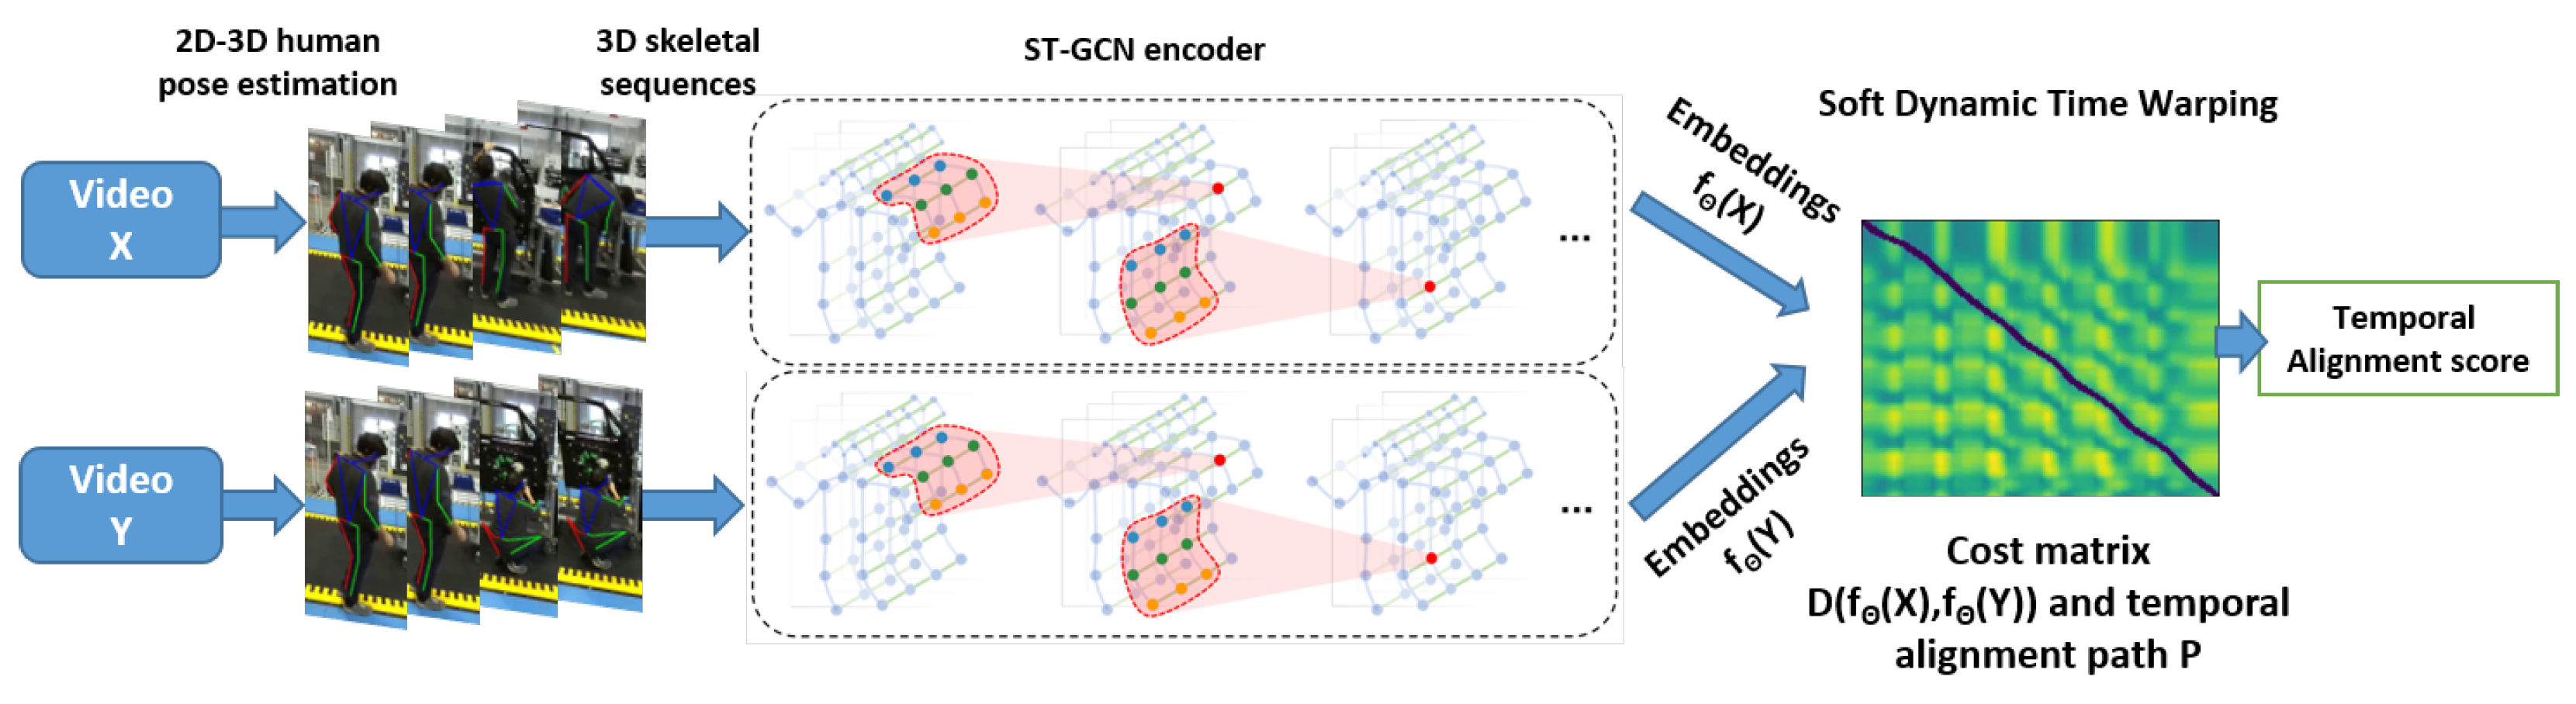
- An unobtrusive and low cost solution for the detection of physical strain and fatigue during work activities, which is based on the smart fusion of vision-based extracted information (working postures) and non-visual (heart rate) input, regardless of the activity performed. A vision-based approach for the classification of ergonomically sub-optimal working postures that cause increased physical strain is proposed. It relies on the combination of Graph-based Convolutional Networks and the soft-DTW method for pairwise temporal alignment of 3D skeletal data sequences. The proposed approach can achieve real-time/online runtime performance using continuous streams of data acquired by a single camera.
- A predictive model for the early detection of high heart rate incidents, which exploits vision-based extracted information related to the worker physical strain to improve heart rate prediction accuracy.
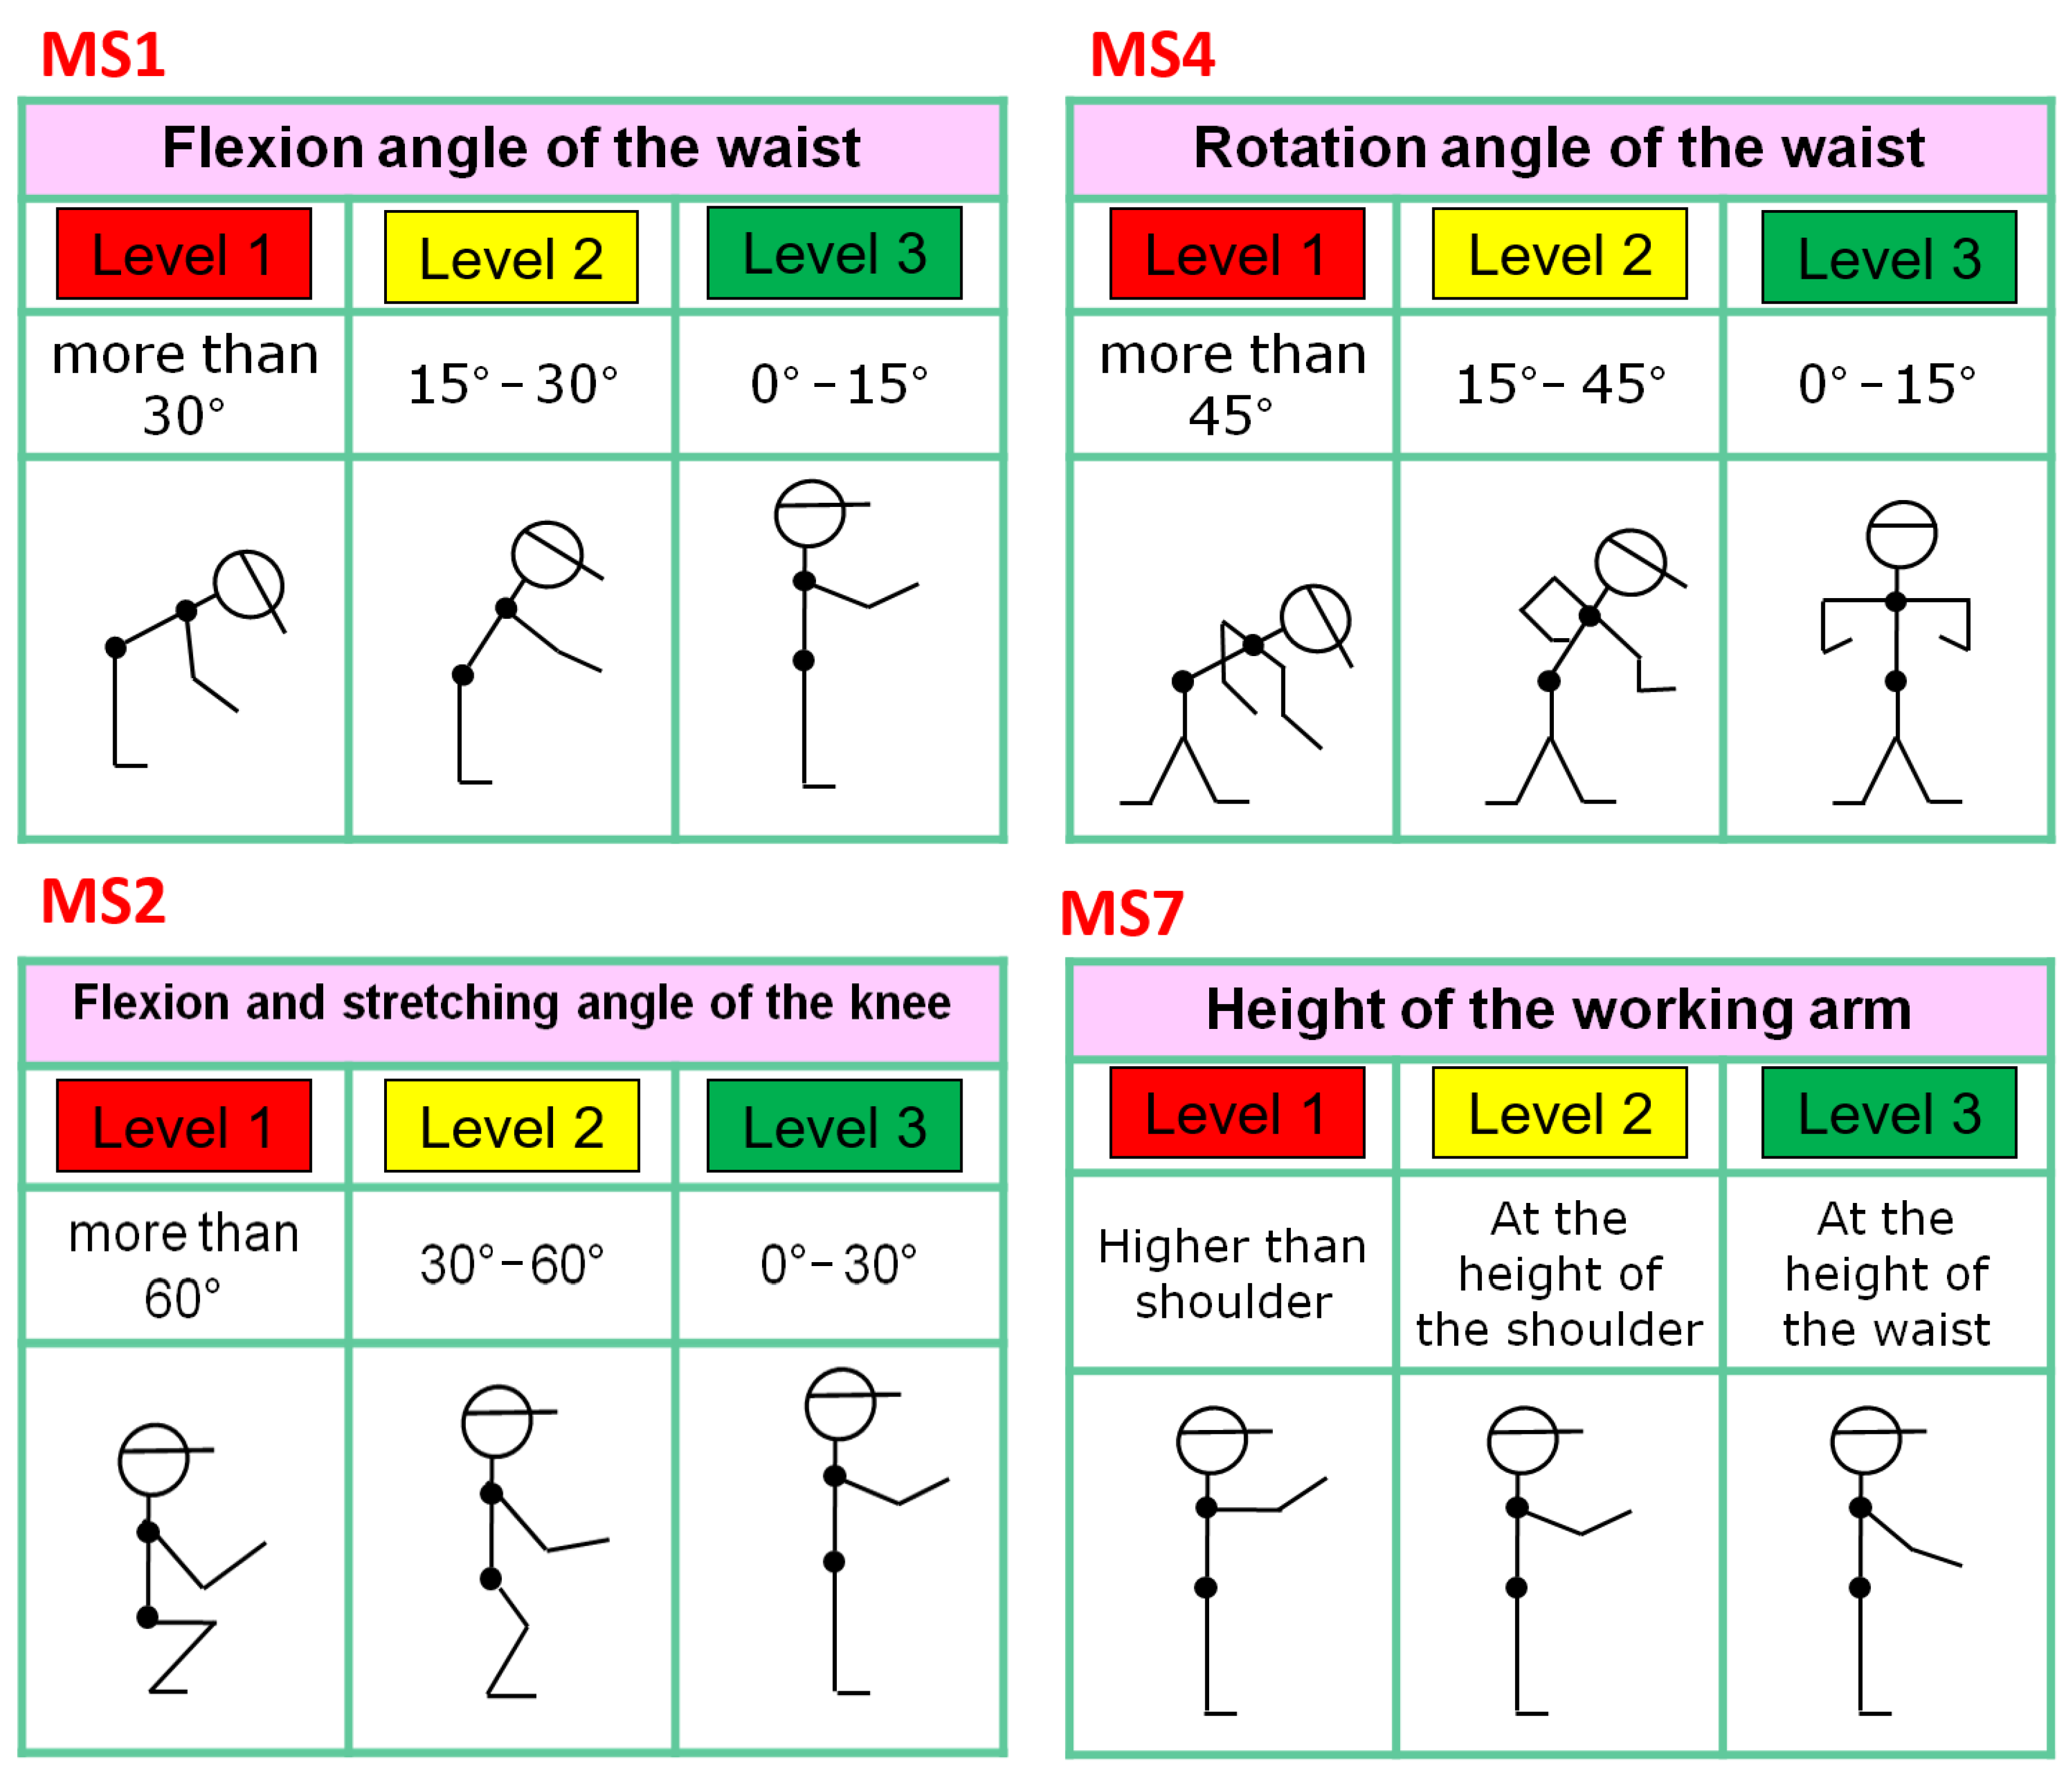
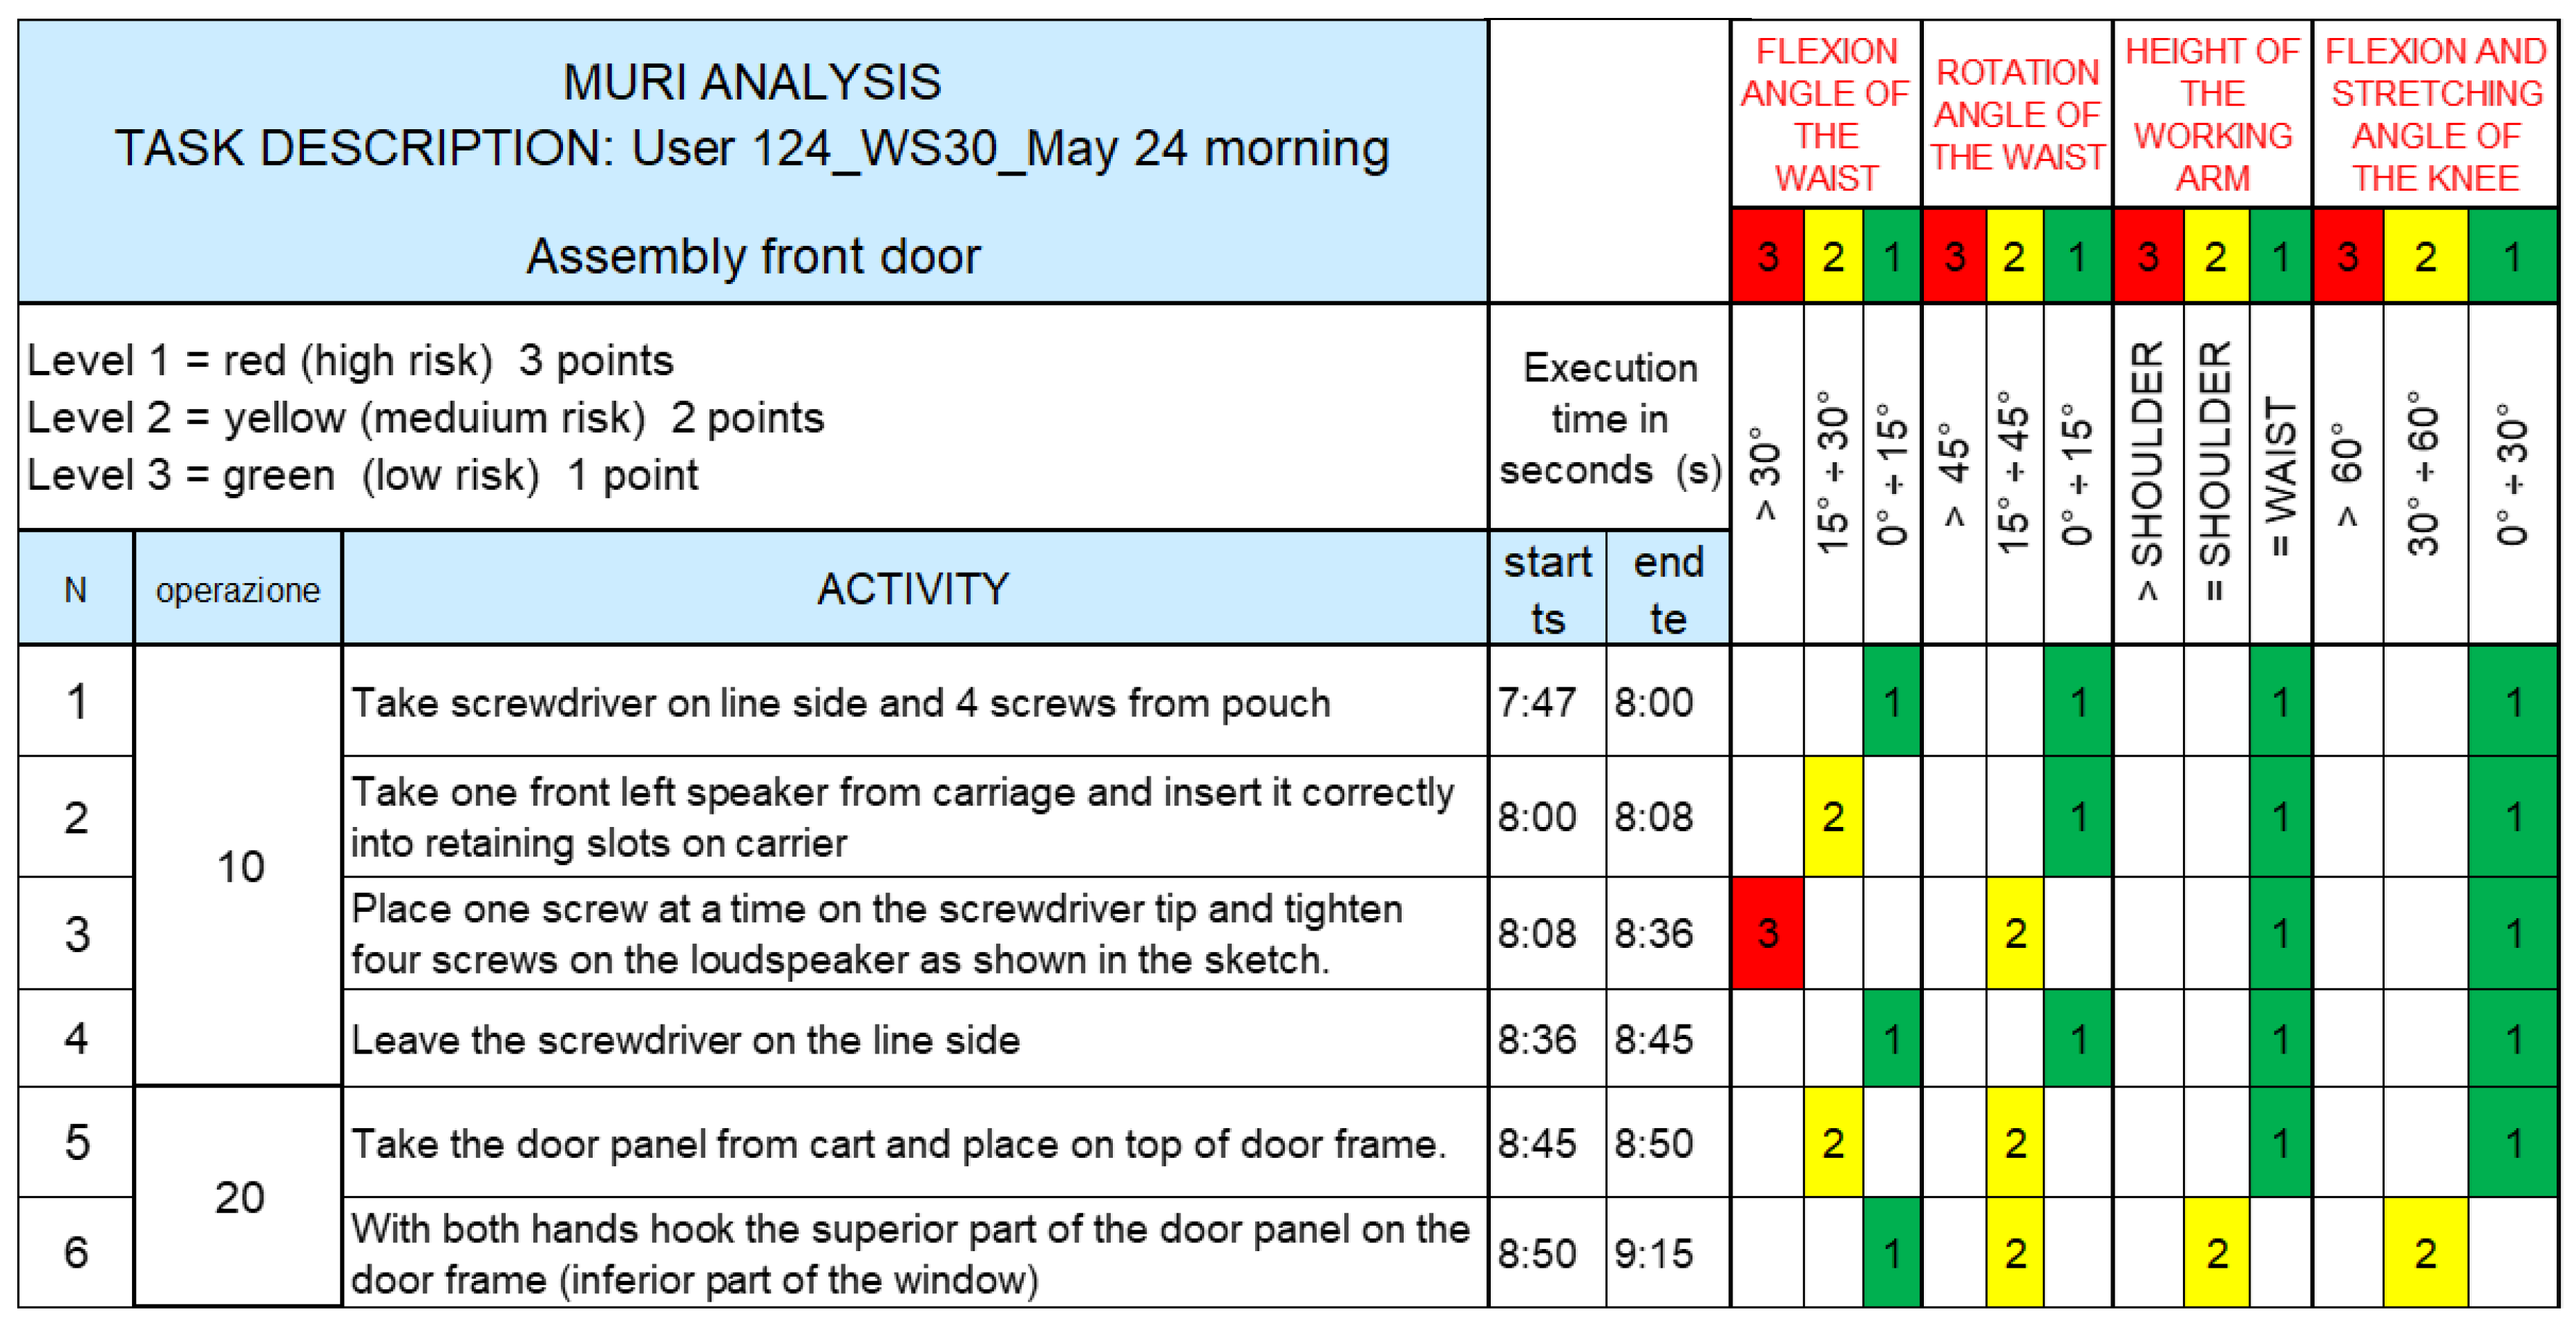
- A new multi-modal dataset is introduced that comprises synchronized visual information of color and depth image sequences and worker heart rate (HR) data acquired using smartwatches during car assembly activities in an actual manufacturing environment. Annotation data is available for the sequences of assembly actions performed by real line workers and the assessment of posture-based physical ergonomics according to the MURI risk analysis method [7,8].
2. Related Work
2.1. Skeleton-Based Action Recognition
2.2. Vision-Based Ergonomic Risk Analysis
2.3. Ergonomics and Cardiovascular Activity
2.4. Datasets
3. Methodology
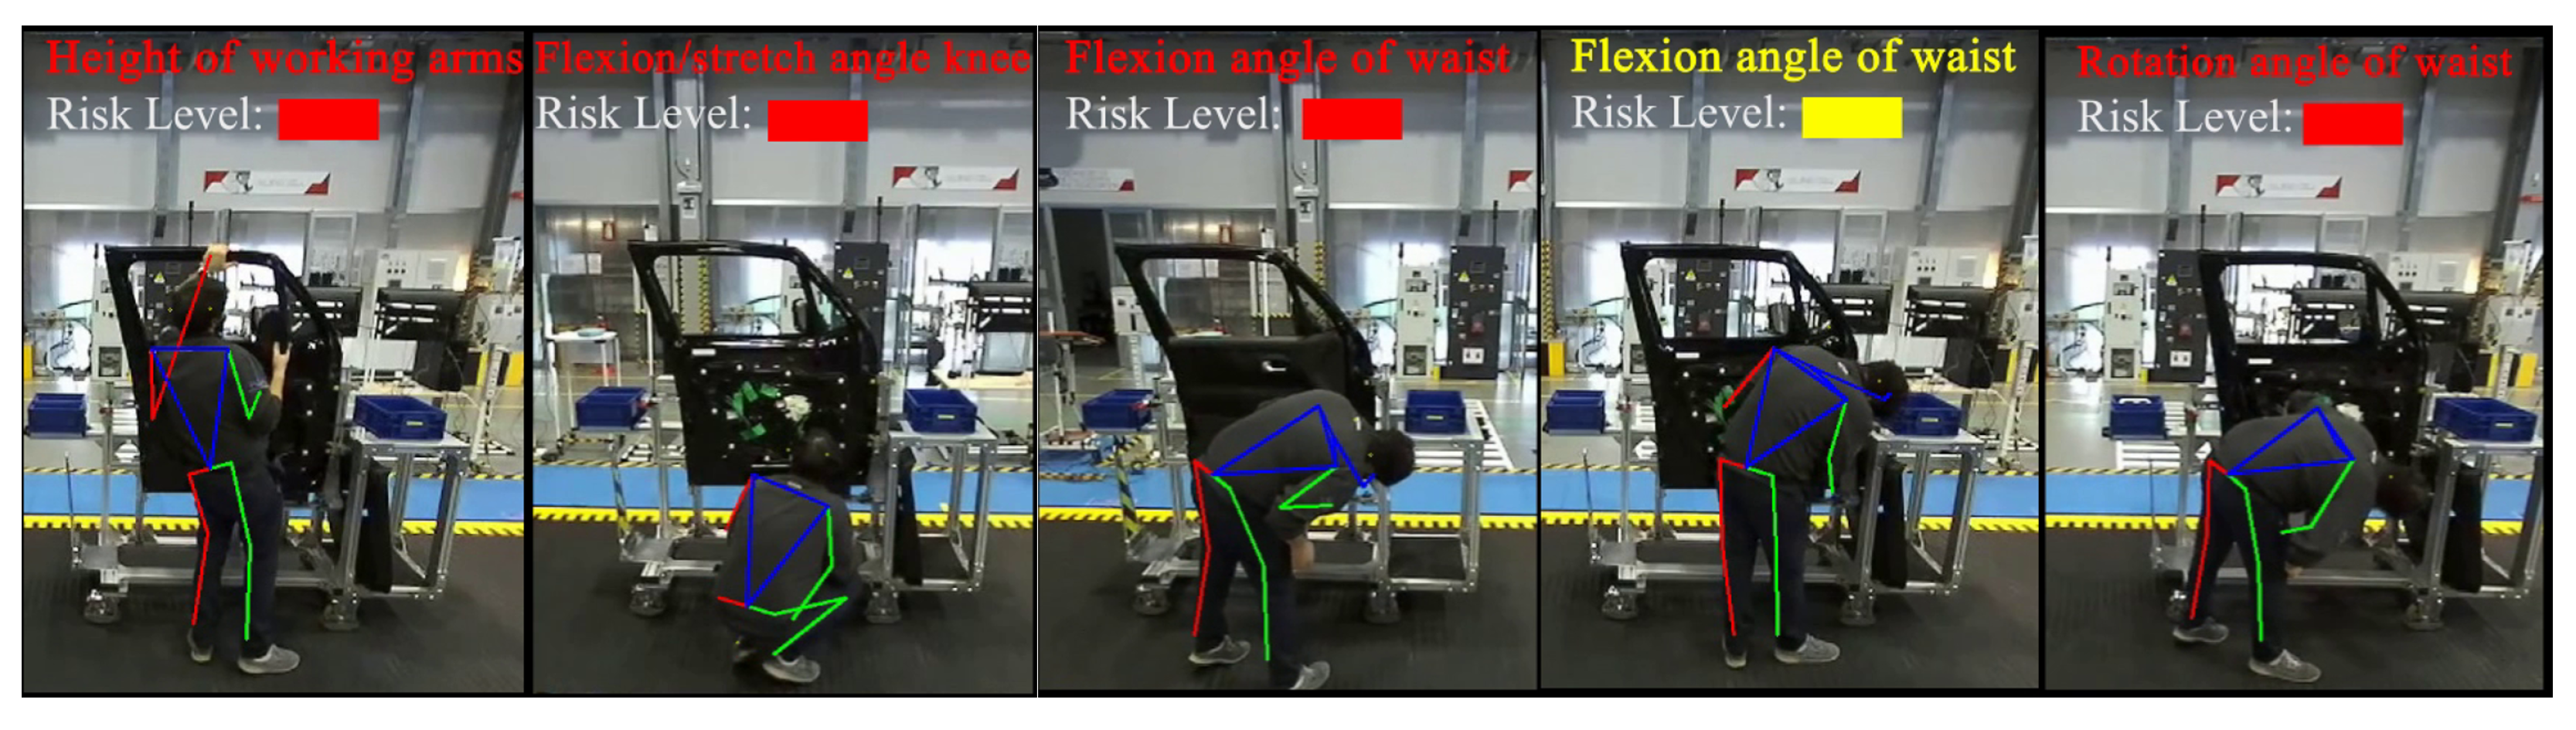
3.1. Detecting Worker Physical Strain
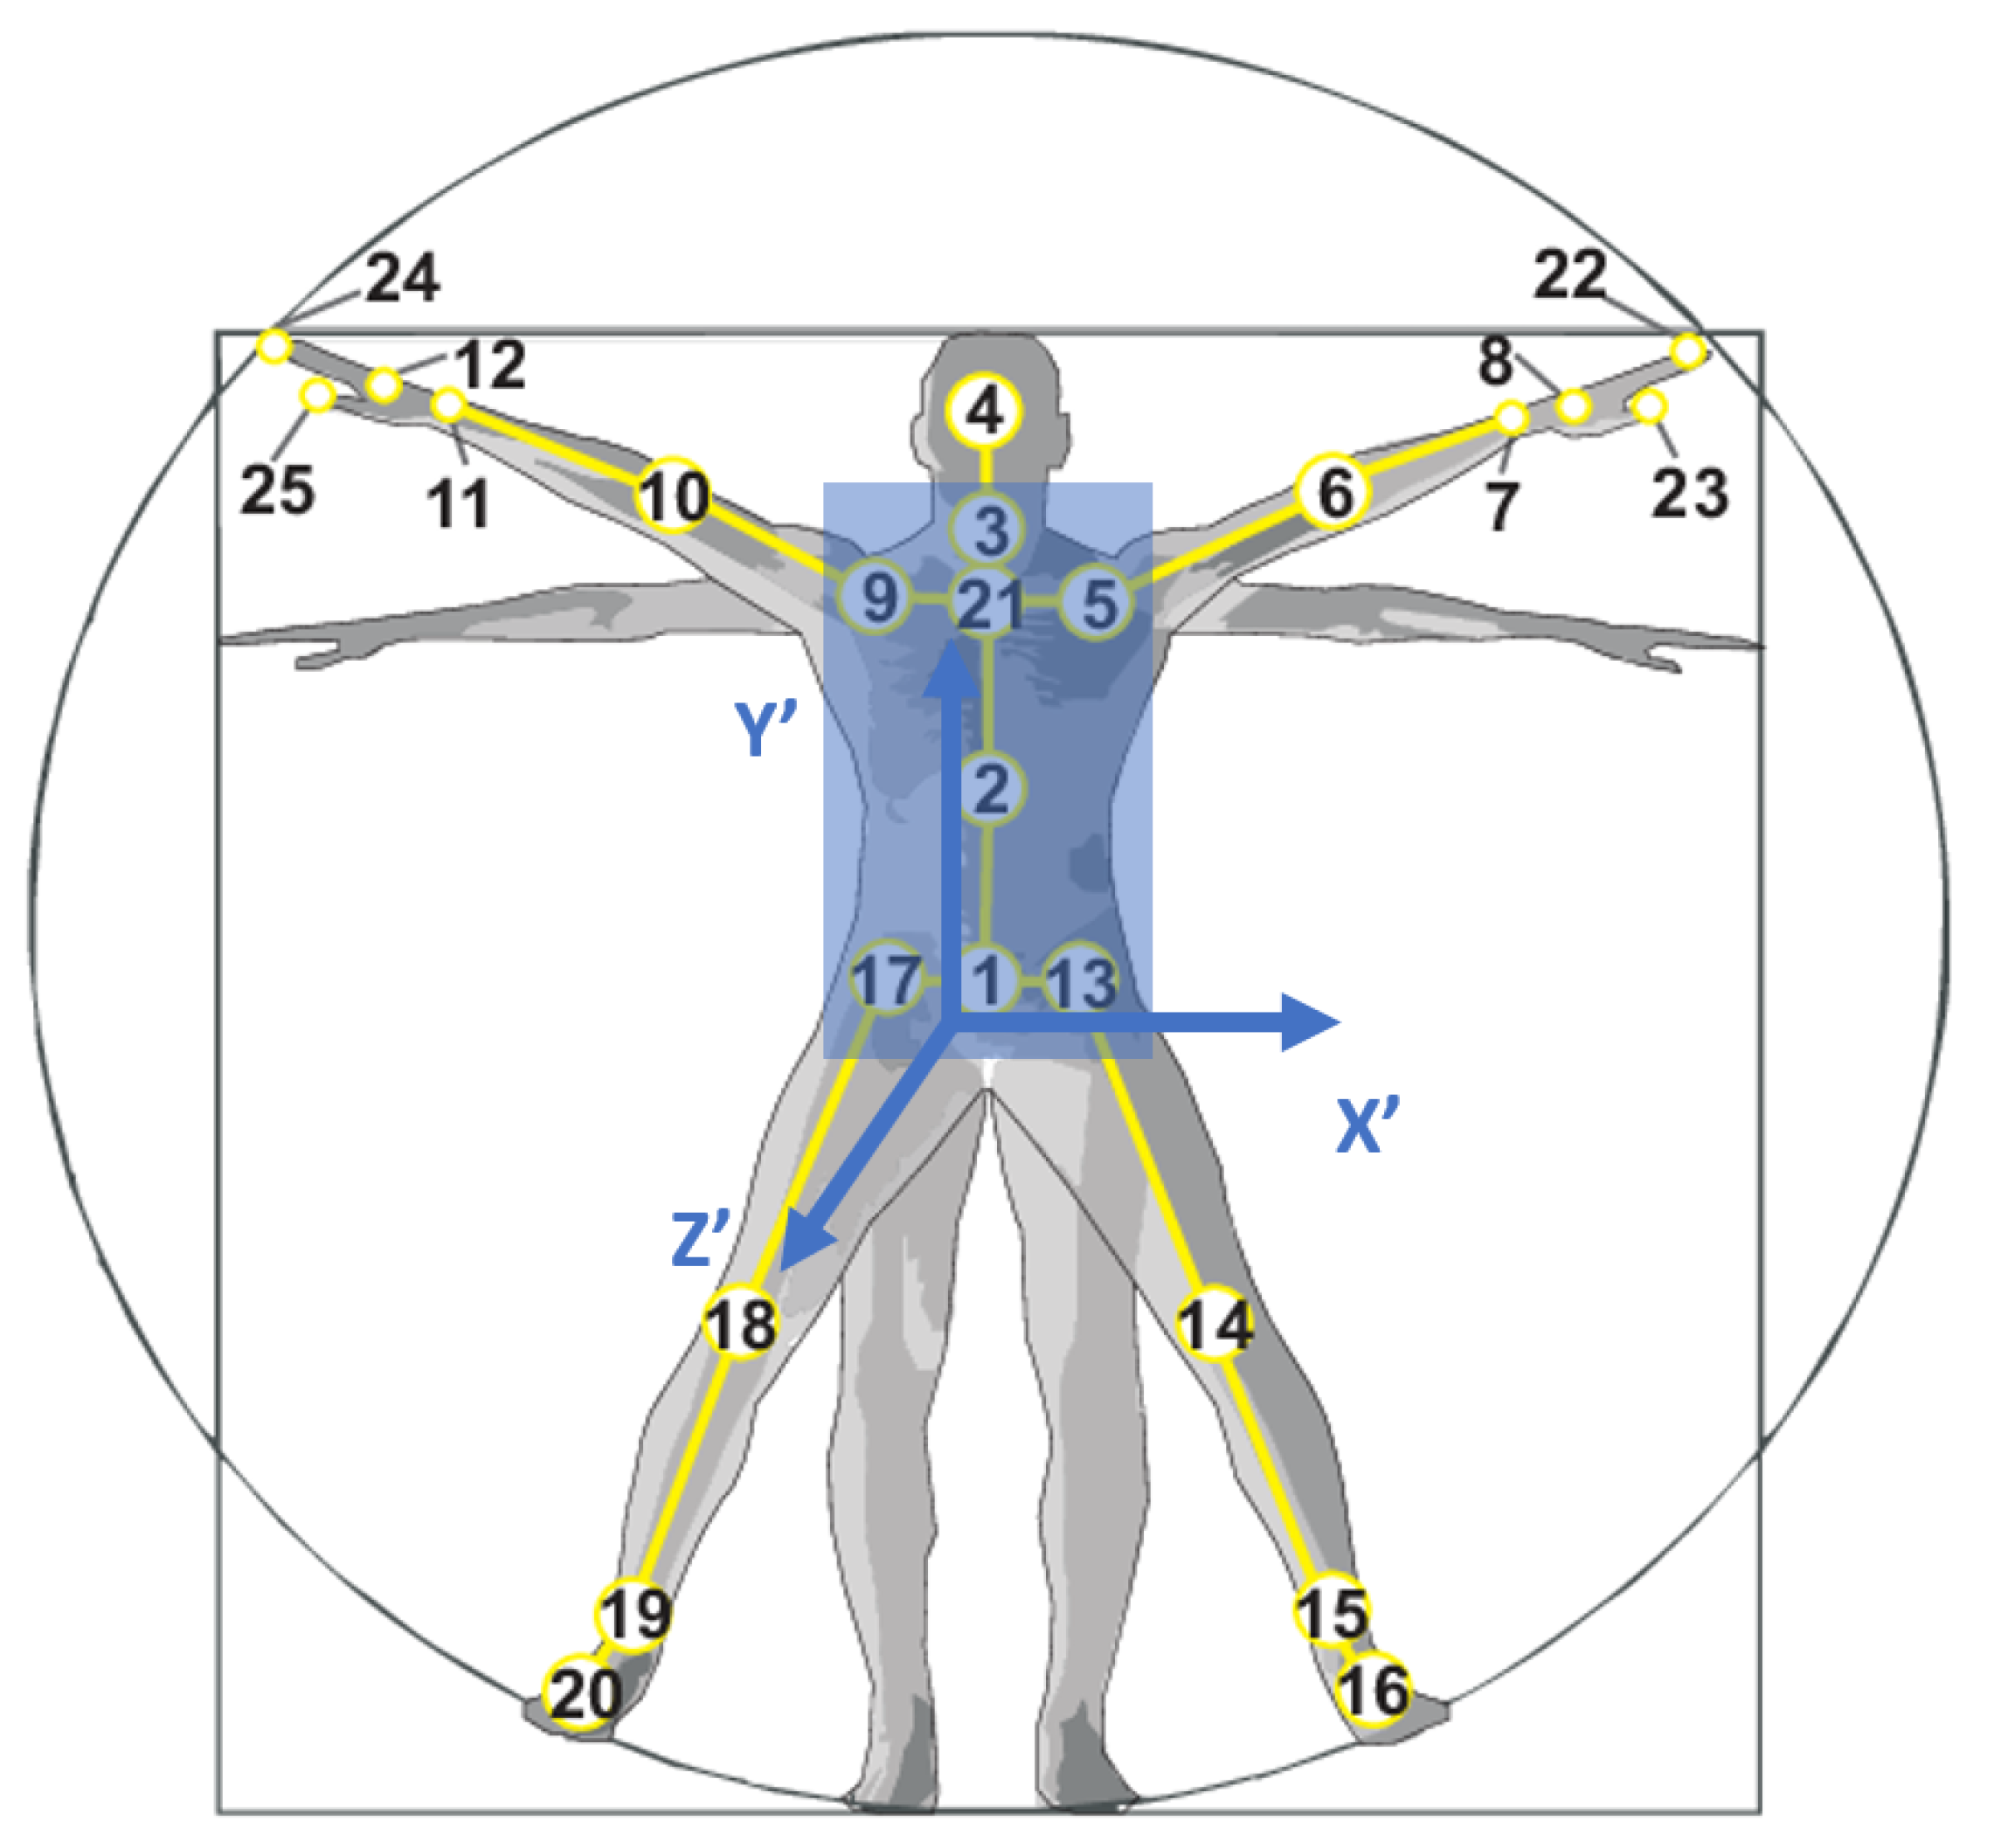
3.1.1. Human Pose Estimation
3.1.2. Spatio-Temporal Modelling of the Human Motion
3.1.3. Classification of Ergonomic Working Postures
3.2. Worker Heart Rate Forecasting
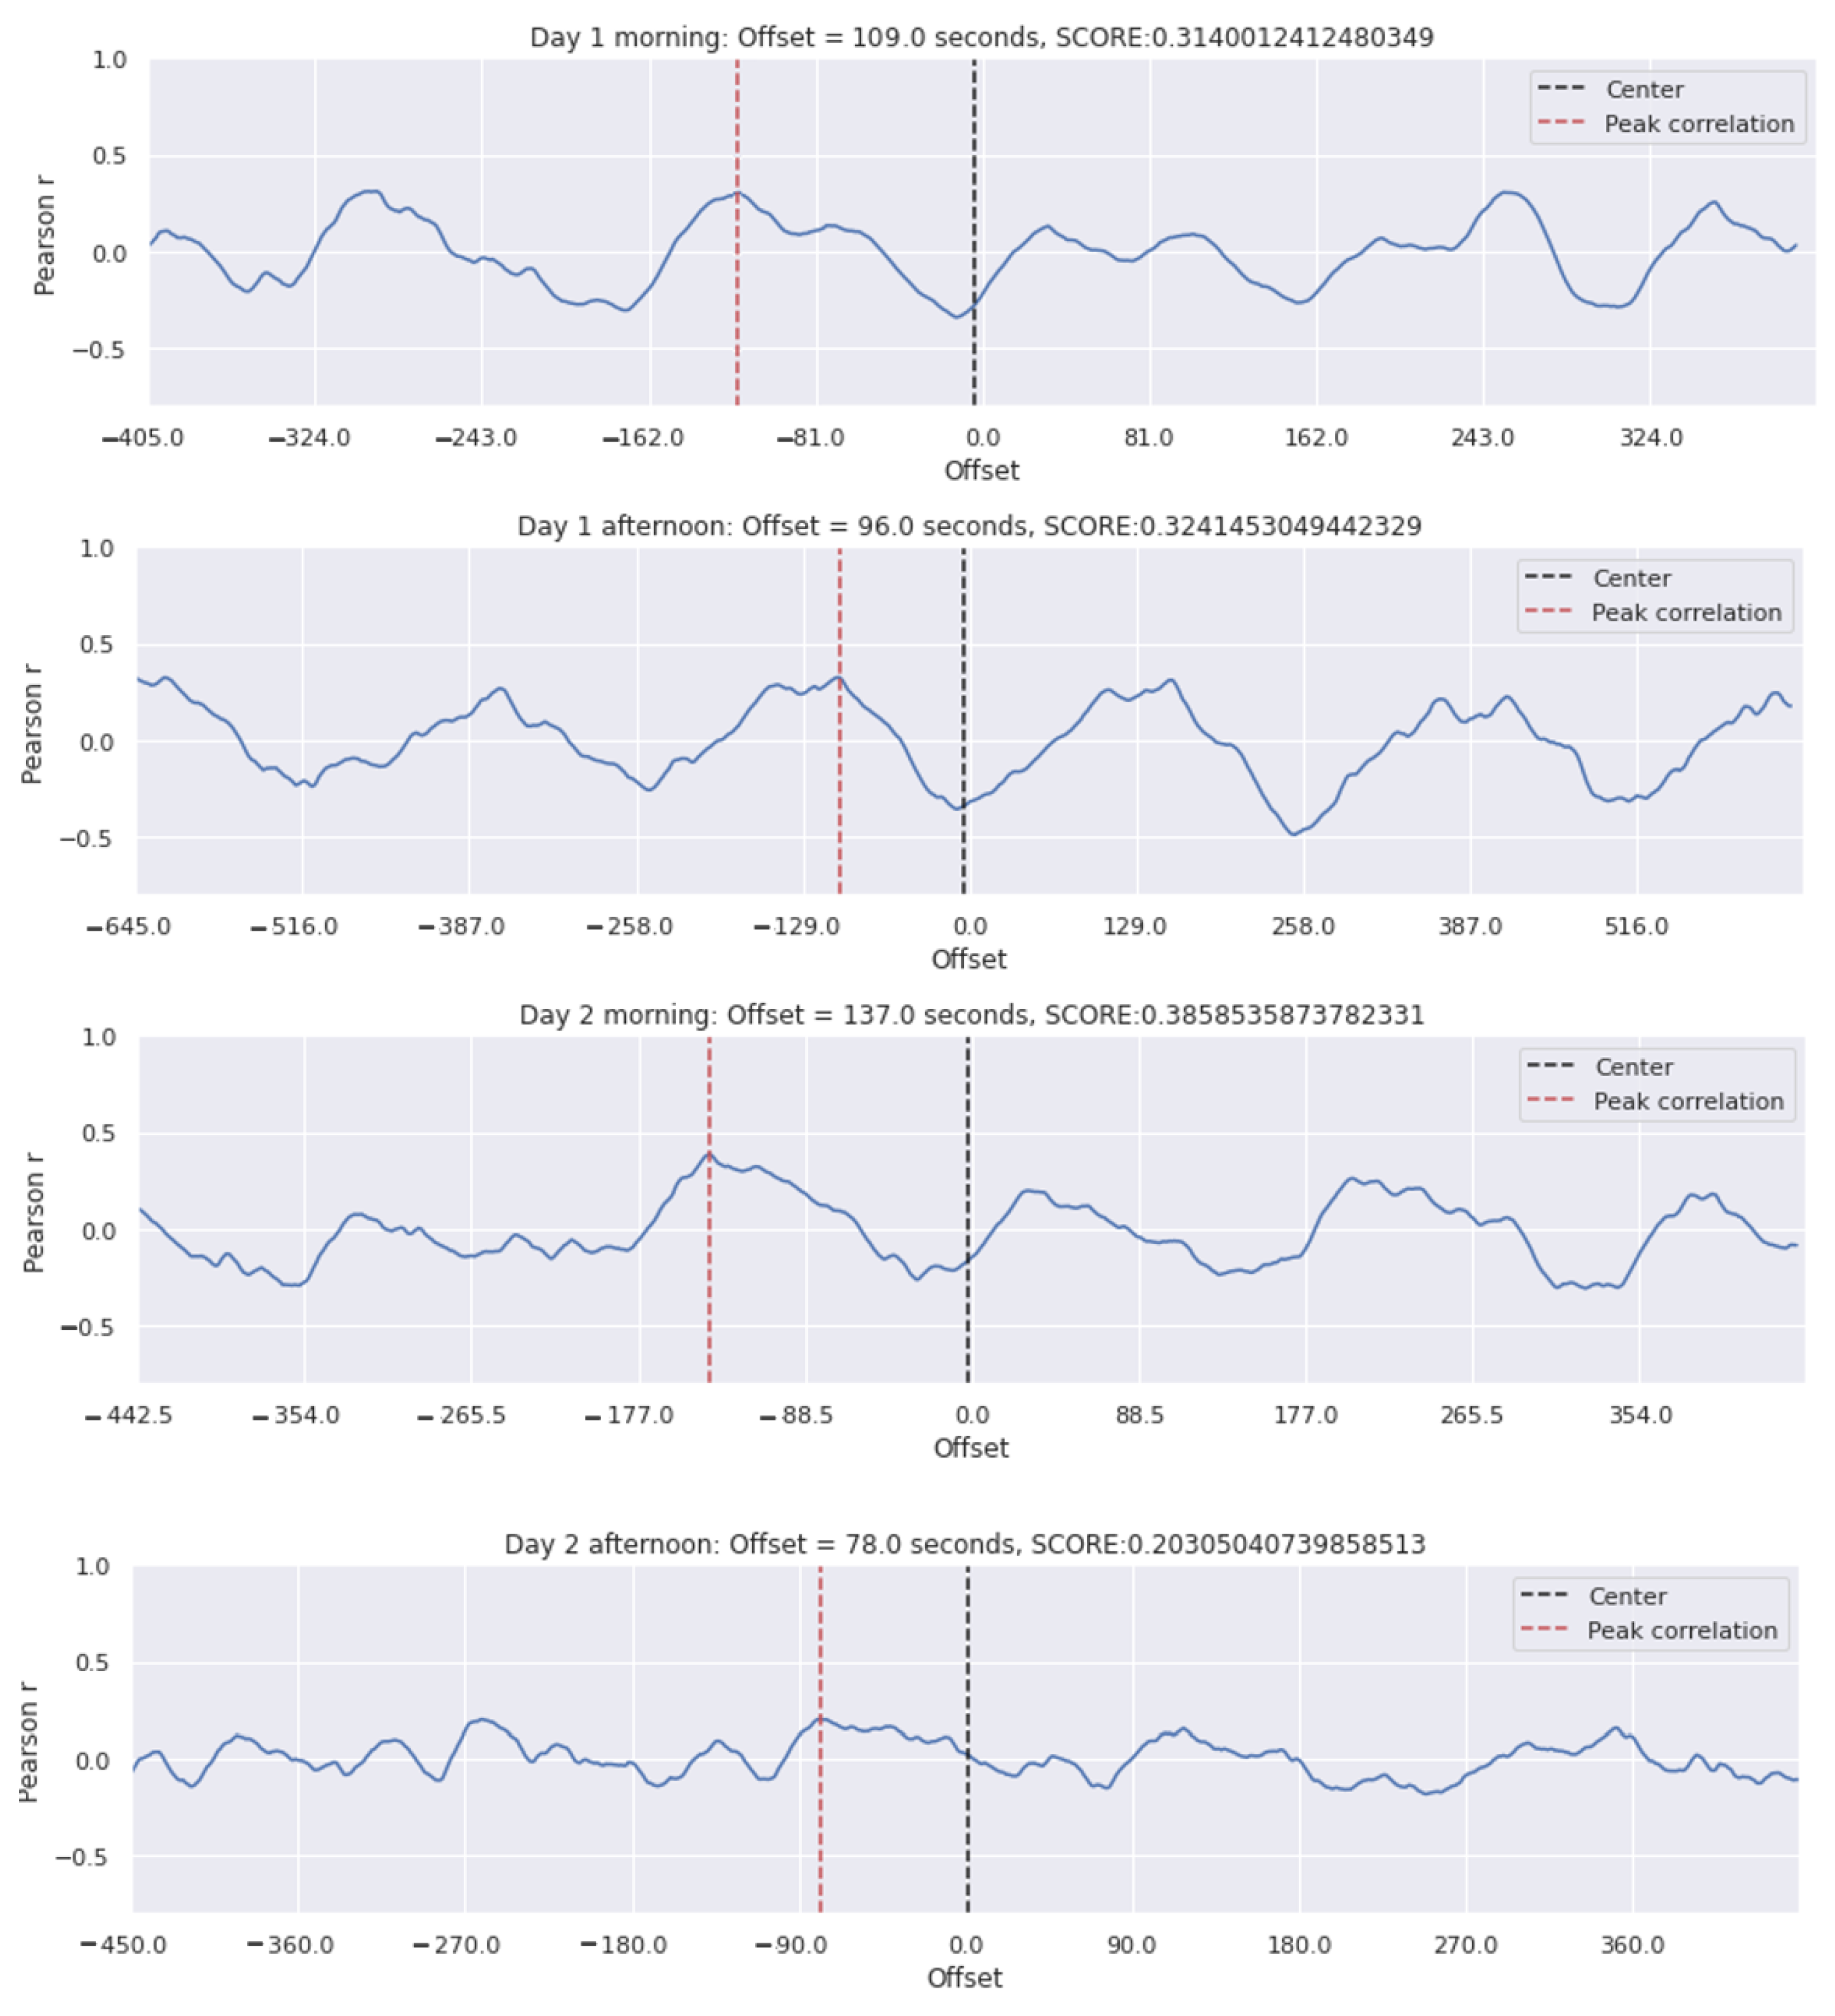
3.3. Associating Worker Heart Rate with Physical Strain
4. Data Acquisition and Experimental Evaluation
4.1. Data Acquisition
4.1.1. Visual Data and Annotations
4.1.2. Cardiovascular Activity Data
4.2. Worker Posture Classification
4.2.1. Rule-Based Classification
4.2.2. Multi-Class SVM-Based Classification
4.2.3. Quantitative Evaluation
4.3. Worker Heart Rate Forecasting
4.4. Integration Aspects
5. Discussion and Conclusions
Author Contributions
Funding
Institutional Review Board Statement
Informed Consent Statement
Data Availability Statement
Acknowledgments
Conflicts of Interest
References
- Vieira, E.R.; Kumar, S. Working postures: A literature review. J. Occup. Rehabil. 2004, 14, 143–159. [Google Scholar] [CrossRef] [PubMed]
- Brito, M.F.; Ramos, A.L.; Carneiro, P.; Gonçalves, M.A. Ergonomic analysis in lean manufacturing and industry 4.0—A systematic review. In Lean Engineering for Global Development; Springer: Cham, Switzerland, 2019; pp. 95–127. [Google Scholar]
- Bao, S.; Howard, N.; Lin, J.H. Are work-related musculoskeletal disorders claims related to risk factors in workplaces of the manufacturing industry? Ann. Work Expo. Health 2020, 64, 152–164. [Google Scholar] [CrossRef] [PubMed]
- Pateraki, M.; Fysarakis, K.; Sakkalis, V.; Spanoudakis, G.; Varlamis, I.; Maniadakis, M.; Lourakis, M.; Ioannidis, S.; Cummins, N.; Schuller, B.; et al. Biosensors and Internet of Things in smart healthcare applications: Challenges and opportunities. In Wearable and Implantable Medical Devices; Elsevier: Amsterdam, The Netherlands, 2020. [Google Scholar]
- Ramaswamy, S. How Micro-Moments Are Changing the Rules. 2015. Available online: https://www.thinkwithgoogle.com/marketing-resources/micro-moments/how-micromoments-are-changing-rules/ (accessed on 16 October 2010).
- Athanassiou, G.; Pateraki, M.; Varlamis, I. Micro-moment-based Interventions for a Personalized Support of Healthy and Sustainable Ageing at Work: Development and Application of a Context-sensitive Recommendation Framework. In Proceedings of the 13th International Joint Conference on Computational Intelligence—SmartWork, Online, 25–27 October 2021; pp. 409–419. [Google Scholar]
- Womack, J.P.; Jones, D.T. Lean thinking—Banish waste and create wealth in your corporation. J. Oper. Res. Soc. 1997, 48, 1148. [Google Scholar] [CrossRef]
- Ciccarelli, M.; Papetti, A.; Cappelletti, F.; Bruzini, A.; Germani, M. Combining World Class Manufacturing system and Industry 4.0 technologies to design ergonomic manufacturing equipment. Int. J. Interact. Des. Manuf. (IJIDeM) 2022, 16, 263–279. [Google Scholar] [CrossRef]
- Yan, S.; Xiong, Y.; Lin, D. Spatial Temporal Graph Convolutional Networks for Skeleton-Based Action Recognition. In Proceedings of the Thirty-Second AAAI Conference on Artificial Intelligence, New Orleans, LA, USA, 2–7 February 2018. [Google Scholar]
- Cuturi, M.; Blondel, M. Soft-DTW: A Differentiable Loss Function for Time-Series. In Proceedings of the 34th International Conference on Machine Learning, Sydney, Australia, 6–11 August 2017; Volume 70, pp. 894–903. [Google Scholar]
- Papoutsakis, K.; Thodoris, P.; Maniadakis, M.; Lourakis, M.; Pateraki, M.; Varlamis, I. Detection of physical strain and fatigue in industrial environments using visual and non-visual sensors. In Proceedings of the 14th PErvasive Technologies Related to Assistive Environments Conference (PETRA 2021), Corfu, Greece, 29 June–2 July 2021; pp. 270–271. [Google Scholar]
- Mueller, M.J.; Maluf, K.S. Tissue adaptation to physical stress: A proposed “Physical Stress Theory” to guide physical therapist practice, education, and research. Phys. Ther. 2002, 82, 383–403. [Google Scholar] [CrossRef]
- Bengio, Y.; Simard, P.; Frasconi, P. Learning long-term dependencies with gradient descent is difficult. IEEE Trans. Neural Netw. 1994, 5, 157–166. [Google Scholar] [CrossRef]
- Hochreiter, S.; Schmidhuber, J. Long short-term memory. Neural Comput. 1997, 9, 1735–1780. [Google Scholar] [CrossRef]
- Liu, J.; Shahroudy, A.; Xu, D.; Wang, G. Spatio-temporal lstm with trust gates for 3d human action recognition. In European Conference on Computer Vision; Springer: Berlin/Heidelberg, Germany, 2016; pp. 816–833. [Google Scholar]
- Liu, J.; Wang, G.; Hu, P.; Duan, L.Y.; Kot, A.C. Global context-aware attention lstm networks for 3d action recognition. In Proceedings of the IEEE Conference on Computer Vision and Pattern Recognition, Honolulu, HI, USA, 21–26 July 2017; pp. 1647–1656. [Google Scholar]
- Zhao, J.; Obonyo, E. Convolutional long short-term memory model for recognizing construction workers’ postures from wearable inertial measurement units. Adv. Eng. Inform. 2020, 46, 101177. [Google Scholar] [CrossRef]
- Rundo, F. Deep LSTM with Dynamic Time Warping Processing Framework: A Novel Advanced Algorithm with Biosensor System for an Efficient Car-Driver Recognition. Electronics 2020, 9, 616. [Google Scholar] [CrossRef] [Green Version]
- Kuschan, J.; Krüger, J. Fatigue recognition in overhead assembly based on a soft robotic exosuit for worker assistance. CIRP Ann. 2021, 70, 9–12. [Google Scholar] [CrossRef]
- Alam, M.A.U. Activity-Aware Deep Cognitive Fatigue Assessment using Wearables. In Proceedings of the 2021 43rd Annual International Conference of the IEEE Engineering in Medicine & Biology Society (EMBC), Virtual, 1–5 November 2021; pp. 7433–7436. [Google Scholar]
- LeCun, Y.; Bengio, Y.; Hinton, G. Deep learning. Nature 2015, 521, 436–444. [Google Scholar] [CrossRef] [PubMed]
- Li, M.; Chen, S.; Chen, X.; Zhang, Y.; Wang, Y.; Tian, Q. Symbiotic graph neural networks for 3D skeleton-based human action recognition and motion prediction. IEEE Trans. Pattern Anal. Mach. Intell. 2021. [Google Scholar] [CrossRef]
- Lei, Q.; Du, J.X.; Zhang, H.; Ye, S.; Chen, D. A Survey of Vision-Based Human Action Evaluation Methods. Sensors 2019, 19, 4129. [Google Scholar] [CrossRef] [PubMed] [Green Version]
- Qammaz, A.; Argyros, A.A. Occlusion-tolerant and personalized 3D human pose estimation in RGB images. In Proceedings of the IEEE International Conference on Pattern Recognition (ICPR 2020), Milan, Italy, 10–15 January 2021. [Google Scholar]
- Cao, Z.; Hidalgo, G.; Simon, T.; Wei, S.E.; Sheikh, Y. OpenPose: Realtime Multi-Person 2D Pose Estimation Using Part Affinity Fields. IEEE Trans. Pattern Anal. Mach. Intell. 2021, 43, 172–186. [Google Scholar] [CrossRef] [Green Version]
- Hussein, M.E.; Torki, M.; Gowayyed, M.A.; El-Saban, M. Human action recognition using a temporal hierarchy of covariance descriptors on 3d joint locations. In Proceedings of the Twenty-Third International Joint Conference on Artificial Intelligence, Beijing, China, 3–9 August 2013. [Google Scholar]
- Vemulapalli, R.; Arrate, F.; Chellappa, R. Human action recognition by representing 3d skeletons as points in a lie group. In Proceedings of the IEEE Conference on Computer Vision and Pattern Recognition, Columbus, OH, USA, 23 June 2014; pp. 588–595. [Google Scholar]
- Rahmani, H.; Mahmood, A.; Huynh, D.Q.; Mian, A. Real time action recognition using histograms of depth gradients and random decision forests. In Proceedings of the IEEE Winter Conference on Applications of Computer Vision, Steamboat Springs, CO, USA, 24–26 March 2014; pp. 626–633. [Google Scholar]
- Ma, C.Y.; Kadav, A.; Melvin, I.; Kira, Z.; AlRegib, G.; Graf, H.P. Attend and interact: Higher-order object interactions for video understanding. In Proceedings of the IEEE Conference on Computer Vision and Pattern Recognition, Salt Lake City, UT, USA, 18–23 June 2018; pp. 6790–6800. [Google Scholar]
- Heidari, N.; Iosifidis, A. Temporal attention-augmented graph convolutional network for efficient skeleton-based human action recognition. In Proceedings of the 2020 25th International Conference on Pattern Recognition (ICPR), Milan, Italy, 10–15 January 2021; pp. 7907–7914. [Google Scholar]
- Cheng, K.; Zhang, Y.; He, X.; Chen, W.; Cheng, J.; Lu, H. Skeleton-Based Action Recognition with Shift Graph Convolutional Network. In Proceedings of the IEEE/CVF Conference on Computer Vision and Pattern Recognition (CVPR), Virtual, 14–19 June 2020. [Google Scholar]
- Kim, T.S.; Reiter, A. Interpretable 3D human action analysis with temporal convolutional networks. In Proceedings of the 2017 IEEE Conference on Computer Vision and Pattern Recognition Workshops (CVPRW), Honolulu, HI, USA, 21–26 July 2017; pp. 1623–1631. [Google Scholar]
- Zhang, P.; Lan, C.; Xing, J.; Zeng, W.; Xue, J.; Zheng, N. View adaptive recurrent neural networks for high performance human action recognition from skeleton data. In Proceedings of the IEEE International Conference on Computer Vision, Venice, Italy, 22–29 October 2017; pp. 2117–2126. [Google Scholar]
- Zhang, S.; Liu, X.; Xiao, J. On Geometric Features for Skeleton-Based Action Recognition Using Multilayer LSTM Networks. In Proceedings of the 2017 IEEE Winter Conference on Applications of Computer Vision (WACV), Santa Rosa, CA, USA, 24–31 March 2017; pp. 148–157. [Google Scholar]
- Zhang, C.; Gupta, A.; Zisserman, A. Temporal Query Networks for Fine-grained Video Understanding. In Proceedings of the IEEE/CVF Conference on Computer Vision and Pattern Recognition, Nashville, TN, USA, 20–25 June 2021; pp. 4486–4496. [Google Scholar]
- Girdhar, R.; Carreira, J.; Doersch, C.; Zisserman, A. Video action transformer network. In Proceedings of the IEEE/CVF Conference on Computer Vision and Pattern Recognition, Long Beach, CA, USA, 15–20 June 2019; pp. 244–253. [Google Scholar]
- Dosovitskiy, A.; Beyer, L.; Kolesnikov, A.; Weissenborn, D.; Zhai, X.; Unterthiner, T.; Dehghani, M.; Minderer, M.; Heigold, G.; Gelly, S.; et al. An image is worth 16 × 16 words: Transformers for image recognition at scale. arXiv 2020, arXiv:2010.11929. [Google Scholar]
- Vaswani, A.; Shazeer, N.; Parmar, N.; Uszkoreit, J.; Jones, L.; Gomez, A.N.; Kaiser, L.; Polosukhin, I. Attention is all you need. arXiv 2017, arXiv:1706.03762. [Google Scholar]
- Plizzari, C.; Cannici, M.; Matteucci, M. Skeleton-based action recognition via spatial and temporal transformer networks. Comput. Vis. Image Underst. 2021, 208–209, 103219. [Google Scholar] [CrossRef]
- Wang, Y.; Ajaykumar, G.; Huang, C.M. See what i see: Enabling user-centric robotic assistance using first-person demonstrations. In Proceedings of the 2020 ACM/IEEE International Conference on Human-Robot Interaction, Cambridge, UK, 23–26 March 2020; pp. 639–648. [Google Scholar]
- Cramer, M.; Cramer, J.; Kellens, K.; Demeester, E. Towards robust intention estimation based on object affordance enabling natural human-robot collaboration in assembly tasks. Procedia CIRP 2018, 78, 255–260. [Google Scholar] [CrossRef]
- Colim, A.; Faria, C.; Cunha, J.; Oliveira, J.; Sousa, N.; Rocha, L.A. Physical Ergonomic Improvement and Safe Design of an Assembly Workstation through Collaborative Robotics. Safety 2021, 7, 14. [Google Scholar] [CrossRef]
- Kim, W.; Lee, J.; Peternel, L.; Tsagarakis, N.; Ajoudani, A. Anticipatory Robot Assistance for the Prevention of Human Static Joint Overloading in Human–Robot Collaboration. IEEE Robot. Autom. Lett. 2018, 3, 68–75. [Google Scholar] [CrossRef]
- Kim, W.; Lee, J.; Tsagarakis, N.; Ajoudani, A. A real-time and reduced-complexity approach to the detection and monitoring of static joint overloading in humans. In Proceedings of the 2017 International Conference on Rehabilitation Robotics (ICORR), London, UK, 17–20 July 2017; pp. 828–834. [Google Scholar]
- Fukuda, K.; Ramirez-Alpizar, I.G.; Yamanobe, N.; Petit, D.; Nagata, K.; Harada, K. Recognition of assembly tasks based on the actions associated to the manipulated objects. In Proceedings of the 2019 IEEE/SICE International Symposium on System Integration (SII), Paris, France, 14–16 January 2019; pp. 193–198. [Google Scholar]
- Kahatapitiya, K.; Ryoo, M.S. Coarse-Fine Networks for Temporal Activity Detection in Videos. In Proceedings of the IEEE/CVF Conference on Computer Vision and Pattern Recognition (CVPR), Nashville, TN, USA, 20–25 June 2021; pp. 8385–8394. [Google Scholar]
- Feichtenhofer, C.; Fan, H.; Malik, J.; He, K. SlowFast Networks for Video Recognition. In Proceedings of the 2019 IEEE/CVF International Conference on Computer Vision (ICCV), Seoul, Korea, 27–28 October 2019; pp. 6201–6210. [Google Scholar]
- Roitberg, A.; Somani, N.; Perzylo, A.; Rickert, M.; Knoll, A. Multimodal Human Activity Recognition for Industrial Manufacturing Processes in Robotic Workcells. In Proceedings of the 2015 ACM on International Conference on Multimodal Interaction, Seattle, WA, USA, 9–13 November 2015; Association for Computing Machinery: New York, NY, USA, 2015; pp. 259–266. [Google Scholar]
- Jones, J.D.; Cortesa, C.; Shelton, A.; Landau, B.; Khudanpur, S.; Hager, G.D. Fine-Grained Activity Recognition for Assembly Videos. IEEE Robot. Autom. Lett. 2021, 6, 3728–3735. [Google Scholar] [CrossRef]
- Yang, Y.; Aloimonos, Y.; Fermüller, C.; Aksoy, E.E. Learning the Semantics of Manipulation Action. In Proceedings of the 53rd Annual Meeting of the Association for Computational Linguistics and the 7th International Joint Conference on Natural Language Processing; Long Papers; Association for Computational Linguistics: Beijing, China, 2015; Volume 1, pp. 676–686. [Google Scholar]
- Jones, J.; Hager, G.D.; Khudanpur, S. Toward computer vision systems that understand real-world assembly processes. In Proceedings of the 2019 IEEE Winter Conference on Applications of Computer Vision (WACV), Waikoloa Village, HI, USA, 7–11 January 2019; pp. 426–434. [Google Scholar]
- Gudmundsson, J.; Seybold, M.P.; Pfeifer, J. Exploring Sub-skeleton Trajectories for Interpretable Recognition of Sign Language. In Proceedings of the 27th International Conference on Database Systems for Advanced Applications (DASFAA-2022), Hyderabad, India, 11–14 April 2022. [Google Scholar]
- Parsa, B.; Samani, E.U.; Hendrix, R.; Devine, C.; Singh, S.M.; Devasia, S.; Banerjee, A.G. Toward ergonomic risk prediction via segmentation of indoor object manipulation actions using spatiotemporal convolutional networks. IEEE Robot. Autom. Lett. 2019, 4, 3153–3160. [Google Scholar] [CrossRef] [Green Version]
- McAtamney, L.; Hignett, S. Rapid entire body assessment. In Handbook of Human Factors and Ergonomics Methods; CRC Press: Boca Raton, FL, USA, 2004; pp. 97–108. [Google Scholar]
- Nguyen, T.D.; Kleinsorge, M.; Krüger, J. ErgoAssist: An assistance system to maintain ergonomie guidelines at workplaces. In Proceedings of the 2014 IEEE Emerging Technology and Factory Automation (ETFA), Barcelona, Spain, 16–19 September 2014; pp. 1–4. [Google Scholar]
- Yan, X.; Li, H.; Wang, C.; Seo, J.; Zhang, H.; Wang, H. Development of ergonomic posture recognition technique based on 2D ordinary camera for construction hazard prevention through view-invariant features in 2D skeleton motion. Adv. Eng. Inform. 2017, 34, 152–163. [Google Scholar] [CrossRef]
- Li, C.; Lee, S. Computer Vision Techniques for Worker Motion Analysis to Reduce Musculoskeletal Disorders in Construction. In Computing in Civil Engineering; American Society of Civil Engineers: Miami, FL, USA, 2011; pp. 380–387. [Google Scholar]
- Shafti, A.; Ataka, A.; Lazpita, B.U.; Shiva, A.; Wurdemann, H.; Althoefer, K. Real-time Robot-assisted Ergonomics. In Proceedings of the 2019 International Conference on Robotics and Automation (ICRA), Montreal, QC, Canada, 20–24 May 2019; pp. 1975–1981. [Google Scholar]
- Mehrizi, R.; Peng, X.; Tang, Z.; Xu, X.; Metaxas, D.N.; Li, K. Toward Marker-Free 3D Pose Estimation in Lifting: A Deep Multi-View Solution. In Proceedings of the 2018 13th IEEE International Conference on Automatic Face & Gesture Recognition (FG 2018), Xi’an, China, 15–19 May 2018; pp. 485–491. [Google Scholar]
- Plantard, P.; Shum, H.; Pierres, A.S.; Multon, F. Validation of an ergonomic assessment method using Kinect data in real workplace conditions. Appl. Ergon. 2016, 65, 562–569. [Google Scholar] [CrossRef]
- Mcatamney, L.; Corlett, E.N. RULA: A survey method for the investigation of work-related upper limb disorders. Appl. Ergon. 1993, 24, 91–99. [Google Scholar] [CrossRef]
- Kim, W.; Lorenzini, M.; Balatti, P.; Nguyen, P.D.; Pattacini, U.; Tikhanoff, V.; Peternel, L.; Fantacci, C.; Natale, L.; Metta, G.; et al. Adaptable Workstations for Human-Robot Collaboration: A Reconfigurable Framework for Improving Worker Ergonomics and Productivity. IEEE Robot. Autom. Mag. 2019, 26, 14–26. [Google Scholar] [CrossRef] [Green Version]
- Parsa, B.; Narayanan, A.L.; Dariush, B. Spatio-Temporal Pyramid Graph Convolutions for Human Action Recognition and Postural Assessment. In Proceedings of the Proceedings of the IEEE/CVF Winter Conference on Applications of Computer Vision (WACV), Snowmass Village, CO, USA, 1–5 March 2020. [Google Scholar]
- Parsa, B.; Banerjee, A.G. A Multi-Task Learning Approach for Human Activity Segmentation and Ergonomics Risk Assessment. In Proceedings of the IEEE/CVF Winter Conference on Applications of Computer Vision (WACV), Waikoloa, HI, USA, 5–9 January 2021; pp. 2352–2362. [Google Scholar]
- Konstantinidis, D.; Dimitropoulos, K.; Daras, P. Towards Real-time Generalized Ergonomic Risk Assessment for the Prevention of Musculoskeletal Disorders. In Proceedings of the 14th ACM International Conference on Pervasive Technologies Related to Assistive Environments Conference (PETRA), Virtual, 29 June–1 July 2021. [Google Scholar]
- Wu, H.C.; Wang, M.J.J. Relationship between maximum acceptable work time and physical workload. Ergonomics 2002, 45, 280–289. [Google Scholar] [CrossRef]
- Velásquez, J.; Briceno, L.; Ortiz, L.; Solarte, S.; Agredo, R. Maximum Acceptable Work Time for the Upper Limbs Task and Lower Limbs Task. Procedia Manuf. 2015, 3, 4584–4590. [Google Scholar] [CrossRef]
- Burger, G.C.E. Heart Rate and the Concept of Circulatory Load. Ergonomics 1969, 12, 857–864. [Google Scholar] [CrossRef]
- Kamalakannan, B.; Groves, W.; Freivalds, A. Predictive Models for Estimating Metabolic Workload based on Heart Rate and Physical Characteristics. J. SH&E Res. 2007, 4, 1. [Google Scholar]
- Sgarbossa, F.; Calzavara, M.; Persona, A.; Visentin, V. A device to monitor fatigue level in order-picking. Ind. Manag. Data Syst. 2018, 118, 714–727. [Google Scholar]
- Widodo, L.; Daywin, F.; Nadya, M. Ergonomic risk and work load analysis on material handling of PT. XYZ. In Proceedings of the IOP Conference Series: Materials Science and Engineering, 11th ISIEM (International Seminar on Industrial Engineering & Management), Technology and Innovation Challenges Towards Industry 4.0 Era, Makasar, South Sulawesi, Indonesia, 27–29 November 2018. [Google Scholar]
- Samani, A.; Holtermann, A.; Søgaard, K.; Holtermann, A.; Madeleine, P. Following ergonomics guidelines decreases physical and cardiovascular workload during cleaning tasks. Ergonomics 2012, 55, 295–307. [Google Scholar] [CrossRef] [PubMed]
- Ye, T.; Pan, X. Fatigue, Cognitive Performance, and Subjective Recovery Time Estimation in High-Intensity Work. IIE Trans. Occup. Ergon. Hum. Factors 2016, 4, 141–150. [Google Scholar] [CrossRef]
- Hidalgo-Muñoz, A.R.; Mouratille, D.; Matton, N.; Causse, M.; Rouillard, Y.; El-Yagoubi, R. Cardiovascular correlates of emotional state, cognitive workload and time-on-task effect during a realistic flight simulation. Int. J. Psychophysiol. 2018, 128, 62–69. [Google Scholar] [CrossRef] [Green Version]
- Andriluka, M.; Pishchulin, L.; Gehler, P.; Schiele, B. 2D Human Pose Estimation: New Benchmark and State of the Art Analysis. In Proceedings of the 2014 IEEE Conference on Computer Vision and Pattern Recognition, Columbus, OH, USA, 23–28 June 2014; pp. 3686–3693. [Google Scholar]
- Gong, W.; Zhang, X.; Gonzàlez, J.; Sobral, A.; Bouwmans, T.; Tu, C.; Zahzah, E. Human pose estimation from monocular images: A comprehensive survey. Sensors 2016, 16, 1966. [Google Scholar] [CrossRef]
- Jhuang, H.; Gall, J.; Zuffi, S.; Schmid, C.; Black, M.J. Towards understanding action recognition. In Proceedings of the IEEE International Conference on Computer Vision, Sydney, Australia, 1–8 December 2013; pp. 3192–3199. [Google Scholar]
- Liu, J.; Shahroudy, A.; Perez, M.; Wang, G.; Duan, L.Y.; Kot, A.C. NTU RGB+D 120: A Large-Scale Benchmark for 3D Human Activity Understanding. IEEE Trans. Pattern Anal. Mach. Intell. 2019, 42, 2684–2701. [Google Scholar] [CrossRef] [Green Version]
- Carreira, J.; Zisserman, A. Quo vadis, action recognition? A new model and the kinetics dataset. In Proceedings of the IEEE Conference on Computer Vision and Pattern Recognition, Honolulu, HI, USA, 21–26 July 2017; pp. 6299–6308. [Google Scholar]
- Punnakkal, A.R.; Chandrasekaran, A.; Athanasiou, N.; Quiros-Ramirez, A.; Black, M.J. BABEL: Bodies, Action and Behavior with English Labels. In Proceedings of the IEEE/CVF Conference on Computer Vision and Pattern Recognition (CVPR), Nashville, TN, USA, 20–25 June 2021; pp. 722–731. [Google Scholar]
- Shao, D.; Zhao, Y.; Dai, B.; Lin, D. FineGym: A Hierarchical Video Dataset for Fine-grained Action Understanding. In Proceedings of the IEEE Conference on Computer Vision and Pattern Recognition (CVPR), Seattle, WA, USA, 14–19 June 2020. [Google Scholar]
- Tenorth, M.; Bandouch, J.; Beetz, M. The TUM Kitchen Data Set of everyday manipulation activities for motion tracking and action recognition. In Proceedings of the 2009 IEEE 12th International Conference on Computer Vision Workshops, ICCV Workshops, Kyoto, Japan, 27 September–4 October 2009; pp. 1089–1096. [Google Scholar]
- Hewamalage, H.; Bergmeir, C.; Bandara, K. Recurrent neural networks for time series forecasting: Current status and future directions. Int. J. Forecast. 2021, 37, 388–427. [Google Scholar] [CrossRef]
- Klambauer, G.; Unterthiner, T.; Mayr, A.; Hochreiter, S. Self-Normalizing Neural Networks. In Proceedings of the 31st International Conference on Neural Information Processing Systems, Long Beach, CA, USA, 4–9 December 2017; Curran Associates Inc.: Red Hook, NY, USA, 2017; pp. 972–981. [Google Scholar]
- Meredith, M.; Maddock, S. Motion Capture File Formats Explained; Department of Computer Science, University of Sheffield: Sheffield, UK, 2001; Volume 211, pp. 241–244. [Google Scholar]
- Raptis, M.; Kirovski, D.; Hoppe, H. Real-Time Classification of Dance Gestures from Skeleton Animation. In Proceedings of the 2011 ACM SIGGRAPH/Eurographics Symposium on Computer Animation, Vancouver, BC, Canada, 5–7 August 2011; Association for Computing Machinery: New York, NY, USA, 2011; pp. 147–156. [Google Scholar]
- Theodorakopoulos, I.; Kastaniotis, D.; Economou, G.; Fotopoulos, S. Pose-based human action recognition via sparse representation in dissimilarity space. J. Vis. Commun. Image Represent. 2014, 25, 12–23. [Google Scholar] [CrossRef]
- Schonberger, R.J. World Class Manufacturing; Simon and Schuster: New York, NY, USA, 2008. [Google Scholar]
- Sakoe, H.; Chiba, S. Dynamic programming algorithm optimization for spoken word recognition. IEEE ICASSP 1978, 26, 43–49. [Google Scholar] [CrossRef] [Green Version]
- Shou, Z.; Pan, J.; Chan, J.; Miyazawa, K.; Mansour, H.; Vetro, A.; Nieto, X.G.; Chang, S.F. Online action detection in untrimmed, streaming videos-modeling and evaluation. In Proceedings of the European Conference on Computer Vision, Munich, Germany, 8–14 September 2018; Volume 1, p. 5. [Google Scholar]
- Zhao, Y.; Xiong, Y.; Wang, L.; Wu, Z.; Tang, X.; Lin, D. Temporal action detection with structured segment networks. In Proceedings of the IEEE International Conference on Computer Vision, Venice, Italy, 22–29 October 2017; pp. 2914–2923. [Google Scholar]
- Baptista Ríos, M.; López-Sastre, R.J.; Acevedo-Rodríguez, F.J.; Martín-Martín, P.; Maldonado-Bascón, S. Unsupervised Action Proposals Using Support Vector Classifiers for Online Video Processing. Sensors 2020, 20, 2953. [Google Scholar] [CrossRef]
- Sutskever, I. Training Recurrent Neural Networks; University of Toronto: Toronto, ON, Canada, 2013. [Google Scholar]
- Chatfield, C. The Analysis of Time Series: An Introduction; Chapman and Hall/CRC: London, UK, 2003. [Google Scholar]
- Shen, C. Analysis of detrended time-lagged cross-correlation between two nonstationary time series. Phys. Lett. A 2015, 379, 680–687. [Google Scholar] [CrossRef]
- Womack, J. From Lean Tools to Lean Management; Lean Enterprise Institute: Brookline, MA, USA, 2006; Volume 21. [Google Scholar]
- Ofli, F.; Chaudhry, R.; Kurillo, G.; Vidal, R.; Bajcsy, R. Berkeley MHAD: A comprehensive Multimodal Human Action Database. In Proceedings of the 2013 IEEE Workshop on Applications of Computer Vision (WACV), Clearwater Beach, FL, USA, 15–17 January 2013; pp. 53–60. [Google Scholar]
- Pisharady, P.K.; Saerbeck, M. Recent methods and databases in vision-based hand gesture recognition: A review. Comput. Vis. Image Underst. 2015, 141, 152–165. [Google Scholar] [CrossRef]
- Cutler, R.; Davis, L.S. Robust real-time periodic motion detection, analysis, and applications. IEEE Trans. Pattern Anal. Mach. Intell. 2000, 22, 781–796. [Google Scholar] [CrossRef] [Green Version]
- Kosmopoulos, D.; Papoutsakis, K.; Argyros, A. A Framework for Online Segmentation and Classification of Modeled Actions Performed in the Context of Unmodeled Ones. IEEE Trans. Circuits Syst. Video Technol. 2017, 27, 2578–2590. [Google Scholar] [CrossRef]
- Han, F.; Reily, B.; Hoff, W.; Zhang, H. Space-Time Representation of People Based on 3D Skeletal Data. Comput. Vis. Image Underst. 2017, 158, 85–105. [Google Scholar] [CrossRef] [Green Version]


| Posture Type | Flexion Angle of Waist | Rotation Angle of Waist | Height of Working Arm | Flexion/Stretch Angle of Knees | ||||||||
|---|---|---|---|---|---|---|---|---|---|---|---|---|
| Risk level | 1 | 2 | 3 | 1 | 2 | 3 | 1 | 2 | 3 | 1 | 2 | 3 |
| Total | 9 | 31 | 266 | 0 | 52 | 254 | 18 | 36 | 247 | 5 | 7 | 298 |
| Classification Method | Precision | Recall | F1-Score |
|---|---|---|---|
| Rule-based classifier | 0.527 | 0.583 | 0.516 |
| multi-class SVMs | 0.603 | 0.860 | 0.680 |
| ST-GCNs [9] + softDTW [10] (proposed) | 0.653 | 0.822 | 0.710 |
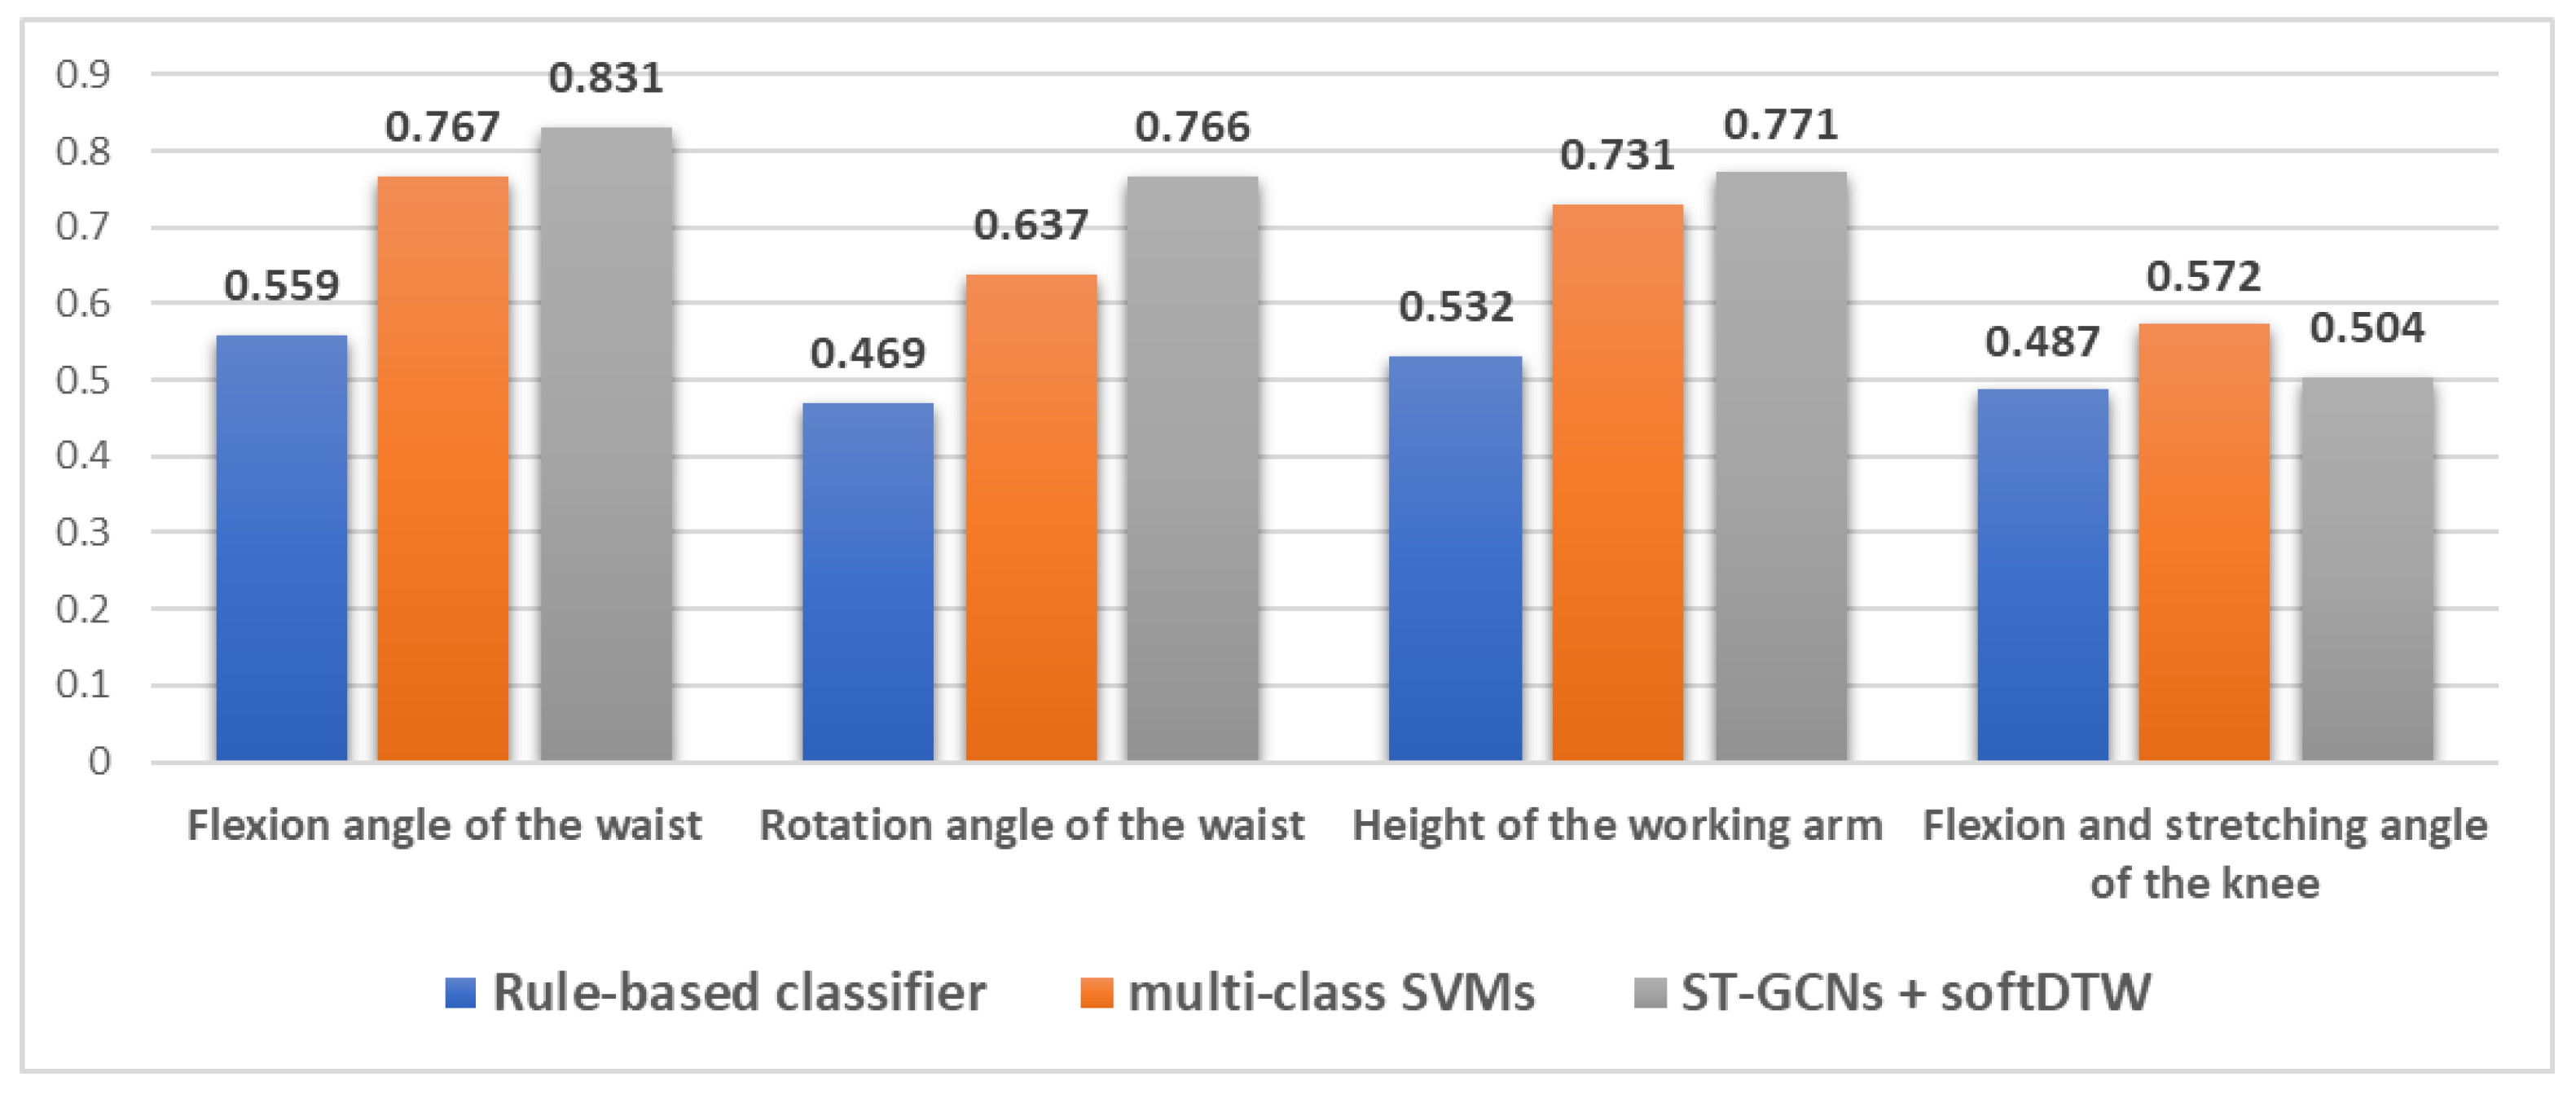
| Types of Working Postures | Flexion Angle of the Waist | Rotation Angle of the Waist | Height of the Working Arm | Flexion/Stretching Angle of the Knee | Mean F1-Score |
|---|---|---|---|---|---|
| Ergonomic Risk Level/Methods | L1/L2/L3 | L1/L2/L3 | L1/L2/L3 | L1/L2/L3 | |
| Rule-based classifier | 0.34/0.56/0.77 | -/0.24/0.70 | 0.30/0.60/0.70 | 0.28/0.42/0.75 | 0.516 |
| multi-class SVMs | 0.72/0.70/0.87 | -/0.50/0.77 | 0.70/0.68/0.82 | 0.50/0.30/0.90 | 0.680 |
| ST-GCN + softDTW | 0.74/0.80/0.90 | -/0.63/0.90 | 0.80/0.61/0.89 | 0.25/0.38/0.87 | 0.710 |
| Input | Prediction 10 s | Prediction 20 s | Prediction 30 s | |||
|---|---|---|---|---|---|---|
| Training | Validation | Training | Validation | Training | Validation | |
| HR only | 2.02 | 4.86 | 2.32 | 7.93 | 3.86 | 7.38 |
| HR + PD | 1.02 | 5.03 | 1.93 | 8.34 | 1.96 | 6.22 |
| Flexion Angle of the Waist | Rotation Angle of the Waist | Height of the Working Arm | Flexion and Stretching Angle of the Knee | Stress Score | |
|---|---|---|---|---|---|
| Worker 1 | 0.11 | 0.21 | 0.01 | 0.11 | 0.23 |
| −0.18 | −0.06 | −0.44 | 0.08 | −0.34 | |
| −0.29 | −0.14 | 0.17 | −0.04 | −0.17 | |
| 0.01 | 0.01 | 0.02 | 0.00 | 0.02 | |
| Worker 2 | −0.17 | −0.34 | −0.15 | 0.10 | −0.29 |
| −0.05 | −0.10 | 0.01 | −0.03 | −0.07 | |
| −0.03 | −0.01 | 0.11 | 0.06 | 0.03 | |
| −0.08 | −0.07 | −0.03 | 0.03 | −0.08 |
Publisher’s Note: MDPI stays neutral with regard to jurisdictional claims in published maps and institutional affiliations. |
© 2022 by the authors. Licensee MDPI, Basel, Switzerland. This article is an open access article distributed under the terms and conditions of the Creative Commons Attribution (CC BY) license (https://creativecommons.org/licenses/by/4.0/).
Share and Cite
Papoutsakis, K.; Papadopoulos, G.; Maniadakis, M.; Papadopoulos, T.; Lourakis, M.; Pateraki, M.; Varlamis, I. Detection of Physical Strain and Fatigue in Industrial Environments Using Visual and Non-Visual Low-Cost Sensors. Technologies 2022, 10, 42. https://0-doi-org.brum.beds.ac.uk/10.3390/technologies10020042
Papoutsakis K, Papadopoulos G, Maniadakis M, Papadopoulos T, Lourakis M, Pateraki M, Varlamis I. Detection of Physical Strain and Fatigue in Industrial Environments Using Visual and Non-Visual Low-Cost Sensors. Technologies. 2022; 10(2):42. https://0-doi-org.brum.beds.ac.uk/10.3390/technologies10020042
Chicago/Turabian StylePapoutsakis, Konstantinos, George Papadopoulos, Michail Maniadakis, Thodoris Papadopoulos, Manolis Lourakis, Maria Pateraki, and Iraklis Varlamis. 2022. "Detection of Physical Strain and Fatigue in Industrial Environments Using Visual and Non-Visual Low-Cost Sensors" Technologies 10, no. 2: 42. https://0-doi-org.brum.beds.ac.uk/10.3390/technologies10020042