
Distribution Path Optimization by an Improved Genetic Algorithm Combined with a Divide-and-Conquer Strategy


1
College of Shipbuilding Engineering, Harbin Engineering University, Harbin 150001, China
2
Faculty of Mechanical Engineering and Automation, Zhejiang Sci-Tech University, Hangzhou 310018, China
3
Department of Electrical and Computer Engineering, Concordia University, Montreal, QC H3G 2W1, Canada
*
Author to whom correspondence should be addressed.
Technologies 2022, 10(4), 81; https://0-doi-org.brum.beds.ac.uk/10.3390/technologies10040081
Submission received: 9 June 2022
/
Revised: 25 June 2022
/
Accepted: 4 July 2022
/
Published: 5 July 2022
(This article belongs to the Special Issue 10th Anniversary of Technologies—Recent Advances and Perspectives)
Abstract
:The multivehicle routing problem (MVRP) is a variation of the classical vehicle routing problem (VRP). The MVRP is to find a set of routes by multiple vehicles that serve multiple customers at a minimal total cost while the travelling-time delay due to traffic congestion is tolerated. It is an NP problem and is conventionally solved by metaheuristics such as evolutionary algorithms. For the MVRP in a distribution network, we propose an optimal distribution path optimization method that is composed of a distribution sequence search stage and a distribution path search stage that exploits a divide-and-conquer strategy, inspired by the idea of dynamic programming. Several optimization objectives subject to constraints are defined. The search for the optimal solution of the number of distribution vehicles, distribution sequence, and path is implemented by using an improved genetic algorithm (GA), which is characterized by an operation for preprocessing infeasible solutions, an elitist’s strategy, a sequence-related two-point crossover operator, and a reversion mutation operator. The improved GA outperforms the simple GA in terms of total cost, route topology, and route feasibility. The proposed method can help to reduce costs and increase efficiency for logistics and transportation enterprises and can also be used for flow-shop scheduling by manufacturing enterprises.
1. Introduction
The issues of reducing logistics costs, ensuring timeliness of cargo distribution, and optimizing the path of delivery vehicles are crucial to the competitivity of logistics and transportation enterprises [1]. The vehicle routing problem (VRP) is a major problem in distribution, logistics, and transportation. The VRP was first described in 1959 by Dantizg and Ramser [2], as the truck dispatch problem. It is a combinatorial integer programming problem, which is NP-hard. In [3], the VRP was solved using a genetic algorithm (GA) with the idea of implementing different genetic operators, modified for the VRP. In [4], these issues were transformed into a mathematical model, which was solved by using an adaptive evolution algorithm.
The multivehicle routing problem (MVRP) is more common where multiple vehicles of a carrier are used for logistics or transportation. In [5], the problem of mixed fleet vehicles with time windows was solved by self-adaptive neighbor search algorithms. In [6], a mathematical model that minimized the total cost was proposed for a green hybrid fleet with time window and the charging strategy, and it was solved by heuristic algorithms.
In [7], in order to minimize the total cost of a hybrid team composed of traditional fuel, plug-in hybrid, and electric vehicles, a mathematical model was defined and then solved by a metaheuristic algorithm based on the GA and neighborhood search. The metaheuristic was further hybridized with an integer programming solver over a set-partitioning formulation, so as to recombine high-quality routes from the search history for better solutions.
The optimization of the cross-docking distribution network and the internal scheduling of the cross-docking center were studied in [8,9]. The VRP with cross-docking consists in finding a set of routes to distribute products from a set of suppliers to a set of customers through a cross-docking facility at minimal costs, without violating the vehicle capacity and time horizon constraints. In [10], a two-phase metaheuristic based on column generation was proposed for the VRP with cross-docking. A set of destroy and repair operators were used in order to explore a large neighborhood space.
In a production environment of the re-entrant flow-shop (RFS), all jobs have the same routing over the machines of the shop, and the same sequence is traversed several times to complete the jobs. In [11], a GA was used to minimize the makespan for RFS scheduling problems. Hybrid GAs were proposed to enhance the performance of the simple GA.
Cold chain distribution route optimization for fresh agricultural products is formulated as the minimization of the operator’s total expenditure that includes emission cost due to carbon tax and comprehensive distribution cost. In [12], this problem was implemented by using the bacterial foraging optimization algorithm. In [13], a model was integrated to determine the delivery time for each order in the multitemperature distribution logistics by minimizing a carrier’s total spending.
In [14], a simplified physical road network model was defined by representing the path with the shortest distance, the shortest time, or the lowest cost between two points as arcs, and an exact solution algorithm was proposed. In [15], the VRP was formulated as an integer linear programming model that minimized the distribution cost, the emission cost, or the sum of the distribution and emission costs. It was solved by an ant colony optimization (ACO)-based metaheuristic.
In [16], the shared customer collaboration VRP was introduced and formulated as a mathematical programming problem, and then solved by using a branch-cut-set algorithm. The shared customer collaboration VRP aims at reducing the overall operational cost in a collaboration framework, where several carriers operate and some of their customers have demand of service from more than one carrier.
For the VRP with stochastic demands, a stochastic programming model, composed of a route-planning stage and an execution stage, was introduced in [17]. If a vehicle cannot meet a customer’s random demand requested during the execution process, it needs to return to the distribution center for replenishment and resume its planned route at the point of failure. The objective is to minimize the sum of the planned route cost and the expected recourse cost. A local branching metaheuristic was implemented for the MVRP with stochastic demands in [17].
The VRP with hard time windows under demand and travel time uncertainty was studied in [18]. A robust optimization model was built based on route-dependent uncertainty sets. By using a modified adaptive variable neighborhood search heuristic, the designed two-stage algorithm first minimized the total number of vehicle routes, and then minimized the total travel distance.
The fleet size and mix VRP with synchronized visits (FSM-VRPS) is an extension of the VRP with synchronization, where a mixed fleet composed of electric and conventional bikes, and passenger cars having different acquisition costs are considered. Multipath routing can use the resources of multiple networks to transport at the same time, and the transport ability of multiple networks are aggregated [19]. A multistart adaptive large neighborhood search heuristic with threshold accepting has been proposed.
Dozens of prominent VRP variants as well as their respective mixed integer linear-programming formulations were surveyed in [20].
In this paper, we define a variant MVRP and then solve it using an improved GA. We introduce a new divide-and-conquer strategy for calculating the cost of the vehicles during driving, in consideration of the starting cost of the vehicles. In order to reduce the overall cost, a manufacturer provides a reasonable number of vehicles with a limited carrying capacity to provide customers with fast and convenient distribution services. We conduct a simulation and prove our improved GA combined with the divide-and-conquer strategy is effective.
This paper is organized as follows. In Section 2, we give a distribution path optimization model of the MVRP. A divide-and-conquer strategy for MVRP is introduced in Section 3. In Section 4, the distribution path optimization is implemented based on the improved GA. Simulation results are given and analyzed in Section 5. Section 6 concludes this paper.
2. Distribution Path Optimization Model of the MVRP
The VRP may be considered a generalized variation of the traveling salesman problem (TSP) [21]. The TSP consists in finding the shortest path between cities, which passes all the cities and returns to the starting point, given the distances between the cities. There are Feasible route solutions for a visit of cities. Thus, it is difficult to find the optimal solution. Both the VRP and the TSP can be modelled as combinatorial integer programming problems and are NP-hard.
Consider the route optimization of a distribution service consisting of local retailers and a manufacturer. Therefore, we need to consider how to distribute goods from a manufacturer’s distribution node to retailers’ demand nodes at the least cost. To this end, we need to find the optimal number of vehicles and the shortest path of the vehicles for the minimum distribution cost, given the quantities of products demanded by the nodes.
A vehicle route is represented by a weighted diagraph , where is the set of nodes, with being the distribution node and , , …, being demand nodes, is the set of edges, and is the set of distances between nodes.
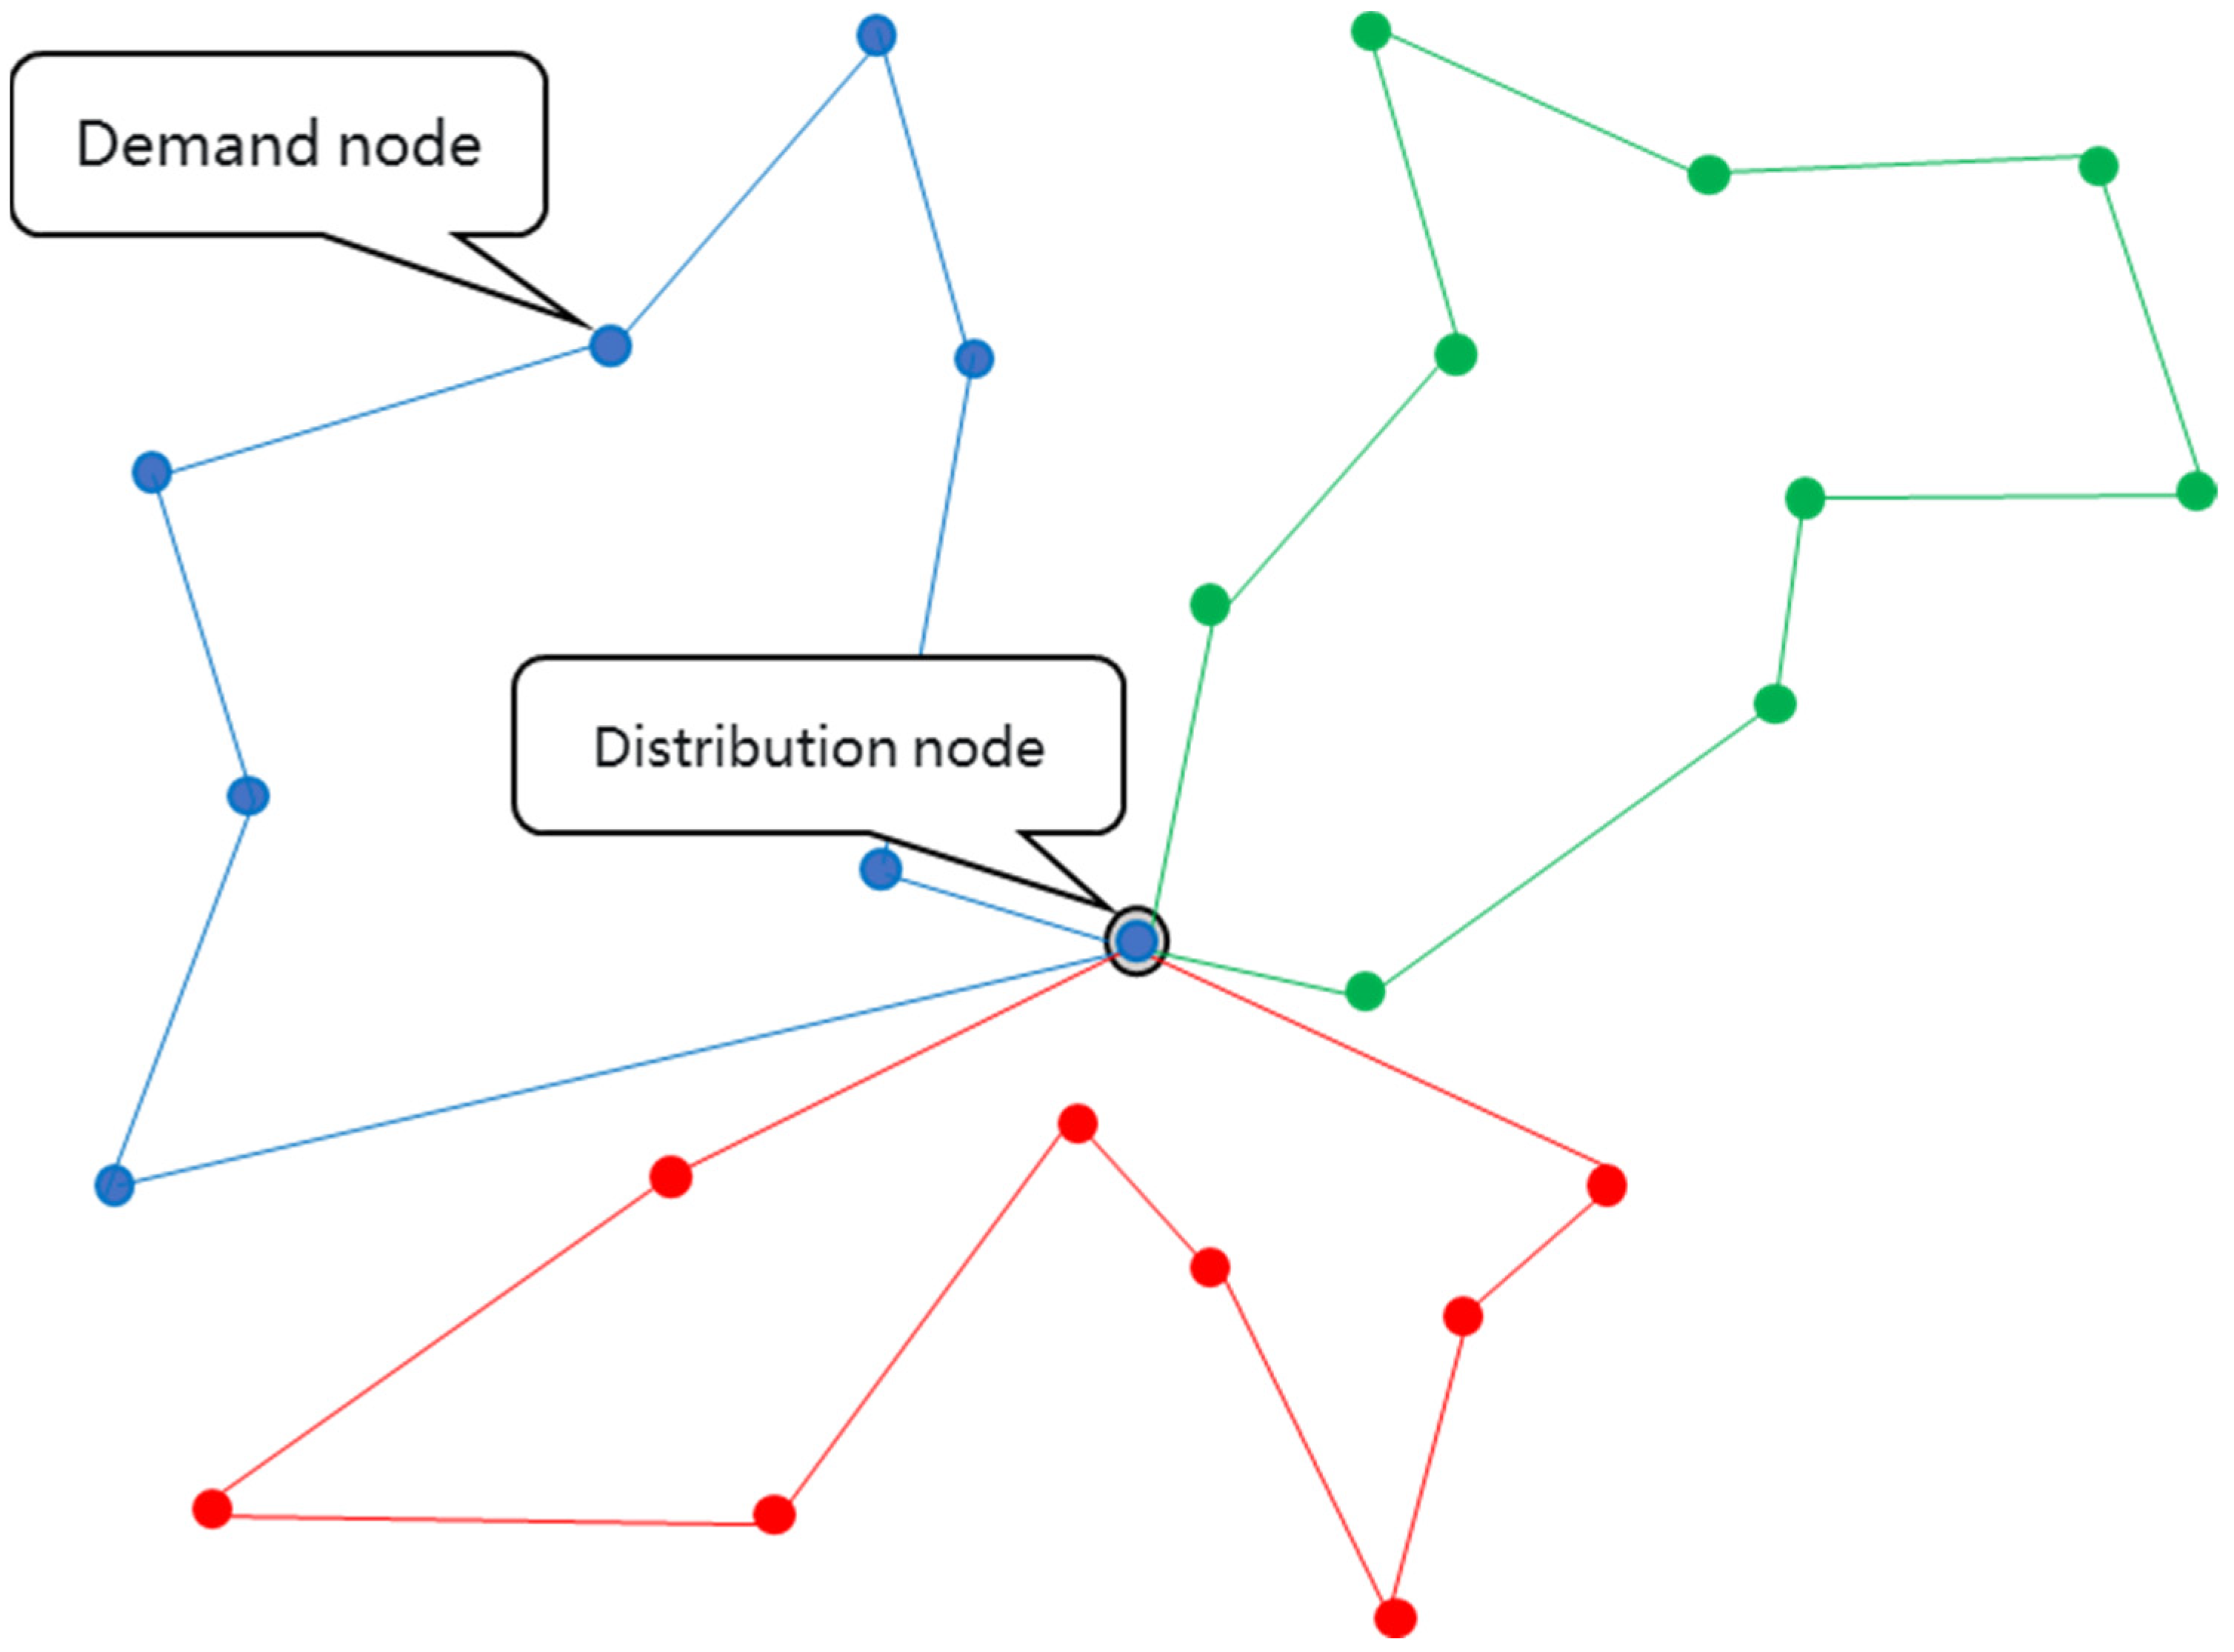
The MVRP is a variant of the classical VRP. The MVRP consists in finding a set of routes by multiple vehicles that serve multiple customers at the least total cost, while the travelling-time delay due to traffic congestion is tolerated. The MVRP is illustrated in Figure 1, where three vehicles undertake the distribution jobs.
A distribution path optimization model for the MVRP is presented in the following. Our objective is to find a path with the number of vehicles as small as possible such that the vehicles’ total itinerary is the shortest, for the sake of the least cost. We implement the search process in two steps. We first find an optimal distribution sequence, and then search for a specific path between two neighboring nodes of the sequence.
Objective function 1. The total cost is minimized,
where is the number of demand nodes, is the number of vehicles used, is the unit transport cost from node to node for vehicle , is the distance between nodes and for vehicle , is the starting cost for vehicle , and is the state of vehicle from node to node ,
Objective function 2. The total length of the route is minimized,
Notice that the calculation of may consider the real road sections on a map, and it is not the Euclidean distance between the nodes.
When the s are the same, , and the two objective functions, namely, the total cost and the total route length, are equivalent.
Constraint 1. The delivered goods shall not exceed the maximum load capacity of a vehicle,
where is a quantity demanded by node , , is the load capacity, and
Constraint 2. The distribution job of each node is completed by only one vehicle, and all the distribution jobs are completed by vehicles,
Constraint 3. There is only one vehicle that reaches or leaves a demand node,
Constraint 4. There is no duplicate or loop route section on the optimized path,
where is the state of the path between nodes and being on the optimal path,
In a practical case, there are road sections between any two nodes, and we can treat all the road intersections as nodes and search for an optimal path between the two nodes.
Objective function 3. For any two demand/distribution nodes A and B, assume that there is road intersection nodes between them. A and B are treated as nodes 1 and , respectively, and all the other nodes are permutated and then renamed as 2, 3, …, . Then, the path length of any sequence between the two nodes is minimized,
where is the connectivity between nodes and ,
and is the Euclidean distance between nodes and .
Through the above model, the distribution path is searched. With minimum or as the goal subject to the constraints, a distribution sequence is obtained.
When using multiple vehicles to distribute products to multiple demand nodes, we need to determine the number of vehicles and the route of each vehicle. There is a limitation on the load capacity of each vehicle, and the loads and demand nodes are relatively balanced unless there is a supercustomer, whose demand does not exceed 60% of the load capacity.
3. A Divide-and-Conquer Strategy for the MVRP
We propose a divide-and-conquer strategy for the MVRP, which employs the idea of dynamic programming to decompose the problem into multiple steps. For the route search, when the number of demand nodes and road intersections within the range of delivery is very large, it is very difficult to find an optimal route since it is an NP-hard problem. Inspired by the idea of dynamic programming, we find an optimal sequence of the demand nodes at first, and then further find an optimal route between any two nodes.
For the search of a suboptimal sequence, we assume that all the demand nodes and the distribution node are directly accessible. We solve this problem by using an improved GA algorithm. Once an optimal sequence for all the demand nodes is found, we search for an optimal route between any two nodes, and the complete route is then obtained step by step.
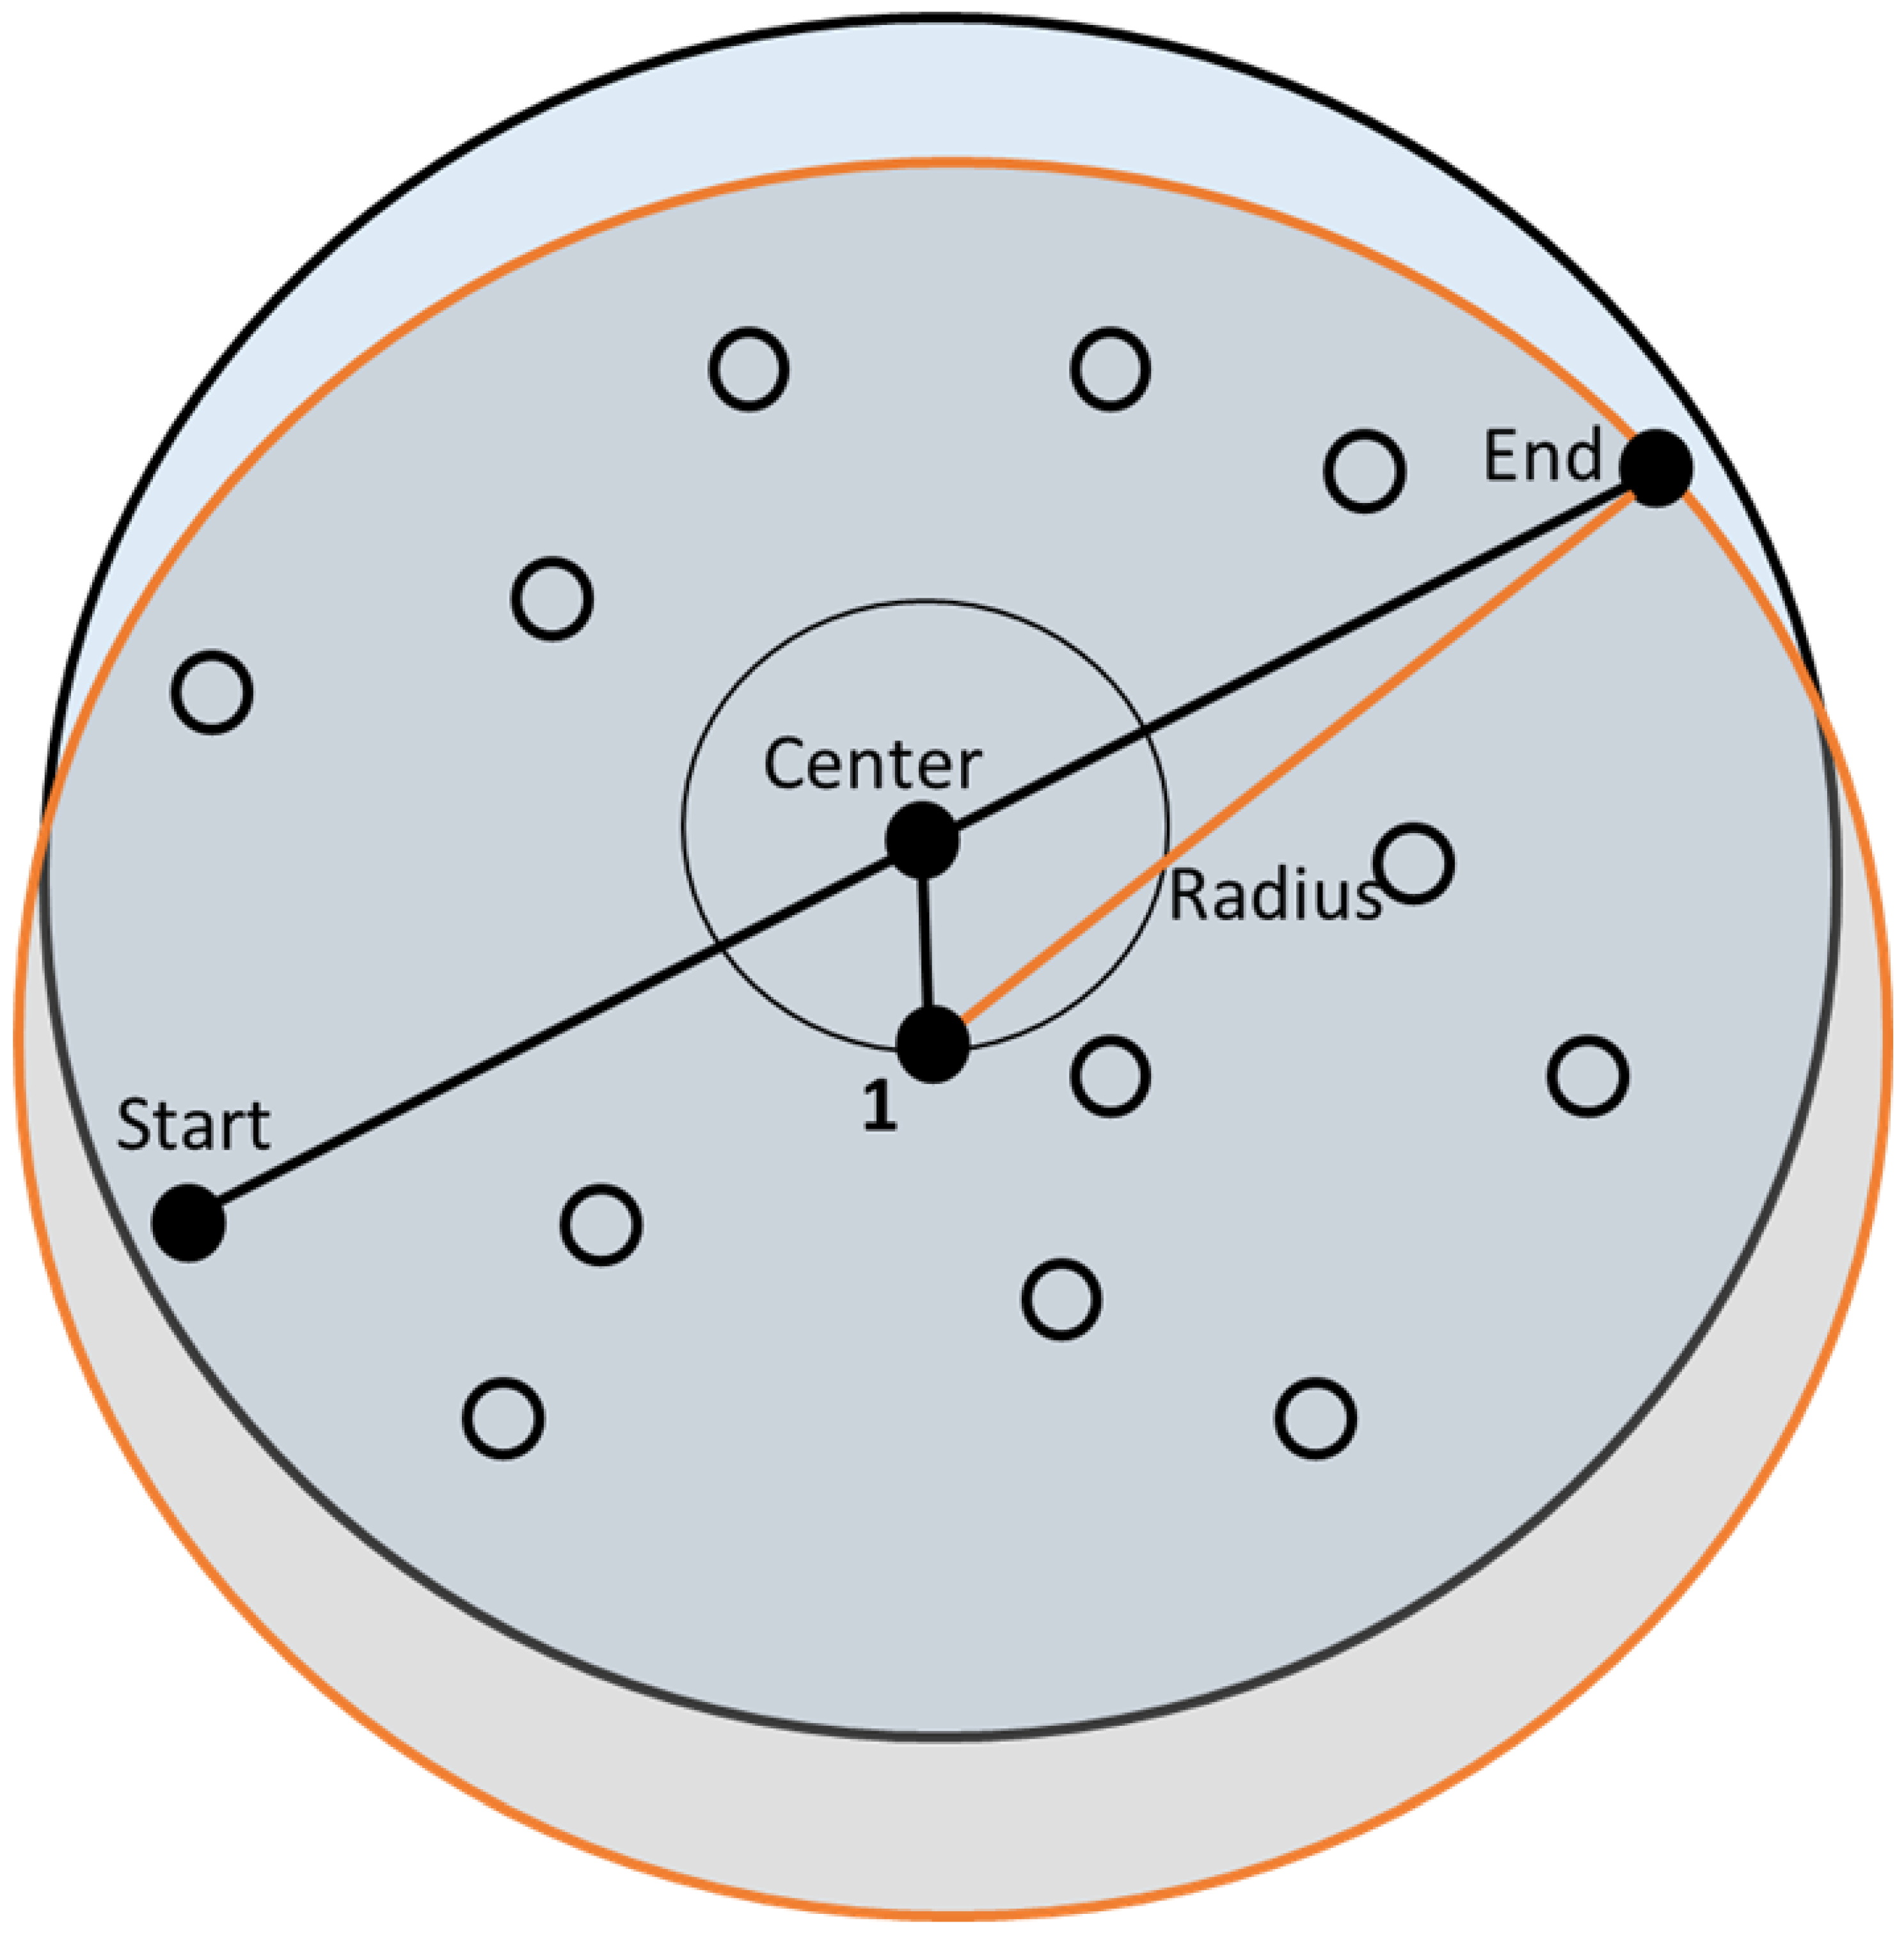
In Figure 2, the two nodes are defined as the starting point and ending point. To find a route between two nodes, the center of the two nodes is selected as an auxiliary point. The intersection that is closest to the auxiliary point is named point 1. The distances from point 1 to the two demand nodes are calculated and the larger value is selected as the search radius. The number of intersections may be excessive if the radius is very large.
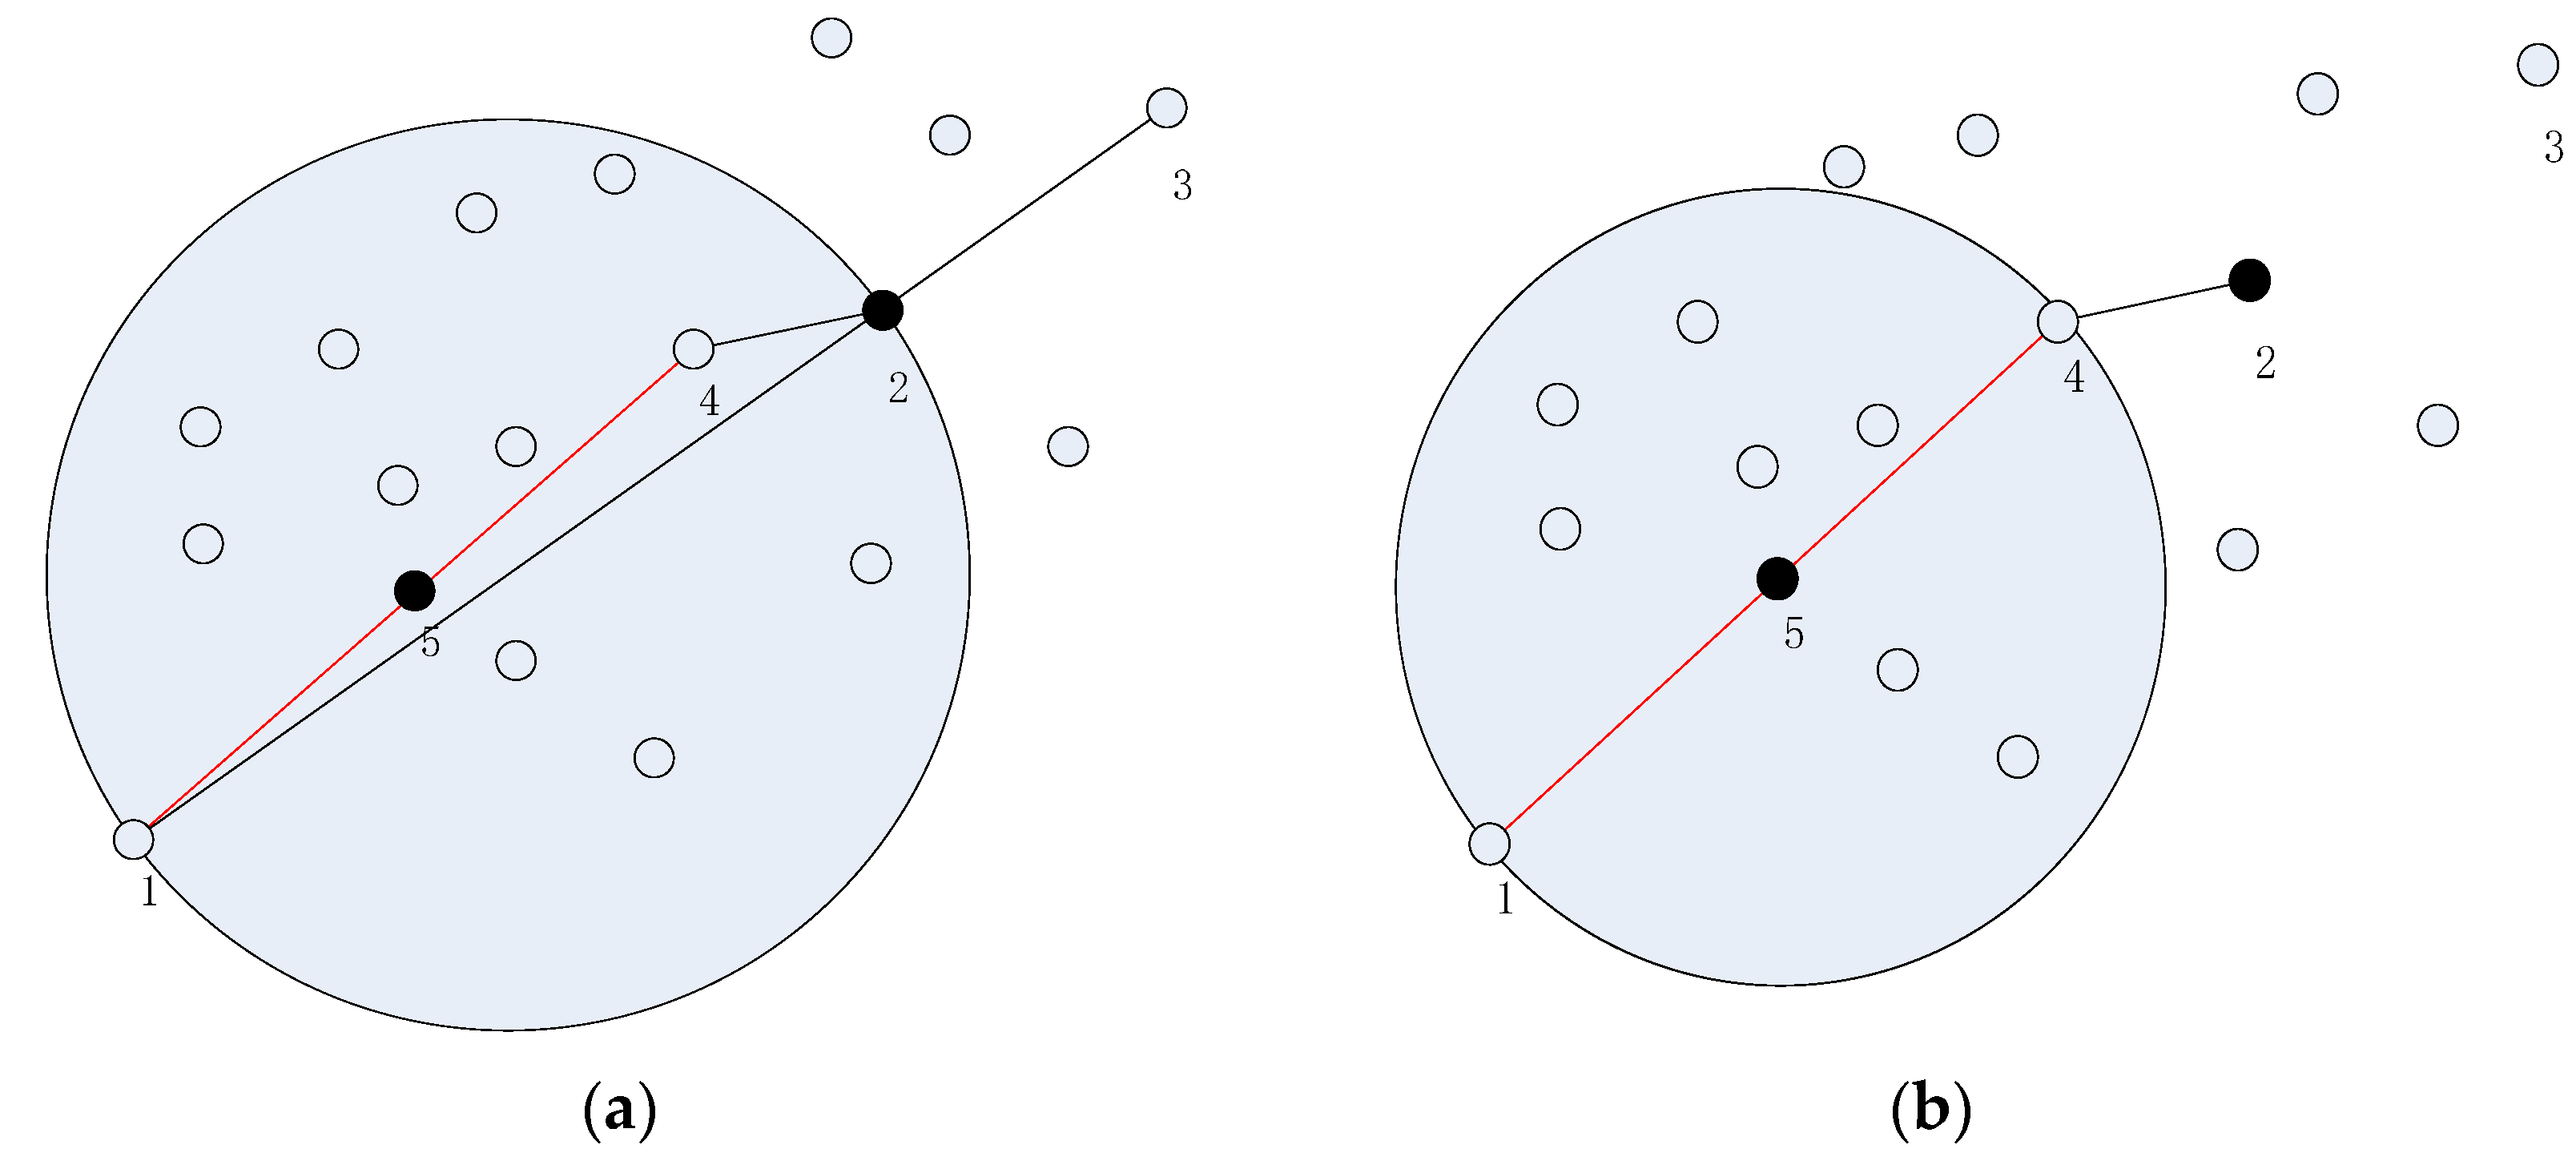
In Figure 3a, given a search radius, in order to deliver from node 1 to node 3, the distance between the two nodes cannot be covered by a circle. The circle shown is the largest search region, and node 3 is out of the region. We select the crossing point 2 as a reference point, and then select point 4, which is the node closest to point 2 in the search region, as the endpoint of the search. We then connect node 1 and point 4, and get the center of the line segment, point 5. Treating point 5 as the center and setting a search radius, Figure 3b is obtained. Once the optimal route from node 1 to point 4 is found, point 4 is further treated as a new starting point, and still treating point 3 as the end point to find the optimal route. This operation is implemented iteratively until node 3 is reached.
4. An Improved GA for Distribution Path Optimization of the MVR
In a GA, each solution called an individual is coded as a chromosome. In this paper, we implemented a GA as follows. By selecting multiple chromosomes to form a population, genetic operations are applied. Individuals in the population are selected using the roulette wheel selection and an elitist’s strategy, and the selected individuals are then used for recombination and mutation according to certain probabilities, and finally a new population is formed by selection. The process is repeated until a termination criterion is met.
The presented model is solved by the proposed GA. The individuals are encoded as integers. The demand nodes are numbered in an increasing order of distances from the demand nodes to the distribution node. In case of a tie between distances, two continuous integers are randomly assigned. In order to search for a distribution sequence, we start with vehicle 1, from the distribution node 0 to the first demand node, and then to the next demand node, and so on, until it returns to the distribution node 0. We need to determine a search center and a radius. The nodes within the search region are numbered according to the distance to the search center. Then, all the nodes in its region are coded and the optimal sequence is solved by the GA. This process is repeated for all the vehicles.
The initial coding string of an individual is formed by a random combination of all the nodes, and then random but different integers between and are generated and ordered in an increasing order to serve as the breakpoints for assigning jobs to the vehicles.
As an example, assume there are a distribution node and demand nodes. The distribution node is numbered 0, and the demand nodes are numbered 1 to 40 successively. An example individual is a string of the 40 nodes: [32-40-22-34-35-6-3-16-11-30- 33-7-38-28-17-14-8-36-29-21-25-37-31-27-26-19-15-1-36-23-2-4-18-24-39-13-9-20-10-12]. For , four breakpoints at positions [7|12|20|32] are generated. The distribution sequences for the vehicles are given by
- vehicle 1: [0-32-40-22-34-35-6-3-0];
- vehicle 2: [0-16-11-30-33-7-0];
- vehicle 3: [0-38-28-17-14-8-36-29-21-0];
- vehicle 4: [0-25-37-31-27-26-19-15-1-36-23-2-4-0];
- vehicle 5: [0-18-24-39-13-9-20-10-12-0].
The subchromosomes constitute an individual [32-40-22-34-35-6-3|16-11-30-33-7|38-28-17-14-8-36-29-21|25-37-31-27-26-19-15-1-36-23-2-4|18-24-39-13-9-20-10-12].
For each of the subchromosomes, we evaluate the load capacity constraint; if a subchromosome cannot satisfy the load constraint, we discard the solution and regenerate a new one, or repair only those infeasible subchromosomes by recombination, until a feasible individual is generated. By adjusting the breakpoints of some infeasible solutions in the population, some infeasible solutions are made feasible. In the case when the loading capacity of the vehicles cannot meet the constraint after a certain number of tries, it is necessary to increase the number of vehicles.
This procedure is repeated until feasible individuals are generated to form a population. The fitness of all the individuals in the population is calculated. The individual with the best fitness is maintained in the population by the elitist’s strategy [22]. Through the roulette wheel selection, we randomly select two individuals for recombination and then by mutation and repeat this process until a new generation of individuals are generated. For recombination, we use a two-point crossover, and for mutation we randomly select two points on the chromosome and reverse the genes between the two points.
For two individuals, we select two crossover positions and exchange the segments between the two positions. For the first individual, we remove the same genes acquired from the second individual and obtain a shortened chromosome, and then we insert the acquired segment into the first crossover position, and a new individual is obtained. This operator is known as the Syswerda crossover operator [23].
For example, given two parents = [2-6-4|7-3-5-8|9-1] and = [4-5-2|1-8-6-7|9-3], if the two crossover points are positions 3 and 7, the segments [7-3-5-8] and [1-8-7-6] will be exchanged. To start with, we delete [1-8-7-6] from and = [2-4-3-5-9] remains, then we fill in the acquired segment [1-8-7-6] in the position of the original , and we get the offspring = [2-4-3|1-8-7-6|5-9]. Likewise, we get = [4-2-1|7-3-5-8|6-9].
For mutation, we randomly select two mutation points on the chromosome, and then reversed the in-between segment. As an example, an individual = [2-4|3-1-8-6-7|5-9] is obtained by mutating individual = [2-4|7-6-8-1-3|5-9].
For a complete path of the distribution path optimization, an appropriate distribution sequence is found at first, and the path between any two nodes is then searched. The implementation of the distribution path search includes Algorithm 1 for the search of the distribution sequence and Algorithm 2 for the search of the distribution route between two nodes.
For both algorithms, the elitist’s method is used to retain the best individual, and subsequently individuals are selected by the roulette wheel selection to form a new population. A two-point crossover operator is used with crossover probability . The mutation operator modifies an individual with mutation probability . The mutation operator is the reversal operator. The algorithms stop when they converge or run for generations.
| Algorithm 1 [Distribution Sequence Search] |
| Input: , , , ; , , , , node positions, … Output: Distribution sequence of demand nodes. Begin: Load node positions; Code demand nodes into continual integers; Generate initial population; while (TRUE): Generate a population; Preprocess infeasible individuals; Calculate fitness defined by (1) or (3); Perform selection, combination, and mutation; Apply elitist’s strategy; until Termination criterion is met. End |
| Algorithm 2 [Route Search Between Two Nodes] |
| Input: , , , ; node positions, intersection positions, … Output: Optimal route between the two nodes. Begin: while (TRUE): Apply the divide-and-conquer strategy: Find a center between two nodes; Draw a search region using a radius; Identify the road intersections within the range as additional nodes; Generate a population using nodes in the region; Preprocess infeasible individuals; Calculate fitness defined by (12); Perform selection, combination, and mutation; Apply elitist’s strategy; until Termination criterion is met. End |
For example, the distribution sequence of vehicle 1 is [0-32-40-22-34-35-6-3-0]. If there are 7 demand nodes that need to be delivered, the distribution route of the search is extracted in order. The road paths between nodes are numbered as
where the road path 1 denotes the path from the distribution node 0 to the demand node 32, and so on. A search procedure for road path 1 is illustrated in Section 3.
[0 - 32 - 40 - 22 - 34 - 35 - 6 - 3 - 0]
1 2 3 4 5 6 7 8,
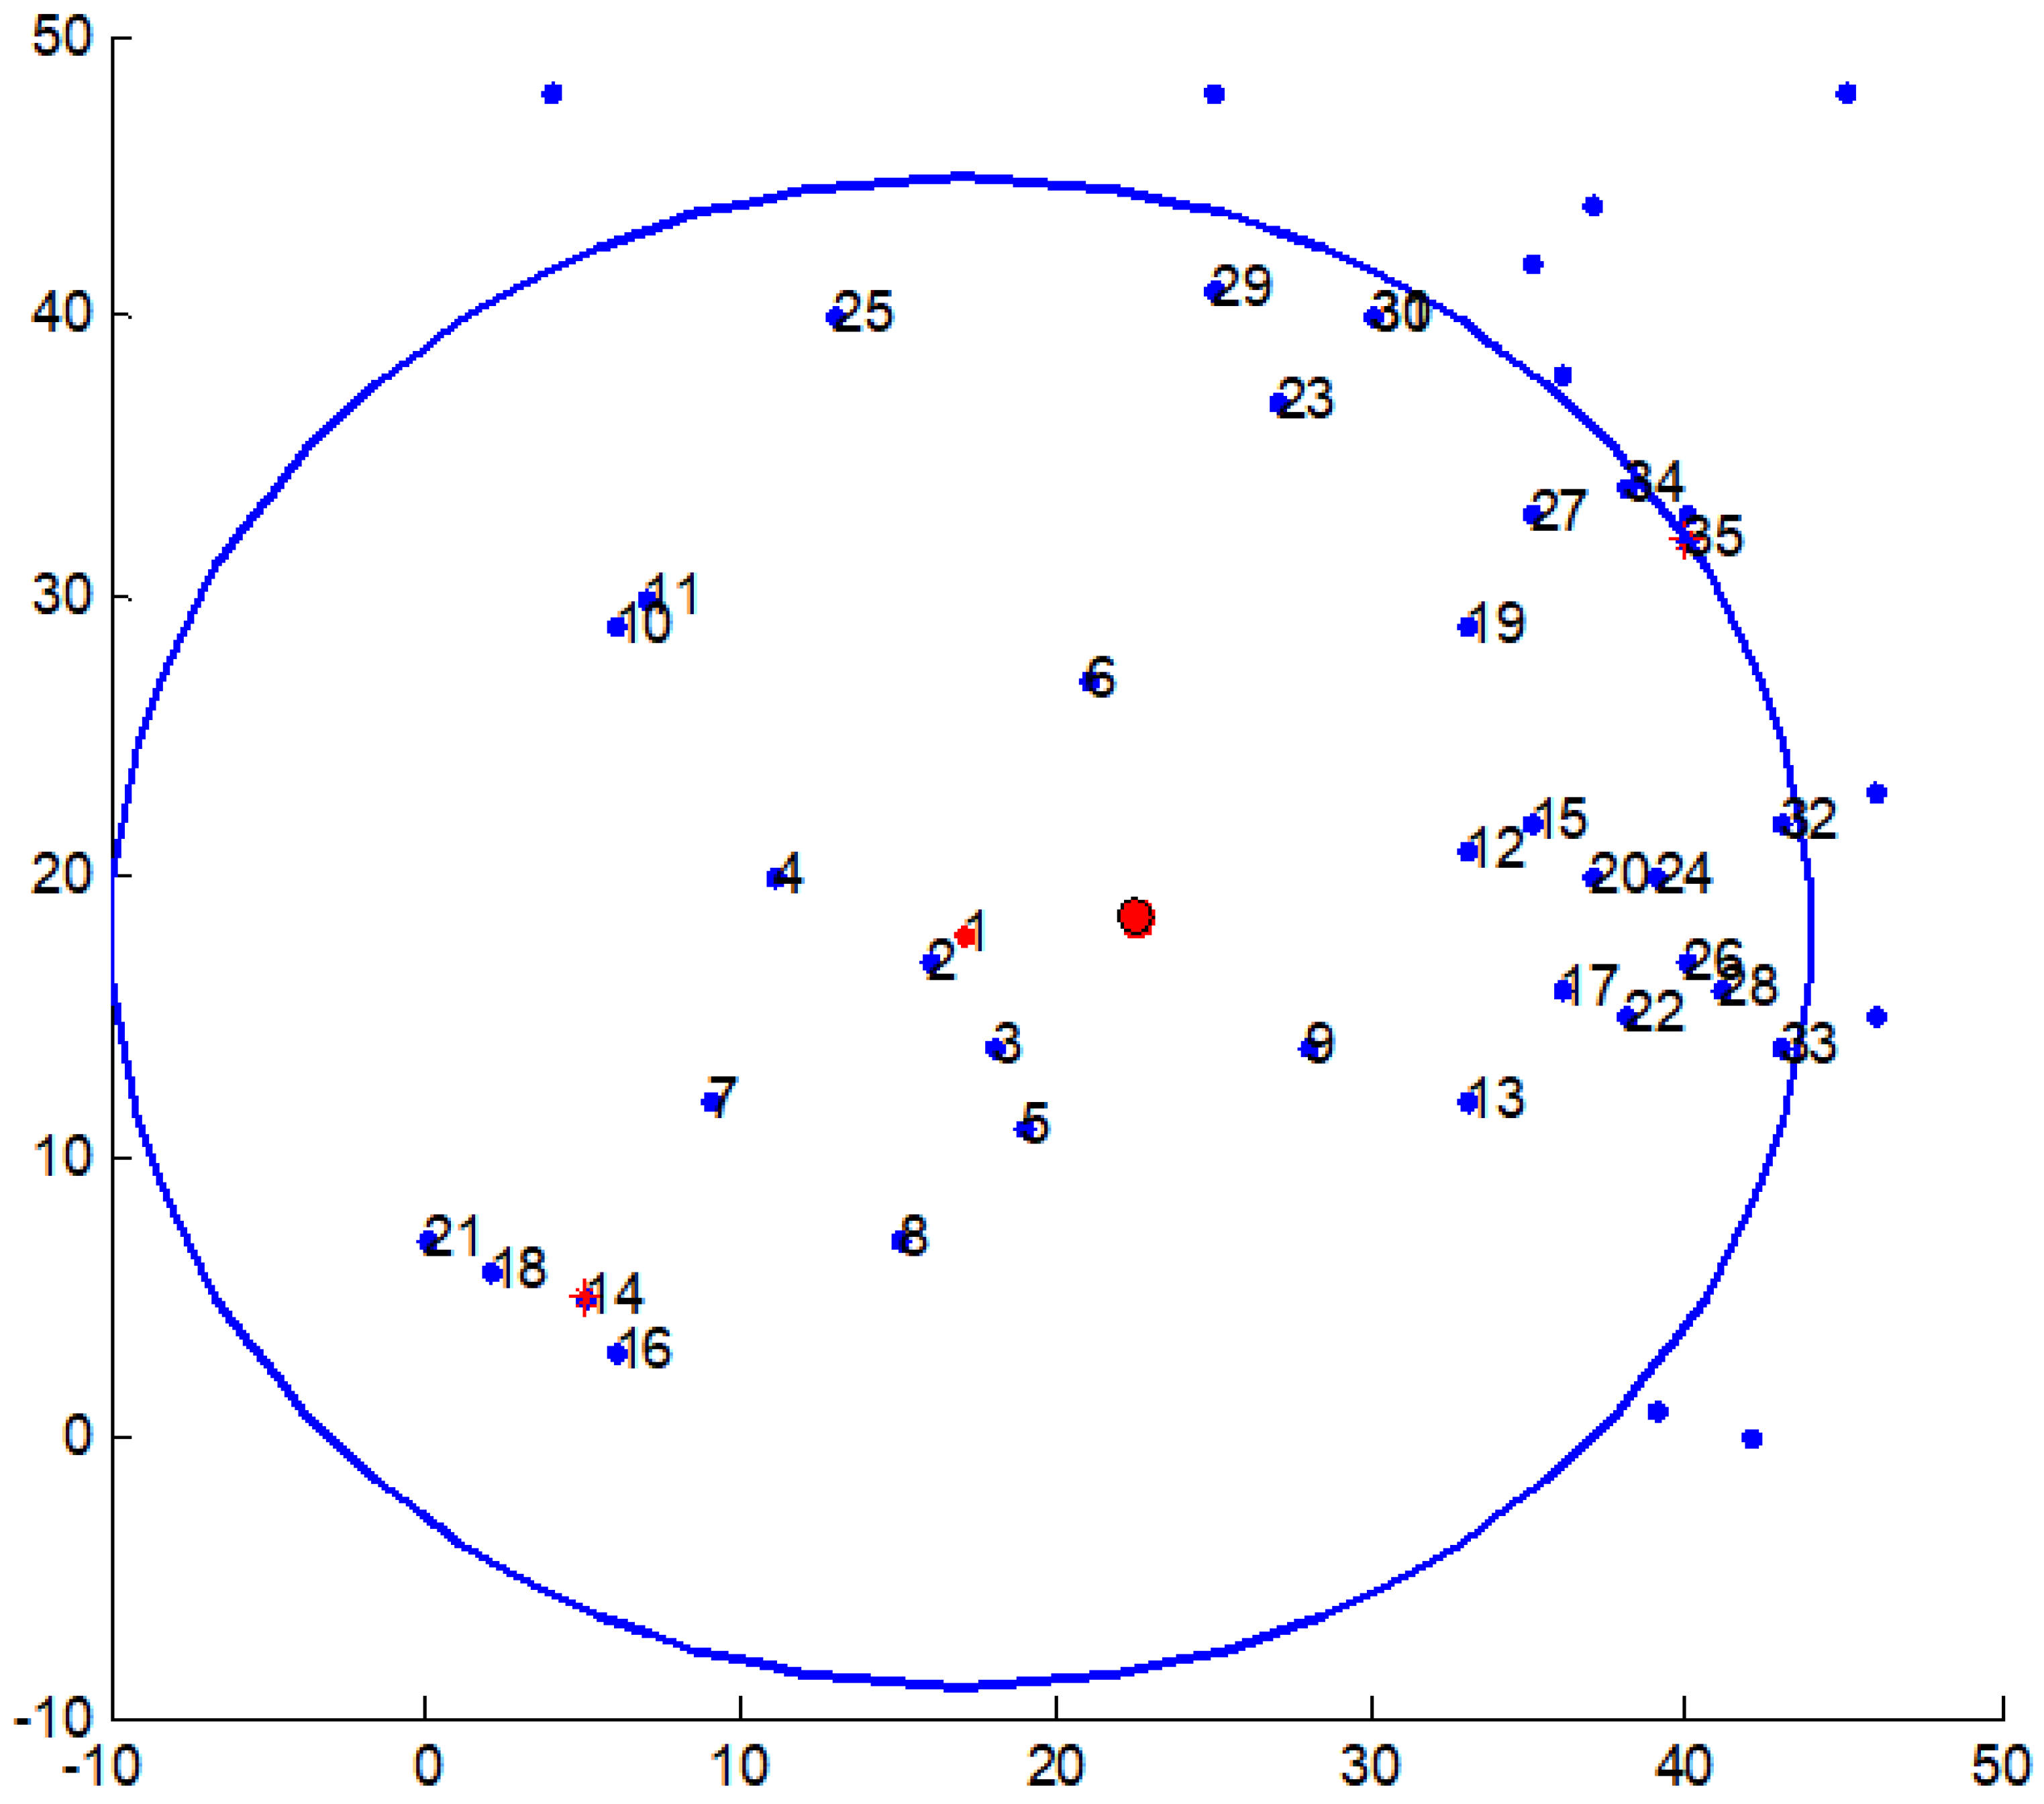
Figure 4 gives an illustration of Algorithm 2 for the road path 1. We renumbered the road intersections covered in the range, the distribution node, and the demand node 32. The fitness is defined by (12), where the connectivity of each road section within the search range is available from the map. A path is an individual encoded as an integer string, such as = [1-0-4-7-3-0-2-8]. Infeasible individuals are made feasible by preprocessing. Once a population is generated, it is subject to selection, recombination, and mutation. This procedure continues for all the 8 road paths between the nodes for a complete route of a vehicle, and then for the distribution paths of all the vehicles.
5. Simulation
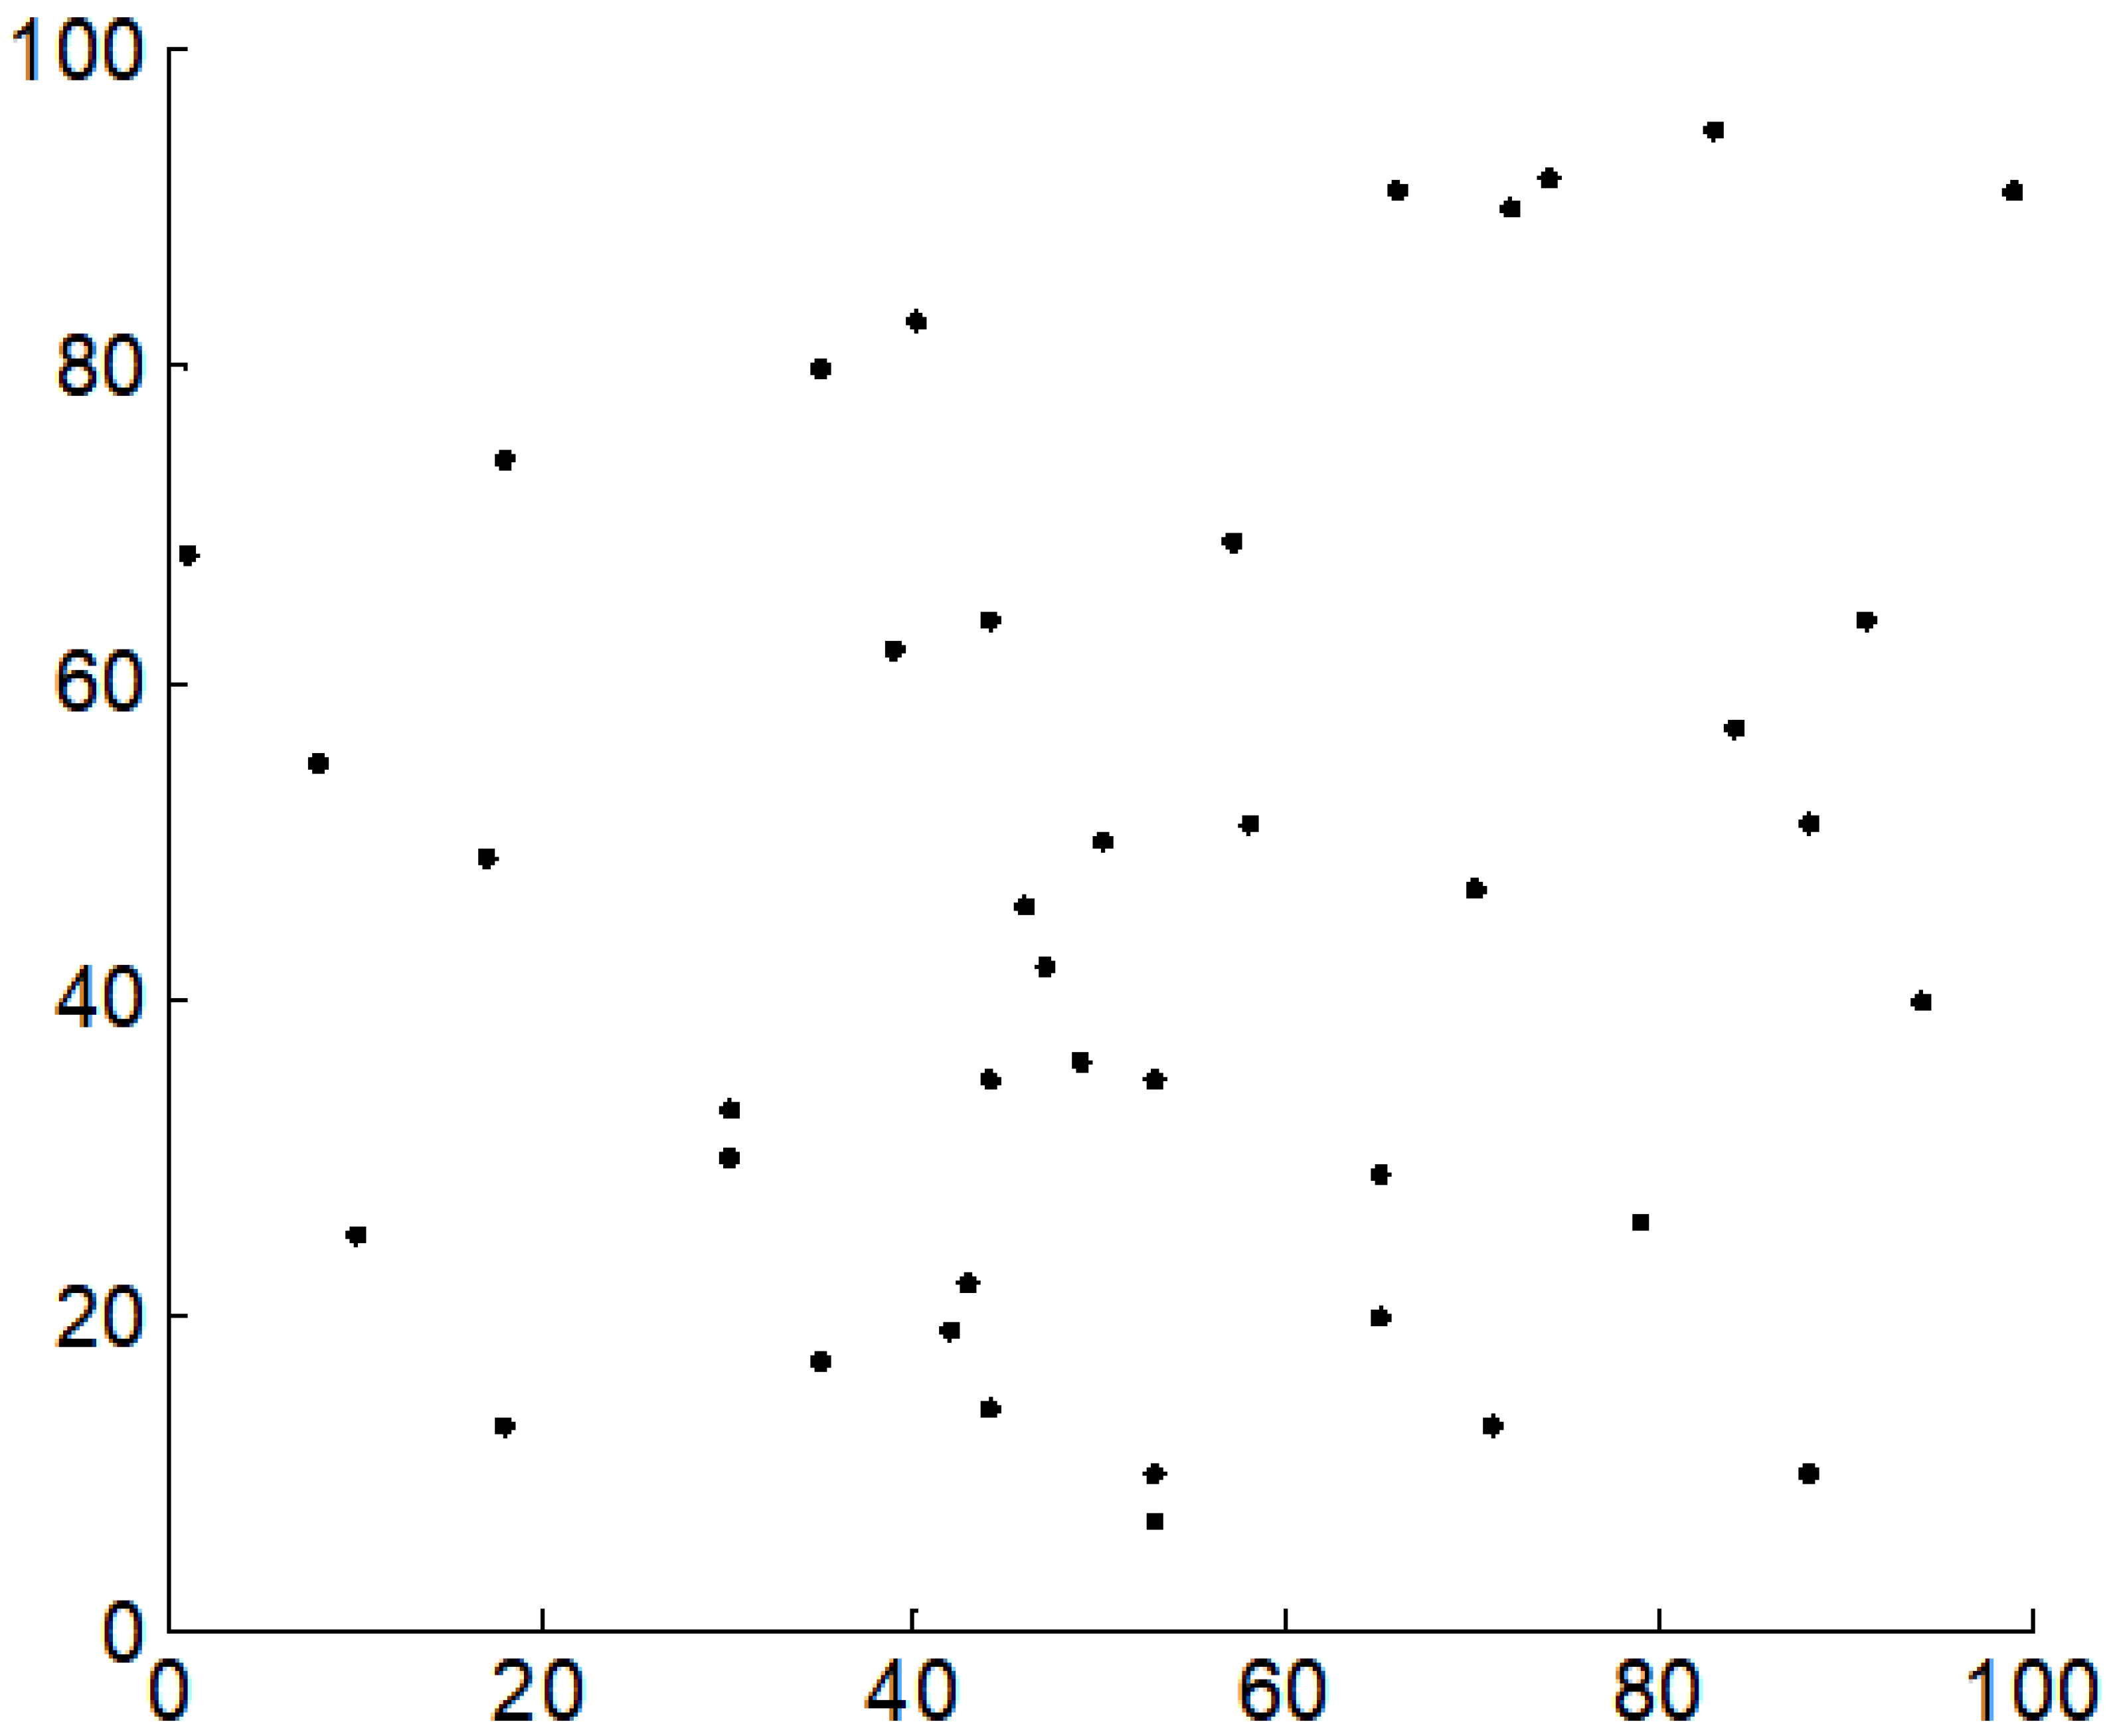
As an example, a manufacturing enterprise in Hangzhou delivers products to customers, and the load capacity of a vehicle is products. Let the coordinate of the distribution node be (50, 50). We position on a map the coordinates of the demand nodes by using ARCGIS software, and the coordinates and quantities of the demand nodes are listed in Table 1. The coordinates of the demand nodes are plotted in Figure 5.
5.1. Sequence Search Using Algorithm 1
In order to simplify the simulation, we optimized the total route length (objective function 2). We also assumed there were a direct connection between any two nodes. Thus, we did not need to use Algorithm 2 and objective function 3 for the route search.
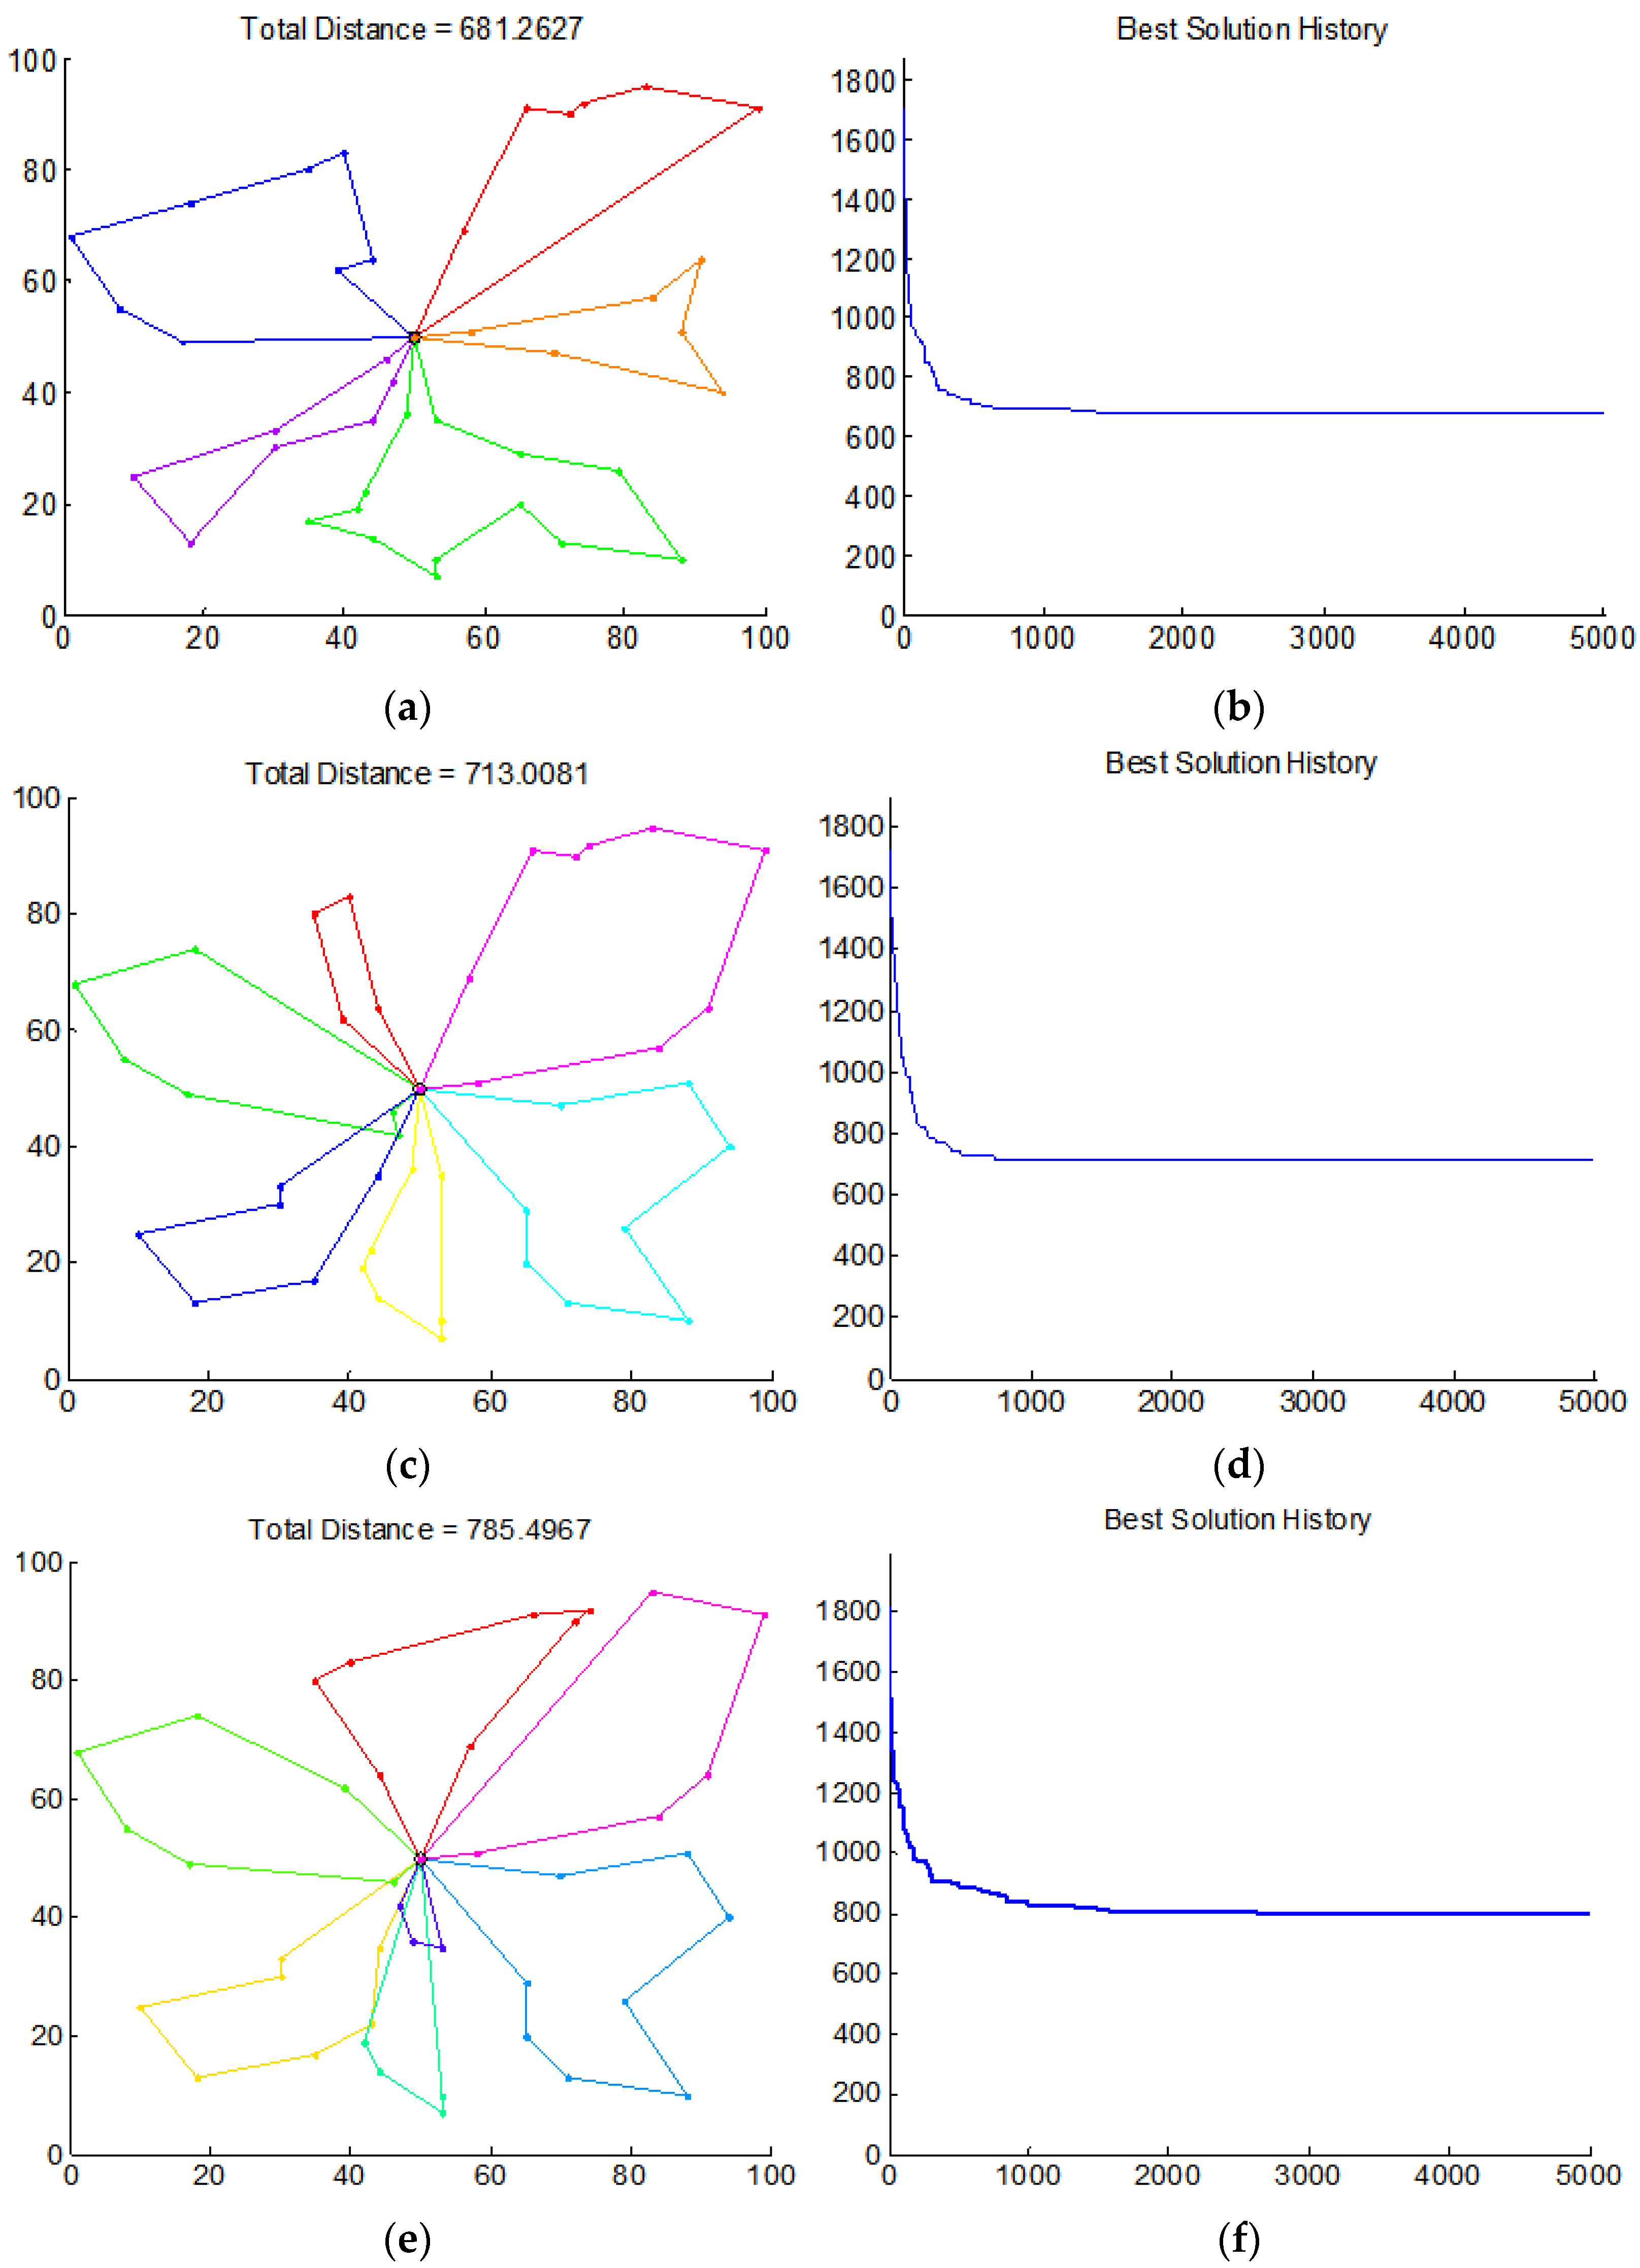
For the GA parameters, we set the number of generations , population size , crossover probability , and mutation probability . A population was selected from 200 individuals produced at random. The best result was obtained from 20 random runs. Figure 6 shows the distribution routes generated by our improved GA.
The best results for the total length of the distribution route are 681.26 km for , 713.01 km for , and 785.50 km for , respectively. It can be seen there are few intersecting routes. The paths are reasonable. When the number of vehicles is five, the total length is 681.26 km, which is the best result. The route of each vehicle does not intersect, while satisfying all the constraints.
Due to the elitist strategy, the evolution is stable. It can be seen that the distribution sequence rarely overlaps and intersects. The result is reasonable and desirable.
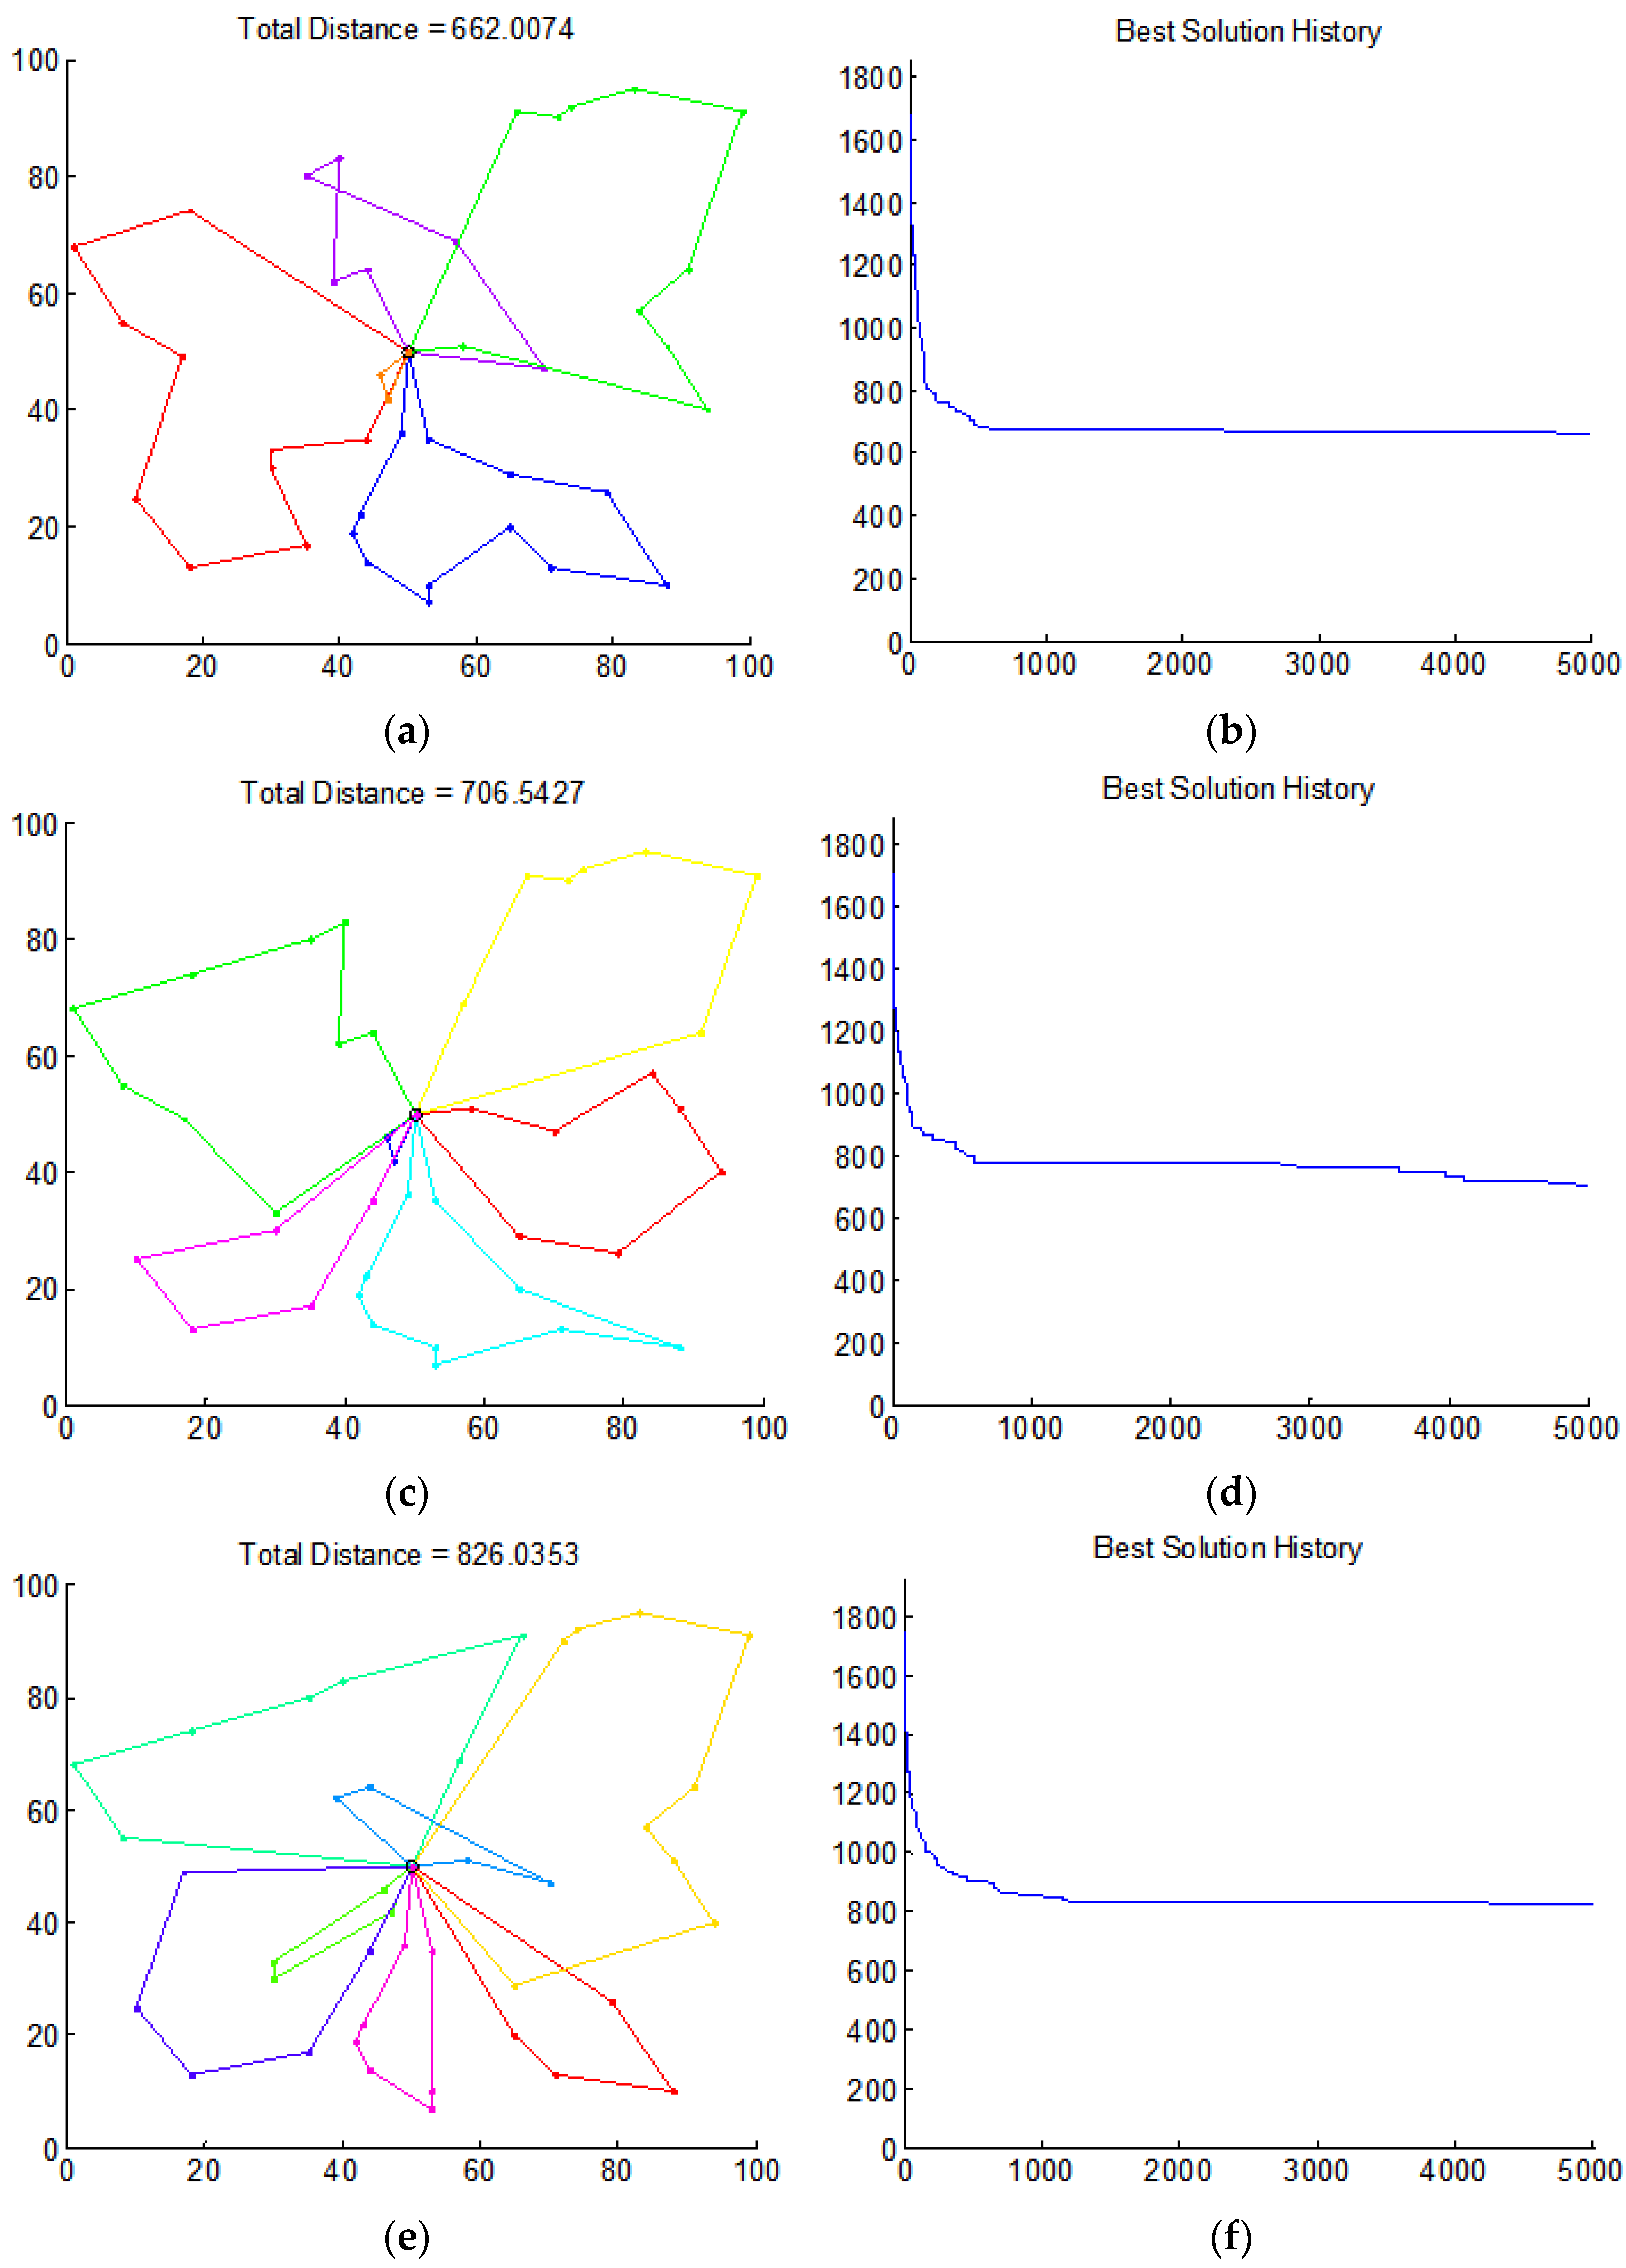
Figure 7 gives the results when the simple GA with an elitist’s strategy was used. For 20 random runs, the generated total path length can be shorter, but the result was unpredictable. For five vehicles, the shortest path is 662.00 km, but it is an infeasible solution. One of the vehicles only distributes to two demand nodes, while another vehicle distributes to 12 demand nodes, exceeding the maximum load limit of the vehicle. For the case of six and seven vehicles, the solutions are also infeasible due to violation of the constraints. There are many intersecting routes and infeasible solutions are often produced.
The experiments show that the improved GA outperforms the simple GA for the MVRP, the proposed MVRP mathematical model is practical, and the solution found using the improved GA is more reasonable.
5.2. Route Search Using Algorithm 2
Finally, after searching for the optimal distribution sequence, we searched for a shortest route between two demand nodes or between the distribution node and a demand. As an illustration of Algorithm 2, we give a simple illustration. Objective function 3 was used for the route search.
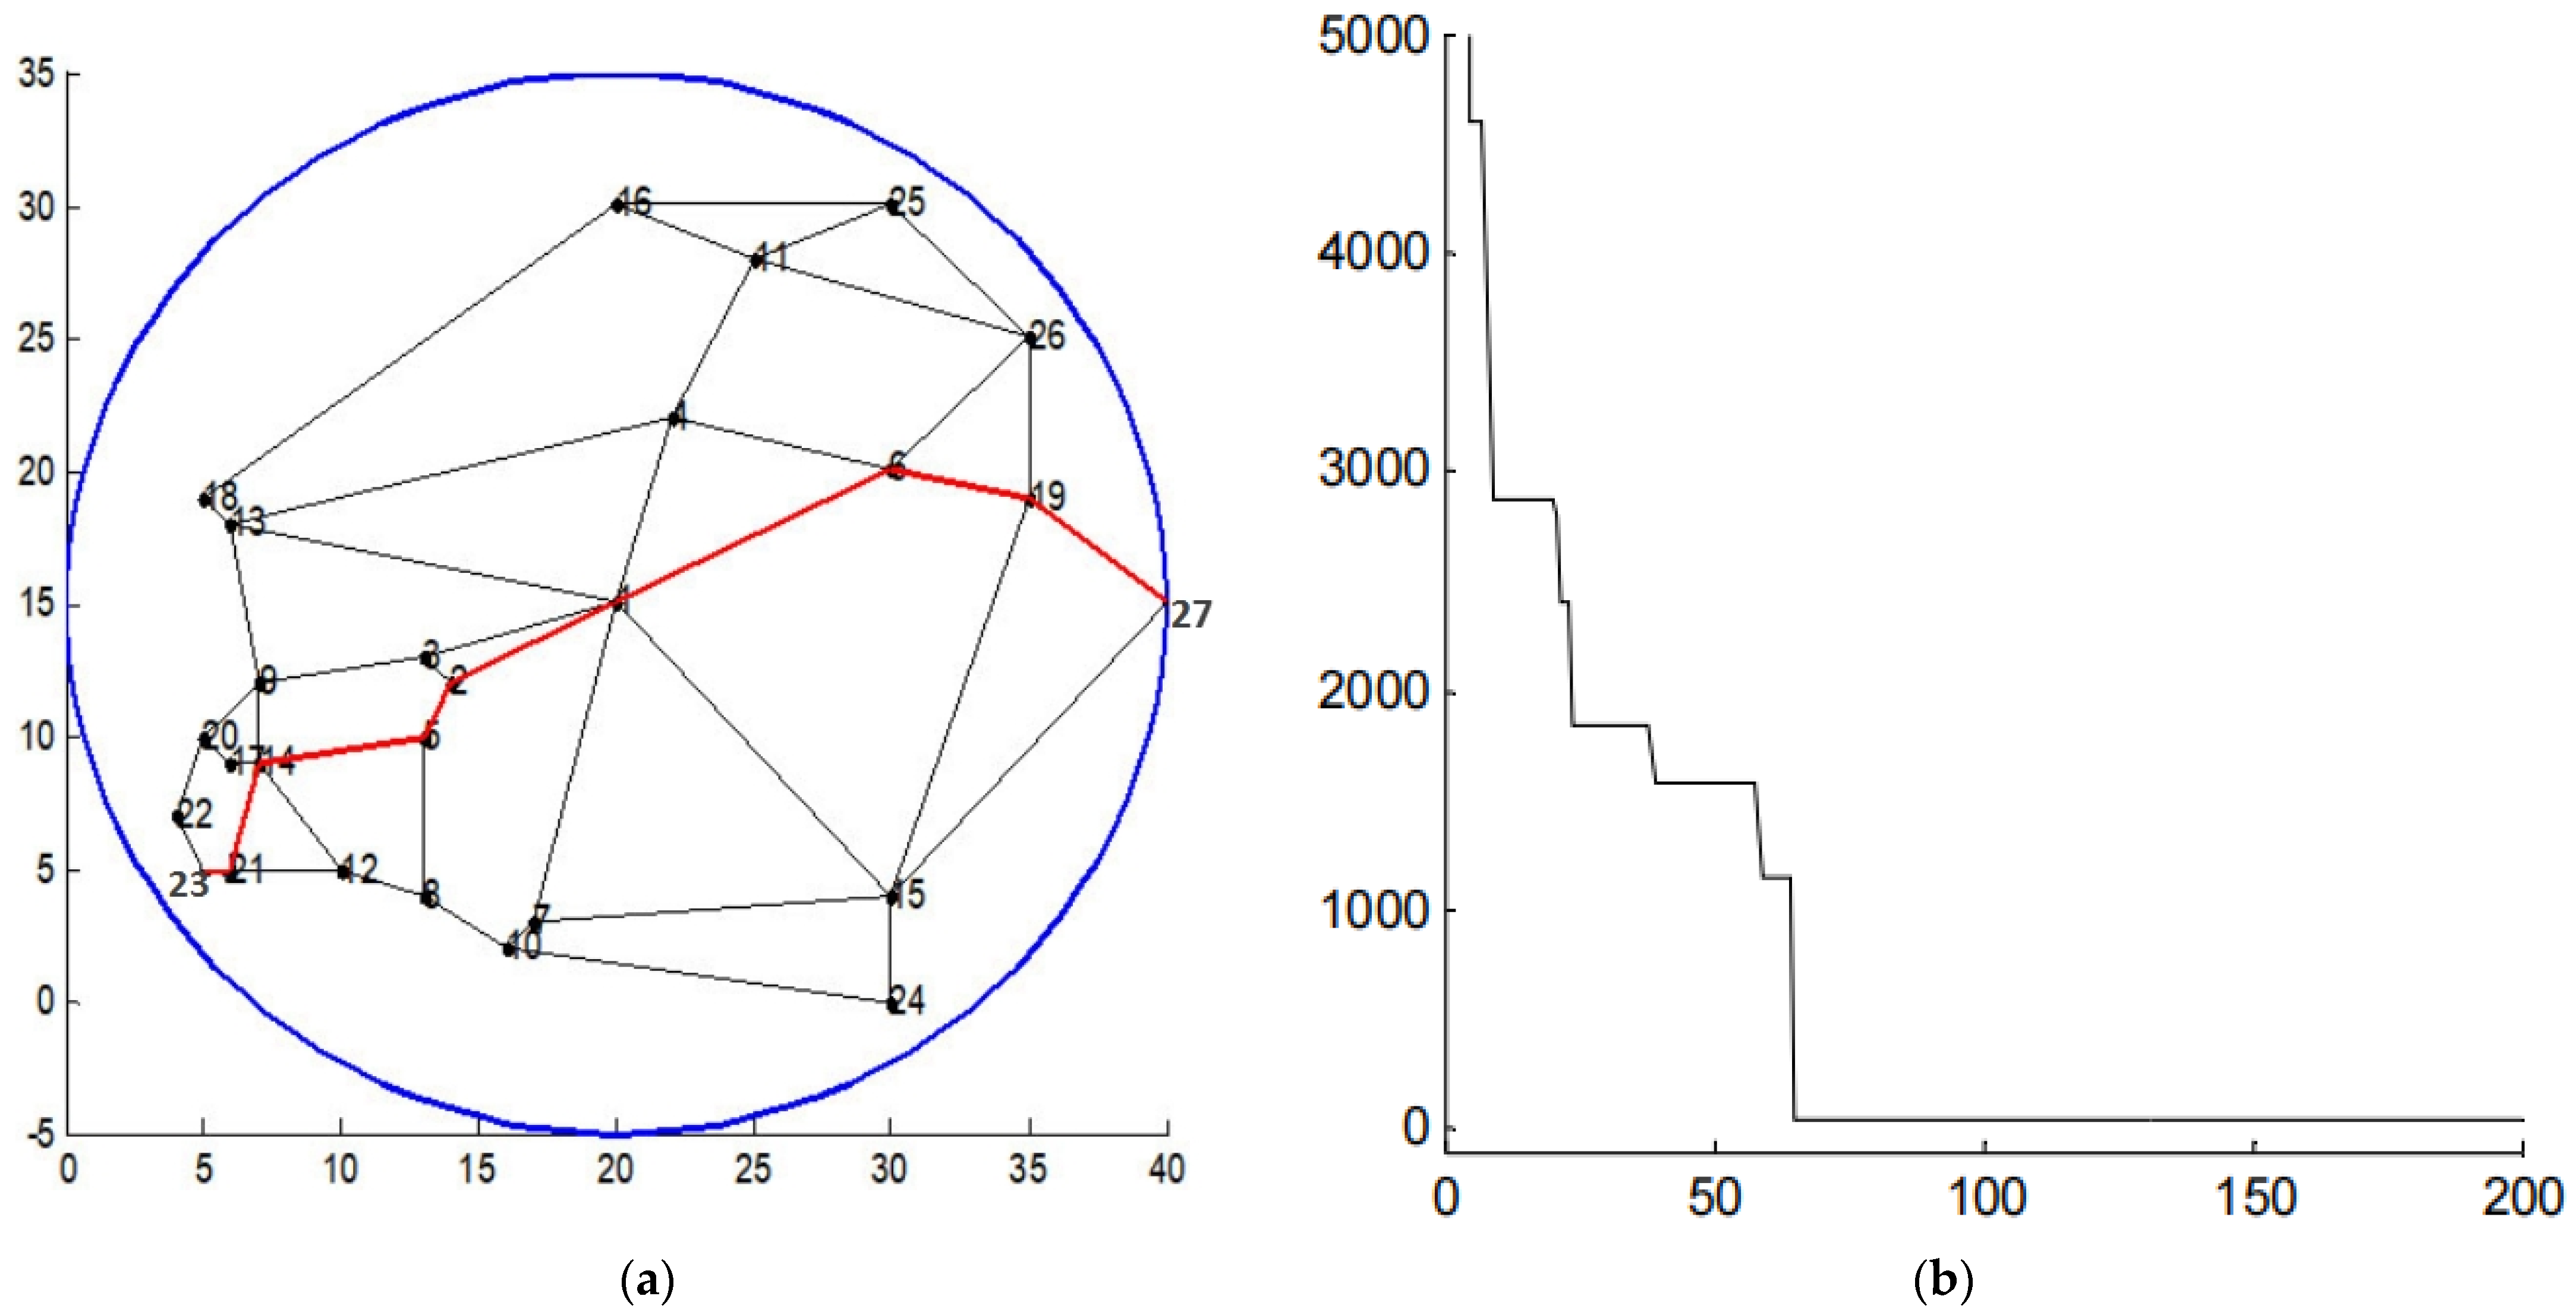
We specified the number of generations , population size , crossover probability , and mutation probability . The optimal path is shown in Figure 8a, where nodes 23 and 27 are demand nodes, the coordinate of node 23 is (5.00, 5.00), and the optimal path is 23-21-14-5-2-1-6-19-27; Figure 8b shows the optimal path is obtained at the 62nd generation.
Algorithm 2 is shown to be very effective at searching for an optimal route between two nodes.
6. Conclusions
The MVRP was investigated in this paper. We proposed a mathematical model for the MVRP, based on which the optimal distribution route for multiple vehicles was searched. Using the proposed improved GA combined with our unique divide-and-conquer strategy, we verified the feasibility and rationality of the model in search of the optimal solution to the MVRP. Applying a roulette wheel selection and elitist’s strategy, preprocessing of the infeasible individuals, and well-designed crossover and mutation operators, the improved GA accelerated the convergence to the optimal solution, when compared with the simple GA. The performance of the improved GA combined with the divide-and-conquer strategy was validated when solving the distribution path optimization of a manufacturer and 40 demand nodes. In the future, we will compare our method with some state-of-the-art algorithms.
Author Contributions
Conceptualization, J.L. and Y.W.; methodology, J.L., Y.W. and K.-L.D.; software, J.L. and Y.W.; writing—original draft preparation, J.L.; writing—review and editing, K.-L.D.; supervision, K.-L.D.; project administration, K.-L.D.; funding acquisition, K.-L.D. All authors have read and agreed to the published version of the manuscript.
Funding
This work was funded by the National Natural Science Foundation of China under Grant no. 51475434.
Data Availability Statement
All data included in the main text.
Acknowledgments
The authors would like to thank the anonymous reviewers for their constructive comments, which improve the manuscript.
Conflicts of Interest
The authors declare no conflict of interest.
References
- Fisher, M.L.; Jaikumar, R. A Generalized Assignment Heuristic for Vehicle Routing. Networks 1981, 11, 109–124. [Google Scholar] [CrossRef]
- Dantzig, G.B.; Ramser, R.H. The Truck Dispatching Problem. Manag. Sci. 1959, 6, 80–91. [Google Scholar] [CrossRef]
- Ochelska-Mierzejewska, J.; Poniszewska-Maranda, A.; Maranda, W. Selected Genetic Algorithms for Vehicle Routing Problem Solving. Electronics 2021, 10, 3147. [Google Scholar] [CrossRef]
- Sabar, N.R.; Bhaskar, A.; Chung, E.; Turky, A.; Song, A. A Self-adaptive Evolutionary Algorithm for Dynamic Vehicle Routing Problems with Traffic Congestion. Swarm Evol. Comput. 2019, 44, 1018–1027. [Google Scholar] [CrossRef]
- Goeked, D.; Schneider, M. Routing a Mixed Fleet of Electric and Conventional Vehicles. Eur. J. Oper. Res. 2015, 245, 81–99. [Google Scholar] [CrossRef]
- Macrina, G.; Pugliese, L.D.P.; Guerriero, F.; Laporte, G. The Green Mixed Fleet Vehicle Routing Problem with Partial Battery Recharging and Time Windows. Comput. Oper. Res. 2018, 101, 183–199. [Google Scholar] [CrossRef]
- Hiermann, G.; Hartl, R.F.; Puchinger, J.; Vidal, T. Routing a Mix of Conventional, Plug-in Hybrid, and Electric Vehicles. Eur. J. Oper. Res. 2019, 272, 235–248. [Google Scholar] [CrossRef] [Green Version]
- Goodarzi, A.H.; Zegordi, S.H.; Alpan, G.; Kamalabadi, I.N.; Kashan, A.H. Reliable Cross-docking Location Problem Under the Risk of Disruptions. Oper. Res. 2021, 21, 1569–1612. [Google Scholar] [CrossRef]
- Gelareh, S.; Glover, F.; Guemri, O.; Hanafi, S.; Nduwayo, P.; Todosijevic, R. A Comparative Study of Formulations for a Cross-dock Door Assignment Problem. Omega 2020, 91, 102015. [Google Scholar] [CrossRef]
- Gunawan, A.; Widjaja, A.T.; Vansteenwegen, P.; Yu, V.F. A Matheuristic Algorithm for the Vehicle Routing Problem with Cross-docking. Appl. Soft Comput. 2021, 103, 107163. [Google Scholar] [CrossRef]
- Chen, J.-S.; Pan, J.C.-H.; Lin, C.-M. A Hybrid Genetic Algorithm for the Re-entrant Flow-shop Scheduling Problem. Expert Syst. Appl. 2008, 34, 570–577. [Google Scholar] [CrossRef] [Green Version]
- Ning, T.; An, L.; Duan, X. Optimization of Cold Chain Distribution Path of Fresh Agricultural Products Under Carbon Tax Mechanism: A Case Study in China. J. Intell. Fuzzy Syst. 2021, 40, 10549–10558. [Google Scholar] [CrossRef]
- Chen, W.T.; Hsu, C.-I. Optimal Scheduling for Multi-temperature Joint Distribution Under Carbon Tax. Int. J. Oper. Res. 2019, 16, 45–62. [Google Scholar] [CrossRef]
- Ticha, H.B.; Absi, N.; Feillet, D.; Quilliot, A.; Woensel, T.V. A Branch-and-Price Algorithm for the Vehicle Routing Problem with Time Windows on a Road Network. Networks 2019, 73, 401–417. [Google Scholar] [CrossRef]
- Jabir, E.; Panicker, V.V.; Sridharan, R. Design and Development of a Hybrid Ant Colony-variable Neighbourhood Search Algorithm for a Multi-depot Green Vehicle Routing Problem. Transp. Res. Part D 2017, 57, 422–457. [Google Scholar] [CrossRef]
- Fernández, E.; Mireia, R.-R.; Speranza, M.G. The Shared Customer Collaboration Vehicle Routing Problem. Eur. J. Oper. Res. 2018, 265, 1078–1093. [Google Scholar] [CrossRef] [Green Version]
- Hernandez, F.; Gendreau, M.; Jabali, O.; Rey, W. A Local Branching Metaheuristic for the Multi-vehicle Routing Problem with Stochastic Demands. J. Heuristics 2019, 25, 215–245. [Google Scholar] [CrossRef]
- Hu, C.; Lu, J.; Liu, X.; Zhang, G. Robust Vehicle Routing Problem with Hard Time Windows Under Demand and Travel Time Uncertainty. Comput. Oper. Res. 2018, 94, 139–153. [Google Scholar] [CrossRef]
- Masmoudi, M.A.; Hosny, M.; Koc, C. The Fleet Size and Mix Vehicle Routing Problem with Synchronized Visits. Transp. Lett. 2021, 14, 427–445. [Google Scholar] [CrossRef]
- Marinakis, Y.; Marinaki, M.; Migdalas, A. Variants and Formulations of the Vehicle Routing Problem. In Open Problems in Optimization and Data Analysis; Pardalos, P., Migdalas, A., Eds.; Springer Optimization and Its Applications; Springer: Cham, Switzerland, 2018; Volume 141, pp. 91–127. [Google Scholar] [CrossRef]
- Du, K.-L.; Swamy, M.N.S. Neural Networks in a Softcomputing Framework; Springer: London, UK, 2006. [Google Scholar] [CrossRef]
- Du, K.-L.; Swamy, M.N.S. Search and Optimization by Metaheuristics; Springer: New York, NY, USA, 2016. [Google Scholar] [CrossRef]
- Barbulescu, L.; Howe, A.E.; Whitley, L.D.; Roberts, M. Understanding Algorithm Performance on an Oversubscribed Scheduling Application. J. Artif. Intell. Res. 2006, 27, 577–615. [Google Scholar] [CrossRef]
Figure 1.
MVRP with a valid solution.

Figure 2.
Determination of the search center and search radius.

Figure 3.
Determination of the search radius. (a) When node 3 is out of search range, and (b) The new search range.
Figure 3.
Determination of the search radius. (a) When node 3 is out of search range, and (b) The new search range.

Figure 4.
Search range for a distribution path.

Figure 5.
The coordinates of the demand nodes. The - and -coordinates correspond to a position on a map.
Figure 5.
The coordinates of the demand nodes. The - and -coordinates correspond to a position on a map.

Figure 6.
The distribution sequence, using the improved GA, (a,b) for 5 vehicles, (c,d) for 6 vehicles, and (e,f) for 7 vehicles. For (a,c,e), the - and -coordinates correspond to a position on a map. For (b,d,f), the -coordinate corresponds to the number of generation, and the -coordinate corresponds to the total distance in km.

Figure 7.
Distribution sequence, using the simple GA, (a,b) for 5 vehicles, (c,d) for 6 vehicles, and (e,f) for 7 vehicles. For (a,c,e), the - and -coordinates correspond to a position on a map. For (b,d,f), the -coordinate corresponds to the number of generation, and the -coordinate corresponds to the total distance in km.

Figure 8.
Distribution path (a) and the optimization curve (b). For (a), the - and -coordinates correspond to a position on a map. For (b), the -coordinate corresponds to the number of generations, and the -coordinate corresponds to the total route length in km.
Figure 8.
Distribution path (a) and the optimization curve (b). For (a), the - and -coordinates correspond to a position on a map. For (b), the -coordinate corresponds to the number of generations, and the -coordinate corresponds to the total route length in km.


Table 1.
The coordinates and demand quantities of the demand nodes.
| No. | (km) | (km) | Demand ( pcs) | No. | (km) | (km) | Demand ( pcs) |
|---|---|---|---|---|---|---|---|
| 0 | 50 | 50 | no | 21 | 88 | 51 | 0.3 |
| 1 | 47 | 42 | 8.1 | 22 | 65 | 29 | 8.4 |
| 2 | 79 | 26 | 9 | 23 | 44 | 64 | 9.3 |
| 3 | 99 | 91 | 1.2 | 24 | 91 | 64 | 6.7 |
| 4 | 30 | 33 | 9.1 | 25 | 74 | 92 | 7.5 |
| 5 | 65 | 20 | 6.3 | 26 | 1 | 68 | 7.4 |
| 6 | 53 | 10 | 0.9 | 27 | 53 | 35 | 3.9 |
| 7 | 40 | 83 | 2.7 | 28 | 44 | 35 | 6.5 |
| 8 | 83 | 95 | 5.4 | 29 | 58 | 51 | 1.7 |
| 9 | 53 | 7 | 9.5 | 30 | 88 | 10 | 7.0 |
| 10 | 35 | 17 | 9.6 | 31 | 49 | 36 | 0.3 |
| 11 | 72 | 90 | 1.5 | 32 | 71 | 13 | 2.7 |
| 12 | 35 | 80 | 9.7 | 33 | 39 | 62 | 0.4 |
| 13 | 57 | 69 | 9.5 | 34 | 84 | 57 | 0.9 |
| 14 | 43 | 22 | 4.8 | 35 | 30 | 30 | 8.2 |
| 15 | 44 | 14 | 8.0 | 36 | 17 | 49 | 6.9 |
| 16 | 46 | 46 | 1.4 | 37 | 10 | 25 | 3.1 |
| 17 | 94 | 40 | 4.2 | 38 | 18 | 74 | 9.5 |
| 18 | 42 | 19 | 9.1 | 39 | 18 | 13 | 0.3 |
| 19 | 66 | 91 | 7.9 | 40 | 8 | 55 | 9.5 |
| 20 | 70 | 47 | 6.5 | Total | 224.9 |
Publisher’s Note: MDPI stays neutral with regard to jurisdictional claims in published maps and institutional affiliations. |
© 2022 by the authors. Licensee MDPI, Basel, Switzerland. This article is an open access article distributed under the terms and conditions of the Creative Commons Attribution (CC BY) license (https://creativecommons.org/licenses/by/4.0/).
Share and Cite
MDPI and ACS Style
Li, J.; Wang, Y.; Du, K.-L. Distribution Path Optimization by an Improved Genetic Algorithm Combined with a Divide-and-Conquer Strategy. Technologies 2022, 10, 81. https://0-doi-org.brum.beds.ac.uk/10.3390/technologies10040081
AMA Style
Li J, Wang Y, Du K-L. Distribution Path Optimization by an Improved Genetic Algorithm Combined with a Divide-and-Conquer Strategy. Technologies. 2022; 10(4):81. https://0-doi-org.brum.beds.ac.uk/10.3390/technologies10040081
Chicago/Turabian StyleLi, Jiaqi, Yun Wang, and Ke-Lin Du. 2022. "Distribution Path Optimization by an Improved Genetic Algorithm Combined with a Divide-and-Conquer Strategy" Technologies 10, no. 4: 81. https://0-doi-org.brum.beds.ac.uk/10.3390/technologies10040081
Note that from the first issue of 2016, this journal uses article numbers instead of page numbers. See further details here.