
Digitization of Manufacturing Processes: From Sensing to Twining


Laboratory for Manufacturing Systems and Automation (LMS), Department of Mechanical Engineering and Aeronautics, University of Patras, 26504 Rio Patras, Greece
Technologies 2022, 10(5), 98; https://0-doi-org.brum.beds.ac.uk/10.3390/technologies10050098
Submission received: 16 July 2022
/
Revised: 17 August 2022
/
Accepted: 25 August 2022
/
Published: 30 August 2022
(This article belongs to the Special Issue Advances and Innovations in Manufacturing Technologies)
Abstract
:Zero-defect manufacturing and flexibility in production lines is driven from accurate Digital Twins (DT) which monitor, understand, and predict the behavior of a manufacturing process under different conditions while also adapting to them by deciding the right course of action in time intervals relevant to the captured phenomenon. During the exploration of the alternative approaches for the development of process twins, significant efforts should be made for the selection of acquisition devices and signal-processing techniques to extract meaningful information from the studied process. As such, in Industry 4.0 era, machine tools are equipped with embedded sensors that give feedback related to the process efficiency and machine health, while additional sensors are installed to capture process-related phenomena, feeding simulation tools and decision-making algorithms. Although the maturity level of some process mechanisms facilitates the representation of the physical world with the aid of physics-based models, data-driven models are proposed for complex phenomena and non-mature processes. This paper introduces the components of Digital Twin and gives emphasis on the steps that are required to transform obtained data into meaningful information that will be used in a Digital Twin. The introduced steps are identified in a case study from the milling process.
1. Introduction
Zero-defect manufacturing, sustainability in production lines, process performance optimization (take the most from the equipment), the integration of advanced and complex manufacturing processes in the production lines (additive manufacturing, hybrid manufacturing, robotized machining etc.) and the interest of the industrial world for high flexibility and reduced ramp up time for the production of new products are factors that drive the Research and Development (R&D) activities of industries. Market uncertainty and low-volume customized production are just two more reasons why industrial firms around the world are interested to make their manufacturing lines more flexibly digitalized [1]. Flexibility is one of the key building blocks to achieve reconfigurability and, thus, resilience to external disruptions [2]. The challenging events that have taken place in the last years have made crystal clear that resilience to external disruptions should be the key goal for manufacturing firms, in order for them to survive the previous and coming crises. Digitalization is an enabler for flexibility, since it can support the seamless integration of flexible production modules, as well as their rapid reconfiguration. The successful adoption of innovative solutions determines the adaptability and the success of production lines [1,2,3]. The current software solutions, the enormous computational power that support data analytics and signal processing, as well as the continuously increasing quality of hardware solutions (e.g., miniaturization of sensors and electronics, edge computing devices, etc.) that facilitate signal capturing irrespective from the phenomenon are factors that are capable of contributing to this direction and also assist the implementation of digital manufacturing.
The aforementioned consist of the pillars for the development of Digital Twins (DT) and they have been under intensive research the last decade and especially during the COVID-19 pandemic crisis where agility and flexibility of production lines was required [4]. A Digital Twin is the digital and computerized representation of a physical object, and it is capable of predicting how an entity, product, or process will operate after a number of changes on inputs variables. Digital Twin is at the frontline of the fourth industrial revolution, and through the development of a linked physical and virtual twin, the Digital Twin will address the challenges of seamless integration between Internet of Things (IoT) and advanced data analytics. Since Digital Twin is a term that includes many different components, various interpretations of the term have emerged, based on the use cases in which they are employed [5]. To this end, different architectures are designed, varying based on the area of applications and the expected benefits. By mentioning the link between physical and digital-virtual world, it is crucial to see the importance of sensing devices and edge modules on the signal capturing and data exchange. The latter consist of challenging issues for the industrial, research, and academic world since they determine the success of Digital Twins and the accurate representation of the physical world. In [6], the challenges are classified according to their relation to the physical or virtual world as well as their relation to data exchange layer. In every area, the uncertainty due to the involvement of different sub-systems and different sensing devices due to the noise environment is quantified. Based on the application or the studied system, a threshold is set that determines when an uncertainty range is acceptable. In very detailed and accurate applications, the sensors and data acquisition devices are selected to keep the uncertainty within the acceptable range. It is common practice to calibrate the sensing devices in time intervals specified from the sensor manufacturer to provide the desired accuracy. In applications where the sensing devices are exposed in difficult conditions, the uncertainty of the measurement is considered in the decision-making process.
Therefore, this work aims to study the steps that are required for the successful implementation of a Digital Twin, including the steps for signal processing and information extraction aiming to go from the sensing layer and the data acquisition to the actual twin of a manufacturing process. In order to achieve that, the rest of the document is structured as follows (Figure 1).
In the remainder of Section 1, the different definitions of Digital Twin are mentioned, introducing its main components and its different applications in manufacturing processes. In Section 2, the components comprising a DT are described in detail to move on from the requirements of sensing to the functionalities of twinning. In Section 3, all the steps that are mentioned in the previous section are applied in a real-life case study implemented in the milling process while the conclusions are stated in Section 4.
1.1. Digital Twin Definitions
Although in literature there are different definitions of Digital Twins, in each one there are some basic components that drive its functionalities. These components are the physical layer, the digital layer, and the data exchange between these two [5]. Additionally, the sensing layer and the data processing layer contribute to the acquisition of data and the extraction of meaningful information aiming to connect the physical and digital parts. These entities constitute the pillars of Digital Twins irrespective of the studied item [7]. In the following paragraph, the most used definitions are introduced.
Shafto et al. [8] and Glaessgen et al. [9] in 2010 provided a detailed, broadly acknowledged and most commonly used definition of Digital Twin (DT) as an “Integrated multi-physics, multi-scale, probabilistic simulation of a system/machine that uses the best available physical models, sensors update etc., to mirror the life of its corresponding twin”. Grieves and Vickers [10], in 2017, defined the DT as a three-part system that includes a physical object, a virtual representation of that object, and two-way data exchange from the physical to the virtual world. This data flow is envisioned as a cycle, aiming to mirror the two states; linking physical and digital states, transmitting data from physical to digital, and giving feedback from virtual to physical. Virtual spaces comprise of several modules that enable operations such as modelling, testing, and optimization [8,9], without the requirement for real life data. The latest definition that has been introduced from Stark and Damerau [11] in 2019 mentions that a Digital Twin is a “digital representation of an active unique product/product service system that comprises its selected characteristics, properties, conditions and behaviours by means of models, information, and data within a single or even across multiple life cycle phases”. In the same year, Tao et al. [12] mentioned also that anything from a single machine or equipment and a production line to a production floor or a whole part can be represented as Digital Twin.
The term “Digital Twin” is a broad term referring to the seamless integration of data between physical and virtual machines in any direction while it consists of a virtual representation of a production system that is able to run on different simulation disciplines, characterized by the synchronization between the virtual and real system, thanks to sensed data and connected smart devices, mathematical models, and real time data elaboration [13]. The data aspect is defined as the most important aspect of the Digital Twin, enabling the real time representation of its physical object and the representation accuracy. The mentioned definitions and the extracted Digital Twin components are depicted in Figure 2.
1.2. Applications of Digital Twins in Manufacturing Processes
From the different examples that are presented below, the key applications of Digital Twins in manufacturing processes are identified (Figure 3) as well as the syntactic components of DTs. The different components of Digital Twins are analyzed in detail in Section 2. Manufacturing depends on equipment that has the potential to generate large datasets either with embedded sensors or with external sensors, giving awareness about the key performance indicators of a process while enabling the development of digital-virtual representation of the actual process. These data can provide optimization directions, train predictive models, investigate critical conditions either for the machine or manufactured part, as well as validate the production planning and the planned resources etc. Each one of these functionalities is under research since the benefits that may arise on the production line are considerable and the industries have identified great potentials for the recent future. The following paragraphs introduce some of the key applications of DTs in manufacturing processes via examples that have been identified in literature. As it can be seen in Figure 3, in order to build an accurate DT, it is important to exchange data with all the different layers of a production. Therefore, the same is true for DTs at the manufacturing process level.
Cvetkov et al. [14] described a strategy that is common in industries (e.g., automotive, manufacturing sector etc), where virtual test benches are developed by taking advantage of the faithful representation of the physical layer with a virtual one to simulate different aspects of the performance and behaviour of the under-investigation part/process/phenomenon. In manufacturing processes and manufacturing industry, Digital Twins are test benches where different process variables are examined in a virtual environment, indicating the optimum combination of values in relation to the desired output. The output criteria/indicators can be the energy consumption, production planning, quality etc., [15]. Pastras et al. [15,16] developed a digital representation of laser welding and laser drilling processes by taking advantage of physics-based models for each of the processes, simulating how the process variables can affect the energy consumption and the process efficiency. The models have been validated with experimental work, ensuring accurate and trustful predictions. The outputs of this study have a significant effect on the production planning, considering that the manufacturing process could take place according to the energy mix and during non-peak hours, where the cost of electricity is reduced. Similarly, Stavropoulos et al. [17] developed a digital representation of a polymer-based additive manufacturing process aiming to improve the efficiency in terms of energy consumption, the production planning by introducing a build time prediction model, the orders production planning by calculating the mass of the end product including the support structures, while also indicating the areas where excessive material is consumed for the support structure. The feedback from the model could lead to an improved sustainability of the process. In the same work, the sensing layer provided continuous awareness about the machine state via machine health monitoring. Moreover, Chaoyong et al. [18] introduced a model for energy consumption prediction of the milling process by implementing an analytical, physics-based model that considers the characteristics of the relative machine. The developed tool takes input process variables and it predicts the energy consumption of the process, presenting how the energy is divided in the subsystems of the process while providing insight about how the modifications of path planning strategy and cutting speed could affect this value. The aforementioned benefits of virtual test benches are embedded in the works of Aksarayli et al. [19] and Vidrova et al. [20], which mention how machine-process-dependent simulations can contribute to the overall optimization of manufacturing processes and production lines.
In an era where industries are interested to release new products before the competition with reduced environmental footprint and to promote efficient processes, the successful representation of the virtual world with the physical one and the data exchange among them is vital in order to get an insight about the effects of different parameters on key performance indicators without any waste of resources. Towards this direction, DTs can be used to match part quality requirements with process capabilities. The manufacturability of parts in terms of shape accuracy and structural defects can be evaluated with the aid of Digital Twins and the included virtual representation. Especially in manufacturing processes, such as additive manufacturing or welding, where the part conformity is highly dependent on the proper selection of process inputs, the design phase cannot be agnostic to the manufacturing decisions. The integration of an iterative cycle between the manufacturing process DT and part design can ensure that the intended design and functionalities of the part can be achieved by the selected manufacturing technology. On the other hand, the required additional features for the manufacturing of the part with conventional and additive manufacturing processes are indicated and optimized with the aid of accurate DTs. Benjamin et al. [21] introduced a framework for a DT where the designed part is examined in terms of manufacturability with the aid of an integrated model that suggests design modifications so as to take the most from the process mechanism and the machine tool capabilities. Zhang et al. [22] and Lim et al. [23] presented examples from the production lines where the Digital Twin-based design process had a direct influence on the quality of the final part.
The term “Digital Twin” encompasses not only end-part digitization, but also the digitization of the plant, production system, and equipment. DT supports businesses in simulation and testing before starting production while synchronously improving the entire process to determine how process parameters can impact production and thereby increase the flexibility and productivity [24]. Zhang et al. [25] presented a Digital Twin system aiming to test and control the whole production planning from the design process until the actual manufacturing process and the orders planning of an assembly of parts [26]. By tracking each process and production phase separately, the whole production line was tracked. Rosen et al. [27] presented a novel architecture that introduces improved capabilities in terms of orders planning based on statistical assumptions, improving decision support by means of detailed diagnosis, and automatic planning and execution of orders by the manufacturing units.
The acquired data from all the subsystems of a machine or a group of machines are used as inputs for data analytics, evaluating the machine status while predicting the expected lifecycle of the different components of the machine [28]. An interesting approach was proposed by Susto et al. [29] that copes effectively with unbalanced datasets that occur in maintenance classification task where regular production findings vastly outnumber abnormal/faulty production observations. Moreover, D’Addona et al. [30] developed data-driven tools that use real-time multi-sensorial data in order to correlate them with cutting tool wear and indicate possible malfunction. Finally, Magargle et al. [31] and Lee et al. [32] introduced an approach based on data analytics for monitoring, diagnosis, and prognosis of a machine, achieving better transparency of a machine’s health condition; while Uhlemann et al. [33] developed a multi-modal data acquisition approach based on Digital Twin model for efficient manufacturing process evaluation and planning. This approach contributed to the reduction of acquisition time for the relevant process information.

The aforementioned examples described applications of the different components of DT in the manufacturing sector. Below, some attempts for the development of complete Digital Twin systems in manufacturing processes are presented. These works are discussed in terms of adaptability, time of execution, and required inputs-outputs. Maskery et al. [34] presented a Digital Twin concept in metal-based additive manufacturing processes, which was developed based on sensing data and data analytics, mapping the effect of process inputs on process outputs with the aid of metrology devices and non-destructive testing. Due to the complexity of the process physics, the physics-based models are neither available nor validated for the prediction of stresses and intrinsic defects for the metal-based AM processes. Gaikward et al. [35] developed a machine-learning model utilizing images from vision cameras and data from temperature sensors to feed models that evaluate the process performance and indicate the possibility of defects in terms of cracks and porous. Moreover, Hanel et al. [36], in their study relative to milling process, created a Digital Twin approach with a significant amount of process inputs for the manufacturing of aerospace components. The developed model includes mathematical techniques and signal-processing algorithms for the selection of optimum process parameters, relying on process data. Kechagias et al. [37] presented an interesting approach for the modelling of CO2 laser cut of PMMA. In this model, machine learning algorithms were used to map the effect of process variables on the geometrical characteristics of the final part, aiming to predict in future processes the appropriate values of process variables to have the desired kerf geometry. The dimension of the final part is obtained on the metrology stage and the data is fed to the algorithm for future processes. DT is at the top of interests these days in the industrial environment and more and more experiments can be identified. However, these examples introduced the components of DT that are elaborated in Section 3.
2. Digital Twin Syntactic Components
Digital Twin can be considered as a system with embedded tools that are used for achieving cost-effective and resource-efficient (digitally enabled) optimization through closed-loop control of the physical system [38]. This section aims to introduce the syntactic components of a Digital Twin. These components are the physical layer, sensing and data layer, communication layer, virtual-digital layer, as well as the decision-making layer and control. Each one of the components are described in the following paragraphs.
2.1. Physical Layer
Digital Twin systems are widely used for process performance characterization and control. As an example, DT systems are used for dynamic cutting tool position compensation, chatter detection, and control in milling processes, while in additive manufacturing processes the heat-affected zone is measured with monitoring devices and laser power and material feed control activities are performed. From the aforementioned examples, it is determined that the physical asset is the actual phenomenon/process/mechanism that will be represented digitally, as well as the data source and the feedback receiver after decision making and control activities. Any action relies on the deep understanding of the process mechanism that will guide the selection of the monitoring devices to measure key physical quantities such as temperature, vibrations, energy consumption, current etc., and finally after data processing to provide feedback for corrective actions while improving the user awareness and the overall knowledge related to the process. The corrective actions should be relying also on the effect of process variables on key performance metrics such as defects, thermal stresses, and surface quality. In the next section, the second layer of DT is mentioned, which represents the space where the data from different sources are gathered, manipulated, and processed with algorithms so as to extract useful information for the virtual-digital layer. All the different layers of the Digital Twin are depicted in Figure 4.
2.2. Sensors, Data Acquisition and Information Extraction
Data acquisition, data manipulation, and data processing are critical steps towards the effective and accurate real-time or near real-time monitoring of the physical object [43]. In Industry 4.0 era, data acquisition techniques and sensing technologies in the field of manufacturing are evolving rapidly. Linking and coupling of control systems with cloud technologies enable storage and processing of massive amounts of data from the physical counterpart of the Digital Twin. In manufacturing processes, the accurate reflection of the physical system to the virtual replica is being enabled through the integration of process-related information. The process information includes the process variables and the process data that are obtained from a variety of sensors integrated to the physical entity, providing information related to process performance and machine status.
Digital Twins take feedback from inline and out-of-line sensing devices either for calibration purposes or to feed decision support and control algorithms. In-situ sensors are used for comparing predictions from the virtual replica with the physical system while providing real-time feedback from the physical world to the digital world. Non-Destructive Testing (NDT) and Destructive Testing (DT) techniques are used for part quality examination, aiming to create a map between process inputs and process outputs, increasing the awareness of engineers the contribute to knowledge generation. By correlating the process inputs, performance indicators, and process outputs, the obtained data from sensor devices can be transformed to meaningful information about the quality of the end product during the process. Data-driven models can be used for that purpose. However, the engineer should select the appropriate sensors that are capable to capture the phenomenon of interest. This is the most fundamental and crucial step when building the sensing layer that will feed a Digital Twin. There are no signal-processing and data-mining techniques that can compensate for a poor sensing layer design. The proper design of the sensing layer comprises of its ability to capture the physical mechanisms of the phenomenon of interest, in the appropriate length and time scales. This step is far from straightforward and requires deep process understanding. Nevertheless, the existence of a DT can support the design of the sensing layer by providing a test bench for a sensitivity analysis of the quantities that can be sensed, with respect to the variance generated by the phenomenon to be monitored.
Sensors are electronic devices that constitute sensitive materials, which determine the presence of a phenomenon by measuring a physical parameter and convert it into a measurable electrical signal [44]. Based on the requirements for installation, they can be classified as active and passive sensors. Passive sensors take advantage of a particular physical stimulus to work effectively. As an example, the identification of a color with color-identifications sensors relies on the provision of visible light to illuminate the object. This allows the sensor to receive the required physical stimulus. On the other hand, in case of an active sensor, the required physical stimulus is provided from the monitored mechanism itself. As an example, vision systems take advantage of the radiation that is transmitted from the process mechanism, extracting information in a specific format (Figure 5).
Some of the key traditional sensing technologies for the monitoring of machine tool performance and machine state are introduced below alongside with their operating principles [50]. The classification of the different sensors into categories can provide insight regarding the phenomena they can capture. Since there is more than one way to quantify/capture a phenomenon, a sensor should be selected with regards to the range of operation, accuracy-resolution of the received signal, sensitivity, frame rate, total cost, and finally interface-connectivity and documentation. The latter criteria are not directly related to the ability of the sensing layer to measure a phenomenon, but they are of high interest when the industrialization and practicality of the monitoring system are considered.
- Temperature sensors: They are classified based on the operating temperature as low- and high-temperature sensors as well as based on the measurement technique. These sensors can be thermistor, resistance thermometer-resistance temperature detectors (RTDs), thermocouple, pyrometer, thermal cameras etc.
- Mechanical transducers: The sensors that belong in this category are devices that convert energy from one form to another and then to a signal that can be translated to a value based on the operating principle of the sensor.
- ○
- Pressure sensors: They have the ability to capture pressure changes with various ways and transforming them to an electrical signal, which indicates the pressure values. Based on the application and the working principles, they are classified as resonant, capacitive, piezoelectric, etc.
- ○
- Force sensors: They capture the magnitude of the applied forces. These devices can be load cells, strain gauges, force sensing resistors, etc.
- ○
- Flow sensors: These sensors can be electronic, taking advantage of ultrasonic detection of a flow or partially mechanical. Mechanical, electromagnetic, and ultrasonic sensors are used for velocity measurement, while mass flow and positive displacement sensors are proposed for the measurement of the volume/mass that flows within an area.
- ○
- Vibration sensors: They are electronic devices that use micro-electro-mechanical systems (MEMS), piezoelectric or piezoresistive technology to measure the amount and the frequency of vibration of the surface where they are attached. The sensor technology determines the maximum sampling frequency and operating temperature. MEMS are not suitable for frequencies less than 1 kHz.
- Position sensors: These sensors aim to identify the relative position of different bodies or to measure the distance that has been covered from one mechanism or the displacement due to applied loads, etc. They can be eddy current sensors, optical sensors, proximity sensors, capacitive, ultrasonic, potentiometers, laser vibrometers, laser line sensors, laser trackers, etc.
- Vision systems: Visual sensing captures dynamic phenomena that cannot be captured with conventional ways. The wavelength of the emitted light from a surface determines which system should be selected and the spectrum of the measurements can be provided (visible, infrared, hyperspectral). Vision systems are comprised of the sensing element and the optical chain that is integrated after it. This optical chain can include a set of mirrors and lenses that can direct the light emitted by the phenomenon towards the sensing element and filter out unwanted wavelengths, while ensuring that the focal plane of the monitoring system lies on the surface to be measured. The focal length of lens also determines the resolution of the measurement and the applicability in certain processes.
Apart from the traditional sensing devices and applications, significant benefits arise by combining recent research developments related to piezoelectric materials and their unique characteristic to transform mechanical strain and vibration into electrical energy. This utilization of energy could contribute to improve sustainability and the development of a self-sustained sensing layer in different machine tools [55]. In a different application, the information from a computer-tomography (CT) device is used to reconstruct the 3D model of a part, irrespective of the process, comparing the initial design to the actual part. This information is used to extract the manufacturing defects and feed predictive models aiming to improve the accuracy of the respective Digital Twin [56]. Furthermore, by combining the capabilities of modern sensing devices (vision systems) and the developments in the area of machine learning, interesting conclusions can be extracted from the monitoring of an extrusion-based 3D printer [57]. In this particular example, consecutive pictures are processed, extracting information about possible defects in the process. This information is correlated with process variables, creating a map that is used in a process twin system. Finally, in [58], an optic-electronic sensor was used to measure structural vibration instead of the aforementioned mechanical transducers, presenting significant benefits as it regards the equipment cost and positioning in the machine tool.
Based on the latest example and the variety of available sensors, the methodology to select a sensor should be driven from the application and the phenomenon that need to be captured. As an example, in metal-based additive manufacturing processes, the HAZ dimensions constitute a significant process characteristic that should be monitored during the process. The problem statement determines that the HAZ dimensions should be obtained. Cameras that operate in the visible light and thermal cameras can be used for this application, capturing the phenomenon with different ways but providing similar results after processing. The kind of required processing, the additional information that can be provided from sensors, the required calibration, and the working range will determine which sensors suit better each specific application. On top of that, the improved hardware solutions for wireless sensing devices and the improved communication networks give the possibility for wireless, re-chargeable sensors that can be catalytic in applications where the cable routing is difficult, and it should be avoided [59].
2.2.1. Data Acquisition
The output of each sensor determines the characteristics of the device that is used for data acquisition. These devices sample signals that measure physical phenomena and convert them in a digital form to be manipulated by a computer/edge device and software. A typical data acquisition system has multiple channels of signal conditioning circuitry, providing the proper interface between external sensors and the analog-to-digital conversion system. Signal conditioning is an embedded electronic circuit to the acquisition device that prepares the signal to be processed and extract the sensor value. As an example, thermocouple signals provide small voltage levels that have to be amplified before they can be digitized. In another example related to resistance temperature detectors (RTDs), accelerometers, and strain gauges, the sensors must have excitation to operate. These steps are included in signal conditioning.
The physical phenomena that are captured from acquisition devices can be temperature, current, voltage, strain, pressure, vibration, shock loads, displacement, distance, revolute speed, angle, weight etc. Additionally, sound, position, light and images, and linear speed are also considered as measurands. Depending on the sensor, the electrical output may vary between voltage, current, resistance charge, or any other value which is measured over time. As an example, piezoelectric sensors rely on the related material property where electric charge is generated from a material when a mechanical force is applied. The piezoelectric sensors exploit this effect by measuring the voltage across a piezoelectric element generated by the applied forces. On the other hand, the piezoresistive effect relies on the material’s resistivity to alter resistance when it is subjected to a force. In this occasion, the output is a change in electrical resistance of a semiconductor material due to mechanical stress. On top of that, MEMS accelerometers include a seismic mass that is attached to the sensor housing, using the flexibility of the silicon to move back and forth when forces are applied or the body where the sensor attached changes orientation. When the included seismic mass moves, it generates a current flow that can be correlated to the acceleration. The interesting fact about this sensor is that it can be connected to electronic circuits in the same chip using the same manufacturing method. Ceramic and quartz crystal are used commonly for sensing pressure as piezoelectric materials, while piezoresistive effect is found in strain gauges for measuring pressure.
The decisions that are made during this step determine the efforts that are required for signal processing and meaningful information extraction [60]. Synchronized initialization-ending of data acquisition, automated data acquisition, alongside with wireless data acquisition and big data-based acquisition, can be significant attributes of a successive Digital Twin. These attributes may determine the transmission speed, the way that this information is stored locally or in Cloud, as well as the data format that is required based on the stored data for interoperability among the various subsystems of the Digital Twin system and the external environment. The network speed should also considered for the proper communication between the several subsystems. More details about the data formats for appropriate data storage are provided in the following paragraph.
2.2.2. Signal-Data Processing
Having established the type of sensing devices, the next step is to determine the data transmission, storage, and signal-processing techniques to ensure high quality of the data that can be mapped into meaningful outputs. Since large datasets are generated from a machine during its operation, efficient data structures that enable the handling of heterogenous and big size data are required. In the literature, various formats are mentioned such as JSON [61], Avro [62], Protocol Buffers, Parquet, ORC [63], HDF5 [64] etc. Self-describing data are desired to assist the user to extract metadata, which can be process characteristics or other critical information, without the need for any other additional dataset. In addition, since most of the sensing devices give outputs in different formats, the datasets include non-homogenous data, and the data format should enable distinct types of data to be stored within datasets while also enabling data compression, slicing, and filtering, to reduce the memory that is bound in the edge device. To this end, the computational power and time is reduced. The various formats use different ways to structure the data within the file. As an example, in an HDF5 file, the so-called “directories” or “folders” on a computer are called groups, and the files are called datasets. The structured raw data should be processed with advanced techniques to extract its most relevant signals. After signal processing, the data will be analyzed, providing inputs for simulation tools and input for decision-making algorithms, which is the step where the features and the outputs of data analytics are interpreted, and various actions are formulated [65].
Apart from the actual phenomenon that is measured, more often than not, sensed signals contain unwanted parts that are enclosed in the signal in the form of noise. This noise can be generated due to the wiring, the communication channels and data acquisition devices, the mounting points of the sensor, and the surroundings. The different strategies for signal processing target the extraction of features that could point out the state of the machine/process at a specific time instance. In order to group the techniques for signal processing, it is crucial to understand the nature-signature of the phenomena that are studied each time. According to [66], there are three main signature generative mechanisms, namely (a) periodic phenomena, (b) unexpected and transient phenomena (e.g., collision, impact), and (c) response to changes in process and machine state. These phenomena are depicted in Figure 6.
In the first type, the periodic forces during the tool-workpiece engagement in machining can be used as an example. In this case, frequency domain methods (e.g., spectrum analysis) are applied to capture the frequencies of specific tones of the signals, which most of the time can be extracted from the process mechanism. However, when modulation occurs, a periodic signal is modulated by another phenomenon that is also periodic. As an example, we can consider the periodic motion of spindle which modulates the periodic contact of cutting tool-workpiece. Such phenomena are characterized by sidebands in the frequency spectrum. In the second type, the example of a transient signal of the breakage of a cutting tool can be used. A transient signal is generated due to the abrupt change of the state and since the phenomenon creates signals that are spread over a wide range of frequencies, advanced techniques such as time-frequency analysis and wavelet transformation, could be more effective. In the third and last type, the conditions that could create a non-normal excitation of signal are not obvious. Different signals from distinct sources should be studied over time as standalone and be compared to the other so as to extract an indication about the dynamic behaviour of machine components. In this type, the spindle bearing wear is found. The received data after a high number of working hours may differ in a significant way. Sensor drift can influence the quality of the generated data over time. Moreover, the machinery itself can behave differently (e.g., due to change in operating temperature) after several hours of operation, thus distorting the generated signals. The generative mechanisms and the signal analysis domains are introduced in Figure 6.
On the introduced generative mechanisms signatures, four different signal-processing techniques can be applied (Figure 6). These techniques are mentioned below briefly since the scope of this section is to point out the available tools for engineers to provide high-quality data for data analytics and decision making [67].
- The first technique is related to the time domain analysis, where the obtained signal is processed in the time domain without being transformed in a different domain (e.g., frequency domain). The simplest method includes the evaluation of the magnitude and energy of the signal. However, this technique does not incorporate information related to the periodicity of the signal. Related metric forms of this technique are the peak to valley, the average values, the area under the curve, the slope of the curve, the Root Mean Square (RMS), the Crest Factor, the Kurtosis, and the Probability density function of the values. The characteristics of the studied phenomenon determine the metric that can capture it with the desired accuracy; RMS could be used for vibration signals, however, since the phenomenon is related to the frequency of the applied loads, it is not an ideal solution. On the other hand, peak to valley could be used to capture the tool breakage phenomenon, since it is sensitive to impulses such as breakage.
- The second technique refers to the frequency domain, where the spectral analysis can be found. The first step of spectral analysis is to transform the signal into the frequency domain. Since a discrete signal is processed, it is not possible to perform the Fourier Transform analytically. Spectral analysis relies on the Discrete Fourier Transform (DFT), which, alongside with the Fast Fourier Transform (FFT), are the two most frequently used that enable the transformation of a discrete signal in the frequency domain. The key principle of frequency domain analysis lies in the investigation of the distribution of the signal energy among a frequency band. The frequency band to be examined is determined by the phenomenon itself, as well as the sampling capabilities of the sensor and data acquisition system. Since for the machines, a fundamental frequency may exist (rotating speed of a spindle), it is often the spectra to be plotted against multiples (integer of fractional) of this speed, named as orders. This is an order spectrum, and the related analysis is performed on the amplitude and phase of the rotational speed harmonics and then is called as order analysis. Common filtering techniques include highpass, lowpass, bandpass, and bandstop filters, which are applied to the original signal. In this category, various frequency domain algorithms are found such as Cepstrum Analysis, Hilbert Transform, SB ratio, Residual, Bicoherence, Cyclostationarity, etc. Each one of them suits and can apply to different phenomena with very specific frequency specifications of the obtained signal. Cyclostationarity is used so as to point out the periodicity of a signal in the frequency domain.
- The third technique refers to the time frequency methods and it perfect suits phenomena that arise from the process mechanism and machine operation, which produce non-stationary signals whose distribution of energy over frequencies change over time. The periodicity of the changes is not ensured. Overall, the information that is acquired from these methods is related to the distribution in which the frequency changes over time. Some of the included techniques are the Spectrogram, which can be created by performing windowed FFTs on a time-domain signal; the Wavelet Transform (WT); the Wigner Ville Distribution (WVD); and the Choi-Williams Distribution, which aims to capture the behavior of a signal over time. Each one of them processes with a unique way the signal based on the examination of the energy of the signal over time. Moreover, through the demodulation of the signal in the time-frequency domain, it is possible to decouple the portion of the signal that is related to the phenomenon of interest and separate it from the rest of the signal that is related to the normal operation of the process. Several algorithms for signal demodulation have been used for manufacturing applications with the most popular being Wavelet Packet Decomposition (WPD), Empirical Mode Decomposition (EMD) and its optimized versions, as well as Variational Mode Decomposition (VMD).
- Finally, model-based methods are developed explicitly for each one of the studied phenomena aiming to capture the dynamic characteristics of each one. More precisely, they try to utilize and calibrate the model to depict the relationship between different signals of the same machine, with indirect use of sensors, to capture modulations on periodic signals and non-linearities of different phenomena. In this field, the time series analysis, the wideband demodulation, the virtual sensor, the embedded models, etc. are found.

The algorithms and the approaches that were introduced are described in detail in various works. Signal processing and characterization is an ever-evolving field, aiming to achieve a rapid and efficient transformation of raw data into meaningful information [74].
2.3. Virtual-Digital Layer
The virtual asset of a Digital Twin system refers to the faithful replica of the physical entity in the virtual environment. The physical properties, behaviours, constraints, and laws in the physical space are being utilized as the basis to develop accurate and efficient virtual models. These models do not necessarily rely on physics-based models or empirical ones, but also on a combination of them with weight factors and indicators that are used for specific problems, established after extensive experimental work. The position of sensors can be selected with the aid of digital layer, since a map of the developed strains; distortions; oscillation; and change of characteristics such as speed, temperature, and pressure in specific places of a physical system, can be provided. Once a model has been validated, it can generate synthetic data that can be used for knowledge extraction. The data can be fed to data-driven models and improve their predictive potentials. Finally, for indirect monitoring applications, the data from a specific data source can be compared to the data that can be provided from the simulation and give an insight about the process behaviour. A further analysis of the aforementioned follows in the next paragraphs and is summarized in Figure 7.
2.3.1. Physics Based Models
Based on the phenomenon that need to be simulated, different techniques are proposed, considering time efficiency, computational power, accuracy, and expected outcomes. In manufacturing processes, many different physical phenomena occur at the same time, which can be simulated with complex equations that can be solved either numerically or analytically. However, the computational time and the accuracy of the solution determine which of the methods is most suitable.
A significant part of the physics-based models is the determination of the boundary conditions, the discretization of the volume where the equation applies, as well as the time stepping in case of transient analysis. For each one of these parameters, significant studies have been made. Between the time stepping and the discretization, there is strong dependency, since they can affect the convergence of a numerical solution. When implicit time stepping is selected, the convergence criterion should be achieved in the previous time step so as to proceed to the next step of the solution. In a different case, the solution fails. On the other hand, explicit time stepping set an upper limit on the step size to keep stability in the solution. Explicit time stepping is used mostly in problems of high non-linearity, complex changing contact conditions, and other high-speed phenomena. In the area of cutting processes, implicit schemes are recommended when the simulation involves continuous chip formation and noncomplex contact conditions. Explicit schemes are favorable when dealing with complex geometry and contact conditions, such as discontinuous chip formation or in high-speed machining. The time stepping is related directly to the computational time.
Another significant factor is the volume discretization methodology and the related solution of equations. Meshes discretize/divide a continuous geometric space into predictably shaped and mathematically defined elements. The discretization enables computers to numerically solve the governing equations and simulate the physical effects. The mesh quality and size influence the accuracy, convergence, and speed of the simulation process. In order to achieve improved computational performance and considering that the time stepping should be always relevant to the studied phenomenon, adaptive meshing is selected. The reasons are not limited on the computational time but also on the accuracy of the model. Higher accuracy is needed in regions where large gradients or singularities exist, referred to as geometrical singularities such as sharp corner. Moreover, singularities can be point loads that cause stress to approach infinity at that location.
In the case when large plastic deformations are expected, the need for remeshing is increased due to distorted elements that lead to reduced accuracy of the solution. Additionally, remeshing is preferable to capture the chip formation more accurately in a cutting operation. Usually, the remeshing techniques are classified into three categories, namely, the H-adaptivity, P-adaptivity, and R-adaptivity. In the first, the size of the finite elements is changed, normally reducing the size to capture a physical phenomenon more accurately, while in the second, the interpolating polynomials of the finite element are changed to a higher degree, allowing for more accurate representation of gradients in the mesh. In the last one, the nodes are relocated to a more favorable position, thereby reducing the element distortion and increasing the model accuracy.
Highly customized meshing strategies cannot be achieved with commercial software, that’s why self-developed mesh strategies and models are proposed in order to simulate manufacturing processes. However, there are also meshfree modelling techniques such as Monte Carlo trace, Lattice Boltzman Method (LBM), Discrete Element Modelling (DEM), Optimal Transportation Meshfree etc., which establish system algebraic equations for the complete domain of a problem without using a predetermined mesh to spatially divide the domain. Based on the application, the engineer can select the desired method. In both cases, for the differential equation that describes a physical phenomenon, two type of solutions are expected, analytical and numerical. Analytical solutions are solved with rules from algebra and provide an exact solution, while numerical solutions produce approximate results. Sources of error can be the rounding errors, truncation errors, and propagation errors. Euler’s method is the simplest numerical integration method. Additionally, as a numerical method, the Finite Element Method is considered, which subdivides a large space into smaller, with finite elements where the algebraic and differential equations are solved.
Not only the intelligent and advanced meshing techniques can contribute to the reduction of computational time, but also as in any computation, the use of physical insight and process understanding to remove less important variables-phenomena can simplify a solution with little loss of accuracy. As an example, two types of thermo-mechanical couplings are met when simulating mechanical cutting. The adiabatic heating and the complete coupling. The adiabatic thermo-mechanical coupling considers localized heat during the cutting process due to contact (friction) between the two bodies. On the other hand, when a complete thermo-mechanical model is selected, the heat is conducted in the two bodies. Depending on the process and the involved materials, both of them and one of them are true. In a process where there is no time for conduction to take place (high speed process) and in the case of material with low thermal conductivity, which is used as a workpiece material, the adiabatic assumption can be used. However, in the opposite scenario, when a conductive material is used and in a slow-speed process, a completely coupled thermo-mechanical model is preferred. The engineer should select the governance phenomena and decide, otherwise the increased computational time does not guarantee improved model performance.
Physics-based models are a combination of multiple factors for the simulation of a unique phenomenon or for a characteristic of the process. As an example, from the heat transfer simulation, which can be related to additive manufacturing, various numerical methods can be used.
Finite Element Method (FEM) is widely used due to its increased capability of handling high complexity geometries, with/without convective heat transfer or radiation [77,78]. Finite Difference Method (FDM) is commonly preferred for heat and fluid flow analysis [79,80,81,82]. Computational Fluid Dynamics (CFD) method can be used to calculate the bead geometry by tracking the evolution of the deposit geometry’s free surface as well as simulating the cooling effect, the surface tension, and the final shrinkage [79]. Lattice Boltzman method (LBM) and Arbitary Lagrangian-Eulerian (ALE) method are used for predicting void formation, spattering, and surface roughness in addition to temperature fields and deposit geometry [82]. Rosenthal’s heat conduction is utilized for monitoring the heated powder spatial distribution and the melt pool shape [83]. Heat capacity methods are commonly used to estimate phase transitions though the increase of the material’s heat capacity as long as the transition occurs [84,85,86]. Enthalpy formulation shows high applicability on the approximation of the phase transition phenomenon based on an enthalpy–temperature relationship. In other examples, mechanical models are developed to accurately reflect the versatility of the entire physical entity and its structural components, as well as their interactions in order to efficiently simulate their dynamic behaviour [87]. Multi-Body Simulation (MBS) is also used for developing machine tool models by considering the stiffness and damping behaviour of the different bodies [87,88].
To sum up, complex manufacturing processes are often addressed with multiphysics models involving numerical heat transfer, computational fluid dynamics, and computational solid mechanics, as well as thermodynamic, kinetic models, etc. Progress in material behavior simulation as well as the development of efficient computational algorithms and advances in computer hardware and storage devices have increased the ability of complex software to be used for process design and optimization. However, in more complex and non-mature processes such as laser-based processes or additive manufacturing processes, the physics-based simulation of the whole process is much more complex and not a choice, thus, data-driven models are proposed.
2.3.2. Data Driven Models
The complexity of representing processes and phenomena with physics-based models point out the significance of data-driven models that combine information from multiple sources and correlate them with different metrics, creating models that indicate outputs based on inputs [89]. Although, research-wise, the machine learning algorithms have been under investigation for more than 20 years, and only recently, they were applied to the industrial environment in multi-sensor fusion, aiming to study data and extract meaningful information.
Machine leaning algorithms are a topic of great interest for academia as well as for industries, since they do not account for the complexity of the studied phenomenon, depicting hidden relationships between inputs and outputs while being able to adopt different conditions by feeding them with data that always have the same data format from the sources. However, for many researchers the adaptability is considered as the key bottleneck of machine learning algorithms since they always ask for data that become available after/during the process or from validated physics-based simulation. Validation experiments and feedback can be vital to improve the performance of the models. There is a wide range of researchers that investigate the way that each algorithm operates or when supervised or unsupervised learning is appropriate and whether the studied problem requires classification or regression algorithms based on the available data [90,91,92]. Although sometimes the phenomenon may define whether a classification or regression model is appropriate, the obtained data or the feature extraction from data can also determine what information can be extracted. This thematic area is too broad, that is why only some important information related to machine learning algorithms and reduced order models is mentioned in this section.
Supervised machine learning relies on labelled input data, which introduce a characterization to the data that will be studied. The term supervised indicates that someone has an insight about the special characteristics of data. As an example, someone should extract the information that is related to cracks or to other critical dimensions, obtained from a microscope. When the training process is over and the model has learned the relationship between inputs–outputs, it can then characterize new, unseen datasets and predict the outcomes. On the other hand, unsupervised learning incorporates the training of models with raw and unlabelled data as inputs. These algorithms identify patterns and group data in separate clusters based on key properties of the data that can be extracted. The main drawback is the amount of data that are needed in order to have a predictive capability since they rely on patterns that the engineer cannot track. In unsupervised machine learning algorithms, the trends between inputs should be identified, while in supervised machine learning the algorithms are trying to correlate inputs with outputs.
Both machine learning techniques are used in manufacturing processes, however, the availability of labelled data determines the preferable technique. In supervised machine learning, the representative dataset is provided and studied during the training phase. In this phase, the selected algorithms try to identify patterns in the data that may indicate correlation among inputs and outputs. The given datasets include labelled inputs that facilitate the development of patterns and the identification of cause–result. After these steps are completed, the generalizability of the developed algorithms is tested by providing non labelled inputs. The algorithms are evaluated regarding their prediction performance while the data repository for training is increased. The developed models can be regression models or classification models based on the problem requirements and the way that the data have been extracted [93,94,95]. In defect detection, if the question is “Is the final part defective?”, a classification model could answer “Yes” or “No” and the type of defect etc. As in classification models, the answer is related to the pre-defined classes. However, a regression model, in the same question, could give an answer about the characteristics of the defect based on the input data that can be related to the size, the positioning of the defect, etc. A regression model could predict the length of a crack or the size of a pore, considering that this information has been available previously from different experiments.
Data-driven models, in general, are capable of combining data from different sources, enabling the calculation of simple metrics that are related to the studied process each time so as to obtain predictive capabilities in future processes. However, since the main issue met is the difficulty to adopt to new conditions and process parameters, they are used when there is a significant variety of inputs that have been generated with different parameters and in cases where there are simulation tools that can provide trustful outputs. In the latter case, data-driven models identify relationship between inputs and outputs and can be performed significantly faster than finite element models and analytical models. As it regards the algorithms that can be used, it is important to consider the distribution of data for classification algorithms in order to have equally distributed datasets for each class. Otherwise, it can lead to overfitting issues. On the other hand, for regression models with an increasing number of input points, the predictive performance improves. Under the umbrella of data-driven models, the Reduced Order Models (ROM) can be found. These models take advantage of simplified physics-based models offering high fidelity of complex models, significantly reducing the solution time and the storage capacity while preserving the essential behavior into dominant effects. They are used mostly in transient models, fluent, thermal analysis, etc. since they provide a significant reduction in processing time. ROMs could be considered as black boxes that transform an input in to output by being trained with data that have been obtained from physics-based models. These data arose after a careful and dense design of experiments so as to provide significant predictive capability. The aim of ROMs is to bypass the solution of time-consuming models by identifying the relationship between inputs–outputs for several physical phenomena.
The outputs of the virtual layer alongside with any other data are distributed via the communication layer to the receivers that can be control devices, operators, or simple data bases for data storage. The communication layer is described in the next section while the decision-making strategies are mentioned as the last step for the successful implementation of a Digital Twin.
2.4. Communication Layer and Data Transmission
Considering the huge datasets that can be produced and the numerous sources that can feed the algorithms, it is important to have appropriate communication channels and networks that are capable of transferring the information back and forth seamlessly (Figure 8). According to [50], the communication channels and the transmission paths are capable to distort the signal between the source and the sensor as well as between the sensor and the data acquisition module and the edge device. The transmission path may introduce non linearities that make the signal more complex than the original. Since multiple paths are responsible for data transmission in manufacturing processes (Figure 4), the quality of the received and transmitted signal may be distorted in a significant way. The transmission paths that have been introduced are included in different communication layers that are related to the functionalities of Digital Twins and the sources of information that need to be handled. The communication needs of a Digital Twin can be classified into four categories.
- Communication between the subsystems of a Digital Twin: As an example, the simulation tools utilize data that is stored in data bases, while the prediction outputs are processed by decision-making algorithms aiming to optimize specific metrics/indicators.
- Communication between Digital Twins and environment: The Digital Twin of a complex mechanism constitutes a combination of different twins that correspond to the separate subsystems of the investigated process. As an example, in a metal AM process, the powder feeder system and the deposition head motion are represented by distinct twins, which are combined to represent the deposition process. Moreover, in this division there is communication between the twins that correspond to the same system, but different components are found, exchanging information related to the status of the machine. In addition, the data exchange with the environment (temperature, warning messages in case of emergency) is also met here.
- Communication between Digital Twin and external systems: Entities that provide services to Digital Twin can be defined as external systems. Such entities are the cloud, data storage, communication networks, etc., that are managed from external party and not of the owner of the Digital Twin. These systems interact with the Digital Twin in a standardized interface, while significant effort is given in the interoperability of data structures.
- Communication between the virtual representation and the physical object: The two-way data exchange between the physical twin and the Digital Twin is found here. Data from sensors and process status are transmitted from physical object to the virtual, while also data is transmitted from Digital Twin to physical object, including control commands and software update. However, from the definition of Digital Twin, the most significant aspect is the correct and accurate transmission from the physical twin to build an accurate representation.
A significant requirement of collaboration and communication between the different subsystems of the twin is the connectivity. Regarding connectivity, networks (4G, 5G) and hardware development in the field of communication have a key role in expanding the use of Digital Twins, since they speed up the transmission of data. High speed and wireless connectivity alongside with structured data formats, secure transactions, and data of high quality create the pillars for successful (almost) real-time representation of the physical world in the digital world and prediction of different indicators at the next time step. Significant barriers in terms of latency, bandwidth, power, reliability, and mobility of IoT devices can be overcome thanks to developments related to data extraction and transmission [93]. Protocols and standards for communication and data exchange are always the key factor for easy, consistent, accurate, and valuable interaction. The communication between the network devices should follow a specified set of rules, called protocols, to enable correct transmission and reception of data among the devices. Each sensor, machine, receiver, and edge module has its own protocol, with specific syntax and rules for data exchange.
In terms of the Digital Twin’s continuous data exchange between the different components (Figure 8), different communication methods are introduced such as the Wireless Sensor Networks (WSN), Machine-to-Machine (M2M) Interfaces, Industrial FieldBus Networks (ModBus, ProfiBus), and Open Platform communications—Unified Architecture (OPC_UA), which are met in different industrial environments and are related to different machine architecture [94,95,96]. The specifications of each machine as well as the required principles for machine-to-machine (M2M) data exchange often needs structured data formats such as XML, JSON, and protocols to circulate the information, always maintaining the same field of information for proper interaction with other module and machines. Such a protocol can be the SOAP (Simple Object Access Protocol) protocol, which ensures that the information that is related to specific services and functionalities will be transmitted always with the same way and with the same sequence [93,94,95,96].
The data exchange between sensors, edge devices, and the devices that perform the control action (actuator, motors, etc.) is governed from security protocols that act on the industrial networks that manipulate the data. Data security is being ensured through encryption at the exchange of information, customer’s identification through Secure Sockets Layer (SSL) and Transport Layer Security (TLS) protocols in compliance with database authentication, and the utilization of a Virtual Private Network (VPN) [93].
2.5. Decision Making and Control
The meaningful information that is extracted from monitoring devices and data-driven models drive the decision-making strategies. As an example, although the visual monitoring has been used over the years, today, with the latest advanced in artificial intelligence and neural networks, several challenges of image processing have been addressed, enabling real-time performance characterization and process control [97]. Machine vision systems are being continuously implemented for inspecting the work piece, measuring dimensions, identifying defects, and monitoring thermal profiles, ensuring the desired machine performance [98].
One of the most significant decisions is how the model outputs will be utilized and this feedback will be given to the process via the control modules. According to [44], the decision-making strategies rely on simple thresholds, statistical process control (SPC), position- and time-dependent thresholds, the part signature, the waveform recognition, the pattern recognition, and the severity estimator. For each one of them a simple description is introduced:
- Thresholds: In general, they are case dependent. They are related to a specific phenomenon and a specific machine/tool. As an example, during the breakage of a cutting tool, acoustic sensor captures values above a specific threshold that usually indicates breakage. Thresholds can be either absolute or relative to previously obtained values and values from different sensing devices. In the simple case where there are simple thresholds, the response time is set based on the observed phenomenon and its seriousness. On the other hand, there are time-/position-based thresholds that aim to adopt the dynamic behavior of most of the manufacturing processes. In these cases, the decision depends on thresholds that have exceeded a specific number of times.
- Statistical process control (SPC): The decision is based on the evaluation of process outputs with statistical metrics after the threshold condition is activated. It is important to calculate the control limits of the studied phenomenon, which determines the threshold condition. If the analysis gives outputs that are outside of the accepted values, then the decision is made, the process stops, and the engineers try to diagnose the cause and possible corrective actions. The control chart is one of the primary techniques that are used in the SPC. It is a graphical display that depicts the values of metrics that have been measured between the threshold values over time so as to guide the control activities and give insight about the effect of the current condition of the machine on the manufactured part. The effect can be a value or a characteristic of the part.
- Part signature: This strategy depends on the repeated observations of key parameters of a machine. The timeline of the observation is not defined a priori but is extracted by comparing how the observed values deviate across time. However, when the time between the observations has been defined, it should be respected so as to avoid missed detections that can lead to wrong decisions.
- Waveform recognition: It refers mainly to cases where a phenomenon can be represented with a specific waveform of the obtained signal. When this phenomenon is activated, then the corresponding waveform is considered as a pattern. Thus, the obtained signals are compared to the pattern so as to point out a possible issue and create an alarm for decision.
- Pattern recognition: This method requires a series of data so as to match a pattern. Machine learning models work in a similar way, trying to identify patterns between data either from different sources or from the same source over time so as to point out a condition or to predict an output that may lead to the excitation of the critical phenomenon.
- Severity Estimator: Once a threshold value has been activated, the severity of the condition should be inspected so as to proceed to the decision making. In order to investigate the severity, additional information is needed. An estimator is used that relies on mathematical models that correlate the measured values with the severity of the issue, and then if it is desirable they can correlate this effect on the final part. In this strategy, the machine learning models, reduced order models, and empirical models are found, since they provide this kind of information.
All the decision-making strategies aim to preserve processes of high quality without wasting resources. This is very crucial for the industries, nowadays, since they are trying to take the most from the equipment and apart from the knowledge that “something is going wrong”, they need to know how this affects the process performance and the final product quality and what is the remaining life of the equipment if they keep using it. After the decision making, the control actions should be performed, being transmitted through the communication channels to the devices or to the machine controller that will modify the related parameters.
Knowledge Extraction and Wisdom
By taking advantage of the described steps for the transformation of raw data, acquired from sensing devices to meaningful information that assist the decision-making process, knowledge and wisdom relative to a process mechanism can be generated. These are the last two layers of the Data-Information-Knowledge-Wisdom (DIKW) pyramid that have been introduced from different researchers [99,100,101] and they represent the different transformations that need to be performed so as to improve the adaptiveness of the process in different conditions. Since the principals of each of the steps of the pyramid related to data acquisition and information extraction have been previously introduced, only the Knowledge and Wisdom section will be mentioned in detail in this section. These steps of the pyramid receive more and more interest, as they represent the main outcome of digitalization of industries and contribute directly to the selection of the appropriate decision-making strategy. The information is transformed to knowledge when it can determine the actions of decision making. Among the two classifications of knowledge, tacit and explicit, the industrial world is interested in the latter since it incorporates documentation and formulation of the knowledge, while the first one relies on the identification of problems that may have been identified in the past, and their solution can be used as experience for similar problems in the future [102].
On the other hand, the layer of wisdom cannot be generalized for all the processes that belong in a process family. As an example, laser-based processes and additive manufacturing processes differ significantly one from each other. Therefore, application-based wisdom is suggested as terminology that limits the scope of wisdom layer in specific applications where the human can take decisions based on the instinct that relies on the deep understanding of the effect of process variables on the final result and a possible map of these effects on the final part. Additionally, it is important to mention that although process knowledge extraction can be automated, as well as the decision-making, wisdom is an inherent, human aspect and cannot be digitalized (e.g., through artificial intelligence) [73].
The pyramid that was introduced in [101] includes the two different flows between the layers of the pyramid determined as goal-oriented data generation and adaptive knowledge generation (Figure 9). In the top-to-bottom strategy (goal-oriented data generation), the agent who is responsible for the decision making investigates what kind of data may give a desired output, while on the other hand, the bottom-to-top strategy (adaptive knowledge engineering) introduces the knowledge that can be generated based on the given data and how the outputs change with different inputs. As a general conclusion from the aforementioned, one of the targets of Digital Twin is to create the environment where meaningful information can be produced and then be transformed to knowledge supporting both approaches and accelerating the decision-making procedures and the exploration of different processes.
3. From Sensing to Twining in a Case Study from Milling Process
This section aims to identify the components of a Digital Twin in different examples that are related to the milling process, with the aid of literature sources [73,103,104]. In these examples, different sensing devices and signal processing techniques were selected based on the author’s preferences, the signal characteristics, and the available infrastructures. The fact that by following different approaches a Digital Twin that serves the same functionalities can be developed, points out the adaptability of this approach in industrial scenarios, where different requirements ask for different solutions, not only in terms of cost but also in terms of accuracy, speed, etc.
The proposed systems captured and identified conditions/phenomena that affect the process performance indicators and propose corrective actions. To this end, this section will not describe in detail each separate development but will introduce key parameters that determine the success of a DT as well as the weak points of the different approaches in terms of signal acquisition resolution, equipment cost, and installation capabilities on the machine tool.
3.1. Problem Statement
The first step before sensor selection is to identify critical phenomena that need to be monitored with sensors. One of the challenges that are met in the milling process is the chatter phenomenon, which is defined as a type of self-excited vibration that can be identified in different time instances during the machining process [1,73]. This phenomenon is excited due to the dynamic characteristics (damping, stiffness) of the studied machining system in combination with the selected milling parameters (cutting speed, depth of cut, feed per tooth). This phenomenon is an uncontrollable and unattenuated vibration, which leads to poor surface quality due to the oscillations between the workpiece and the cutting tool. Apart from the surface quality, this phenomenon affects the cutting tool life and the health of the machine tool components. In addition, this is a regenerative phenomenon, since the oscillating motion of the tool leaves chatter marks on the workpiece, which have a waviness at the oscillating frequency of the end mill (the chatter frequency). As a result, the next cutting edge is introduced to a varying chip load, which varies at a frequency equal to the chatter frequency, thus triggering the regenerative effect.
The development of analytical and data-driven models could enable the prediction of the occurrence of chatter during the initial stages of process planning and support selection of appropriate process parameters. However, when the process variables change (e.g., cutting tool, tool holder, etc.), the engineer should examine once again the dynamic response of the structure and extract new parameters for the models. To this end, a monitoring system is required, aiming to capture appropriate signals continuously during the process, evaluating the existence of chatter in real time, while giving feedback to decision-making algorithms that can perform control activities. The aforementioned information depicts the significance of transforming process-related information, to control actions, aiming to improve the process performance without the human factor being involved in each process, but only during the development of the Digital Twin and the involved models. The next step is the decision regarding the appropriate sensor that is capable to capture this phenomenon (Figure 10).
3.2. Sensor Selection
In the literature, different sensors are proposed that are capable of capturing this phenomenon. Some of them include accelerometers, force sensors (piezoelectric), contact-free ultrasonic and acoustic emission sensors, as well as microphones. However, in the industry, only the first two sensors have been found to have application due to the ease of installation and the required resources for signal processing. Apart from the sensor quality, the machine tool set up could also guide the engineer regarding the most appropriate sensor. In [73], a Kistler 8762A10 tri-axial, ceramic shear, accelerometer was used for the data collection, mounted on the spindle head of the machine tool. In [103], force data were collected with Kistler dynamometer 9258C2, which was placed directly on the machine table, where the workpiece was clamped, while in [104] a Kistler dynamometer 9255C was selected for the recording and validation of force data, placed again on the machining table. Both dynamometers obtain force components in three directions. The accelerometer can be placed anywhere close to the spindle, being very small, but asking for significant signal processing so as to extract the desired information. On the other hand, the dynamometer is much more expensive, with pre-defined space for installation, but it provides data of high quality, and it captures with great accuracy the studied phenomenon. Finally, both devices detect the same phenomenon with different ways but different in terms of positioning, dimensions, sensitivity, accuracy, and cost. This is a very important decision for the development of a Digital Twin. In the next section, the devices for data acquisition/storing are introduced (Figure 10).
3.2.1. Data Acquisition
In [73], a National Instrument PXI-4472 sound and vibration module was used for data acquisition with a sampling rate of 1 KHz, while Labview software was selected for data storage. On the other hand [103], the multi-function data acquisition device NI-USB-6343 alongside with a charge amplifier were selected, with a sampling rate of 250 Hz. In both cases, wired connections were implemented (Figure 11). In addition, the whole system is integrated in the proximity of the machine, limiting the effect of wire length on the signal acquisition quality. Finally, the desired data format for data storage is selected for future offline post processing and inline signal processing.
3.2.2. Data Format
Since the chatter phenomenon can be captured from only one sensor and homogenous datasets are generated, the data format can be as simple as a Comma Separated Values (.csv) file. Moreover, small datasets are generated, considering that the signal (force, acceleration) for each axis (x, y, z) is stored in a different column. In [73], the author mentions that 40 experiments were performed for the training of data-driven models and in total 7000 samples were recorded. To this end, the dataset includes 28 × 104 samples for the analysis.
3.2.3. Singal Processing
In [75,103,104], frequency domain methods were selected since the phenomenon is identified in specific signal bands and is modulated from the rotational speed of the spindle. However, different algorithms were proposed for the decomposition and processing of the signal. In [73], the variational mode decomposition was selected for the demodulation of the original signal into its principal modes. The extraction of features of the initial signal gives the opportunity to study only specific values that represent the signal instead of the whole signal, reducing the computational time, which is significant criterion for a Digital Twin. Furthermore, the metric of kurtosis (fourth statistical moment of a signal) was correlated with the excess of signal outliers (Figure 11). Finally, it was determined that for the stable process, the metric remains negative, while in the case of chatter, this metric becomes positive, and its magnitude can be correlated to the magnitude of chatter. The correlation between signals and the existence of chatter was made with AI, while the labelling of datasets was made manually by tracking the distinct sound and the surface quality as a result of chattering. In [103,104], the Fast Fourier Transforms (FFT) was employed to detect chatter at the natural frequency of the cutting tool. The dominant frequency was met at the tooth-passing frequency. Additionally, the statistical variance of forces in x, y direction was selected as criterion to identify the chatter phenomenon in the obtained force signals, while a threshold value was pointed out that points out whether the process is stable.
3.3. Digital-Virtual Layer
A significant part of the Digital Twin is the representation of the physical world in the digital world. In this work, Python [73] and MATLAB [103,104] suites were selected to run the digital-virtual layer (Figure 12). To this end, the mentioned works developed models that were validated (data-driven and physics based analytical models) towards the detection of chatter aiming to provide a map for decision making. In [73], the support vector machine classifier was selected for the detection of the stability of the process, while 70% of the datasets were selected for the model training and the remaining 30% of the datasets were used for model testing. By selecting the optimum hyperparameters for the classifier, high performance of the predictive model is achieved (AUC 93%), which means that it can predict with high accuracy the process status. On the other hand, in [103,104], the authors developed analytical models that calculate the developed cutting forces, which were validated and calibrated with the received data from the actual process. Each time a force signal is received, the model can predict with the aid of the statistical metrics and the empirical models the machine status. Additionally, the validated models can be used to generate datasets to improve the performance of the predictive models as well as to test different process inputs, considering that the model somehow incorporates this information, either with coefficients or with weight factor.
3.4. Communication Layer
After the virtual layer, the outputs are transmitted via wired communication channels with protocols determined from the machine controller and the edge module so as to perform the desired modification of the process parameters. MODBUS/PROFIBUS network protocols were selected for the transmission of data to the machine controller [104]. These two protocols are well known in this type of application (Figure 12).
3.5. Decision Making and Control
The decision making can be divided in two components. The first one refers to the decision about the machine state that was made during the data analytics/feature extraction section, and the second about the action that will be performed to control the process and modify the machine status. Considering that thresholds of specific metrics are used to characterize the machine status, the decision-making strategy relies on thresholds. However, in [73,104], it was described that the process status can be evaluated with stability lobe diagram, finding the limiting depths of cut and spindle speeds so as to maintain a stable process [73]. On the other hand, variations of these diagram can be found, including parameters such as spindle speed, tool path position, chatter frequency, and feed rate [104]. In both cases, the process should remain stable, and the corrective actions have to be made with a control diagram that will be case dependent. According to the process characteristics, the engineer should select which parameter should be changed to maintain the stability. The feed rate and the depth of cut affect the productivity time of the process. In [104], the spindle speed is modified so as to maintain a stable process (Figure 12). With this step, all the components of a Digital Twin were identified, describing with real cases what actions are required to go from sensing to twinning.
4. Conclusions
The present work points out the main components that are required for the development of a Digital Twin and the transition from sensing to twinning. The importance of process mechanism understanding and data analytics to extract the desired features from each process related phenomenon are items that need to be investigated further in the recent future. The complexity of new process mechanisms (e.g., additive manufacturing) leads to the increased adoption of digitalization in industries since the physics-based, theoretical models are not capable of representing the physical process and providing meaningful characterization of the process status. Moreover, the improved hardware solutions for data collection and data transmission as well as for signal processing and data analytics give the opportunity to bypass the process physics and develop data-driven models that depict the process status by combining data from different sources. Therefore, the data structures will play a significant role, especially when large datasets are generated. However, the decision making and the feature extraction during signal processing relies on different methodologies and thresholds that until now have not been automatically selected, which means that always human will have key role in the Digital Twin loop. As future work, the full potentials of IoT and Industry 4.0 will be integrated in the production lines, enabling process performance optimization and minimized use of resources. On top of that, since the physical layer is an existing object and the decision making relies on the provided data and the scope of the Digital Twin, the key area of interest and for future research is the selection of the desired sensing layer to capture a specific phenomenon and how this input will be transformed into knowledge so as to be part of Digital Twin.
Funding
This research received no external funding.
Institutional Review Board Statement
Not applicable.
Informed Consent Statement
Not applicable.
Data Availability Statement
Not applicable.
Acknowledgments
This paper is partially supported by European Union’s Horizon 2020 research and innovation programme under the H2020 EU Project DIMOFAC-Digital Intelligent MOdular FACtories, G.A. 870092.
Conflicts of Interest
The author declares no conflict of interest.
References
- Chryssolouris, G. Manufacturing Systems: Theory and Practice, 2nd ed.; Springer: New York, NY, USA, 2006. [Google Scholar]
- Koren, Y.; Heisel, U.; Jovane, F.; Moriwaki, T.; Pritschow, G.; Ulsoy, G.; Van Brussel, H. Reconfigurable Manufacturing Systems. CIRP Ann. 1999, 48, 527–540. [Google Scholar] [CrossRef]
- Stavropoulos, P.; Papacharalampopoulos, A.; Tzimanis, K.; Lianos, A.K. Manufacturing Resilience during the Coronavirus Pandemic: On the investigation of Manufacturing Processes Agility. Eur. J. Soc. Impact Circ. Econ. 2020, 1, 28–57. [Google Scholar]
- Papacharalampopoulos, A.; Michail, C.K.; Stavropoulos, P. Manufacturing resilience and agility through processes digital twin: Design and testing applied in the LPBF case, 9th CIRP Global Web Conference. Procedia CIRP 2021, 103, 164–169. [Google Scholar] [CrossRef]
- Ghita, M.; Siham, B.; Hicham, M. Digital twins development architectures and deployment technologies: Moroccan use case. Int. J. Adv. Comput. Sci. Appl. 2020, 11, 468–478. [Google Scholar] [CrossRef]
- Stavropoulos, P.; Mourtzis, D. Chapter 10-Digital twins in industry 4.0. In Design and Operation of Production Networks for Mass Personalization in the Era of Cloud Technology; Elsevier: Amsterdam, The Netherlands, 2022; pp. 277–316. ISBN 9780128236574. [Google Scholar] [CrossRef]
- Trauer, J.; Schweigert-Recksiek, S.; Engel, C.; Spreitzer, K.; Zimmermann, M. What is a Digital Twin? -Definitions and insights from an industrial case study in technical product development. Proc. Des. Soc. Des. Conf. 2020, 1, 757–766. [Google Scholar] [CrossRef]
- Shafto, M. Modeling, Simulation, Information Technology and Processing. Available online: https://www.nasa.gov/pdf/501321main_TA11-MSITP-DRAFT-Nov2010-A1.pdf (accessed on 4 June 2022).
- Glaessgen, E.H.; Stargel, D.S. The digital twin paradigm for future NASA and U.S. Air force vehicles. In Proceedings of the Collection of Technical Papers-AIAA/ASME/ASCE/AHS/ASC Structures, Structural Dynamics and Materials Conference, Honolulu, Hawaii, 23–26 April 2012. [Google Scholar]
- Grieves, M.; Vickers, J. Digital Twin: Mitigating Unpredictable, Undesirable Emergent Behavior in Complex Systems; Springer International Publishing: Cham, Switzerland, 2017; pp. 85–113. [Google Scholar] [CrossRef]
- Stark, R.; Damerau, T. Digital Twin, CIRP Encyclopedia of Production Engineering; Springer: Berlin/Heidelberg, Germany, 2019; Volume 66, pp. 1–8. [Google Scholar] [CrossRef]
- Tao, F. Digital twin-driven product design framework. Int. J. Prod. Res. 2019, 57, 3935–3953. [Google Scholar] [CrossRef]
- Fuller, A.; Fan, Z.; Day, C.; Barlow, C. Digital Twin: Enabling Technologies, Challenges and Open Research. IEEE Access 2020, 8, 108952–108971. [Google Scholar] [CrossRef]
- Cvetkov, P.; Zhilenkova, E.; Zhilenkov, A. Development of virtual benches for testing the digital twin of a vehicle. E3S Web Conf. 2021, 284, 06006. [Google Scholar] [CrossRef]
- Pastras, G.; Fysikopoulos, A.; Chryssolouris, G. A numerical approach to the energy efficiency of laser welding. Int. J. Adv. Manuf. Technol. 2017, 92, 1243–1253. [Google Scholar] [CrossRef]
- Pastras, G.; Fysikopoulos, A.; Stavropoulos, P.; Chryssolouris, G. An approach to modelling evaporation pulsed laser drilling and its energy efficiency. Int. J. Adv. Manuf. Technol. 2014, 72, 1227–1241. [Google Scholar] [CrossRef]
- Stavropoulos, P.; Papacharalampoloulos, A.; Tzimanis, K. Design and Implementation of a Digital Twin Platform for AM processes. Procedia CIRP 2021, 104, 1722–1727. [Google Scholar] [CrossRef]
- Chaoyong, Z.; Zhiheng, Z.; Guangdong, T.; Yang, X.; Wenwen, L.; Zhengtao, Z. Energy consumption modeling and prediction of the milling process: A multistage perspective. Proc. Inst. Mech. Eng. Part B J. Eng. Manuf. 2018, 232, 1973–1985. [Google Scholar] [CrossRef]
- Aksarayli, M.; Yildiz, A. Process Optimization with Simulation Modeling in a Manufacturing System. Res. J. Appl. Sci. Eng. Technol. 2011, 3, 318–329. [Google Scholar]
- Vidrova, Z.; Bohus, Z.; Adamko, P. Simulation as a Tool for Process Optimization in a Manufacturing Company. SHS Web Conf. 2021, 92, 08023. [Google Scholar] [CrossRef]
- Schleich, B.; Answer, N.; Mathieu, L.; Wartzack, S. Shaping the digital twin for design and production engineering. CIRP Ann.-Manuf. Technol. 2017, 66, 141–144. [Google Scholar] [CrossRef]
- Zhang, H.; Liu, Q.; Chen, X.; Zhang, D.; Leng, J. A Digital Twin-Based Approach for Designing and Multi-Objective Optimization of Hollow Glass Production Line. IEEE Access 2017, 5, 26901–26911. [Google Scholar] [CrossRef]
- Kendrik, Y.H.L.; Pai, Z.; Dar, W.L. Chapter 4-Digital twin-enhanced product family design and optimization service. In Digital Twin Driven Service; Academic Press: Cambridge, MA, USA, 2022; pp. 89–118. ISBN 9780323913003. [Google Scholar] [CrossRef]
- Boschert, S.; Rosen, R. Digital twin-the simulation aspect. In Mechatronic Futures: Challenges and Solutions for Mechatronic Systems and Their Designers; Springer International Publishing: Cham, Switzerland, 2016; pp. 59–74. [Google Scholar]
- Zhang, Q.; Zhang, X.; Xu, W.; Liu, A.; Zhou, Z.; Pham, D.T. Modeling of digital twin workshop based on perception data. In Lecture Notes in Computer Science; Springer: Berlin/Heidelberg, Germany, 2017; pp. 3–14. [Google Scholar]
- Söderberg, R.; Wärmefjord, K.; Carlson, J.S.; Lindkvist, L. Toward a Digital Twin for real-time geometry assurance in individualized production. CIRP Ann.-Manuf. Technol. 2017, 66, 137–140. [Google Scholar] [CrossRef]
- Rosen, R.; Wichert, G.; Lo, G.; Bettenhausen, K.D. About the importance of autonomy and digital twins for the future of manufacturing. In IFAC-Papers Online; Elsevier: Amsterdam, The Netherlands, 2015; pp. 567–572. [Google Scholar]
- Stavropoulos, P.; Papacharalampopoulos, A.; Vasiliadis, E.; Chryssolouris, G. Tool wear predictability estimation in milling based on multi-sensorial data. Int. J. Adv. Manuf. Technol. 2016, 82, 509–521. [Google Scholar] [CrossRef] [Green Version]
- Susto, G.A.; Schirru, A.; Pampuri, S.; McLoone, S.; Beghi, A. Machine learning for predictive maintenance: A multiple classifier approach. IEEE Trans. Ind. Inform. 2015, 1, 812–820. [Google Scholar] [CrossRef]
- D’Addona, D.M.; Ullah, A.; Matarazzo, D. Tool-wear prediction and pattern-recognition using artificial neural network and DNA-based computing. J. Intell. Manuf. 2017, 28, 1285–1301. [Google Scholar] [CrossRef]
- Magargle, R.; Johnson, L.; Mandloi, P.; Davoudabadi, P.; Kesarkar, O.; Krishnaswamy, S.; Batteh, J.; Pitchaikani, A. A Simulation-Based Digital Twin for Model-Driven Health Monitoring and Predictive Maintenance of an Automotive Braking System. In Proceedings of the 12th International Modelica Conference, Prague, Czech Republic, 15–17 May 2017; Linköping University Electronic Press: Linköping, Sweden, 2017; pp. 35–46. [Google Scholar]
- Lee, J.; Lapira, E.; Bagheri, B.; Kao, H. Recent advances and trends in predictive manufacturing systems in big data environment. Manuf. Lett. 2013, 1, 38–41. [Google Scholar] [CrossRef]
- Uhlemann, T.; Lehmann, C.; Steinhilper, R. The Digital Twin: Realizing the Cyber-Physical Production System for Industry 4.0. Procedia CIRP 2017, 61, 335–340. [Google Scholar] [CrossRef]
- Maskery, I.; Aboulkhair, N.T.; Corfield, M.R. Quantification and characterization of porosity in selectively laser melted Al-Si10-Mg using X-ray computed tomography. Mater. Charact. 2016, 111, 193–204. [Google Scholar] [CrossRef]
- Gaikwad, A.; Yavari, R.; Montazeri, M.; Cole, K.; Bian, L.; Rao, P. Toward the digital twin of additive manufacturing: Integrating thermal simulations, sensing, and analytics to detect process faults. IISE Trans. 2020, 52, 1204–1217. [Google Scholar] [CrossRef]
- Hänel, A.; Schnellhardt, T.; Wenkler, E.; Nestler, A.; Brosius, A.; Corinth, C.; Fay, A.; Ihlenfeldt, S. The development of a digital twin for machining processes for the application in aerospace industry. Procedia CIRP 2020, 93, 1399–1404. [Google Scholar] [CrossRef]
- Kechagias, J.D.; Ninikas, K.; Stavropoulos, P.; Salonitis, K. A generalised approach on kerf geometry prediction during CO2 laser cut of PMMA thin plates using neural networks. Lasers Manuf. Mater. Process. 2021, 8, 372–393. [Google Scholar] [CrossRef]
- Nikolakis, N.; Alexopoulos, K.; Xanthakis, E.; Chryssolouris, G. The digital twin implementation for linking the virtual representation of human-based production tasks to their physical counterpart in the factory-floor. Int. J. Comput. Integr. Manuf. 2019, 32, 1–12. [Google Scholar] [CrossRef]
- Stavropoulos, P.; Sabatakakis, K.; Papacharalampopoulos, A.; Mourtzis, D. Infrared (IR) quality assessment of robotized resistance spot welding based on machine learning. IJAMT 2022, 119, 1785–1806. [Google Scholar] [CrossRef]
- Schweidtmann, A.; Esche, E.; Fischer, A.; Kloft, M.; Repke, J.; Sager, S.; Mitsos, A. Machine Learning in Chemical Engineering: A Perspective. Chem.-Genieur Tech. 2021, 93, 2029–2039. [Google Scholar] [CrossRef]
- Multiphysics Modeling and Simulation. Available online: https://www.featool.com/multiphysics/ (accessed on 21 June 2022).
- Janicki, G.; Pezouvanis, A.; Mason, B.; Ebrahimi, M.K. Turbine Blade Vibration Measurement Methods for Turbocharges. Am. J. Sens. Technol. 2014, 2, 13–19. [Google Scholar]
- Liu, J.; Zhou, H.; Liu, X.; Tian, G.; Wu, M.; Cao, L.; Wang, W. Dynamic Evaluation Method of Machining Process Planning Based on Digital Twin. IEEE Access 2019, 7, 19312–19323. [Google Scholar] [CrossRef]
- Kalsoom, T.; Ramzan, N.; Ahmed, S.; Ur-Rehman, M. Advances in Sensor Technologies in the Era of Smart Factory and Industry 4.0. Sensors 2020, 20, 6783. [Google Scholar] [CrossRef]
- Chen, J.; Qiu, Q.; Han, Y.; Lau, D. Piezoelectric materials for sustainable building structures: Fundamentals and applications. Renew. Sustain. Energy Rev. 2019, 101, 14–25. [Google Scholar] [CrossRef]
- Haleem, A.; Javaid, M. Role of CT and MRI in the design and development of orthopaedic model using additive manufacturing. J. Clin. Orthop. Trauma 2018, 9, 213–217. [Google Scholar] [CrossRef]
- Arul Prakash, S.K.; Mahan, T.; Williams, G.; McComb, C.; Menold, J.; Tucker, C.S. Detection of system compromise in additive manufacturing using video motion magnification. J. Mech. Des. 2020, 142, 031109. [Google Scholar] [CrossRef]
- Qiu, Q.; Lau, D. Measurement of structural vibration by using optic-electronic sensor. Measurement 2018, 117, 435–443. [Google Scholar] [CrossRef]
- Kandris, D.; Nakas, C.; Vomvas, D.; Koulouras, G. Applications of wireless sensor networks: An up-to-date survey. Appl. Syst. Innov. 2020, 3, 14. [Google Scholar] [CrossRef]
- Sudip, P.; Diwakar, B.; Rabindra, B. Challenges, Opportunities and Future Directions of Smart Manufacturing: A State of Art Review. Sustain. Futur. 2020, 2, 100023. [Google Scholar] [CrossRef]
- Bampoula, X.; Siaterlis, G.; Nikolakis, N.; Alexopoulos, K. A Deep Learning Model for Predictive Maintenance in Cyber-Physical Production Systems Using LSTM Autoencoders. Sensors 2021, 21, 972. [Google Scholar] [CrossRef]
- Stavropoulos, P.; Papacharalampopoulos, A.; Stavridis, J.; Sampatakakis, K. A three-stage quality diagnosis platform for laser-based manufacturing processes. Int. J. Adv. Manuf. Technol. 2020, 110, 2991–3003. [Google Scholar] [CrossRef]
- Additive Manufacturing: Siemens Uses Innovative Technology to Produce Gas Turbines. Available online: https://press.siemens.com/global/en/feature/additive-manufacturing-siemens-uses-innovative-technology-produce-gas-turbines (accessed on 21 June 2022).
- Lin, C.S.; Chiang, H.T.; Hsu, C.H.; Lin, M.H.; Liu, J.K.; Bai, C.J. Modal Verification and Strength Analysis of Bladed Rotors of Turbine in Rated Working Conditions. Appl. Sci. 2021, 11, 6306. [Google Scholar] [CrossRef]
- Gantt Charts as a Tool for Production Planning and Control. Available online: https://www.planettogether.com/blog/gantt-charts-as-a-tool-for-production-planning-and-control (accessed on 21 June 2022).
- Experimental Residual Stress Analysis Using the Hole-Drilling Method on Plastic Materials. Available online: https://www.hbm.com/en/4359/tips-and-tricks-experimental-residual-stress-analysis-using-the-hole-drilling-method-on-plastic-materials/ (accessed on 21 June 2022).
- Souflas, T.; Bikas, H.; Ghassempouri, M.; Salmi, A.; Atzeni, E.; Saboori, A.; Brugnetti, I.; Valente, A.; Mazzucato, F.; Stavropoulos, P. A comparative study of dry and cryogenic milling for Directed Energy Deposited IN718 components: Effect on process and part quality. Int. J. Adv. Manuf. Technol. 2022, 119, 745–758. [Google Scholar] [CrossRef]
- Real-Time Melt Pool Monitoring in Additive Manufacturing. Available online: https://www.imveurope.com/analysis-opinion/real-time-melt-pool-monitoring-additive-manufacturing (accessed on 21 June 2022).
- Dill, J.; Soshi, M.; Yamazaki, K. A study on the effect of directed energy deposition substrate energy on clad geometry. Int. J. Adv. Manuf. Technol. 2020, 109, 315–333. [Google Scholar] [CrossRef]
- Moniz, L.; Chen, Q.; Guillemot, G.; Bellet, M.; Gandin, C.; Colin, C.; Bartout, J.; Berger, M. Additive manufacturing of an oxide ceramic by Laser Beam Melting–Comparison between finite element simulation and experimental results. J. Mater. Process. Technol. 2019, 270, 106–117. [Google Scholar] [CrossRef]
- Liu, X.; Shahriar, M.; Sunny, S.; Leu, M.; Hu, L. Cyber-physical manufacturing cloud: Architecture, virtualization, communication, and testbed. J. Manuf. Syst. 2017, 43, 352–364. [Google Scholar] [CrossRef]
- AVRO Data Format. Available online: https://www.ibm.com/topics/avro (accessed on 5 February 2022).
- Göransson, P.; Chuck, B.; Culver, T. Chapter 1-Introduction. In Software Defined Networks, 2nd ed.; Elsevier: Amsterdam, The Netherlands, 2017; pp. 1–21. ISBN 9780128045558. [Google Scholar] [CrossRef]
- Overcoming Distortion in New DED Additive Manufacturing Processes with Simulation. Available online: https://www.tctmagazine.com/additive-manufacturing-3d-printing-news/overcoming-distortion-in-ded-additive-manufacturing/ (accessed on 17 December 2021).
- Teti, R. Advanced IT Methods of Signal Processing and Decision Making for Zero Defect Manufacturing in Machining. Procedia CIRP 2015, 28, 3–15. [Google Scholar] [CrossRef]
- Cao, R.M. Motion Control System Design and Implement Based on Data-Driven; National Defense Industry Press: Beijing, China, 2012. [Google Scholar]
- Oliveri, P.; Malegori, C.; Simonetti, R.; Casale, M. The impact of signal pre-processing on the final interpretation of analytical outcomes-A tutorial. Anal. Chim. Acta 2019, 1058, 9–17. [Google Scholar] [CrossRef]
- Kuntoğlu, M.; Sağlam, H. On-line Tool Breakage Detection Using Acoustic Emission, Cutting Force and Temperature Signals in Turning. IOSR J. Mech. Civ. Eng. 2016, 13, 100–103. [Google Scholar]
- Stavropoulos, P.; Bikas, H.; Souflas, A.; Ghassempouri, M. A method for cutting force estimation through joint current signals in robotic machining. Procedia Manuf. 2021, 55, 124–131. [Google Scholar] [CrossRef]
- Chen, W.; Zhang, P.; Song, L.; Yang, J.; Han, C. Simulation of Nanopore Sequencing Signals Based on BiGRU. Sensors 2020, 20, 7244. [Google Scholar] [CrossRef]
- Understanding Gibbs Phenomenon in Signal Processing. Available online: https://www.gaussianwaves.com/2010/04/gibbs-phenomena-a-demonstration/ (accessed on 21 June 2022).
- Time Domain vs. Frequency Domain. Available online: https://www.sharetechnote.com/html/ (accessed on 21 June 2022).
- Souflas, A. Generation of Manufacturing Process Knowledge for Process Optimization: A Case Study on Milling. Diploma Thesis, University of Patras, Patras, Greece, 2021. [Google Scholar]
- Qi, Q.; Tao, F.; Zuo, Y.; Zhao, D. Digital Twin Service towards Smart Manufacturing. Procedia CIRP 2018, 72, 237–242. [Google Scholar] [CrossRef]
- Redelinghuys, A.J.H.; Basson, A.H.; Kruger, K. A six-layer digital twin architecture for a manufacturing cell. SOHOMA 2018. In Studies in Computational Intelligence; Springer: Cham, Switzerland, 2019; Volume 803. [Google Scholar]
- Destructive Testing and How It Works. Available online: https://www.flyability.com/destructive-testing (accessed on 21 June 2022).
- Prabhakar, P.; Sames, W.J.; Dehoff, R.; Babu, S.S. Computational modeling of residual stress formation during the electron beam melting process for Inconel 718. Addit. Manuf. 2015, 7, 83–91. [Google Scholar] [CrossRef]
- Michaleris, P. Modeling metal deposition in heat transfer analyses of additive manufacturing processes. Finite Elem. Anal. Des. 2014, 86, 51–60. [Google Scholar] [CrossRef]
- Knapp, G.L.; Mukherjee, T.; Zuback, J.S.; Wei, H.L.; Palmer, T.A.; De, A.; DebRoy, T. Building blocks for a digital twin of additive manufacturing. Acta Mater. 2017, 135, 390–399. [Google Scholar] [CrossRef]
- Hodge, N.E.; Ferencz, R.M.; Solberg, J.M. Implementation of a thermomechanical model for the simulation of selective laser melting. Comput. Mech. 2014, 54, 33–51. [Google Scholar] [CrossRef]
- Zeng, K.; Pal, D.; Gong, H.J.; Patil, N.; Stucker, B. Comparison of 3DSIM thermal modelling of selective laser melting using new dynamic meshing method to ANSYS. Mater. Sci. Technol. 2015, 31, 945–956. [Google Scholar] [CrossRef]
- Attar, E.; Körner, C. Lattice Boltzmann model for thermal free surface flows with liquid-solid phase transition. Int. J. Heat Fluid Flow 2011, 32, 156–163. [Google Scholar] [CrossRef]
- Huang, Y.; Khamesee, M.B.; Toyserkani, E. A comprehensive analytical model for laser powder-fed additive manufacturing. Addit. Manuf. 2016, 12, 90–99. [Google Scholar] [CrossRef]
- Stavropoulos, P.; Papacharalampopoulos, A.; Athanasopoulou, L. A molecular dynamics based digital twin for ultrafast laser material removal processes. Int. J. Adv. Manuf. Technol. 2020, 108, 413–426. [Google Scholar] [CrossRef]
- Luo, W.; Hu, T.; Zhang, C.; Wei, Y. Digital twin for CNC machine tool: Modeling and using strategy. J. Ambient. Intell. Humaniz. Comput. 2019, 10, 1129–1140. [Google Scholar] [CrossRef]
- Wu, H.; Yu, Z.; Wang, Y. A New Approach for Online Monitoring of Additive Manufacturing Based on Acoustic Emission. In Proceedings of the ASME 2016 11th International Manufacturing Science and Engineering Conference, Blacksburg, VA, USA, 27 June–1 July 2016; Volume 3, p. V003T08A013. [Google Scholar] [CrossRef]
- Cugnon, F.; Berglind, L.; Plakhotnik, D.; Armendia, M. Simulation of machining operations using the virtual machine tool concept. In Proceedings of the ASME 2018 International Design Engineering Technical Conferences and Computers and Information in Engineering Conference, Quebec City, QC, Canada, 26–29 August 2018; American Society of Mechanical Engineers (ASME): New York, NY, USA, 2018. [Google Scholar]
- Armendia, M.; Cugnon, F.; Berglind, L.; Ozturk, E.; Gil, G.; Selmi, J. Evaluation of machine tool digital twin for machining operations in industrial environment. Procedia CIRP 2019, 82, 231–236. [Google Scholar] [CrossRef]
- Strantza, M.; Van Hemelrijck, D.; Guillaume, P.; Aggelis, D.G. Acoustic emission monitoring of crack propagation in additively manufactured and conventional titanium components. Mechanics Res. Commun. 2017, 84, 8–13. [Google Scholar] [CrossRef]
- Razvi, S.; Feng, S.; Lee, Y.; Witherell, P. A Review of Machine Learning Applications in Additive Manufacturing. In Proceedings of the ASME 2019 International Design Engineering Technical Conferences and Computers and Information in Engineering Conference, Anaheim, CA, USA, 18–21 August 2019; Available online: https://tsapps.nist.gov/publication/get_pdf.cfm?pub_id=927654 (accessed on 24 August 2021).
- Regression Versus Classification Machine Learning: What’s the Difference? Available online: https://medium.com/quick-code/regression-versus-classification-machine-learning-whats-the-difference (accessed on 17 December 2021).
- Imani, F.; Montazeri, M.; Gaikwad, A.; Rao, P.; Yang, H.; Reutzel, E. Layerwise In-Process Quality Monitoring in Laser Powder Bed Fusion. In Proceedings of the ASME 2018 13th International Manufacturing Science and Engineering Conference, ASME, College Station, TX, USA, 18–22 June 2018. [Google Scholar]
- Panagiotis, S.; Thanassis, S.; Nikolas, P.; Harry, B. Application of virtual engineering tools to support design optimization: A case study on a cryogenic machining system. Procedia CIRP 2021, 100, 181–186. [Google Scholar] [CrossRef]
- Mourtzis, D.; Vlachou, E.; Milas, N. Industrial Big Data as a Result of IoT Adoption in Manufacturing. Procedia CIRP 2016, 55, 290–295. [Google Scholar] [CrossRef]
- Mourtzis, D.; Milas, N.; Athinaios, N. Towards Machine Shop 4.0: A General Machine Model for CNC machine-tools through OPC-UA. Procedia CIRP 2018, 78, 301–306. [Google Scholar] [CrossRef]
- Liu, C.; Xu, X. Cyber-physical Machine Tool—The Era of Machine Tool 4.0. Procedia CIRP 2017, 63, 70–75. [Google Scholar] [CrossRef]
- Armendia, M.; Alzaga, A.; Peysson, F.; Fuertjes, T.; Cugnon, F.; Ozturk, E.; Flum, D. Machine Tool: From the Digital Twin to the Cyber-Physical Systems. In Twin-Control; Springer International Publishing: Cham, Switzerland, 2019; pp. 3–21. [Google Scholar]
- Alexopoulos, K.; Nikolakis, N.; Chryssolouris, G. Digital twin-driven supervised machine learning for the development of artificial intelligence applications in manufacturing. Int. J. Comput. Integr. Manuf. 2020, 33, 429–439. [Google Scholar] [CrossRef]
- Calin, D.G.; Narcisa, D.C.; Laurentiu, P.C. Machine Vision in Manufacturing Processes and the Digital Twin of Manufacturing Architectures. In Proceedings of the 28th DAAAM International Symposium, Zadar, Croatia, 8–11 November 2017; DAAAM International: Vienna, Austria, 2020; pp. 0733–0736. [Google Scholar] [CrossRef]
- Gu, J. Data, Information, Knowledge, Wisdom and Meta-Synthesis of Wisdom-Comment on Wisdom Global and Wisdom Cities. Procedia Comput. Sci. 2013, 17, 713–719. [Google Scholar] [CrossRef]
- Ackoff, R.L. From data to wisdom. J. Appl. Syst. Anal. 1989, 16, 3–9. [Google Scholar]
- Lu, Y.; Yang, Z.; Eddy, D.; Krishnamurty, S. Self-Improving Additive Manufacturing Knowledge Management. In Proceedings of the ASME 2018 International Design Engineering Technical Conferences and Computers and Information in Engineering Conference, Quebec City, QC, Canada, 26–29 August 2018; p. V01BT02A016. [Google Scholar] [CrossRef]
- Ward, R.; Sun, C.; Dominguez-Caballero, J. Machining Digital Twin using real-time model-based simulations and lookahead function for closed loop machining control. Int. J. Adv. Manuf. Technol. 2021, 117, 3615–3629. [Google Scholar] [CrossRef]
- Afazov, S.; Scrimieri, D. Chatter model for enabling a digital twin in machining. Int. J. Adv. Manuf. Technol. 2020, 110, 2439–2444. [Google Scholar] [CrossRef]
Figure 1.
Outline of this work.


Figure 5.
Sensors and monitoring devices to represent the physical process [44,45,46,47,48,49,50,51,52,53,54].


Figure 9.
Digital Twin as a mean for knowledge generation and test bed for process understanding [101].
Figure 9.
Digital Twin as a mean for knowledge generation and test bed for process understanding [101].

Figure 10.
Description of physical object and selection of sensor to capture critical phenomenon [73,103,104].


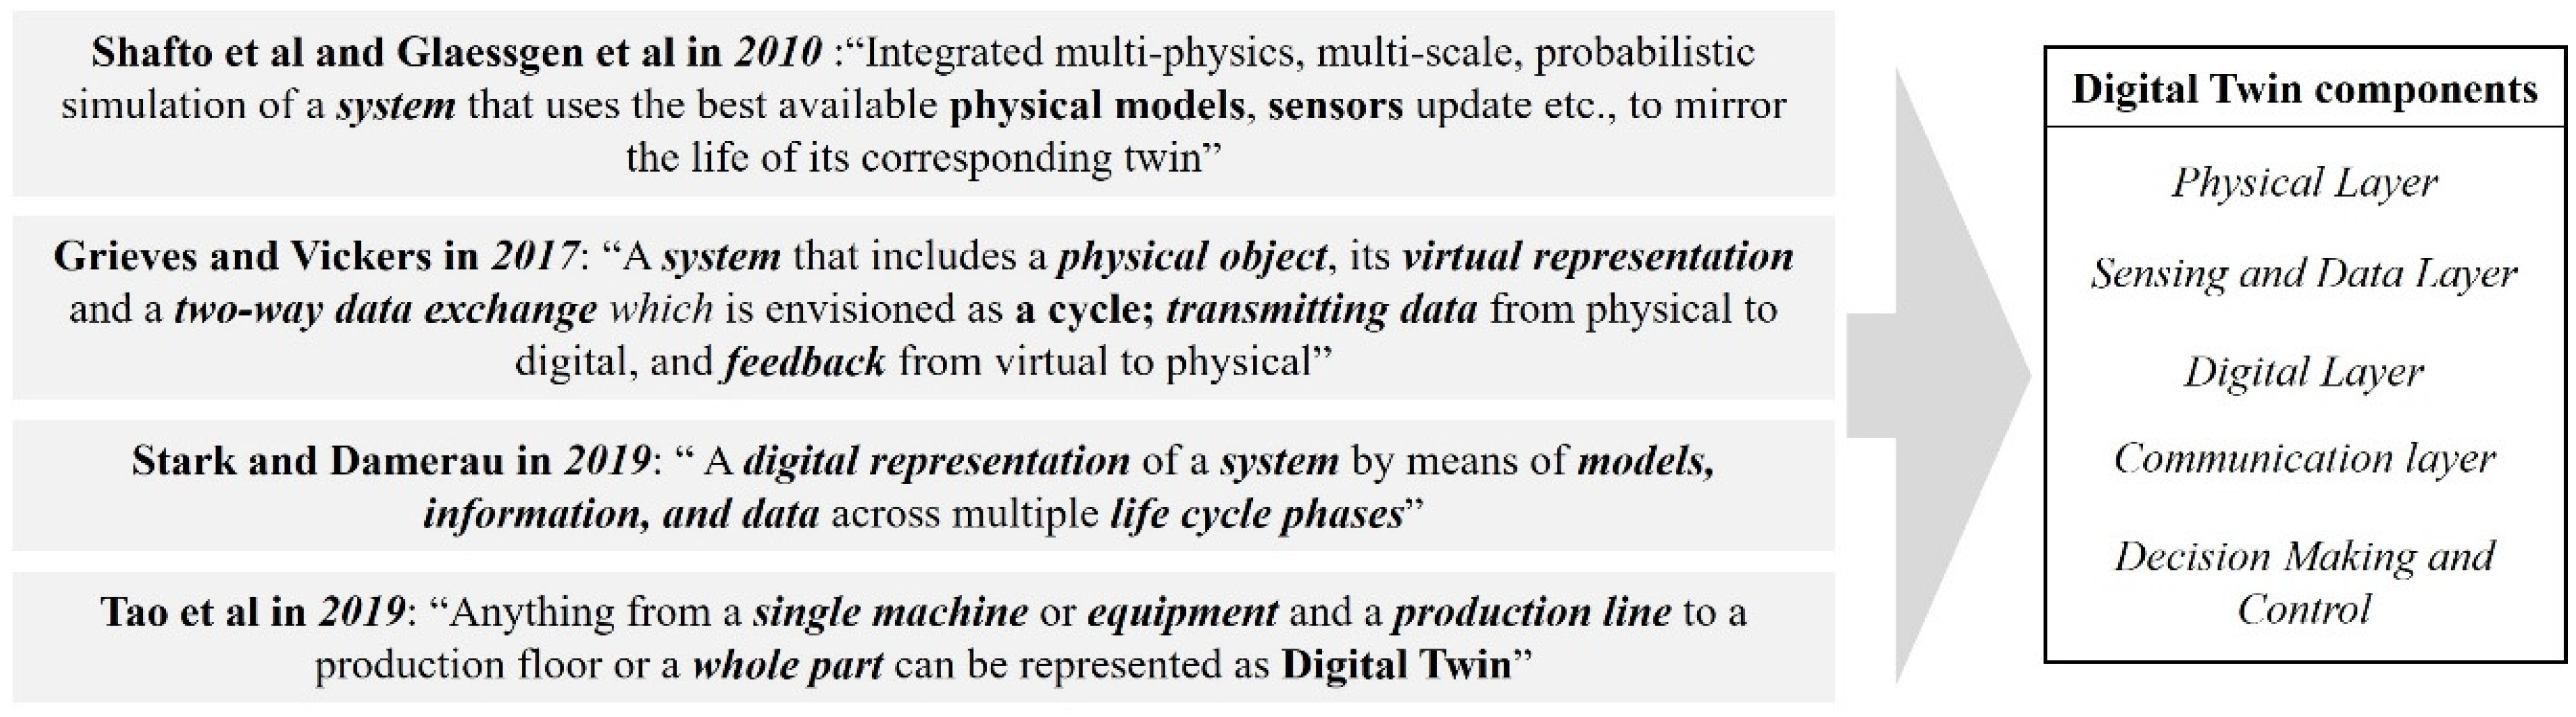
Publisher’s Note: MDPI stays neutral with regard to jurisdictional claims in published maps and institutional affiliations. |
© 2022 by the author. Licensee MDPI, Basel, Switzerland. This article is an open access article distributed under the terms and conditions of the Creative Commons Attribution (CC BY) license (https://creativecommons.org/licenses/by/4.0/).
Share and Cite
MDPI and ACS Style
Stavropoulos, P. Digitization of Manufacturing Processes: From Sensing to Twining. Technologies 2022, 10, 98. https://0-doi-org.brum.beds.ac.uk/10.3390/technologies10050098
AMA Style
Stavropoulos P. Digitization of Manufacturing Processes: From Sensing to Twining. Technologies. 2022; 10(5):98. https://0-doi-org.brum.beds.ac.uk/10.3390/technologies10050098
Chicago/Turabian StyleStavropoulos, Panagiotis. 2022. "Digitization of Manufacturing Processes: From Sensing to Twining" Technologies 10, no. 5: 98. https://0-doi-org.brum.beds.ac.uk/10.3390/technologies10050098
Note that from the first issue of 2016, this journal uses article numbers instead of page numbers. See further details here.