
Investigation of AgI-Based Solid Solutions with Ag2CO3

Department of Chemistry and Chemical Engineering, Yamagata University, Yonezawa, Yamagata 992-8510, Japan
*
Author to whom correspondence should be addressed.
Technologies 2021, 9(3), 54; https://0-doi-org.brum.beds.ac.uk/10.3390/technologies9030054
Submission received: 12 May 2021
/
Revised: 12 July 2021
/
Accepted: 20 July 2021
/
Published: 25 July 2021
(This article belongs to the Special Issue Smart Systems (SmaSys2019&2020))
Abstract
:The formation phenomena of silver carbonate (Ag2CO3)–silver iodide (AgI) solid solutions were investigated by X-ray diffraction, thermogravimetry-differential thermal analysis, and electrical conductivity measurement. Results revealed that AgI and Ag2CO3 reacted with each other when mixed at room temperature. The reaction products were classified into three types: (1) AgI-based solid solutions in the AgI-rich region for x = 10% or less in x Ag2CO3–(1 − x) AgI; (2) Ag2CO3-based solid solutions in the Ag2CO3-rich region for x = 60% or more; and (3) silver carbonate iodides in the intermediate range for x between 10% and 60%. For the AgI-based solid solutions, the incorporation of Ag2CO3 into the AgI lattice expanded the unit cell and enhanced electrical conductivity. The solubility limit of Ag2CO3 into the AgI lattice estimated from the differential thermal analysis was x ≈ 5%.
1. Introduction
A solid electrolyte is a material that exhibits ionic conductivity through a bulk solid. A bulk solid with ionic conductivity similar to that of an electrolyte solution (~10−3 S/cm) is called a superionic conductor. Because of the use of liquids, electrolyte solutions currently used in primary and secondary batteries cause accidents such as leakage of electrolyte solution and explosions when organic electrolytes are used. However, by replacing electrolyte solutions with a solid superionic conductor, an all-solid-state battery that does not exhibit the problems associated with liquid electrolytes can be obtained. Improved safety, wide operating temperature ranges, and high energy density are the advantages of solid electrolytes [1,2].
Silver iodide (AgI) is a popular superionic conductor with three polymorphs: α-, β-, and γ-phase. The β- and γ-phase are predominant at room temperature (RT) and undergo a phase transition at 147 °C to the α-phase. The α-phase is a superionic conductor with an ionic conductivity of ~1 S/cm [3], whereas the β- and γ-phase have low ionic conductivities of 10−6 to 10−5 S/cm. The superionic conduction of α-AgI is explained by the melting of the Ag+ sublattice, whereas the I− body-centered lattice supports the crystal structure [4,5,6].
We recently explored the AgI–Ag2CO3 system and discovered two new crystallographic phases with the nominal compositions of Ag10(CO3)3I4 [7] and Ag17(CO3)3I11 [8]. The latter was an Ag+ superionic conductor that was unknown before our work. It exhibited an ionic conductivity of 0.16 S/cm at RT with an activation energy of 0.33 eV in the temperature range of −9 °C to 19 °C. The ionic conductivity of Ag17(CO3)3I11 is comparable with or higher than that of other RT superionic conductive silver compounds such as RbAg4I5, KAg4I5 [9,10,11,12,13], Ag19I15P2O7, Ag7I4PO4 [14], Ag6I4WO4 [15], and Ag26I18W4O16 [16]. The conduction of Ag17(CO3)3I11 was completely ionic with an ionic transport number of 100%. Another silver carbonate iodide, Ag10(CO3)3I4, has a layered arrangement of the constituent atoms Ag/CO3/Ag/I/Ag along <1 0 −1> and is a modest ionic conductor with an ionic conductivity of 10−6 S/cm [7].
Although superionic Ag+ conductivity has been known of for a long time, Ag+ conductors are not widely used in industries because of problems associated with phase stability at RT. For instance, the α-AgI phase is stable only above 147 °C [3], RbAg4I5 is unstable in the presence of atmospheric moisture [10], and Ag17(CO3)3I11 is metastable at RT so that it gradually decomposes into AgI and Ag10(CO3)3I4 after a few weeks [8].
We recently discovered that Ag2CO3 and AgI form a solid solution and that adding Ag2CO3 to the AgI lattice improves the electrical conductivity of AgI-based solid solutions significantly. The specifics of this phenomenon are discussed herein. The investigation of this system will provide a deeper understanding of the mechanism by which CO3 groups improve Ag+ conductivity in silver compounds, as well as an insight into the design of a new Ag+ superionic conductor. It is worth noting here that the AgI-based solid solution is formed by simply mixing Ag2CO3 and AgI at RT. This may allow for continuous synthesis, in contrast to typical Ag+ conductors which are usually prepared in batch form at high temperatures. The stable and easy-to-prepare AgI-based solid solutions treated in this paper will open up innovative new applications for Ag+ conductors.
2. Materials and Methods
The starting powders of AgI and Ag2CO3 were prepared by precipitating aqueous solutions of AgNO3 (99.8%, Kanto Chemical Co., Inc., Tokyo, Japan) and KI (99.5%, Kanto Chemical) at 60 °C for AgI, and AgNO3 and (NH4)2CO3 (30 mass % as NH3, Kanto Chemical) for Ag2CO3. The x Ag2CO3–(1 − x) AgI samples were prepared by thoroughly mixing Ag2CO3 and AgI powders at a particular molar ratio in an agate mortar for 40 min with a small amount of water as a mixing medium. The starting mixture was heated at 148 °C for 60 min in a glass tube with one end open. The samples for the electrical conductivity measurement were pelletized at 750 MPa before heating.
X-ray diffraction (XRD) with Cu Kα radiation (λ = 1.54183 Å) was carried out to identify the crystalline phases using Rigaku MiniFlex 600 (Rigaku Co., Tokyo, Japan). The diffraction data were collected at RT using a one-dimensional detector (Rigaku D/teX Ultra 250). The X-ray tube was operated at 40 kV and 15 mA. The Rietveld method (Rigaku PDXL Ver. 2.8.1.1) was used to refine the lattice parameters [17]. Thermogravimetry–differential thermal analysis (TG-DTA) using Rigaku Thermo plus Evo was performed at a ramp rate of 3 °C/min in the presence of synthetic dry air flowing at 100 sccm (standard cubic centimeters per minute).
The electrical conductivity of the pelletized samples was measured using the alternating current impedance method at frequencies ranging from 5.5 MHz to 10 Hz and Vrms = 0.05 V using an NF ZM2376 LCR meter (NF Co., Yokohama, Japan) for pellets with a diameter of 4.25 mm and thickness of 1.5 mm. Au electrodes were deposited on both sides of the pellets by vacuum evaporation using JEOL JEE-03 (JEOL Ltd., Tokyo, Japan). The samples were handled in the dark to prevent photodegradation due to the potential photosensitivity of Ag compounds.
3. Results
Phase Identification
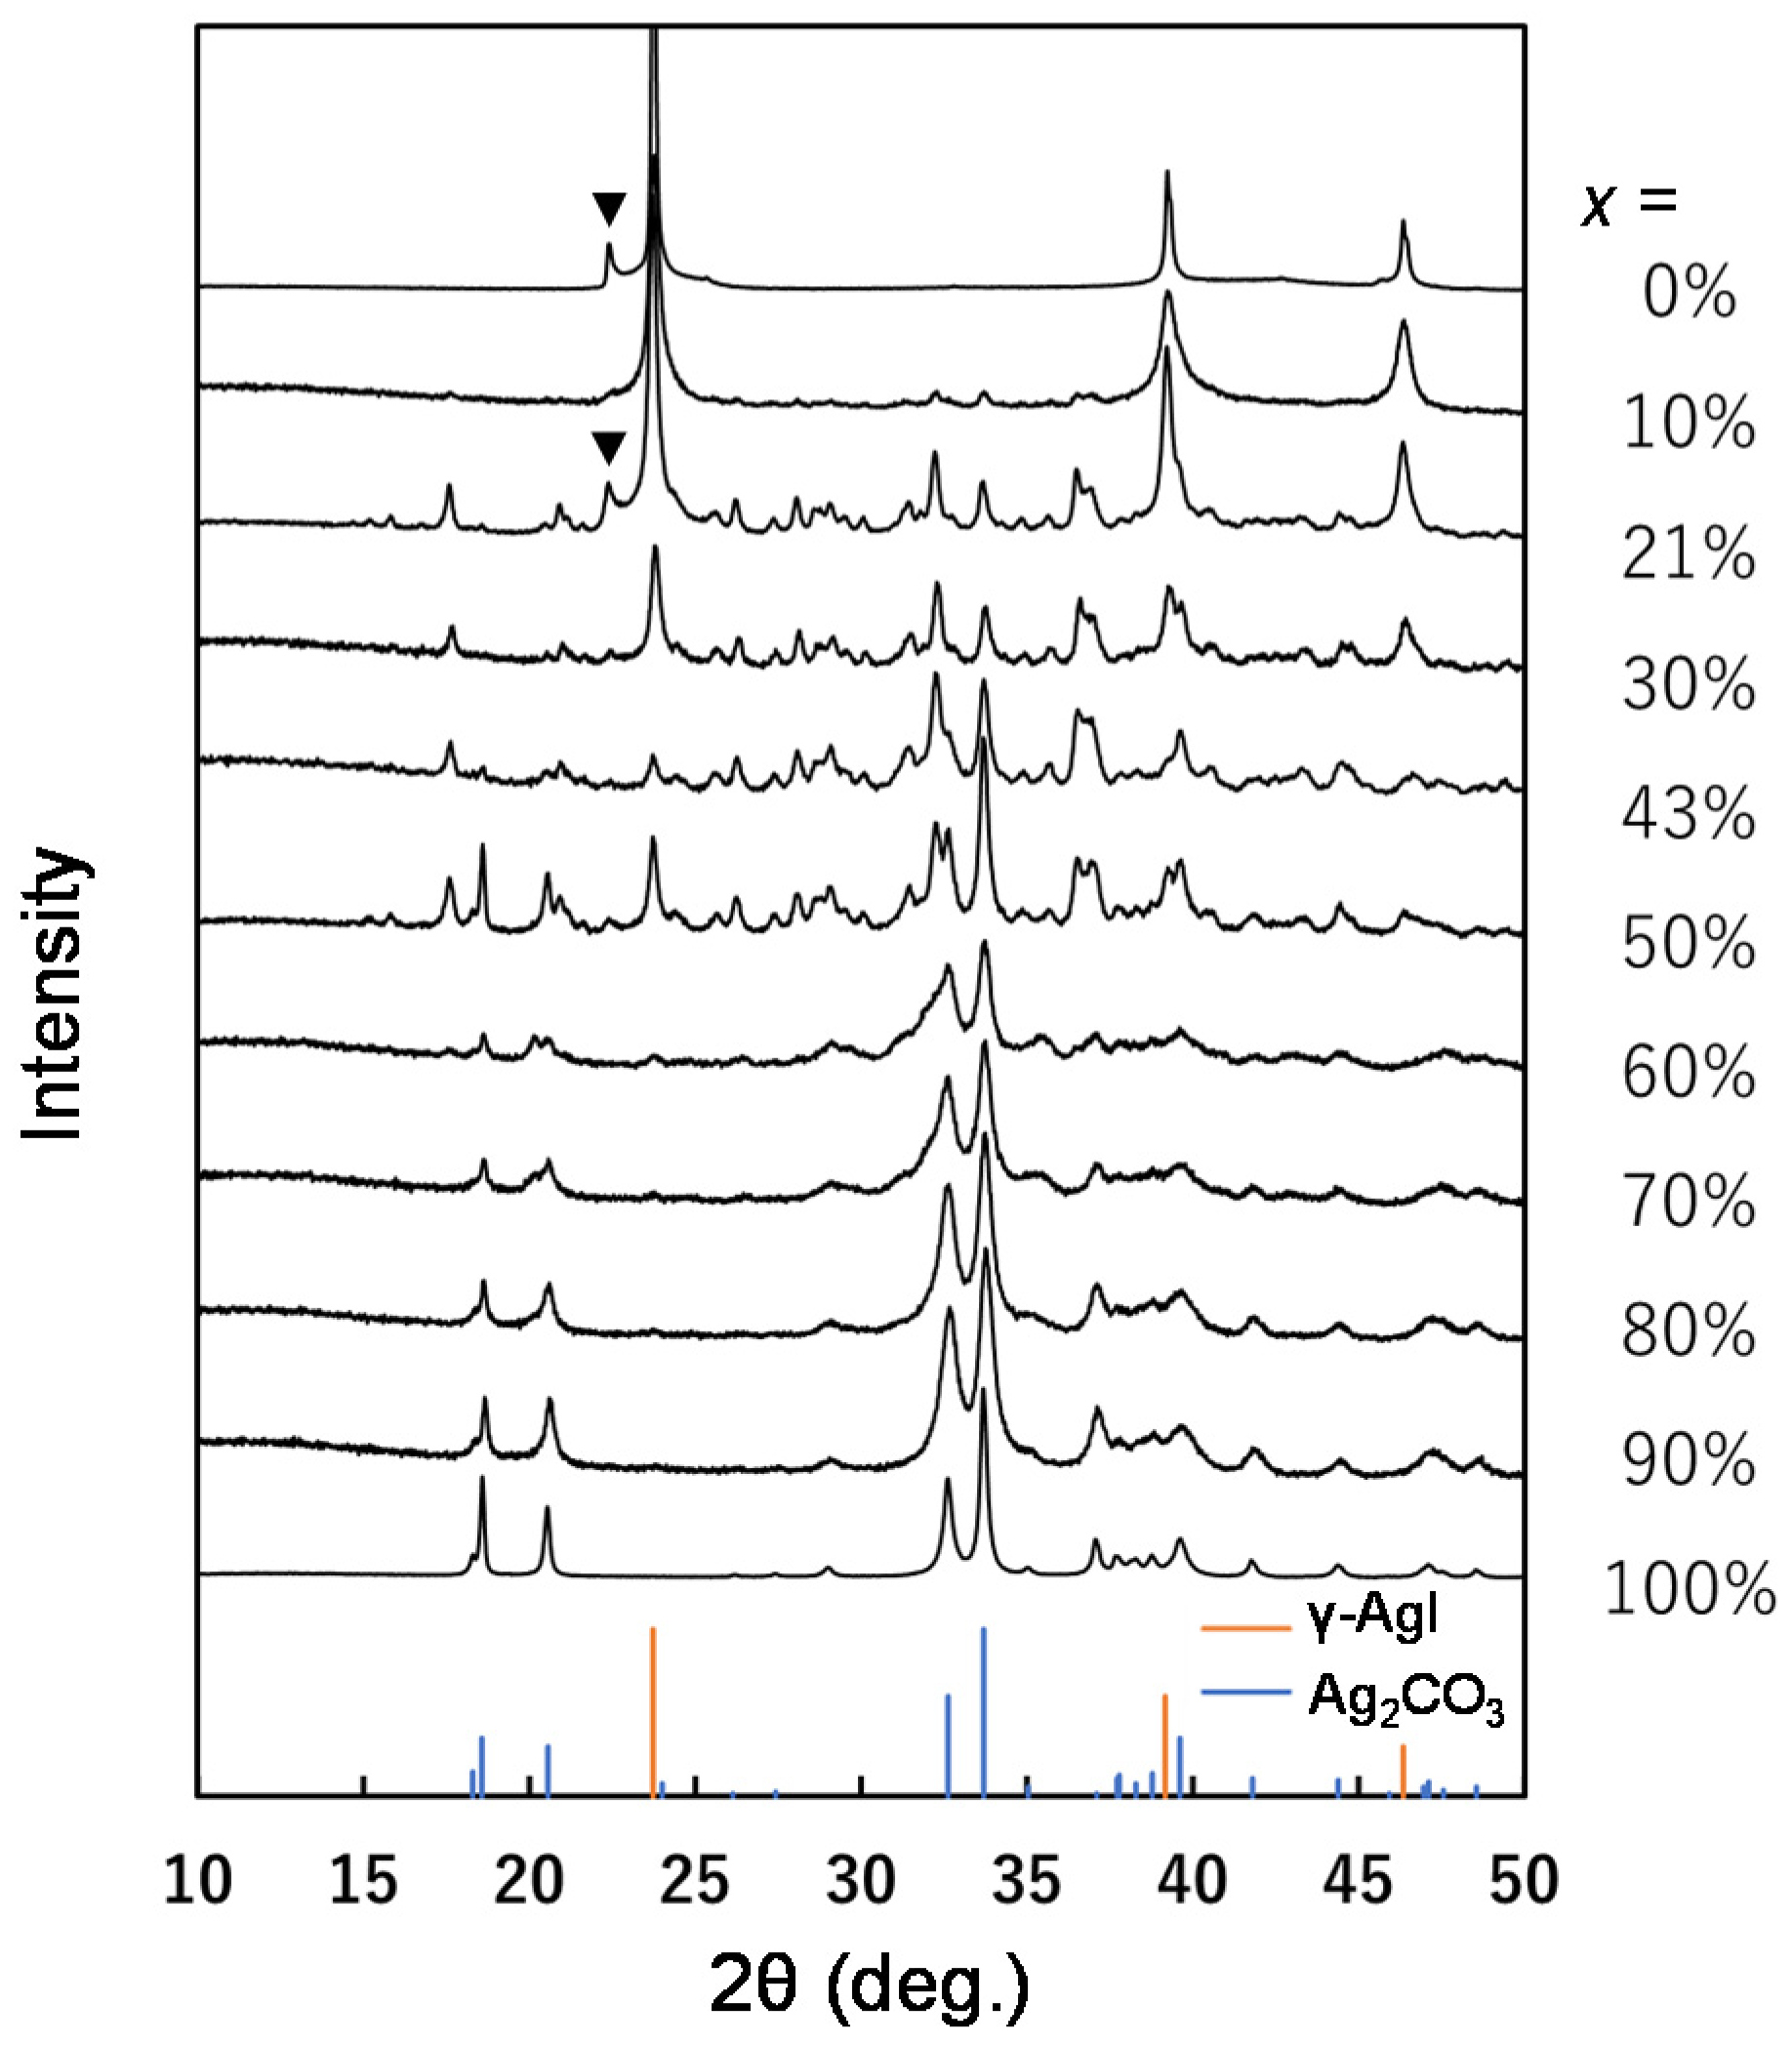
Figure 1 depicts the XRD patterns of the unheated samples of x Ag2CO3–(1 − x) AgI. The peaks at x = 0% were assigned to γ-AgI with the coexistence of a small amount of β-AgI. γ-AgI remained the main phase up to x = 10%. Complicated patterns from unidentified silver carbonate iodide(s) were observed between x = 21% and 50%. Although x = 21% and 43% correspond to the compositions of Ag17(CO3)3I11 and Ag10(CO3)3I4, respectively, the patterns do not coincide with the corresponding silver carbonate iodides because the formation of these silver carbonate iodides requires heat treatment. Ag2CO3 was seen as the main phase at x ≥ 60%.
The results showed that Ag2CO3 and AgI reacted with each other even at RT during mixing to form solid solutions in the AgI-rich (x ≤ 10%) or the Ag2CO3-rich (x ≥ 60%) regions. Silver carbonate iodides were formed in the intermediate range of x = 10–60%.
Subsequently, we focused on the effects of Ag2CO3 in the AgI-based solid solutions because the addition of Ag2CO3 to AgI enhanced the electrical conductivity, as discussed later.
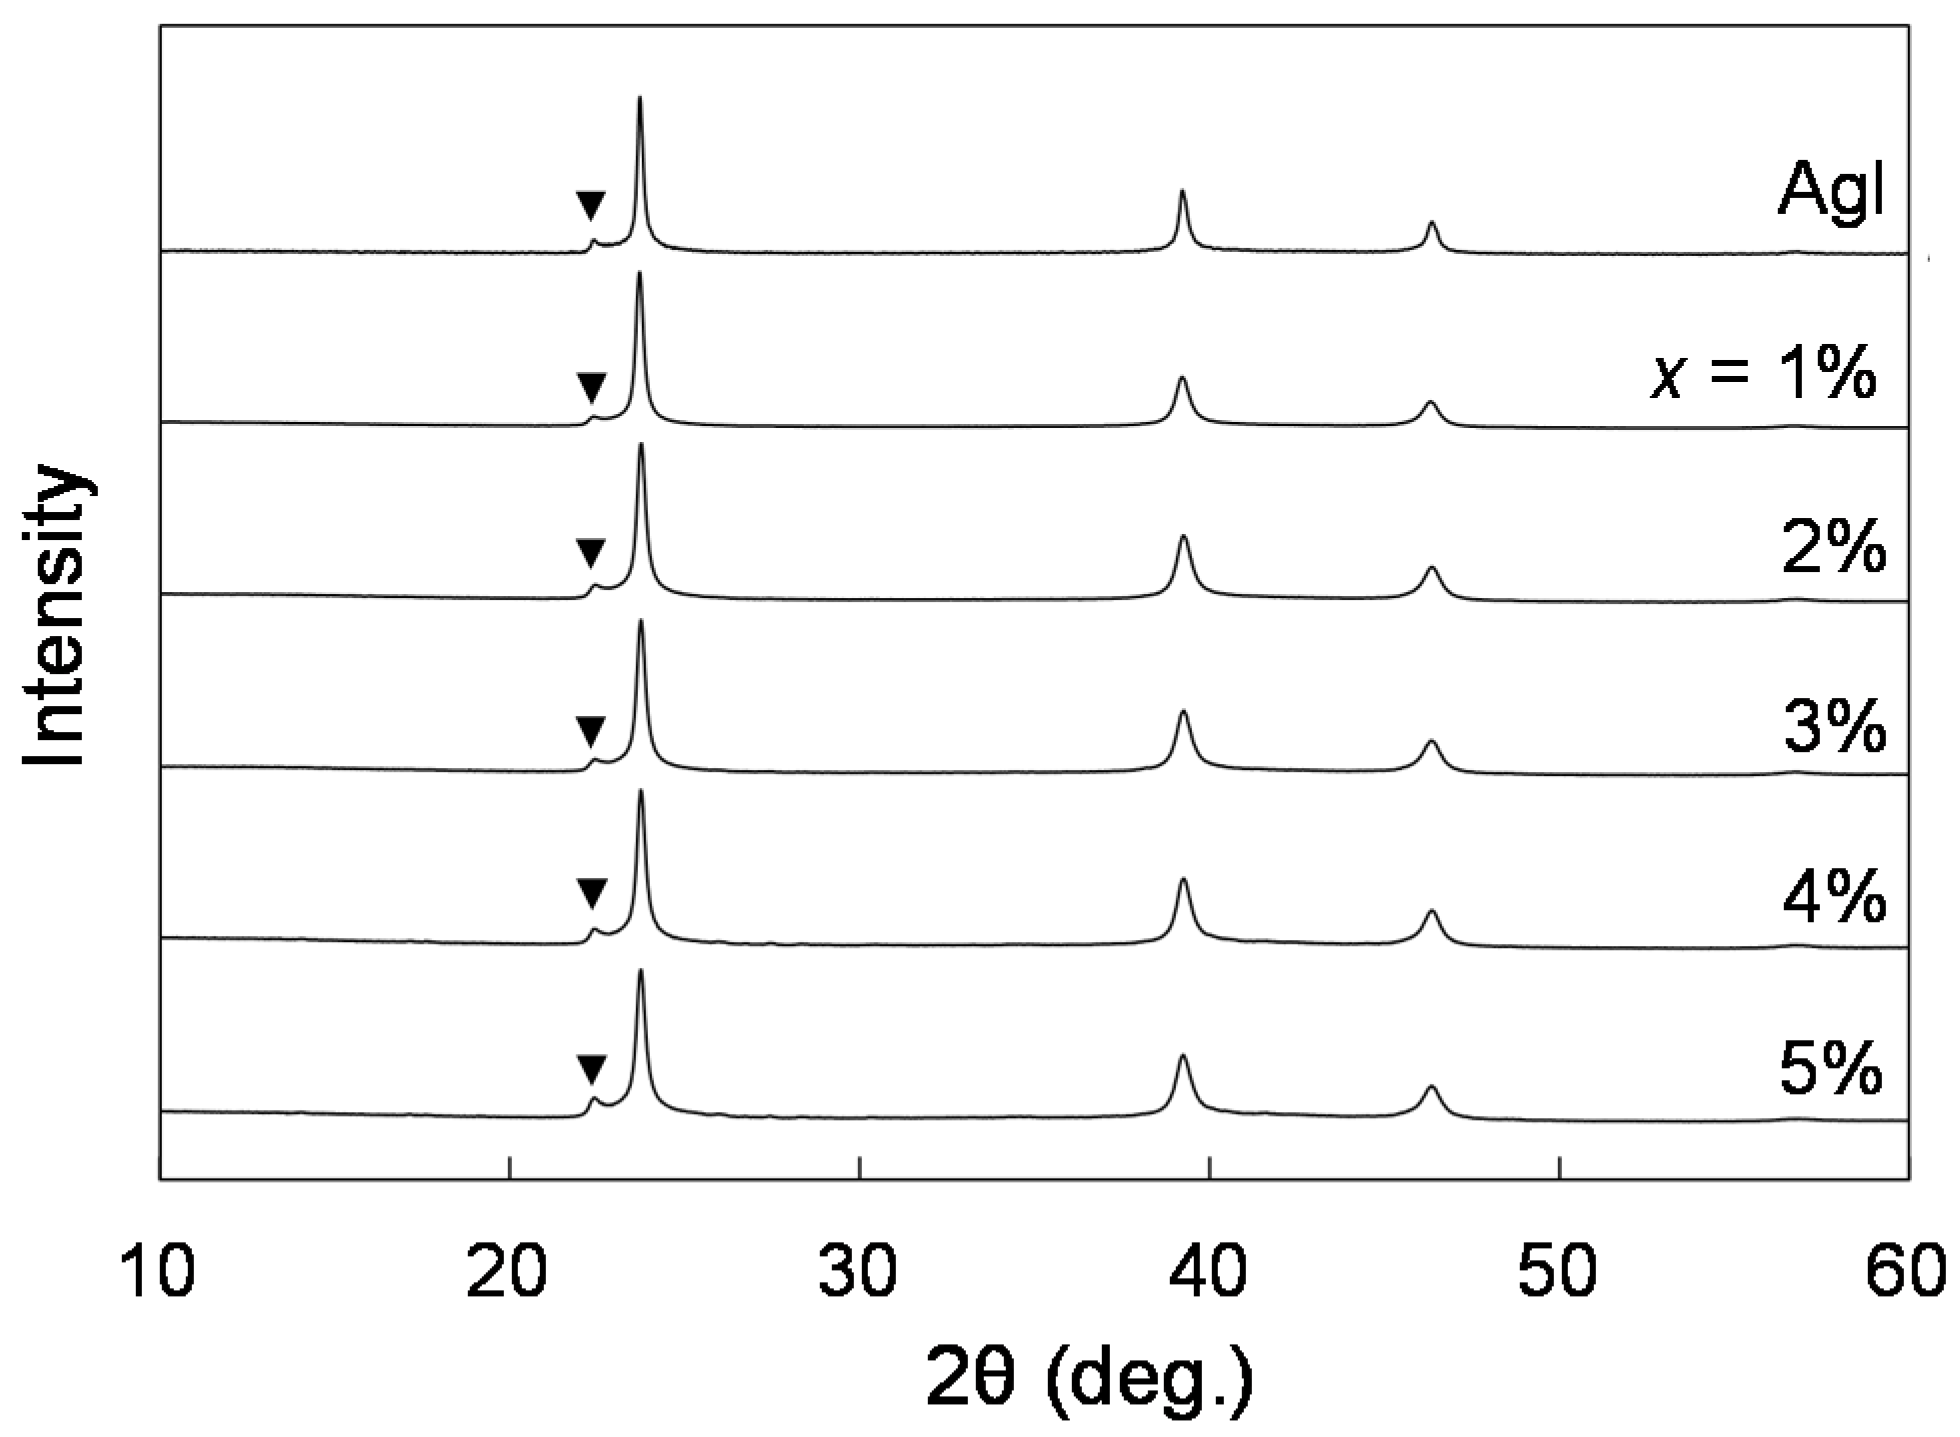
The γ-phase is the RT phase of AgI. However, heated products are usually mixtures of γ- and β-AgI because γ-AgI (zinc-blende type) and β-AgI (wurtzite-type) are structurally similar. The β-phase in the mixtures can be reduced using the pressure-induced phase transition from β- to γ-AgI, as illustrated in Figure S1. The heated product contained β-AgI (Figure S1a), and applying pressure preferentially reduced the peaks of β-AgI (Figure S1b). Figure 2 shows the XRD patterns of AgI and AgI-based solid solutions at x = 1–5% prepared at 148 °C, where the samples were pretreated to suppress the peaks of β-AgI by uniaxial pressing for ease of profile fitting by the Rietveld method. The XRD patterns shown in Figure 2 were measured on the samples of the pressed pellets ground to a powder. Comparison based on the Rietveld analysis for the x = 0% sample (AgI) indicated that the uniaxial pressing reduced the fraction of β-AgI in the sample from 11% in the untreated state to 5.8%, which were estimated from the scale factors refined by the two-phase profile-fitting. The fractions of β-AgI in all the samples in Figure 2 were also around 4–6%.
The patterns in Figure 2 correspond to AgI (γ-AgI and a small amount of β-AgI). The peaks of the Ag2CO3-related compounds were not recognized, which again indicated that the AgI-based solid solutions were formed by the incorporation of Ag2CO3 into AgI.
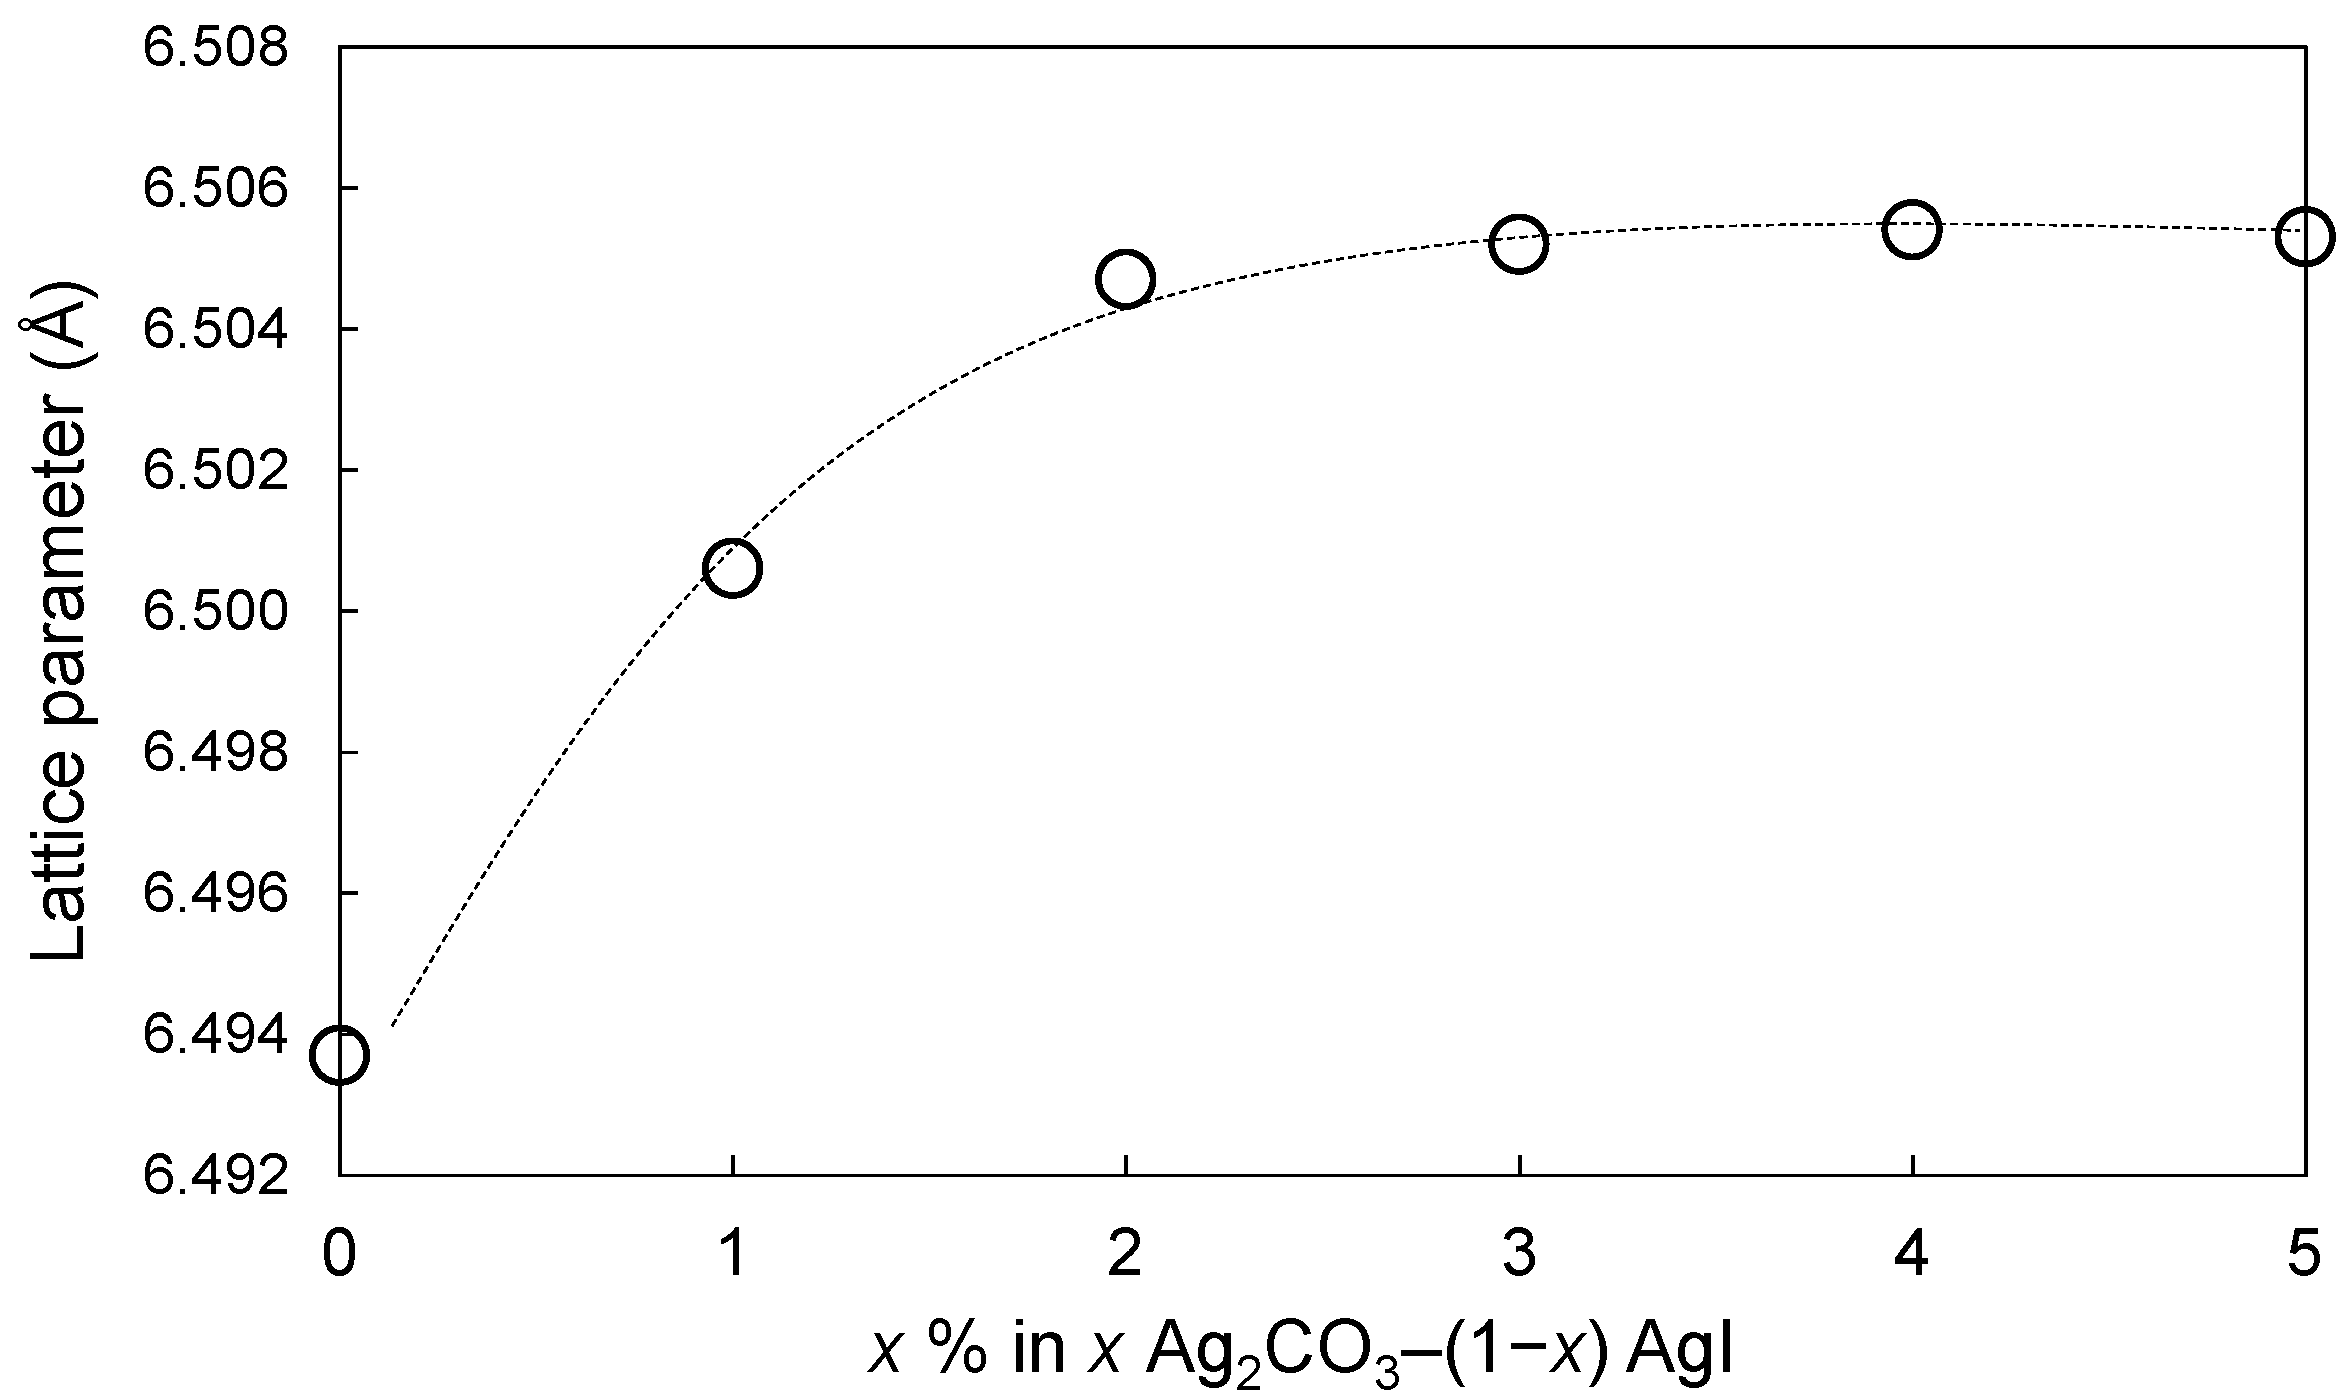
γ-AgI has a cubic zinc-blende-type structure with space group F4(−)3m [18]. The changes in the lattice parameters of γ-AgI with the addition of Ag2CO3 were examined by the Rietveld method. The profile fitting was carried out for the two phases of γ-AgI and β-AgI. Except for z of I in β-AgI, the x, y, and z coordinates were invariable in principle for the refinement because the atoms in γ-AgI and β-AgI are on the special positions. z of I in β-AgI was also fixed at 0.628 which was quoted from the literature [6] because of relatively small contribution of β-AgI to the diffraction intensity. Therefore, each pattern was fitted with the profile parameters of the pseudo-Voigt function, scale factors, and lattice parameters for γ-AgI and β-AgI, as well as the background function and the peak shift parameter common to the two phases, and the preferred orientation parameter of the March-Dollase function for β-AgI. Figure 3 shows the change in the lattice parameters of γ-AgI with the Ag2CO3 content x. The Rwp/Rp and S factors of the Rietveld refinement are listed in Table S1. The addition of Ag2CO3 resulted in a steep expansion of the unit cell from x = 0% to x = 2%, which is evidence of the incorporation of the CO3 groups into the lattice of AgI. From the change in the lattice parameters, the solubility limit appeared to be around x = 2%. However, the lattice parameters increased up to x = 5%, and it was difficult to determine the solubility limit unambiguously. As discussed later, x = 2% coincided with the content of Ag2CO3 where a new endothermic peak arose in the differential thermal analysis (DTA).
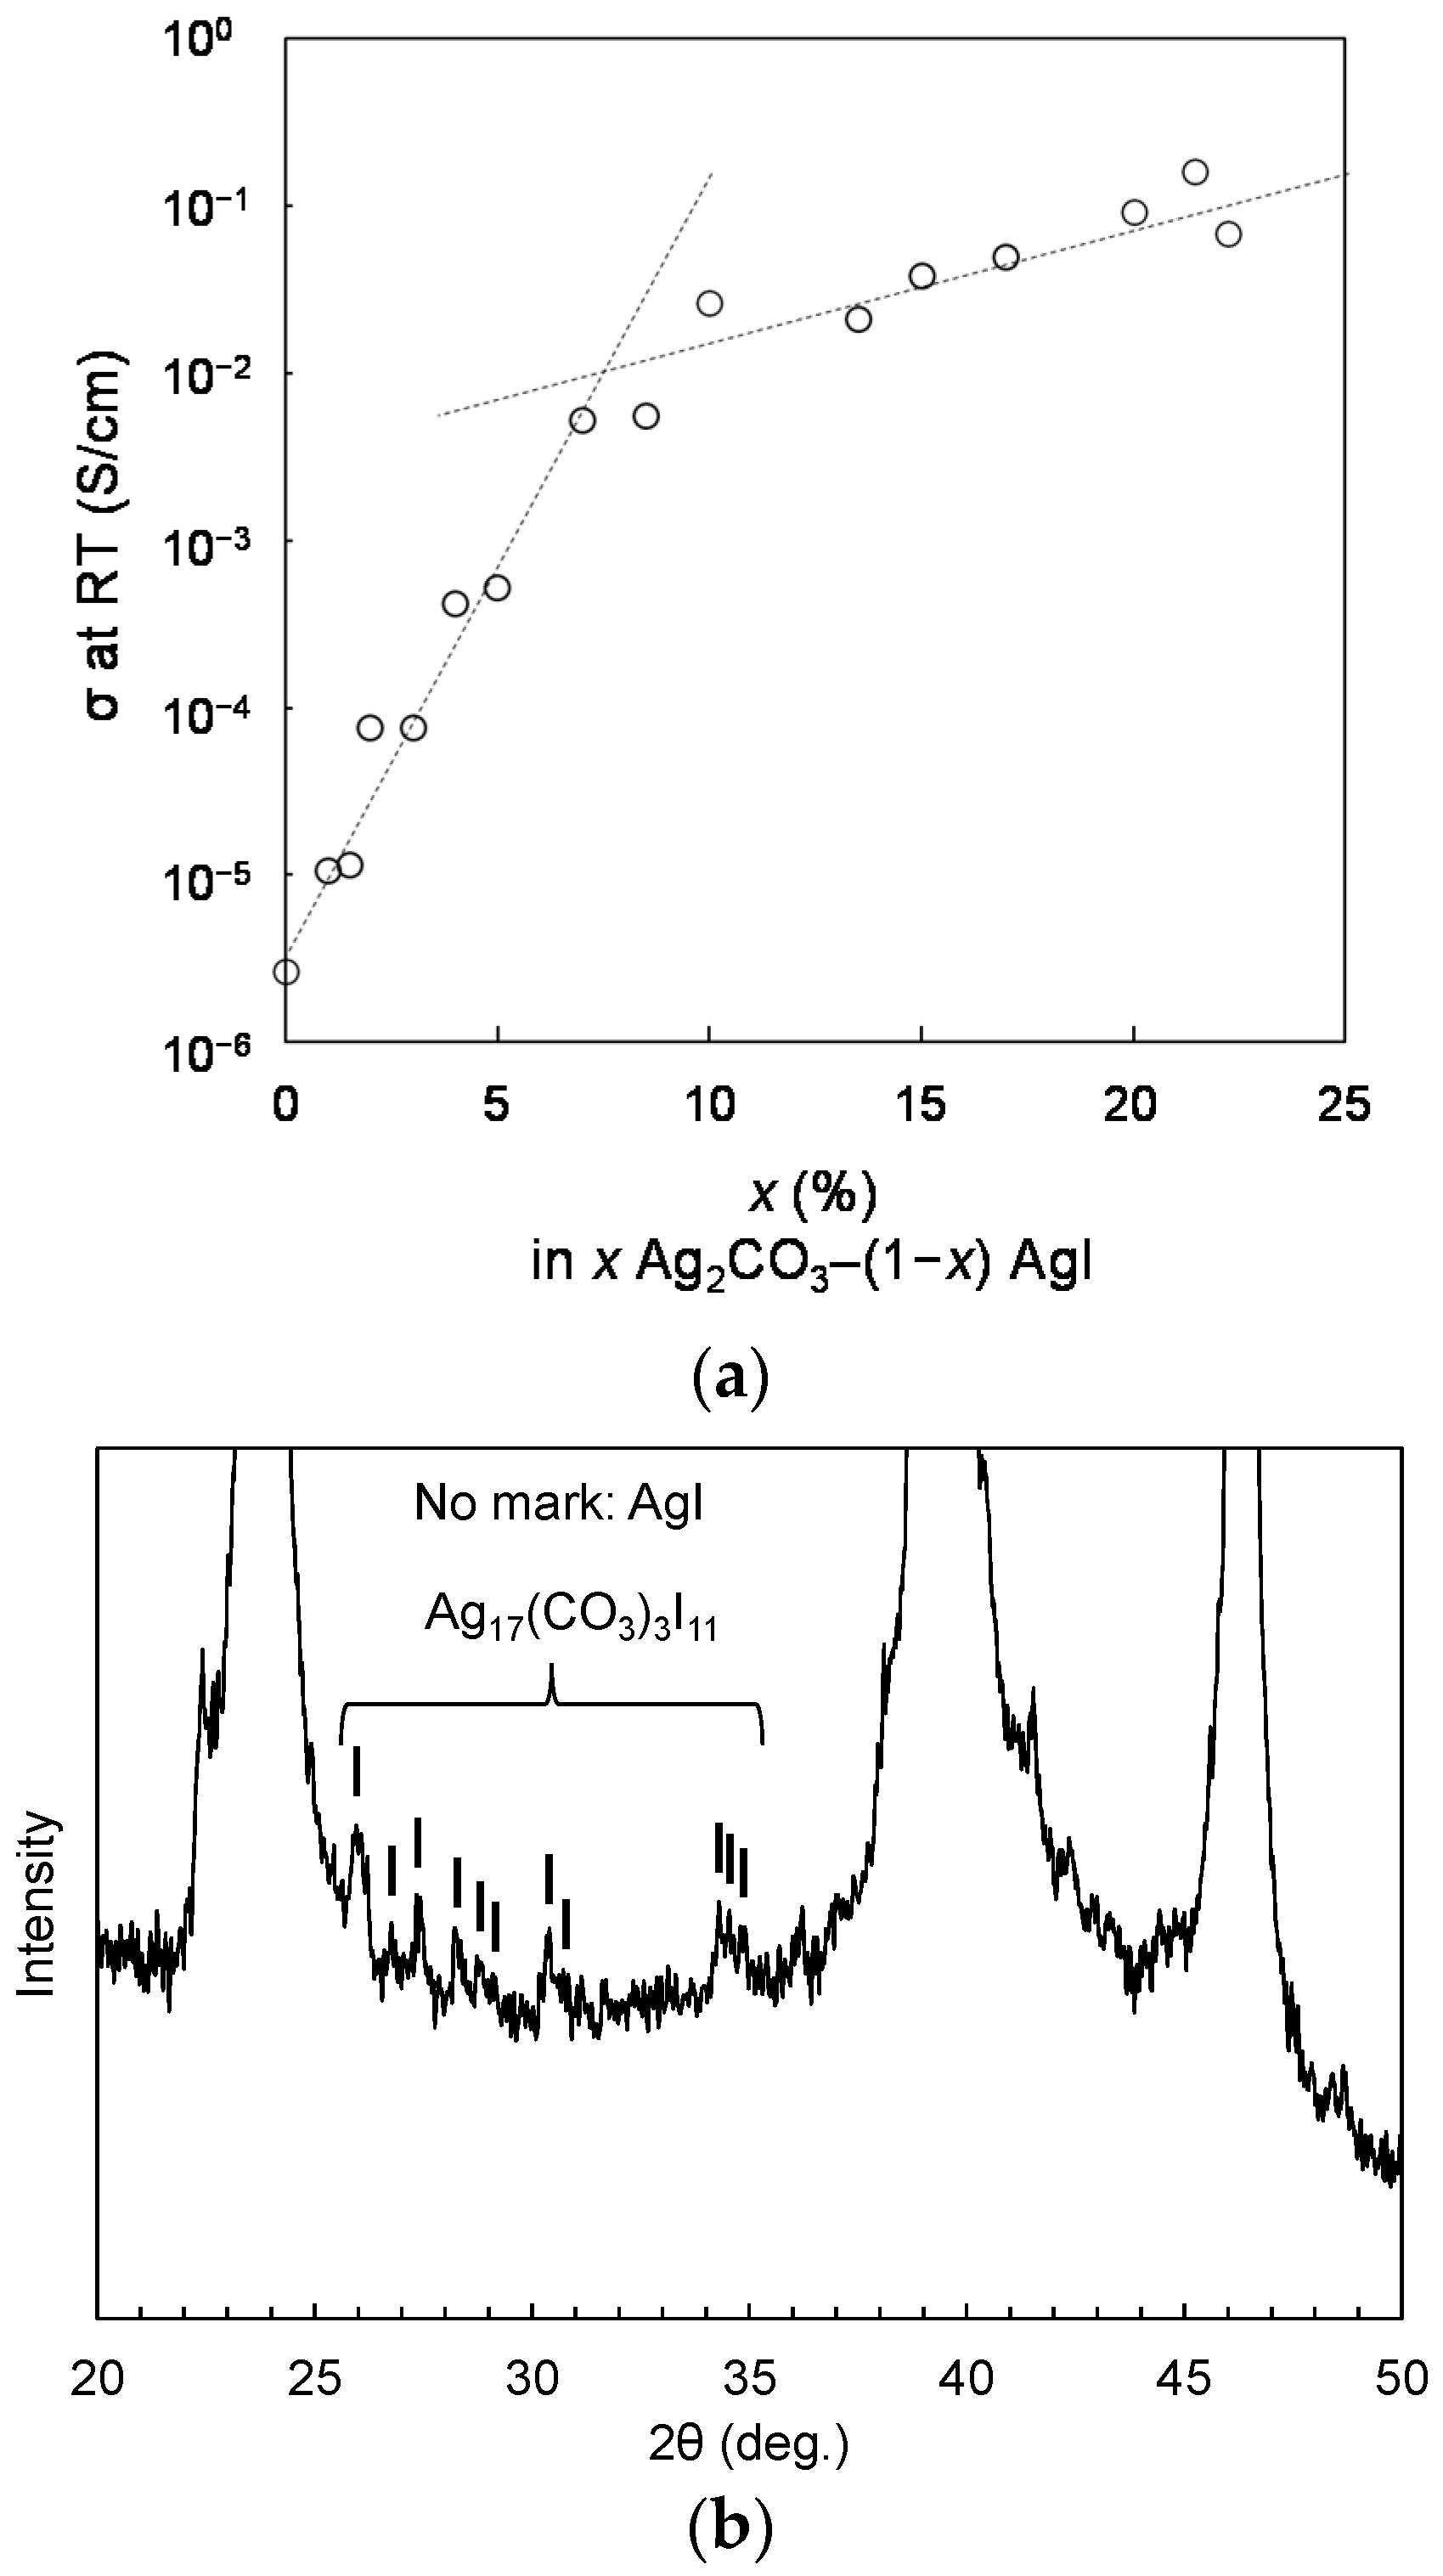
The addition of Ag2CO3 to AgI enhanced the electrical conductivity, as shown in Figure 4a, which illustrates that the electrical conductivity increased with an increase in the Ag2CO3 content, x, from 2.7 × 10⁻⁶ S/cm at x = 0% to 5.2 × 10⁻³ S/cm at x = 7%. The electrical conductivity continued to increase until x = 21% and reached 1.6 × 10⁻¹ S/cm. The slope of the increment was inflected around x = 7%. The XRD study showed the occurrence of superionic conductor Ag17(CO3)3I11 in the XRD peaks at x ≥ 7%. Figure 4b shows the XRD pattern of the x = 7% sample (after pressing treatment), indicating the occurrence of Ag17(CO3)3I11. Therefore, at x < 7%, the enhancement of the electrical conductivity with x was due to the incorporation of CO3 groups into the AgI lattice to form the AgI-based solid solution. For x ≥ 7%, the increase in electrical conductivity was attributed to the fractional growth of the superionic conductor phase in the samples. The slope of this increment was steeper for the AgI-based solid solution at x ≤ 7%.
Figure S2 shows the TG-DTA curves for the unheated x Ag2CO3–(1 − x) AgI mixture at x = 5%. The TG shows no substantial mass change up to 170 °C, demonstrating the thermal stability of the AgI-based solid solution against heat treatment in air until 170 °C without pyrolytic decomposition such as decarbonization. Two endothermic peaks were observed in the DTA at 120 °C and 133 °C. The former peak occurred specifically for the unheated sample and was considered to be associated with the formation of the high ionic conductivity phase.
Figure 5 shows the DTA curves of the x Ag2CO3–(1–x) AgI samples heat-treated at 148 °C from x = 0% to x = 7% without uniaxial pressing treatment. It should be noted that the pretreatment with uniaxial pressing had no substantial effect on the DTA results. The AgI (x = 0%) exhibited a sharp endothermic peak at 147 °C, corresponding to the phase transition to the α phase [3]. Since γ-AgI and β-AgI are difficult to distinguish due to the structural similarity, the term “β/γ-to-α phase transition” is used in this paper to describe this phase transition. The phase transition between γ-AgI and β-AgI is obscure and is usually not detected by DTA, as the fraction of β-AgI increases with increasing temperature.
The temperature of the β/γ-to-α phase transition shifted to a lower temperature with x, which was attributed to the incorporation of the CO3 groups into the AgI lattice. Further, a new endothermic peak was recognized at 133 °C for x ≥ 2%, and its peak position was independent of x. This endothermic peak was observed regardless of the heating/cooling history for the samples and could thus be associated with a reversible phase transition. Because XRD revealed no peaks other than those of AgI, the new endothermic peak was also assumed to be due to the β/γ-to-α phase transition of the AgI-based solid solution, indicating that the AgI-based solid solution was separated into Ag2CO3-richer and -poorer regions. The two peaks observed in the DTA for x = 2%–4% overlapped at x = 5%; therefore, the concentration of the Ag2CO3-richer region was considered as 5%. It was unclear whether the phase separation was due to thermodynamic factors such as a decrease in free energy, or by the inhomogeneity of the starting Ag2CO3–AgI mixtures.
The enthalpy change ΔtHβ→α associated with the phase transition between β-AgI and α-AgI has been reported to be 5.4 ± 2 kJ/mol [19]. The estimated enthalpy changes by comparing the peak areas of the endothermic peaks at x = 1%, 2%, 3%, 4%, and 5% with that of AgI were 5.4, 5.4, 5.4, 5.1, and 5.2 kJ/mol, respectively, which were in reasonable agreement with the ΔtHβ→α of AgI. This thermodynamic consideration supported that all the endothermic peaks in Figure 5 were due to the phase transition to the α phase.
4. Discussion
The results of this study showed that the incorporation of CO3 groups into the AgI lattice led to the formation of the AgI-based solid solutions. The CO3 groups expanded the unit cell of the AgI lattice, reduced the β/γ-to-α phase-transition temperature, and ultimately enhanced the electrical conductivity. The solubility limit of Ag2CO3 was unclear, as it depended on the characterization techniques of XRD, DTA, and electrical measurement. For example, the expansion of the unit cell leveled off around x = 2% (Figure 3) and the slope of electrical conductivity was inflected around x = 7% (Figure 4a).
The inflection point of the electrical conductivity at around x = 7% corresponded to the Ag2CO3 concentration at which the small peaks of Ag17(CO3)3I11 were observed in XRD (Figure 4b). The Ag17(CO3)3I11 phase is highly conductive, and the increase in the electric conductivity above x = 7% was attributed to the segregation of this conductive phase in the matrices of AgI-based solid solutions. On the other hand, XRD is not inherently sensitive to the detection of trace phases, and the presence of a very small amount of isolated Ag17(CO3)3I11 fragments was not expected to have a significant effect on the electrical conductivity of the sample. Therefore, it was difficult to determine the solubility limit based on the XRD peaks and the results of the electrical conductivity measurement. In addition, the DTA indicated the phase separation of the AgI-based solid solutions at x = 2% and above. x = 2% corresponded to the concentration at which the lattice expansion ceased in Figure 3. That was probably related to the fact that if the AgI-based solid solutions consisted of two regions with different Ag2CO3 concentrations and their peaks were not resolved, the Rietveld analysis might not provide the correct lattice parameters. Actually, the main peaks around 23.7° in Figure 2 broadened with increasing x, and their full-width at half-maximum increased from 0.20° at x = 0% to 0.30° at x = 5% through 0.26°, 0.28°, 0.29°, and 0.28° at x = 1%, 2%, 3%, and 4%, respectively. That was consistent with the coexistence of two regions with slightly different lattice parameters.
On the other hand, the DTA (Figure 5) indicated the phase separation of the AgI-based solid solution into two regions with different Ag2CO3 contents between x = 2% and 5%. The β/γ-to-α phase-transition temperature of the AgI-based solid solution decreased with increasing Ag2CO3 content down to 133 °C at x = 5%. The lowest phase-transition temperature was considered to originate from the region with the highest content of Ag2CO3 allowed in the AgI-based solid solution. Therefore, the solubility limit for Ag2CO3 in the AgI-based solid solution was concluded to be around x = 5%.
The mechanism of the CO3 groups enhancing the electrical conductivity of the AgI-based solid solutions is still unclear and will be investigated in future studies.
5. Conclusions
This study revealed that reactions occurred between Ag2CO3 and AgI during their initial mixing at RT, which led to the formation of (1) AgI-based solid solutions in the AgI-rich region, (2) Ag2CO3-based solid solutions in the Ag2CO3-rich region, and (3) silver carbonate iodides in the intermediate range. In the AgI-based solid solutions, the incorporation of the CO3 groups into the AgI lattice lowered the β/γ-to-α phase-transition temperature and enhanced the electrical conductivity of the AgI-based solid solution. The solubility limit of Ag2CO3 into the AgI lattice was estimated to be near x = 5% in the x Ag2CO3–(1 − x) AgI, and the incorporation of CO3 groups at this concentration enhanced the electrical conductivity at RT by two orders of magnitude, from 2.7 × 10⁻⁶ S/cm at x = 0% to 5.2 × 10⁻⁴ S/cm after the heat treatment at 148 °C.
Supplementary Materials
The following are available online at https://0-www-mdpi-com.brum.beds.ac.uk/article/10.3390/technologies9030054/s1. Figure S1. Demonstration of the pressure-induced phase transition from β- to γ-AgI—the peaks indicated using ▼ correspond to β-AgI (ICDD # 9–374); the unmarked peaks are γ-AgI (ICDD # 9–399); the sample heated at 148 °C was a mixture of β- and γ-AgI (a) and uniaxial pressing preferentially suppressed β-AgI (b). Figure S2. Thermogravimetry–differential thermal analysis curves of x Ag2CO3–(1 − x) AgI at x = 5%. Table S1. Fitting results of the Rietveld method.
Author Contributions
Conceptualization, Y.M.; methodology, K.U.; validation, K.U. and Y.M.; formal analysis, K.U.; investigation, K.U. and Y.M.; writing—original draft preparation, K.U.; writing—review and editing, Y.M.; visualization, K.U.; supervision, Y.M.; and project administration, Y.M. All authors have read and agreed to the published version of the manuscript.
Funding
This research received no external funding.
Institutional Review Board Statement
Not applicable.
Informed Consent Statement
Not applicable.
Data Availability Statement
All data generated or analyzed during this study are included in this article.
Conflicts of Interest
The authors declare no conflict of interest.
References
- Sakuda, A. Favorable composite electrodes for all-solid-state batteries. J. Ceram. Soc. Jpn. 2018, 126, 675–683. [Google Scholar] [CrossRef] [Green Version]
- Sun, Y.-K. Promising All-Solid-State Batteries for Future Electric Vehicles. ACS Energy Lett. 2020, 5, 3221–3223. [Google Scholar] [CrossRef]
- Tubandt, C.; Lorenz, E. Molekularzustand und elektrisches Leitvermögen kristallisierter Salze. Z. Phys. Chem. 1914, 87, 513–542. [Google Scholar] [CrossRef]
- Strock, L.W. Kristallstruktur des Hochtemperatur—Jodsilbers α-AgJ. Z. Phys. Chem. 1934, B25, 441–459. [Google Scholar] [CrossRef]
- Strock, L.W. Ergänzung und Berichtigung zu: “Kristallstruktur des Hochtemperatur-Jodsilbers α-AgJ”. Z. Phys. Chem. 1936, B31, 132–136. [Google Scholar] [CrossRef]
- Cava, R.J.; Reidinger, F.; Wuensch, B.J. Single-crystal neutron-diffraction study of AgI between 23° and 300 °C. Solid State Commun. 1977, 24, 411–416. [Google Scholar] [CrossRef]
- Suzuki, R.; Watanabe, Y.; Yamane, H.; Kitaura, M.; Uchida, K.; Matsushima, Y. Crystal structure of silver carbonate iodide Ag10(CO3)3I4. Acta Crystallogr. 2021, E77, 734–738. [Google Scholar] [CrossRef]
- Watanabe, Y.; Suzuki, R.; Kato, K.; Yamane, H.; Kitaura, M.; Ina, T.; Uchida, K.; Matsushima, Y. Superionic Ag+ conductor Ag17(CO3)3I11. Inorg. Chem. 2021, 60, 2931–2938. [Google Scholar] [CrossRef] [PubMed]
- Bradley, J.N.; Greene, P.D. Potassium iodide + silver iodide phase diagram. High ionic conductivity of KAg4I5. Trans. Faraday Soc. 1966, 62, 2069–2075. [Google Scholar] [CrossRef]
- Owens, B.B.; Argue, G.R. High-Conductivity Solid Electrolytes: MAg4I5. Science 1967, 157, 308–310. [Google Scholar] [CrossRef] [PubMed]
- Bradley, J.N.; Greene, P.D. Solids with high ionic conductivity in group 1 halide systems. Trans. Faraday Soc. 1967, 63, 424–430. [Google Scholar] [CrossRef]
- Bradley, J.N.; Greene, P.D. Relationship of structure and ionic mobility in solid MAg4I5. Trans. Faraday Soc. 1967, 63, 2516–2521. [Google Scholar] [CrossRef]
- Owens, B.B.; Argue, G.R. High conductivity solid electrolyte system Rbl-AgI. J. Electrochem. Soc. 1970, 117, 898–900. [Google Scholar] [CrossRef]
- Takahashi, T.; Ikeda, S.; Yamamoto, O. Solid-state ionics—Solids with high ionic conductivity in the systems silver iodide–silver oxyacid salts. J. Electrochem. Soc. 1972, 119, 477–482. [Google Scholar] [CrossRef]
- Takahashi, T.; Ikeda, S.; Yamamoto, O. Solid-state ionics: A new high ionic conductivity solid electrolyte Ag6I4WO4 and use of this compound in a solid-electrolyte cell. J. Electrochem. Soc. 1973, 120, 647–651. [Google Scholar] [CrossRef]
- Chan, L.Y.Y.; Geller, S. Crystal structure and conductivity of 26-silver 18-iodide tetratungstate, Ag26I18W4O16. J. Solid State Chem. 1977, 21, 331–347. [Google Scholar] [CrossRef]
- PDXL: Integrated X-ray Powder Diffraction Software; Rigaku Co.: Tokyo, Japan, 2018.
- Hull, S.; Keen, D.A. Pressure-induced phase transitions in AgCl, AgBr, and AgI. Phys. Rev. B 1999, 59, 750–761. [Google Scholar] [CrossRef]
- Quaranta, N.E.; Bazan, J.C. Thermodynamic data for solid AgI and its phase transitions from ENF measurements. Solid State Ionics 1983, 11, 71–75. [Google Scholar] [CrossRef]
Figure 1.
XRD patterns of the unheated x Ag2CO3–(1 − x) AgI samples after mixing—the peaks indicated using ▼ correspond to β-AgI (ICDD # 9–374); the line diagrams at the bottom indicate the peak positions of γ-AgI (orange) and Ag2CO3 (blue).
Figure 1.
XRD patterns of the unheated x Ag2CO3–(1 − x) AgI samples after mixing—the peaks indicated using ▼ correspond to β-AgI (ICDD # 9–374); the line diagrams at the bottom indicate the peak positions of γ-AgI (orange) and Ag2CO3 (blue).

Figure 2.
XRD patterns of x Ag2CO3–(1 − x) AgI at x = 0%–5%—the peaks indicated using ▼ correspond to β-AgI (ICDD # 9–374); the unmarked peaks are γ-AgI (ICDD # 9–399). The patterns were measured on the ground samples after uniaxial pressing to reduce the fraction of the β phase using pressure-induced phase transition.

Figure 3.
Change in lattice parameters refined using the Rietveld method against x in x Ag2CO3–(1–x) AgI.
Figure 3.
Change in lattice parameters refined using the Rietveld method against x in x Ag2CO3–(1–x) AgI.

Figure 4.
Electrical conductivity of x Ag2CO3–(1 − x) AgI at room temperature (a) and XRD pattern of the x = 7% sample pretreated with uniaxial pressing, showing the occurrence of small peaks of Ag17(CO3)3I11 (b).
Figure 4.
Electrical conductivity of x Ag2CO3–(1 − x) AgI at room temperature (a) and XRD pattern of the x = 7% sample pretreated with uniaxial pressing, showing the occurrence of small peaks of Ag17(CO3)3I11 (b).

Figure 5.
Differential thermal analysis curves of xAg2CO3–(1 − x) AgI. The samples were not subjected to uniaxial pressing treatment.
Figure 5.
Differential thermal analysis curves of xAg2CO3–(1 − x) AgI. The samples were not subjected to uniaxial pressing treatment.

Publisher’s Note: MDPI stays neutral with regard to jurisdictional claims in published maps and institutional affiliations. |
© 2021 by the authors. Licensee MDPI, Basel, Switzerland. This article is an open access article distributed under the terms and conditions of the Creative Commons Attribution (CC BY) license (https://creativecommons.org/licenses/by/4.0/).
Share and Cite
MDPI and ACS Style
Uchida, K.; Matsushima, Y. Investigation of AgI-Based Solid Solutions with Ag2CO3. Technologies 2021, 9, 54. https://0-doi-org.brum.beds.ac.uk/10.3390/technologies9030054
AMA Style
Uchida K, Matsushima Y. Investigation of AgI-Based Solid Solutions with Ag2CO3. Technologies. 2021; 9(3):54. https://0-doi-org.brum.beds.ac.uk/10.3390/technologies9030054
Chicago/Turabian StyleUchida, Kento, and Yuta Matsushima. 2021. "Investigation of AgI-Based Solid Solutions with Ag2CO3" Technologies 9, no. 3: 54. https://0-doi-org.brum.beds.ac.uk/10.3390/technologies9030054
Note that from the first issue of 2016, this journal uses article numbers instead of page numbers. See further details here.