Article

Service Area Network Analysis for Location Planning of Microbusiness and Local Franchise in Urban Area: A Case Study in Malang City, East Java Provence, Indonesia

by
Satti Wagistina
*,
Dyah Rina Syafitri
,
Julaika Sri Lestari
,
Khoirunnisa Hafidha Amanatinismi
,
Dicky Setiawan
and
Santica Ramadhani
Geografi Department, Social Science Faculty, Universitas Negeri Malang, Malang 65145, Indonesia
*
Author to whom correspondence should be addressed.
Submission received: 2 March 2022 / Revised: 11 April 2022 / Accepted: 26 April 2022 / Published: 28 April 2022

Abstract

:
Malang city is supported by the informal sector, represented by 50.41% informal employees; 17.80% are street food vendors located by collector, neighborhood, local, and alongside footpaths. Those highly potential business opportunities are equipped by high-rate competitors that would be a failure factor. One of the most contributive factors of 50–60% of business failures is rough location planning without an effective solution. The purpose of this research is to analyze strategic selling locations for microbusiness and local franchises in Malang City. A quantitative approach was used to analyze numeric calculation while a geography information system (GIS) was used as the analysis method. Additionally, service area network analysis (SANA) as a GIS tool was used for counting the threshold of spatial factor. Both SANA and GIS integrate with mobile applications, which are called by LOLAKU (location = LO, or location to accelerate salability = LAKU). After analyzing the strategic location factor, these application are tested toward microbusinesses and local franchises around the study area. Respondents are involved in testing sessions after interview for microbusiness and local franchise criteria. The research showed that strategic locations for microbussiness and franchise local listed up to three rental points, there are: point 6 (112°36′44,571″ E–7°57′25,556″ S), point 9 (112°36′37,116″ E–7°57′28,496″ S), and point 21 (112°36′49,114″ E–7°57′48,281″ S). After comparing with respondents’ business criteria, point 6 is the most suitable one, which is located on alongside local roads, and traffic counted 37.8 unit/min on weekdays and 32.0 unit/min on weekends. LOLAKU received good responses from 36 respondents who took part in the criteria business determining and trial test sessions. We hope this application development will support and provide factual benefits for microbusinesses and local franchise actors in the future.

1. Introduction

Malang City’s economic structure is supported by the informal sector. This condition is represented by informal sector employees, which reached 50.41% in 2020 (BPS 2021), 17.80% of this number are microbusiness entrepreneurs. These microbusiness entrepreneurs are dominantly called street food vendors, which are usually located by the collector, neighborhood, local, and alongside footpaths. This alongside street location is chosen by street food vendors to provide many road users as potential customers. These road users consist of motorcycles riders, car drivers, and pedestrians. Motorcycle riders and pedestrians are the primary customers for street food vendors’ kind of business.
Street food vendors generally enchase kinds of light food and beverages, which are varied and usually have unlimited potential for innovation. New innovation for light food and beverages has becomes a trend and interests customers, especially in Malang City. Chicken-based foods (Mead 2004) and coffee–milk-based beverages (Surono et al. 2021) are the most innovated and in great demand by customers.
Street food vendors are generally a potential business opportunity, however, high-rate competitors also would be a failure factor for this kind of business. New local street food vendors—which are specified to small and medium microbusiness actors—are usually unable to compete with previously developed brands and are vulnerably distressed to maintain their business. Therefore, most business actors prefer to develop their business using a franchise system by utilizing previously known product brands such as pentol kabul, jus jumbo, teh racik, tempe mendoan, cap cin (Andriansyah et al. 2017). The franchise system has a 70–80% business proportion consisting of self-employed vendors, which represent the peoples’ economy’s concept actualization and people’s prosperity enhancement (Rachman 2019). However, this system does not completely detach business failure potentials.
Failure potential annually reaching 50–60% continue to be the main problem and an effective solution has not been found yet (Firdaniaty 2011). Local franchises mostly neglect mature business planning strategies, which indicates less interest due to effective business planning based on knowledge, research, and analytical accuracy (Firdaniaty 2011; Imanuwelita et al. 2018). Several franchise business failure factors are: communication factors, competitive factors, supporting factors, and operational guidance factors (Sanny 2016).
One of the most contributive supporting factors to local franchise business failure is rough location planning. Location is one of the determinant factors to support the success and sustainability in carrying out a business (Alma 2018). There are some criteria to consider for location planning, i.e., service coverage, visibility, and traffic situation. Furthermore, those criteria can be determined by means of geographic information system (GIS).
The purpose of this research is to analyze strategic selling location for microbusinesses and local franchises in Malang City. A quantitative approach was used to analyze numeric calculation, while geography information system (GIS) was used as the analysis method. Additionally, service area network analysis (SANA) as GIS tool is used to count the threshold of spatial factor. Both SANA and GIS integrate with mobile applications which are called LOLAKU (location = LO, or location to accelerate salability = LAKU). GIS that integrates spatial information and economic data is deemed effective to solve location planning issues (Bennett and Armstrong 2010). In short, this research is trying to: (1) analyze strategic selling locations for microbusinesses and local franchises (using SANA), (2) produce a mobile application called LOLAKU, (3) then trial it into 36 respondents which are specifically microbusiness and local franchise actors (4) to obtain their responses and feedback, both about the analysis and the application.
Meanwhile, strategic business location planning was majorly analyzed using analytic hierarchy process (AHP) (Asakereh et al. 2017; Doljak and Stanojevi 2017; Imanuwelita et al. 2018) and fuzzy model (Azizkhania et al. 2017). Strategic location can also be defined by means of proportional reduction in loss index method (Panda et al. 2018) and technique for order preference by similarity to ideal solution (TOPSIS) (Ramya and Devadas 2019). This research also used the concept of gravity location model that integrates by price and business competitor specific regions (Godinho et al. 2018). Meanwhile, SANA, as a method for strategic location determination for microbusiness and local franchise are still rarely applied. This innovation also integrates mobile applications in order to ease users into utilizing this complicated concept.
LOLAKU in this research appears as simplify a scientific method in a meek application that is easy to be operated by microbusiness actors. The LOLAKU application also determines the strategic location based on specific criteria entered by the partner as application users. Unlike the previously mentioned research, LOLAKU integrates SANA with a Java-scripted application in order to provide an easy and simple service for users. This expected service can reduce the failure potential and optimize profits for micro, small, and medium entrepreneurs in a franchise system.

2. Literature Review

Branding applied for business becomes one of several aspects that support the need for product publication and reinforce its attractiveness (Dawes and Nenycz-Thiel 2013; De Wulf et al. 2005). Branding provides a special identity or attractive originality upon buyers around the coverage service area in the broader sense (Walsh and Mitchel 2010). Furthermore, franchises have become popular branding for business planning these days. Franchising systems allow any business actor to apply specific branding to provide distinguished branding and elevate products’ selling points, with obviously relative benefits gained by the branding owners themselves (Beneke and Carter 2015; Boyle 2003; Hyman et al. 2010). In addition, franchises are a contractual interaction between franchisors and franchisees (Alon 2006) established in a modest design of branch-open systems along with certain terms and conditions and royalty.
Use of the franchise system has become a key for business in some advanced countries, such as Swistzerland (54%), Germany (40%), France (32%), and other economic countries (Ngobo 2011; Retnawati et al. 2018). In fact, branding for franchises is deemed effective to elevate product attractiveness and selling points, trade loyalty, distribution path control, and customer loyalty (Ailawadi and Keller 2004; Ailawadi and Steenkamp 2008; Levy et al. 2007; Nies and Natter 2012; Pepe 2012). In other words, once franchise branding becomes massively well known, marketing targets, connection, and image of a business is elevated, too (Erdem et al. 2004; Nies and Natter 2012; Semeijn et al. 2004; Sudhir and Talukdar 2004).
The Director General of Domestic Trade of The Ministry of Trade exposes the number of foreign and local franchises, with the former possessing 124 brands and the latter 107. In 2020, franchises had succeeded in absorbing as many as 628 thousand of the workforce in Indonesia (Rabbi 2021). More than that, franchise businesses are now getting more massive by including local brands, especially at the microsociety level (UMKM), which even is seen to be a new access to actualizing the people’s economy in Indonesia (Rachman 2019). Unfortunately, competition in local franchise scope is deemed less effective to level up the intelligence level applied in some foreign franchises (Imanuwelita et al. 2018).
One of the lesser competitiveness factors is lack of intelligence in running a business. In fact, intelligence, which includes planning, management, and supervising based on science and technology, cannot optimally help support local franchises yet. This occurrence results in potential failures, which reach 60% per year (Imanuwelita et al. 2018). In addition, one of the crucial factors often neglected by local franchisers is business location, which is also closely integrated with some central aspects, such as business competitors, infrastructure, distance to suppliers, rental costs, population density, stall size, and other significant factors that are possible (Daskin 2014; Zaky 2015). Thus, one technology that can be used to help select a strategic location is service area network analysis using geographic information system (GIS).
The network analysis tool is one of the features normally used for location analysis and planning (Barthelemy 2018; Honarparvar et al. 2021), especially for provisions of fuel (Zhang et al. 2020), electricity (Dashti et al. 2021), health (Sujata and Kaushal 2021), business and road network (Ahmadzai et al. 2019; Khalil et al. 2021), and activity networks (Huang and Levinson 2015). This kind of analysis is usually used to describe cases’ movement patterns, such as hotspots, and other analytical procedures which highlight geometric cross-point connection (Anghinolfi et al. 2016; Cooper 2015). To clarify this definitions, we can take look at Figure 1 which illustrated the Network analyst (a) and Service area (b).
Due to urban study, network analyses are majorly used for establishing transportation routes (Porta et al. 2006; Rao et al. 2018; Rodrigue et al. 2006), public spot planning (Khalil et al. 2021; Sevtsuk and Mekonnen 2012), sustainable and smart development (Dempsey et al. 2010; Demsar et al. 2008), city growth and transformation monitoring (Ghanbari et al. 2017; Liu et al. 2021), determining service areas (Vragović et al. 2005; Yu 2017), identifying risks of disasters (Singh et al. 2018), and many other discussions.
Meanwhile, service area network analysis is a kind of network analysis tool in GIS that is used to analyze point networks due to their area portion based on a specific geometric rate (Bajjali 2018; Docan 2016; Toms 2015). Service area network analysis, or SANA, use unit rates based on relative thresholds (Leng et al. 2017; Ormsby et al. 2010). Depending on the threshold value used for analysis, SANA displays the spatial scope of each value entered. SANA is usually used to project the potential value of a point (usually place of service provider) or some linear line network (such as street flow) of datasets (Jiang et al. 2008; Lin and Ban 2017; Porta et al. 2006).
Furthermore, this coverage analysis becomes a reference applied in the LOLAKU application to see business competitors, traffic rate, and crowd centers’ impact due to business income. SANA is used to spatially project service areas for these three variables. Else, the LOLAKU application also determines the strategic location based on specific criteria entered by partners as application users. Unlike the previously mentioned research, LOLAKU integrates SANA with a Java-scripted application in order to provide an easy and simple service for users. LOLAKU’s users, who are microbusinesses and local franchise actors, will be helped to determine the most strategic location for their new business branch. This expected service can reduce the failure potential and optimizing profits for micro, small, and medium entrepreneurs in franchise systems.

3. Methodology

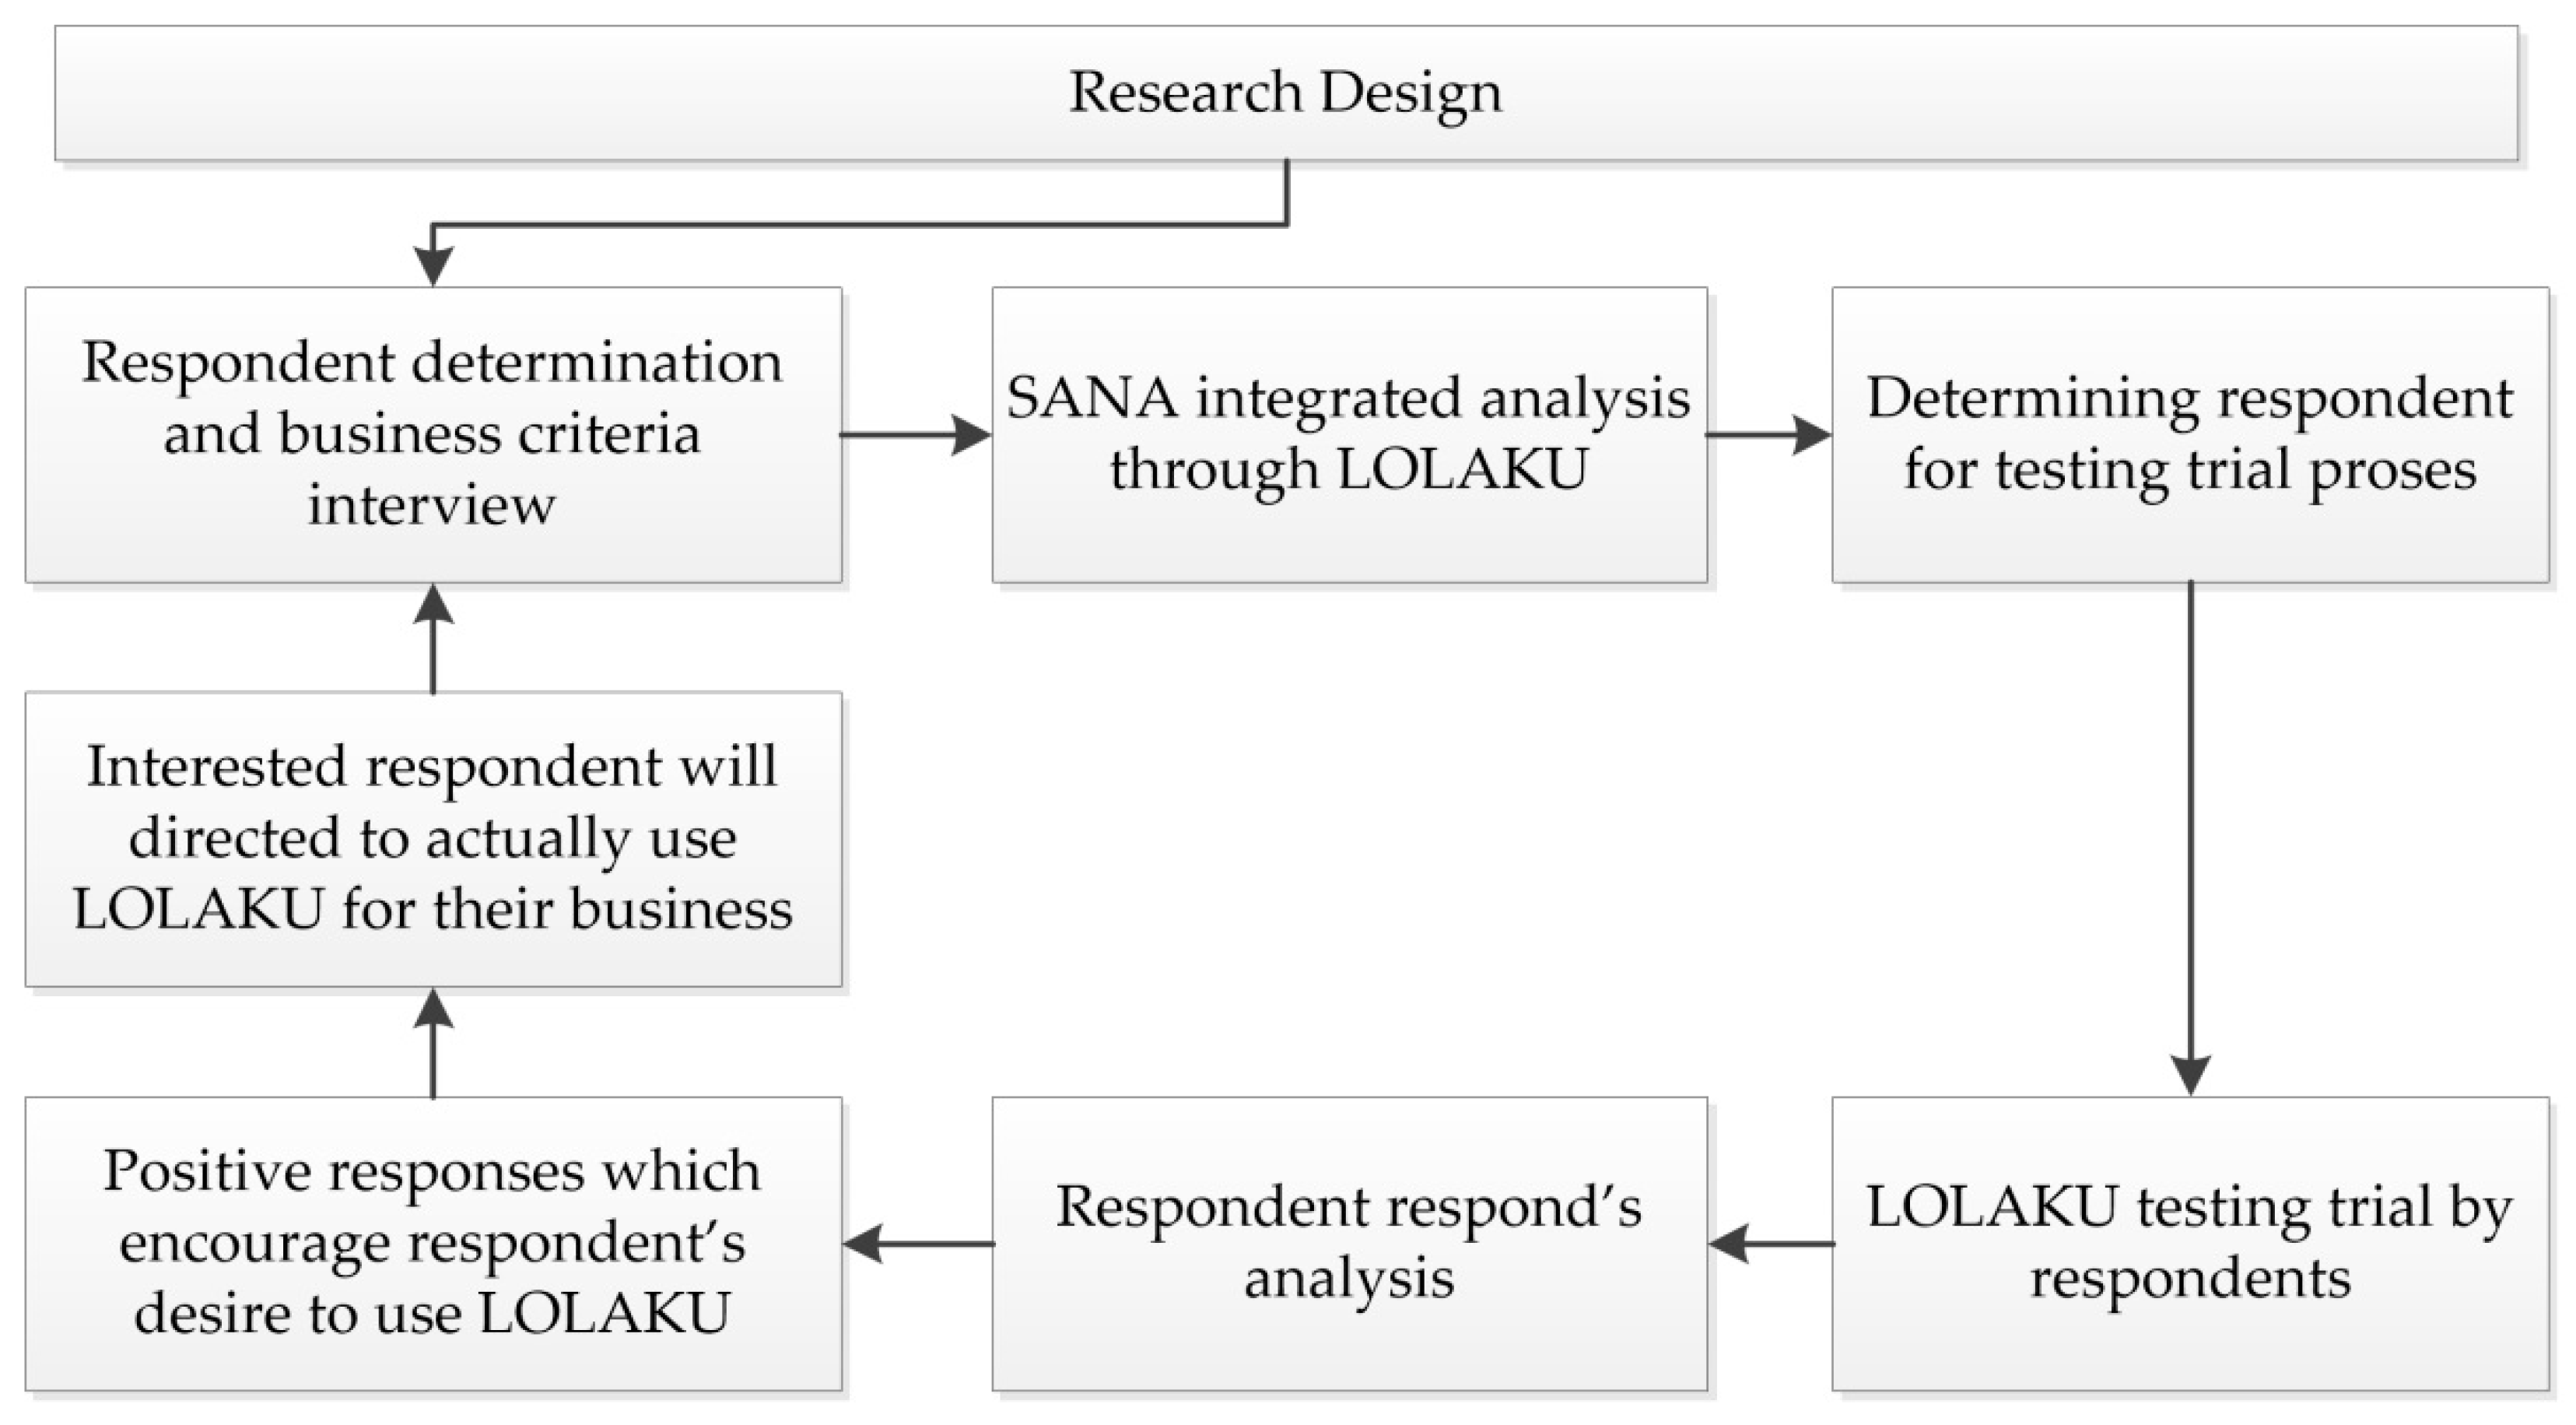
3.1. Research Design

Study area in this research was carried out in the whole Sumbersari Village, Lowokwaru Subdistrict, Malang City, East Java. This area was chosen through purposive sampling technique based on the location planning for microbusinesses and local franchise expansion. Moreover, this village is located in the middle of an urban area with a high density of population, which counted 13,342 people per square. A high density of population was indirectly proportional with potential customers who support business profit. In addition, Sumbersari Village is surrounded by potential locations for centers of crowds such as stores, campuses, and schools. Study area in this research can be observed through the following map on Figure 2.
This research includes a case study, which analyzes strategic selling locations for microbusinesses and local franchises in Sumbersari village, Lowokwaru Subdistrict, Malang City. This research held six main steps, which are: (1) Designing research. Paradigms of positivism are used in designing this research, which is represented by the existence of hypotheses, sampling techniques, and data analysis techniques. Pragmatism is also used to represent the usefulness of research products on location determination for microbusinesses and local franchises in Malang City. (2) Respondent determination and business criteria interview. Nonrandom sampling techniques are used as there is a countless microbusiness population in Malang City that spreads throughout the region. This is why sampling methods were used to limit the scope and put the research focus on microbusinesses and local franchises. (3) SANA-integrated analysis through LOLAKU. The research used ArcGIS programs based on the quantitative analysis method, while LOLAKU acts as an integrated program that was made to facilitate the users experience. (4) Determining respondents for testing trial process. This step is used to validate the LOLAKU as a research product. (5) LOLAKU testing process. This stage aims to determine the respondents’ responses, who are microbusiness actors and local franchises as the target application users. (6) Respondents’ feedback analysis. Researchers analyzed the respondents’ responses in this step. These responses are used as evaluation analysis to improve the application. So, the accuracy of coordinated sales locations is in accordance with the criteria of the business and the people’s economy in Indonesia, namely an economy that is managed independently by community groups. (7) follow-up process (to directing the interested respondent to actually using LOLAKU for their own business). After planning the general research design, respondents selected collecting business criteria (Bs as index qualification explained on Table 1). The next step is collecting respondents feedback by trial sessions. These steps more clearly shown by Figure 3, bellow:
The sample in this research is microbusinesses and local franchisors determined by quota sampling and which counted 36 respondents. The number of samples was determined based on the following argumentation: (1) the number of microbusiness actors in the study area which is approximately 90, (2) 36 out of them were in accordance with researchers’ criteria. The respondent criteria used were: (1) having a business located in Sumbersari Village, Lowokwaru District, Malang City, East Java Province, Indonesia, (2) respondents being included as local microbusiness and franchise actors, (3) their business being located alongside study area road system, and (4) respondents having a plan to expand their business. The respondents play a role in determining specific factors such as: kind of business, market segmentation, size of stall, supplier criteria, and the range of stall rent fee. This factor is entered through LOLAKU on the “Data Form” feature.
The focused hypothesis of this research is to analyze strategic selling locations using integrated SANA with LOLAKU, which is a simple mobile application. LOLAKU will take place as a schematic service that provides simple and easy technology for microbusiness and local franchise actors. By this application, microbusiness and local franchise actors can easily analyze a crucial factor for their business in order to minimize failure potential in the future. Integrated analysis through LOLAKU is conducted according to SANA-integrated analysis diagrams in Figure 4.

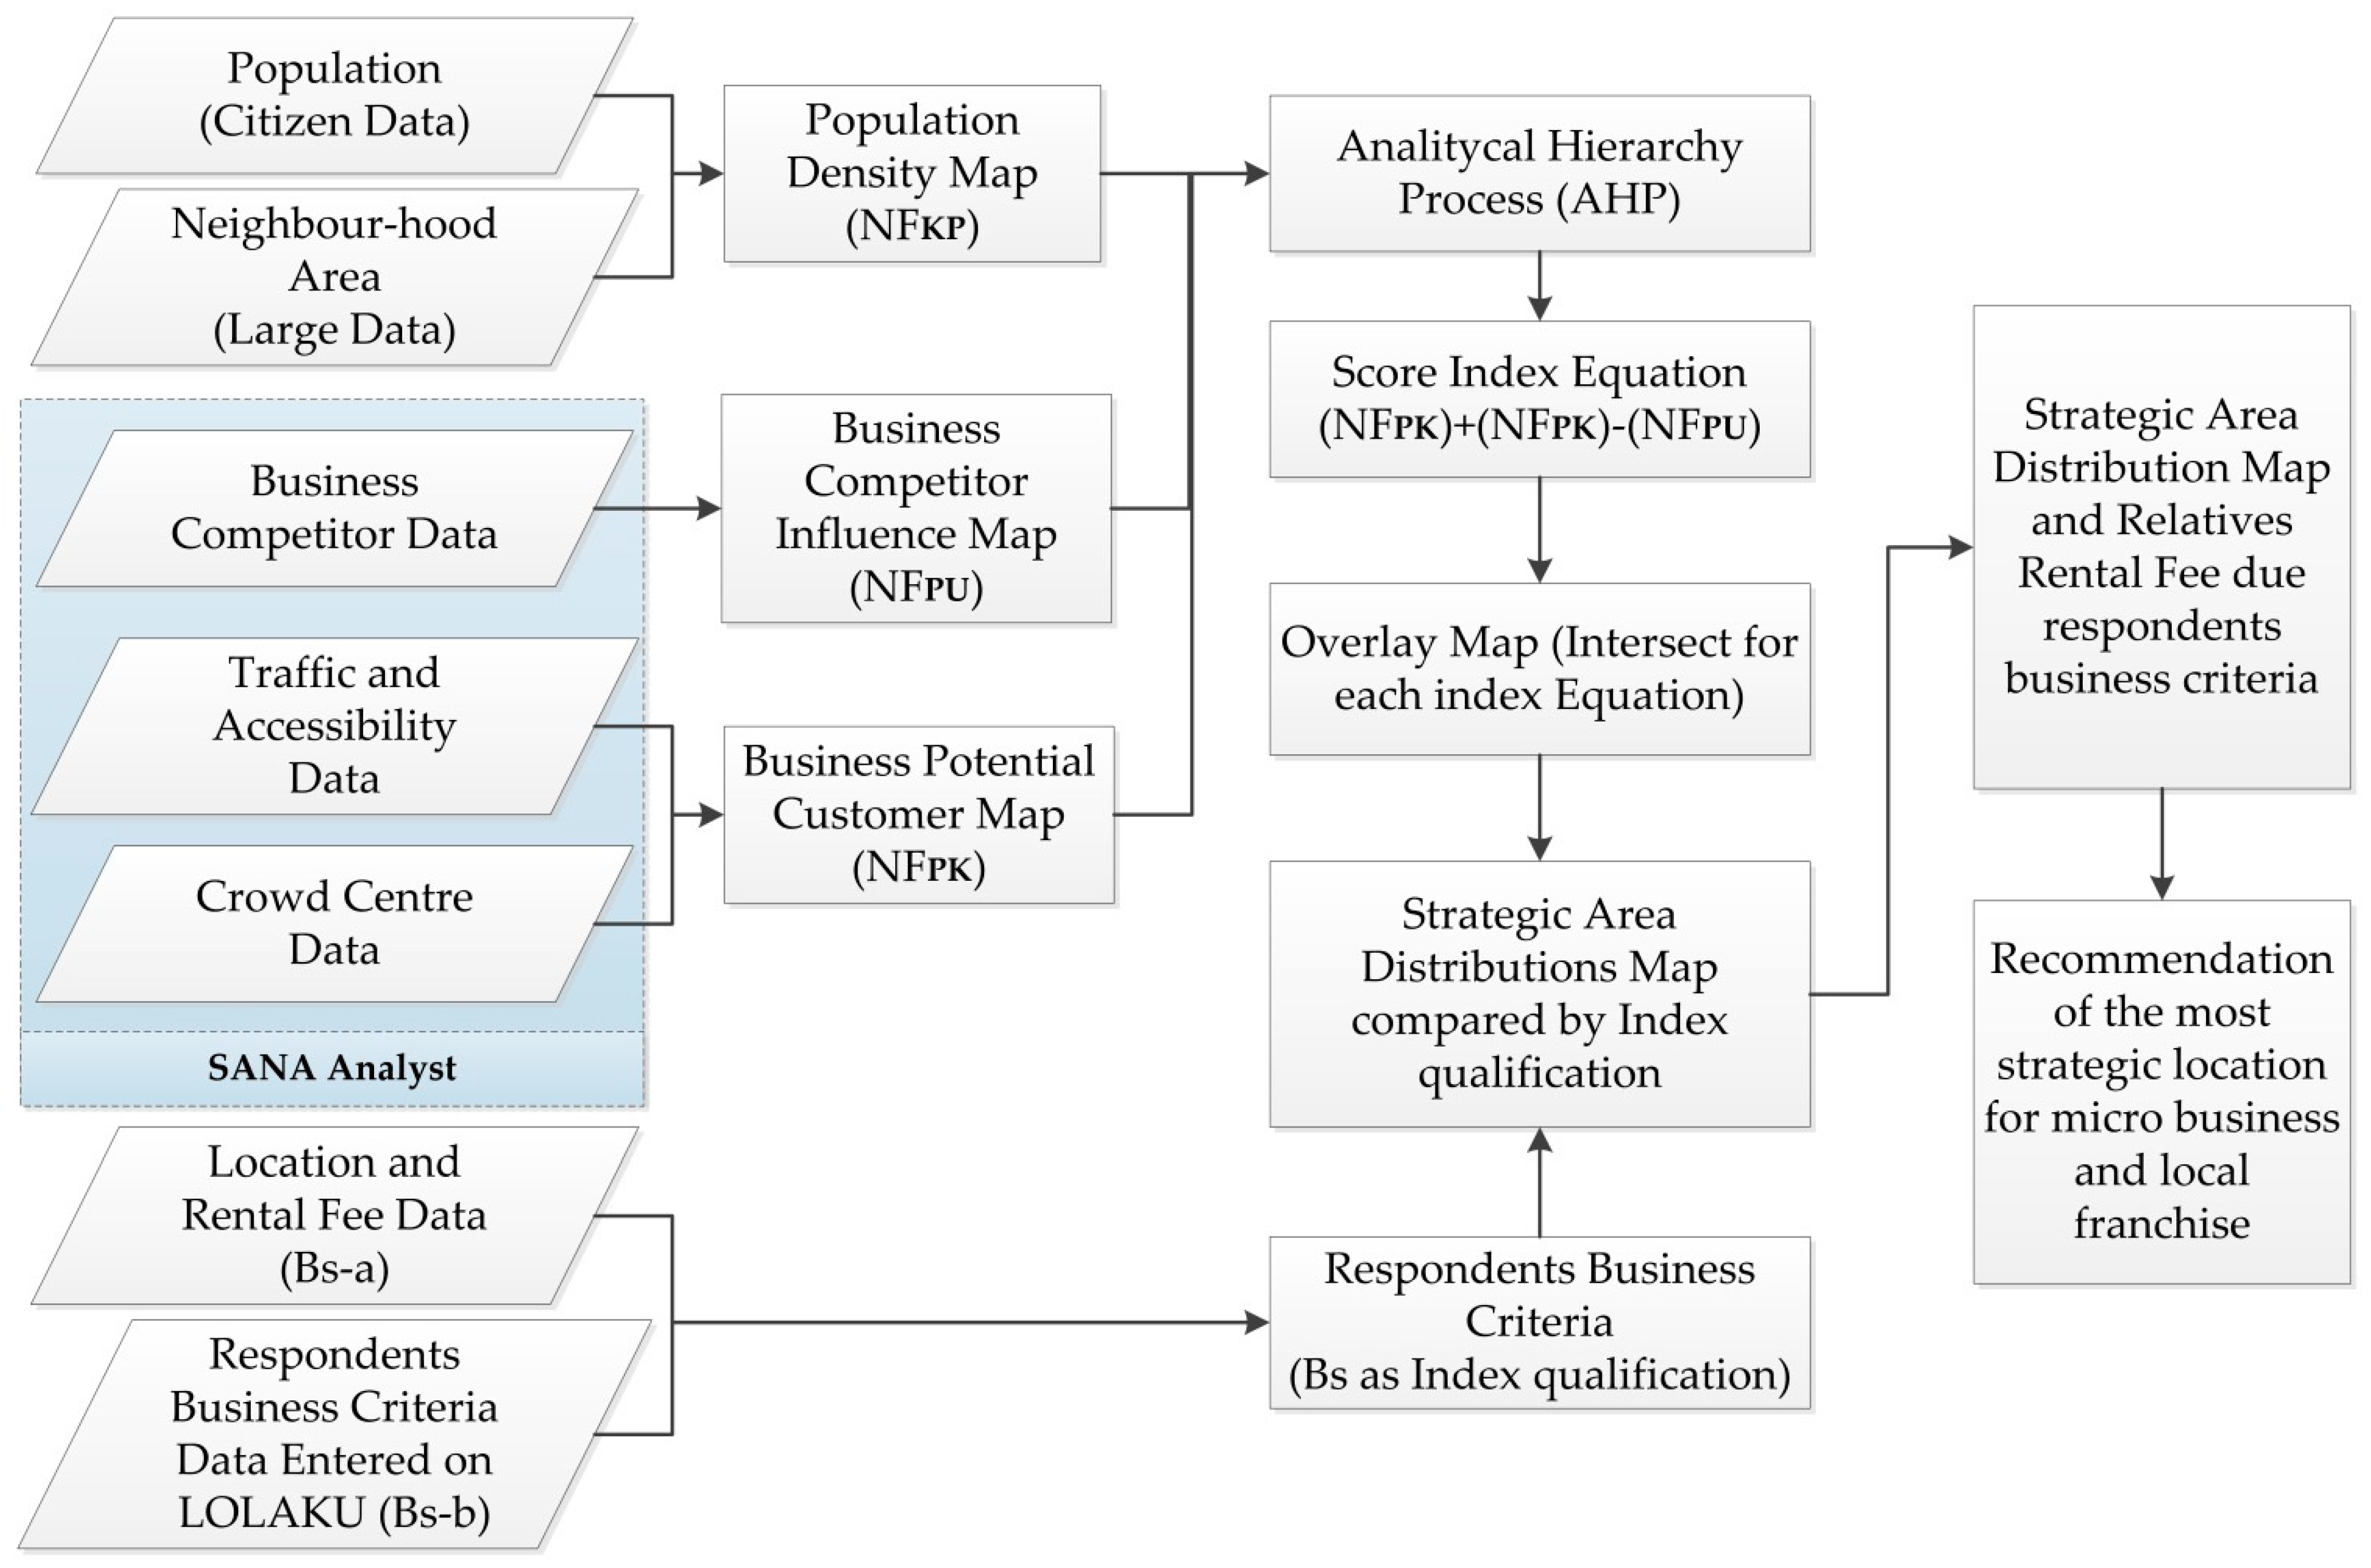
3.2. SANA-Integrated Analysis to Determine Strategic Location

This research uses the quantitative approach by analyzing numeric calculations of collected data to obtain a scientific conclusion. Maps and tables are provided to support the whole research description. Survey and interview methods are used to collect data. Identification factors, collecting, and scoring methods are described in this following Table 1:
Population density factor for each neighborhood (Kp) is displayed on the density map and classified as low and high population. Neighborhood in this research refers to the smallest region under a village, which is called Rukun Warga (RW) in Bahasa Indonesia. Kps are related to potential customers provided by each region. A higher number of densities increases potential customers for microbusinesses and local franchises (positive value). Population density is scored in the AHP system for each spatial region to obtain the score factor, which is symbolized by NFKP.
In this research, SANA applied in three factors, which are business competitor (Pu), crowd point (Tk), and traffic density based on accessibility level (TA). Pu and Tk are processed using 3 threshold classes by range (100 m, 200 m, and 300 m), then the spread of gravity value is displayed as a map for each. TA contains pedestrians and motorcycle-rider pass by minute for each classified road.
To more clearly show the SANA analysis method, we provide this following diagram on Figure 4:
After the scoring process, Pu is displayed as a business competitor influence map (NFPU), which has a negative effect on respondents’ businesses. Tk combines traffic and displays as a business potential customer map (NFPK) which has positive effects on respondents’ businesses. These three SANA mapping result factors, population density map ( N F K p ) , crowd center ( N F P k ) , and business potential customer map ( N F P u ) , were intersect analyzed using this following Formula (1):
I n d e x   S c o r e = N F K p + N F P k N F P u
This equation is formed depending on the relative effect on customer potential for respondents’ businesses. The population and crowd center have a positive effect due to espousing the number of potential customers, while business competitor was the minus point and may reduce the number of customers. This equation conducts an index score that indicates the distribution of strategic location. The categories for prospective location were divided into four classes, displayed by the following Table 2:
On the other side, location and rental-fee data (Bs-a) contain rent fees and stall proportion data for businesses located around Sumbersari Vilage, Lowokwaru Subdistrict. Bs-b are entered data by respondents through LOLAKU, involving: (1) business brand; (2) stalls’ size; (3) business type; (4) supplier criteria; (5) marketing segmentation; and (6) estimated rental cost expected. For scoring processes, the Bs-a and Bs-b factors are compared and rearranged to create index qualification (Bs). Bs is used in AHP scoring for rental fees and stall-area-determining processes as index qualification. Index scores are then compared with index qualification to choose the most suitable location for respondents. LOLAKU was designed using the Indonesian language to give ease for microbusiness and local franchise actors to understand the content and information included in the application.

3.3. LOLAKU Trial by Respondents

This step was conducted to collecting public responses about LOLAKU. The testing trial involved 36 respondents and was conducted by these following steps: (1) researcher introduced LOLAKU to 36 respondents, (2) respondents were asked to download and install the application through their own mobile device, (3) respondents entered their business criteria through “Data Form” features, (4) researchers analyzed the strategic location under criteria entered in step three, (5) analysis results are sent via LOLAKU using “lihat komentar” features, (6) this result contains the description of the strategic location distribution map, (7) researchers asked for all respondents’ feed-back about LOLAKU.
The trial section was conducted to collect responses and feedback from microbusiness and local franchise actors as respondents. We visited 36 respondents to introduce, test, and collect their responses about LOLAKU. The evaluated variables are: (1) ease of use (install and operate), (2) ease of determining strategic selling location, (3) usefulness of analysis. These responses were collected via interview for each respondent.

4. Results

4.1. SANA and Analisys Factor

We analyzed each factor to determine the strategic location for microbusinesses and local franchises located in Sumbersari Vilage. The analysis factors contained: business competitor (Pu), crowd point (Tk), traffic density based on accessibility level (TA), population density for each neighborhood (Kp), location and rental-fee data (Bs-a), and respondents’ business criteria data entered through LOLAKU (Bs-b). Each factor is describe in the following subsections.

4.1.1. Respondents Criteria of Business (Bs-b)

Interview processes by respondents are obtained to collect their common criteria for their new branch. These criteria are entered via LOLAKU and recorded on the “Data Form” feature. The respondents’ business criteria collected are listed in the following Table 3:

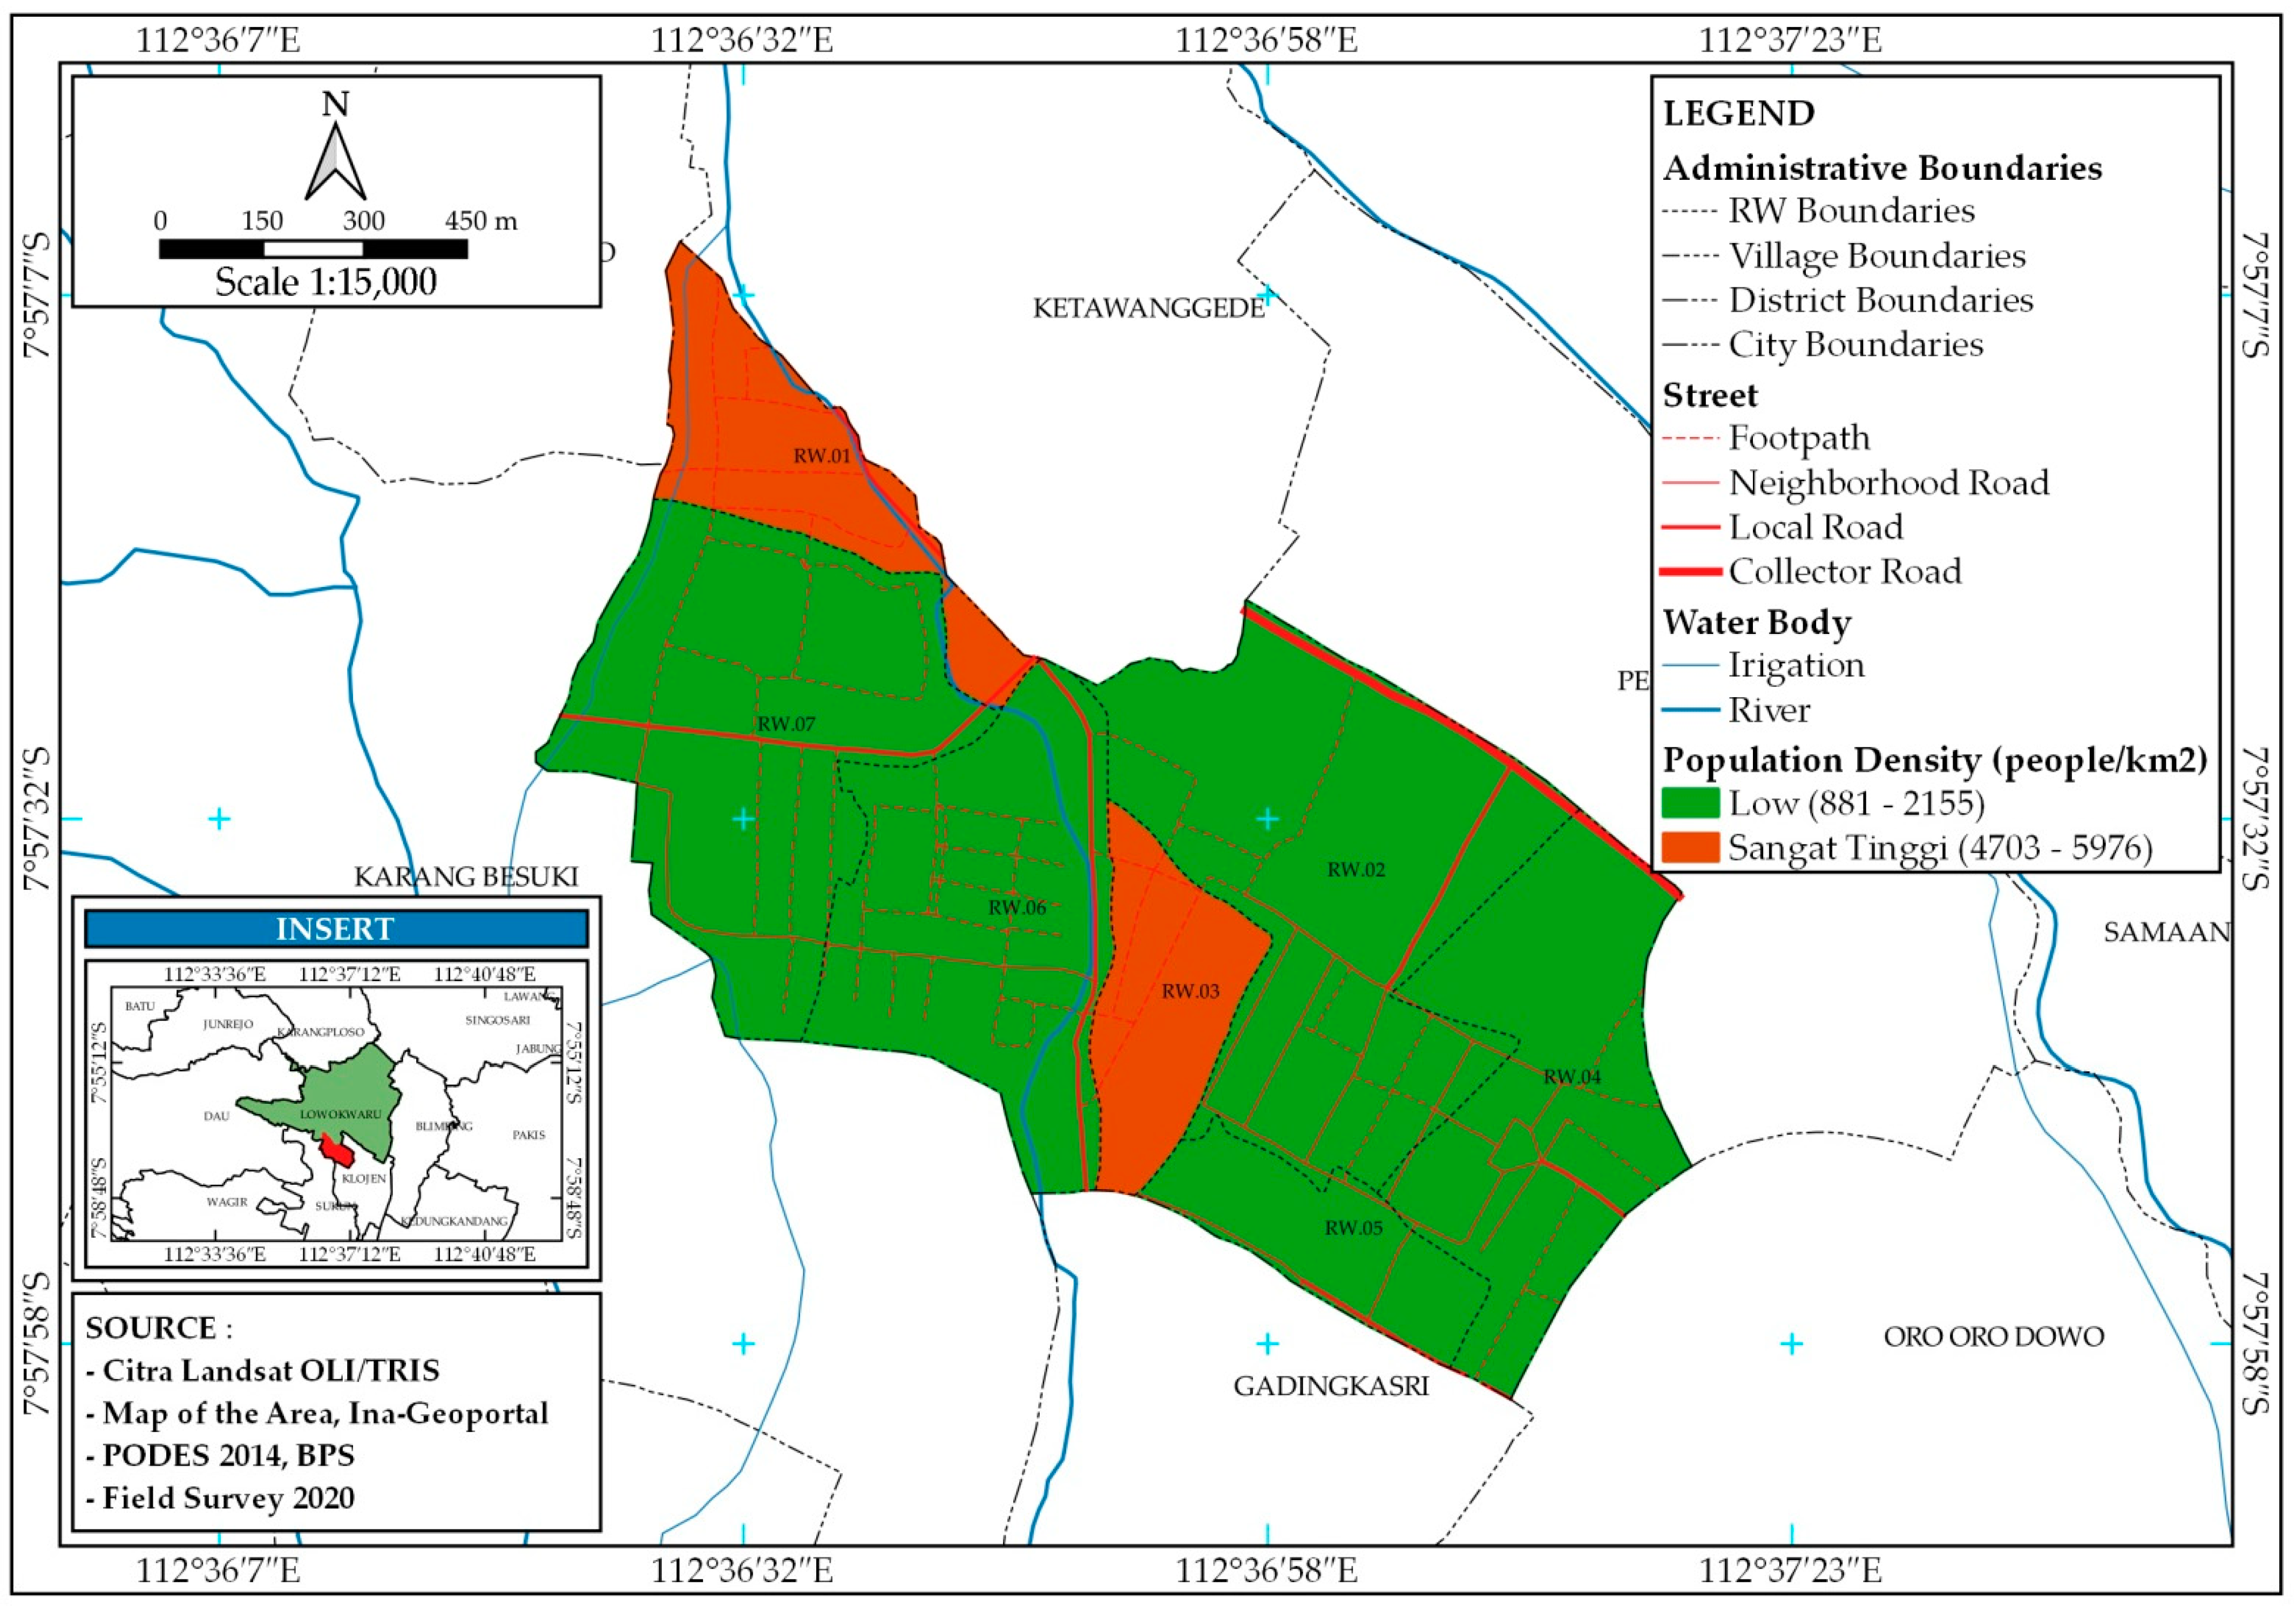
4.1.2. Population Density Map (NFKP)

Population data provide total population and area. Calculated score of population density by each classified level, which is: low and very high density. The population data are provided in the following Table 4:
As a major city in East Java, Malang City has a high population density, while Sumbersari Village in Lowokwaru Subdistrict is classified as a densely populated area by the students and migrant workers. The density distribution values are mapped and displayed for each neighborhood in the following map on Figure 5:

4.1.3. Business Competitor Influence Map (NFPU)

Based on the survey, we marked 93 business competitors with similar typical businesses as the respondents. These 93 business competitor are microbusinesses and local franchises around Sumbersari Vilage, placed almost all along the roads (collector, neighborhood, local, and footpath) with intense competitions. These microbusinesses and local franchises are dominated by culinary sectors, especially fast foods and beverages. SANA, as a network analysis tool, is relevant to determine strategic locations with the lowest amount of competitors for businesses in this alongside-roads area. The business competitors’ influence is analyzed using SANA and the result is shown by the following map on Figure 6.
Map on Figure 6 shows a green area as low amount of business competitors, light green for moderate, orange for high, and dark red to indicate the highest amount business competitors. The map shows a centered pattern of the competitors around the local alongside-road area. This shows that local roads are frequently selected by microbusinesses and local franchises.

4.1.4. Crowd Centre Data (Tk)

Crowd center data analyzed using SANA and displaying crowd centre influence in the study area. There are 17 centers of crowds plotted around Sumbersari Vilage, Lowokwaru Subdistrict. Crowd centers involve: two campuses (Universitas Negeri Malang and Brawijaya University), schools, a shopping complex, civic office, and open public spots. Crows center are shown by Figure 7 which is showing the business potential customer map (NFPK) indicates crowded center distribution through four different road classes.
This map on Figure 7 displays a dark green area as low effect of crowd center, while light green indicates moderate, orange indicates high, and dark red indicates a very high level of crowd. These distributions are centered on each crowd center and variously spread based on four road classifications.

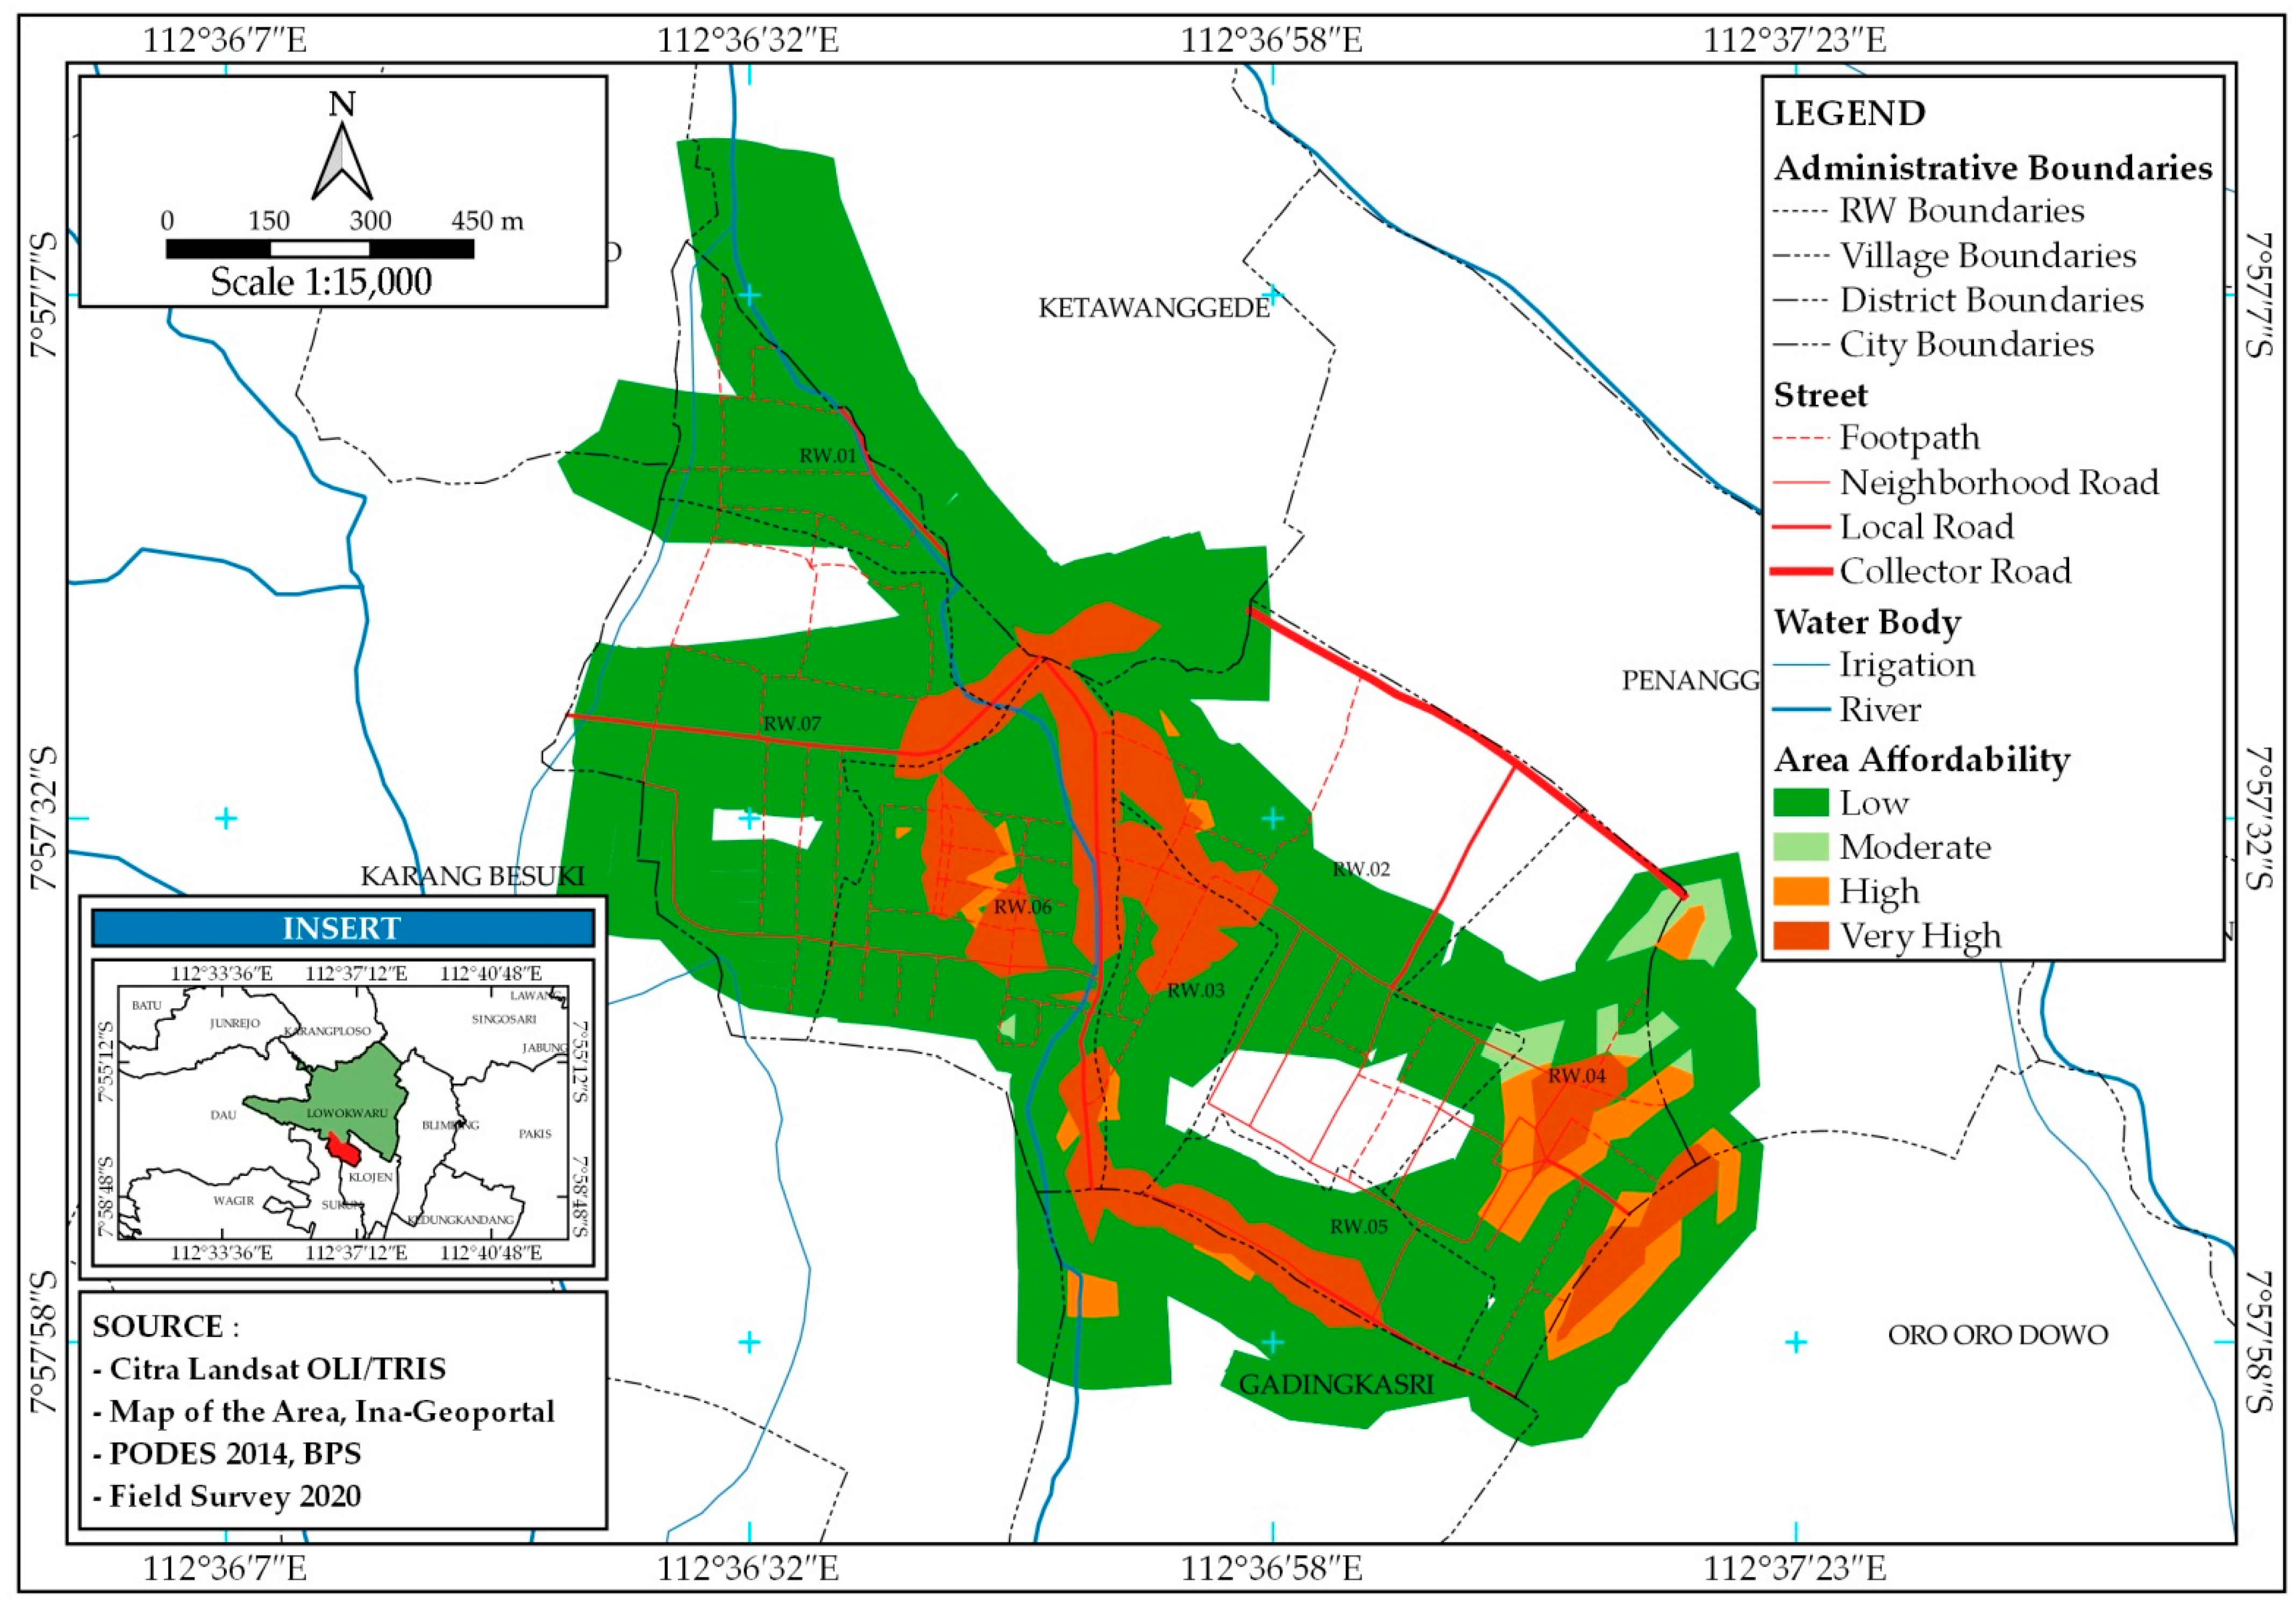
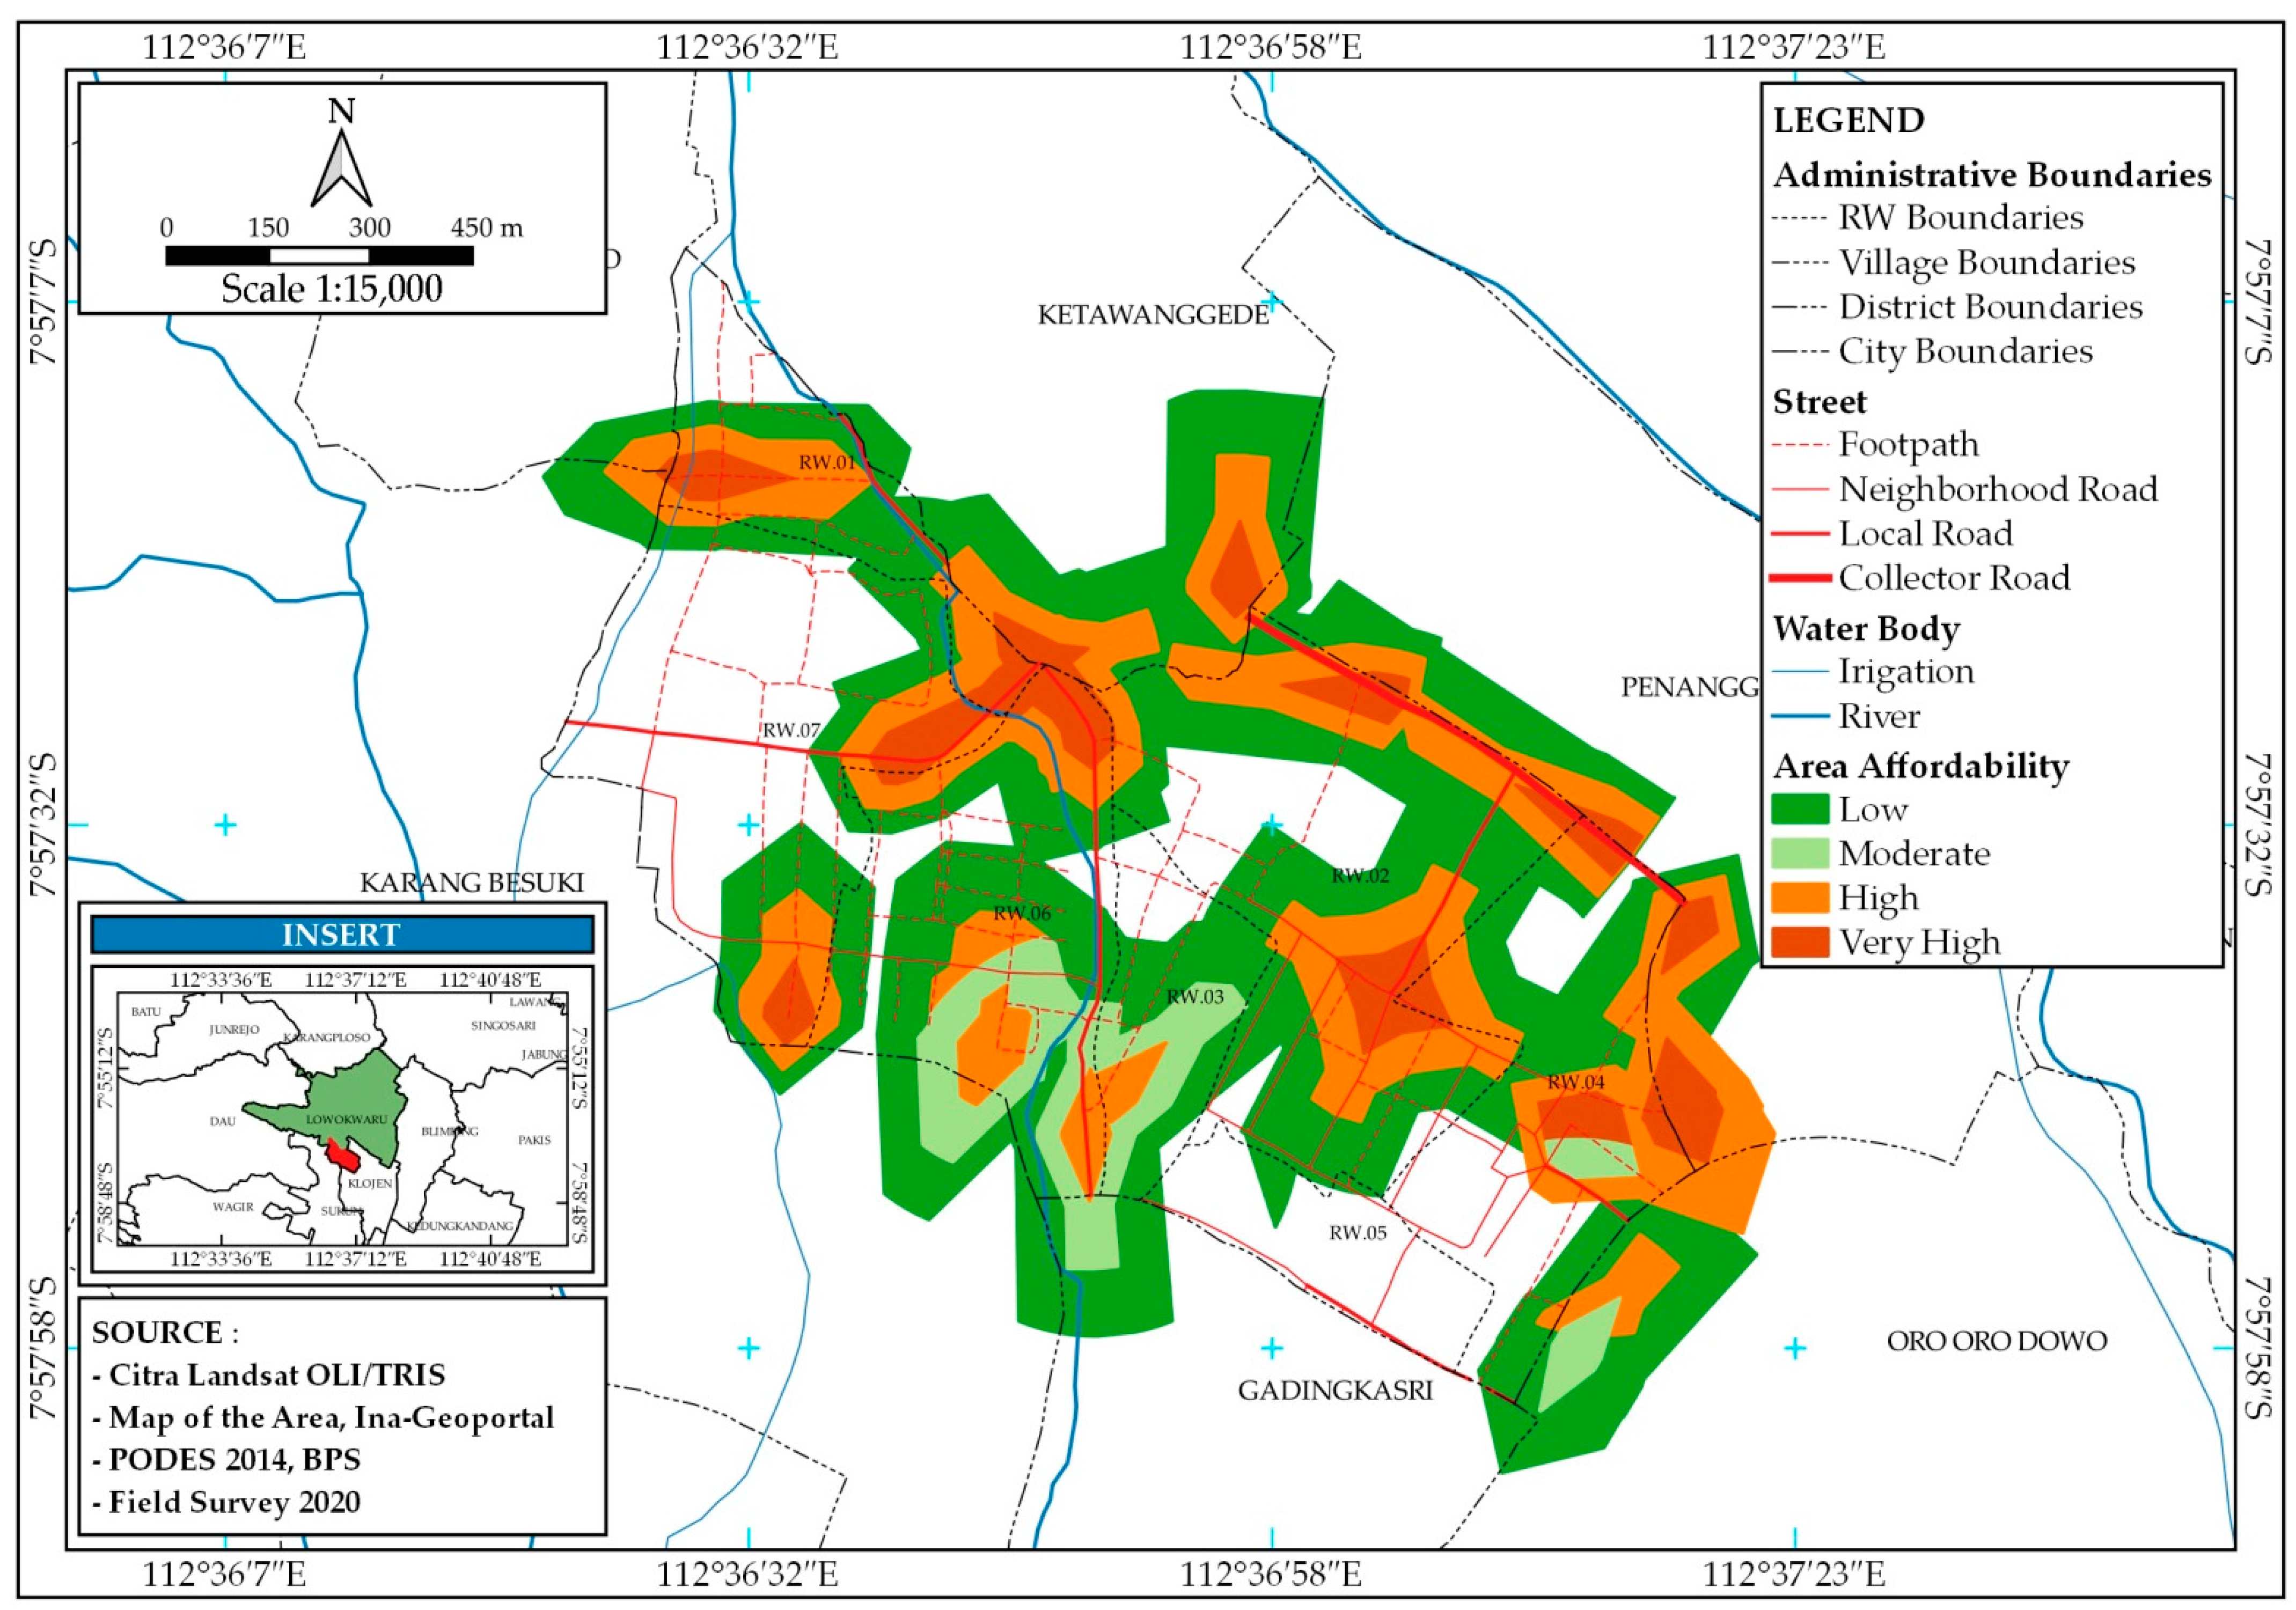
4.1.5. Traffic Situation and Accessibility (TA)

Traffic situation for each road class was determined as four sessions for daily record and grouped as two classes for weekly data. Four sessions used in the survey process are morning, noon, afternoon, and evening. Weekly data are defined as weekend and weekday. These survey results are summarized in the following Table 5:
Daily traffic density are classified as weekend and weekday are summarized in the following Table 6:
The highest traffic density is shown by collector road, which is the main road of this village. This road is dominated by motorcycle riders and car drivers. Additionally, local roads have the second place after collector roads, which are dominated by pedestrians and motorcycle riders. Neighborhood and footpath classes are less traffic dense, only having some pedestrians. This research chooses local roads as the most suitable for microbusinesses and local franchises, which is shown by business competitors dominantly taking place. Moreover, local roads are dominated by pedestrians and motorcycle riders, which are their potential customer segmentation markets.

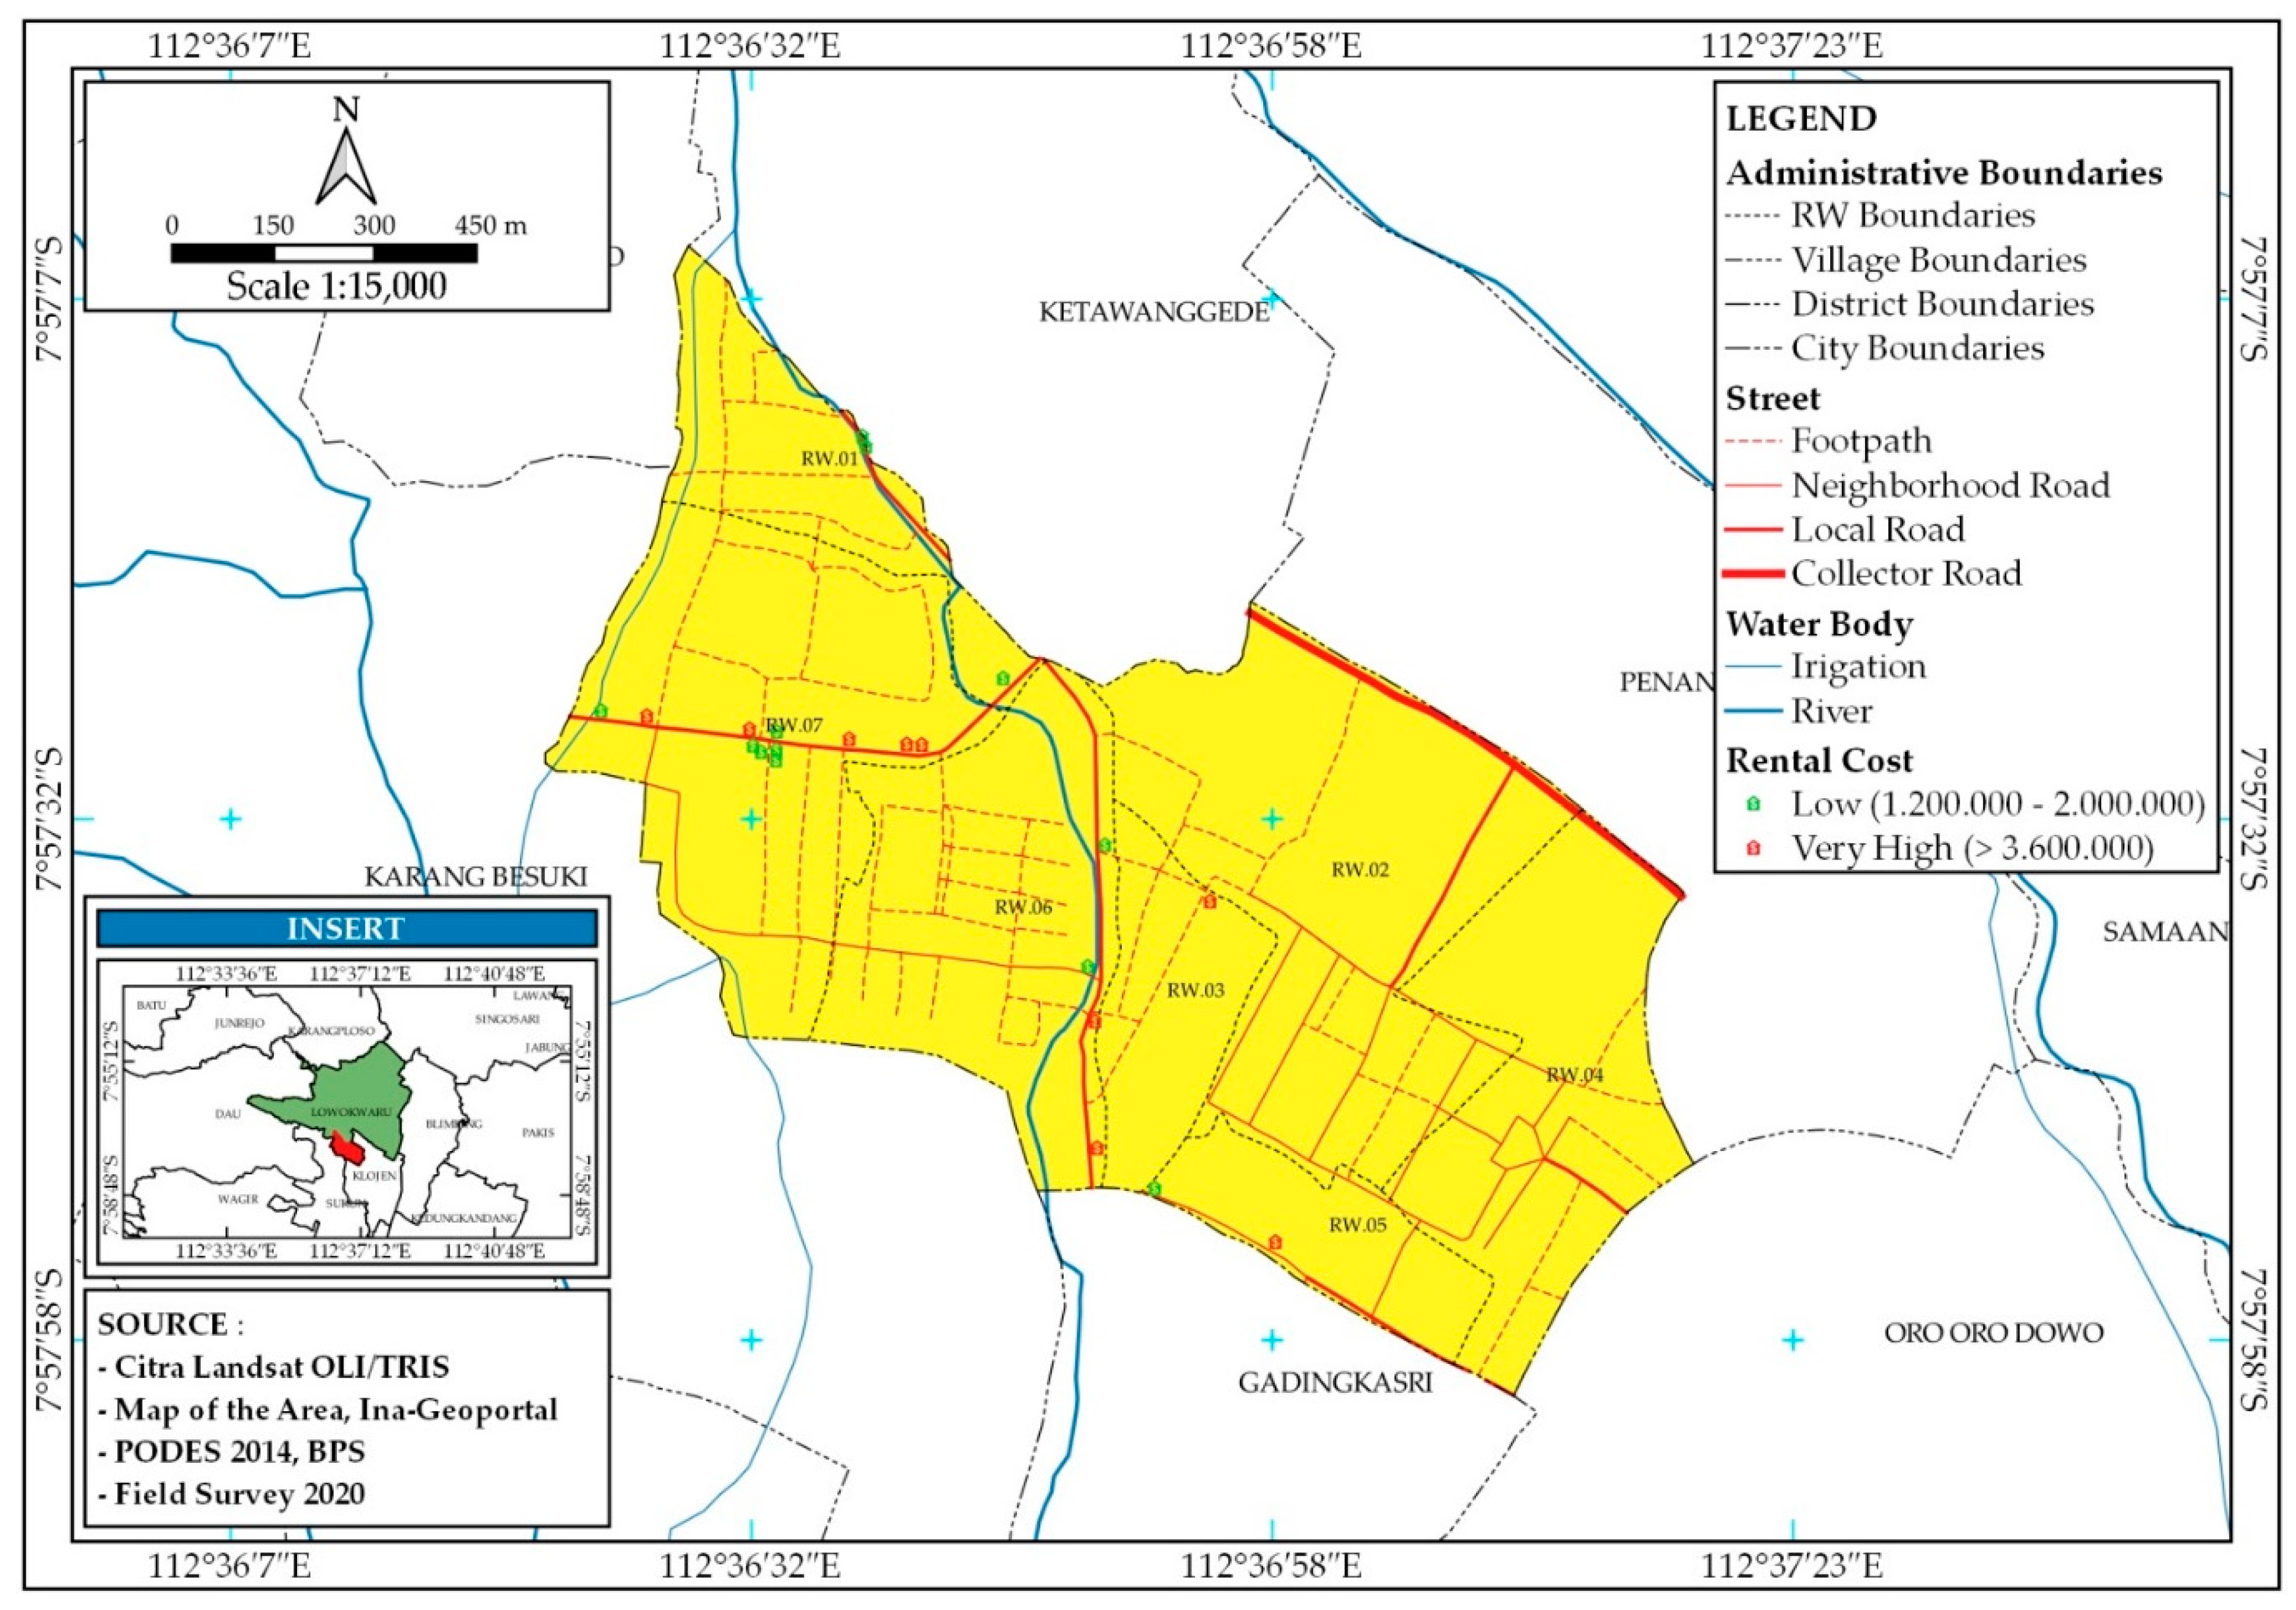
4.1.6. Rental Costs and Size of Stall Area (Bs-a)

Most microbusinesseses and local franchisees do not have a permanent place in their business activities. This is one of the characteristics of the people’s economy in Indonesia. They are part of the underground economy, or more precisely, the shadow economy, so their productivity is not included in the Gross Domestic Products calculation, especially in Malang City, the research location. Therefore, the aspect of rental costs and stall area is very important to include as a determining factor in SANA. The stall area is not as wide as a shop because the sales location is not on the side of a main nonarterial road. This factor depends on respondents’ needs, named the Bs-b factor. The respondents’ entered their range of rental costs as IDR 7,200,000–12,000,000 per year, and the stall area needed should be 6 m2. Monthly rent fees for microbusinesses and local franchise locations are supposed to range from IDR 1,200,000 to 2,000,000. The following Table 7 shows the scoring for rental costs and stall size expected by respondents:
To show rental location, we displayed a distribution map with a rental fee category. The green point is low rental cost location and the red ones are very high rental fees. This location is also dominantly centered on local roads in this study area. The stall points are contained by 21 rentals with various fees and proportions. These rental points are coordinately mentioned in Table 8. The distribution map is shown by the following Figure 8:

5. Discussion

5.1. LOLAKU Intrface and Features

LOLAKU is an Android-based application established using the Java Script platform by the app-studio application. This application can be operated on Android, which is quite massively used in Indonesia. The LOLAKU interface is designed to be simply understood by microbusiness and local franchise actors. The LOLAKU prototype used in trial sessions is displayed in the following series of figures:
LOLAKU can be used by whomever has the download link to the application trial. The Prototype application was distributed in trial sessions to all the respondents involved. In addition, LOLAKU operating tutorials are listed in the following description:
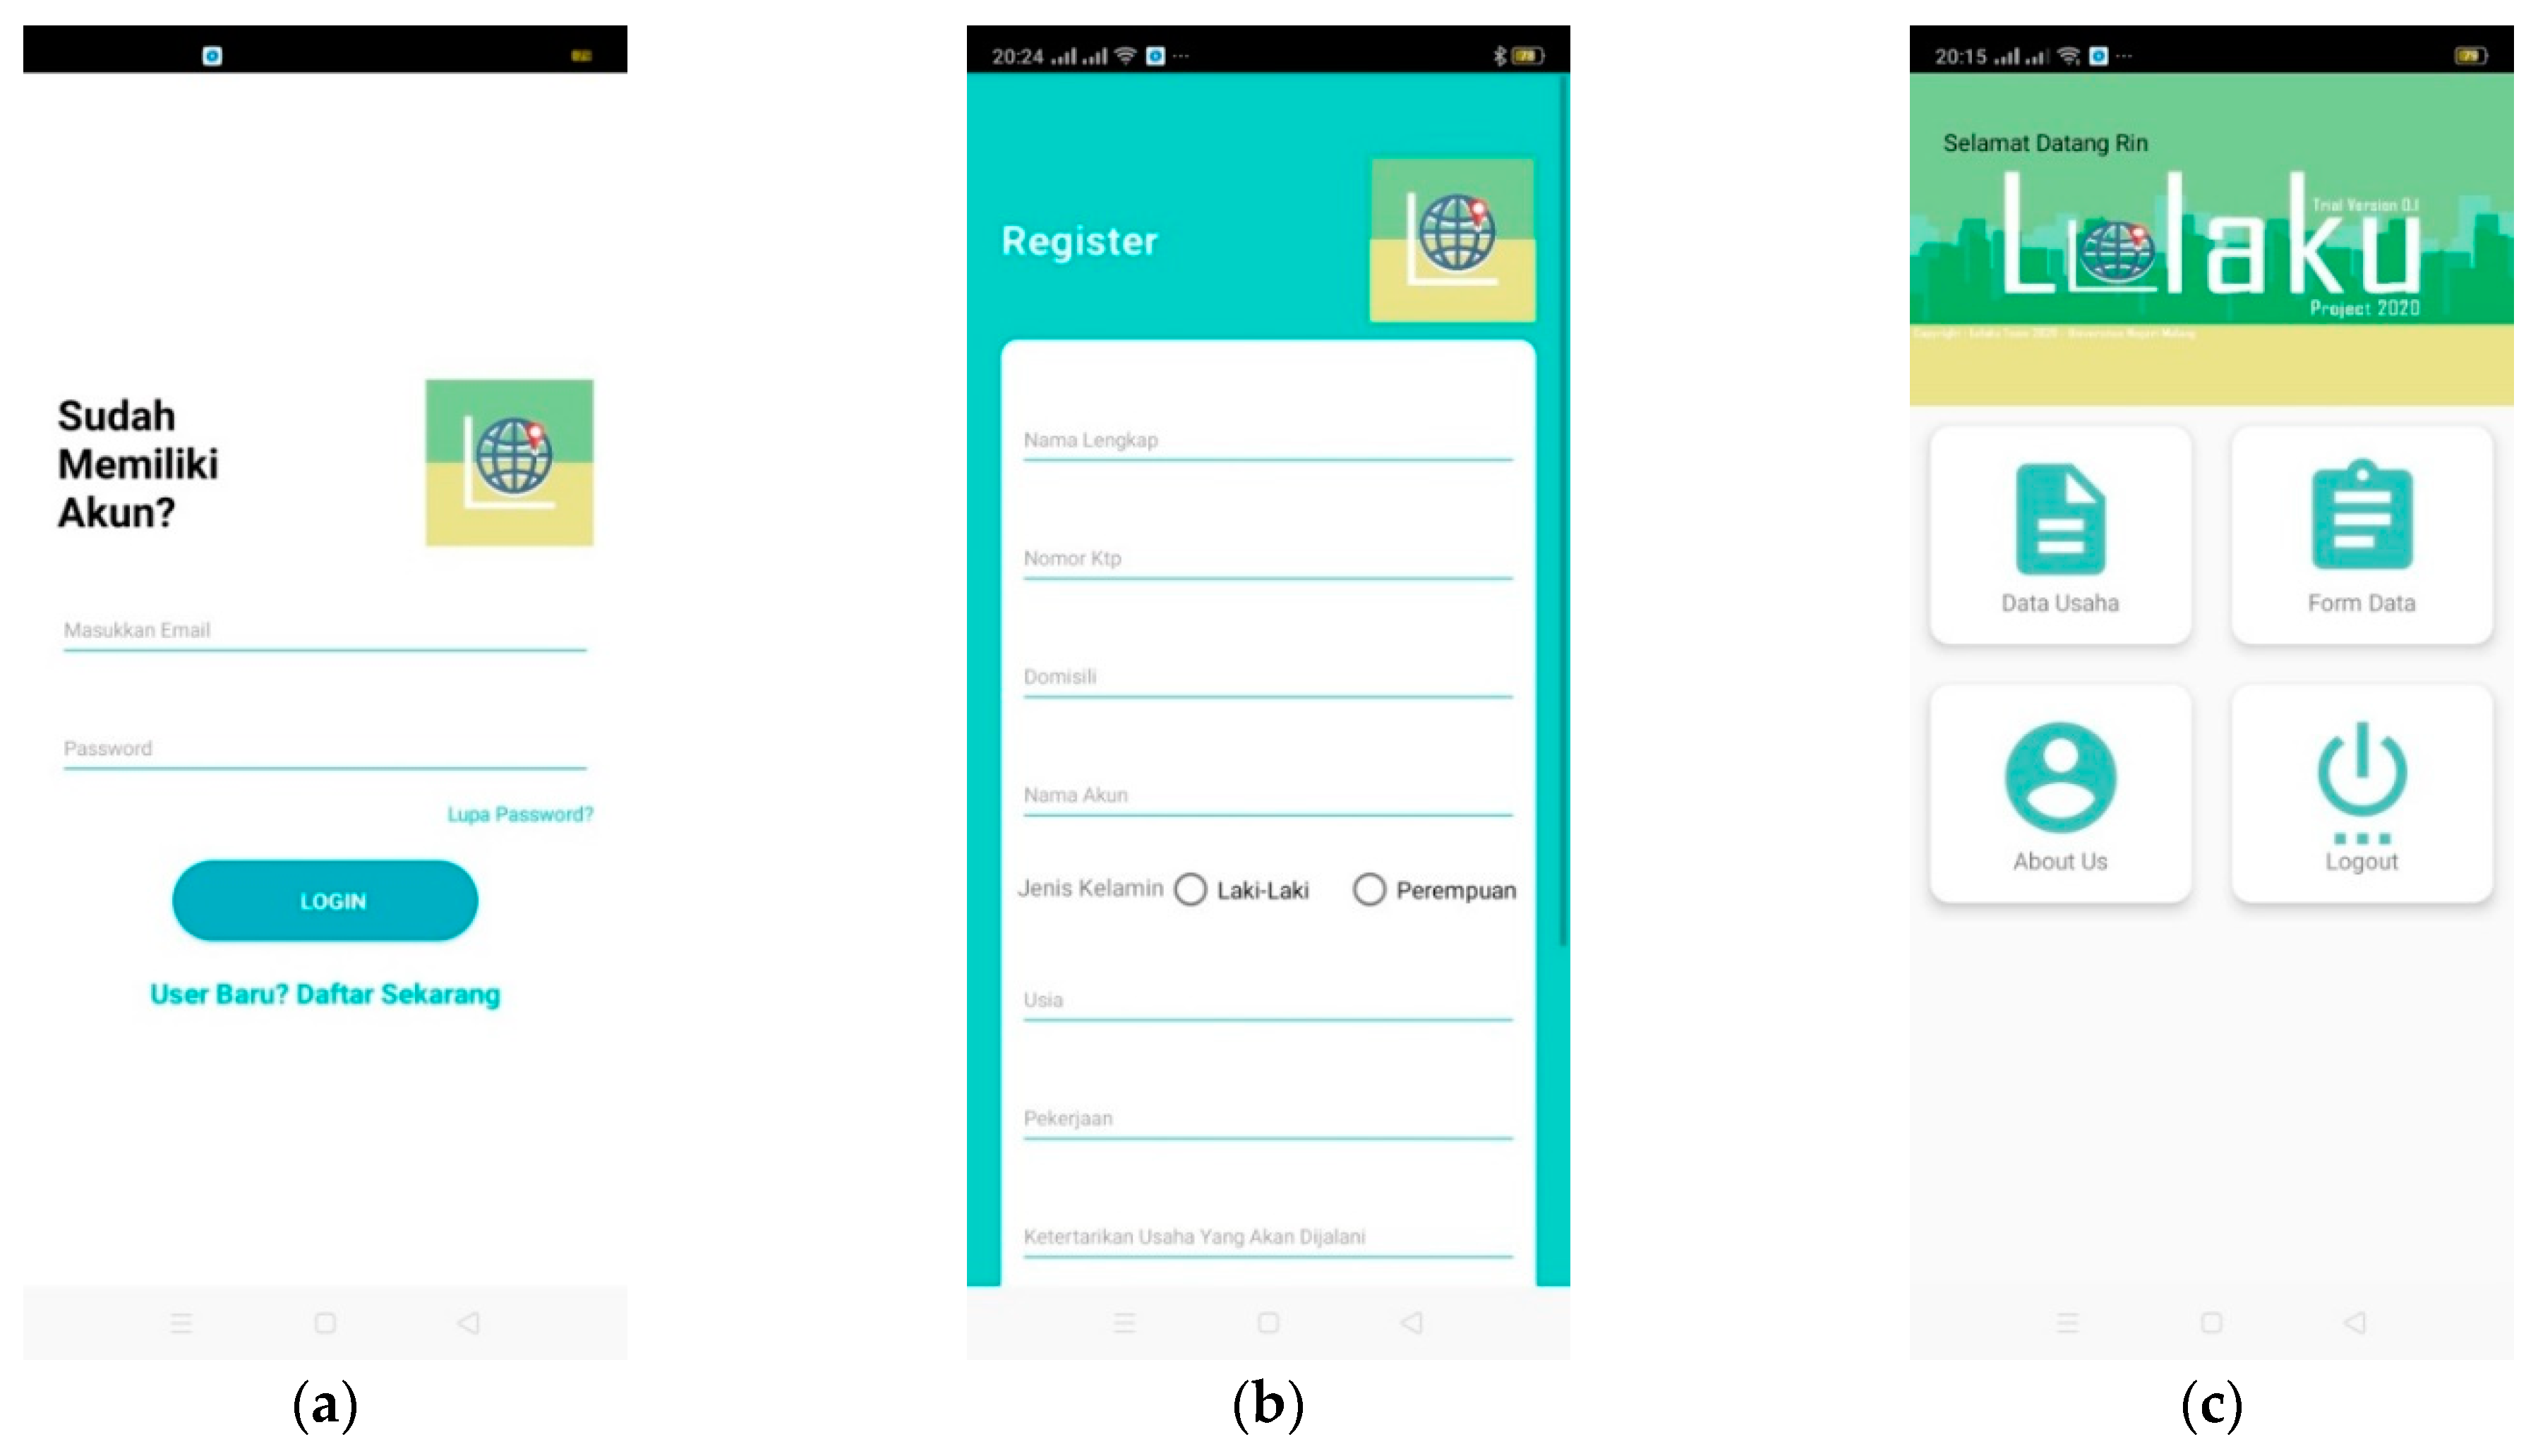
  • Download and install the application onto your Android device(s). After installing the device, users are asked to log in or register an account using an email and password. This step is shown in the interface in Figure 9a.
  • If application users do not have an account yet, the application automatically diverts to the registration page after clicking “User Baru? Daftar Sekarang”. Users need to create an account by input personal data then logging in. This step is shown in Figure 9b.
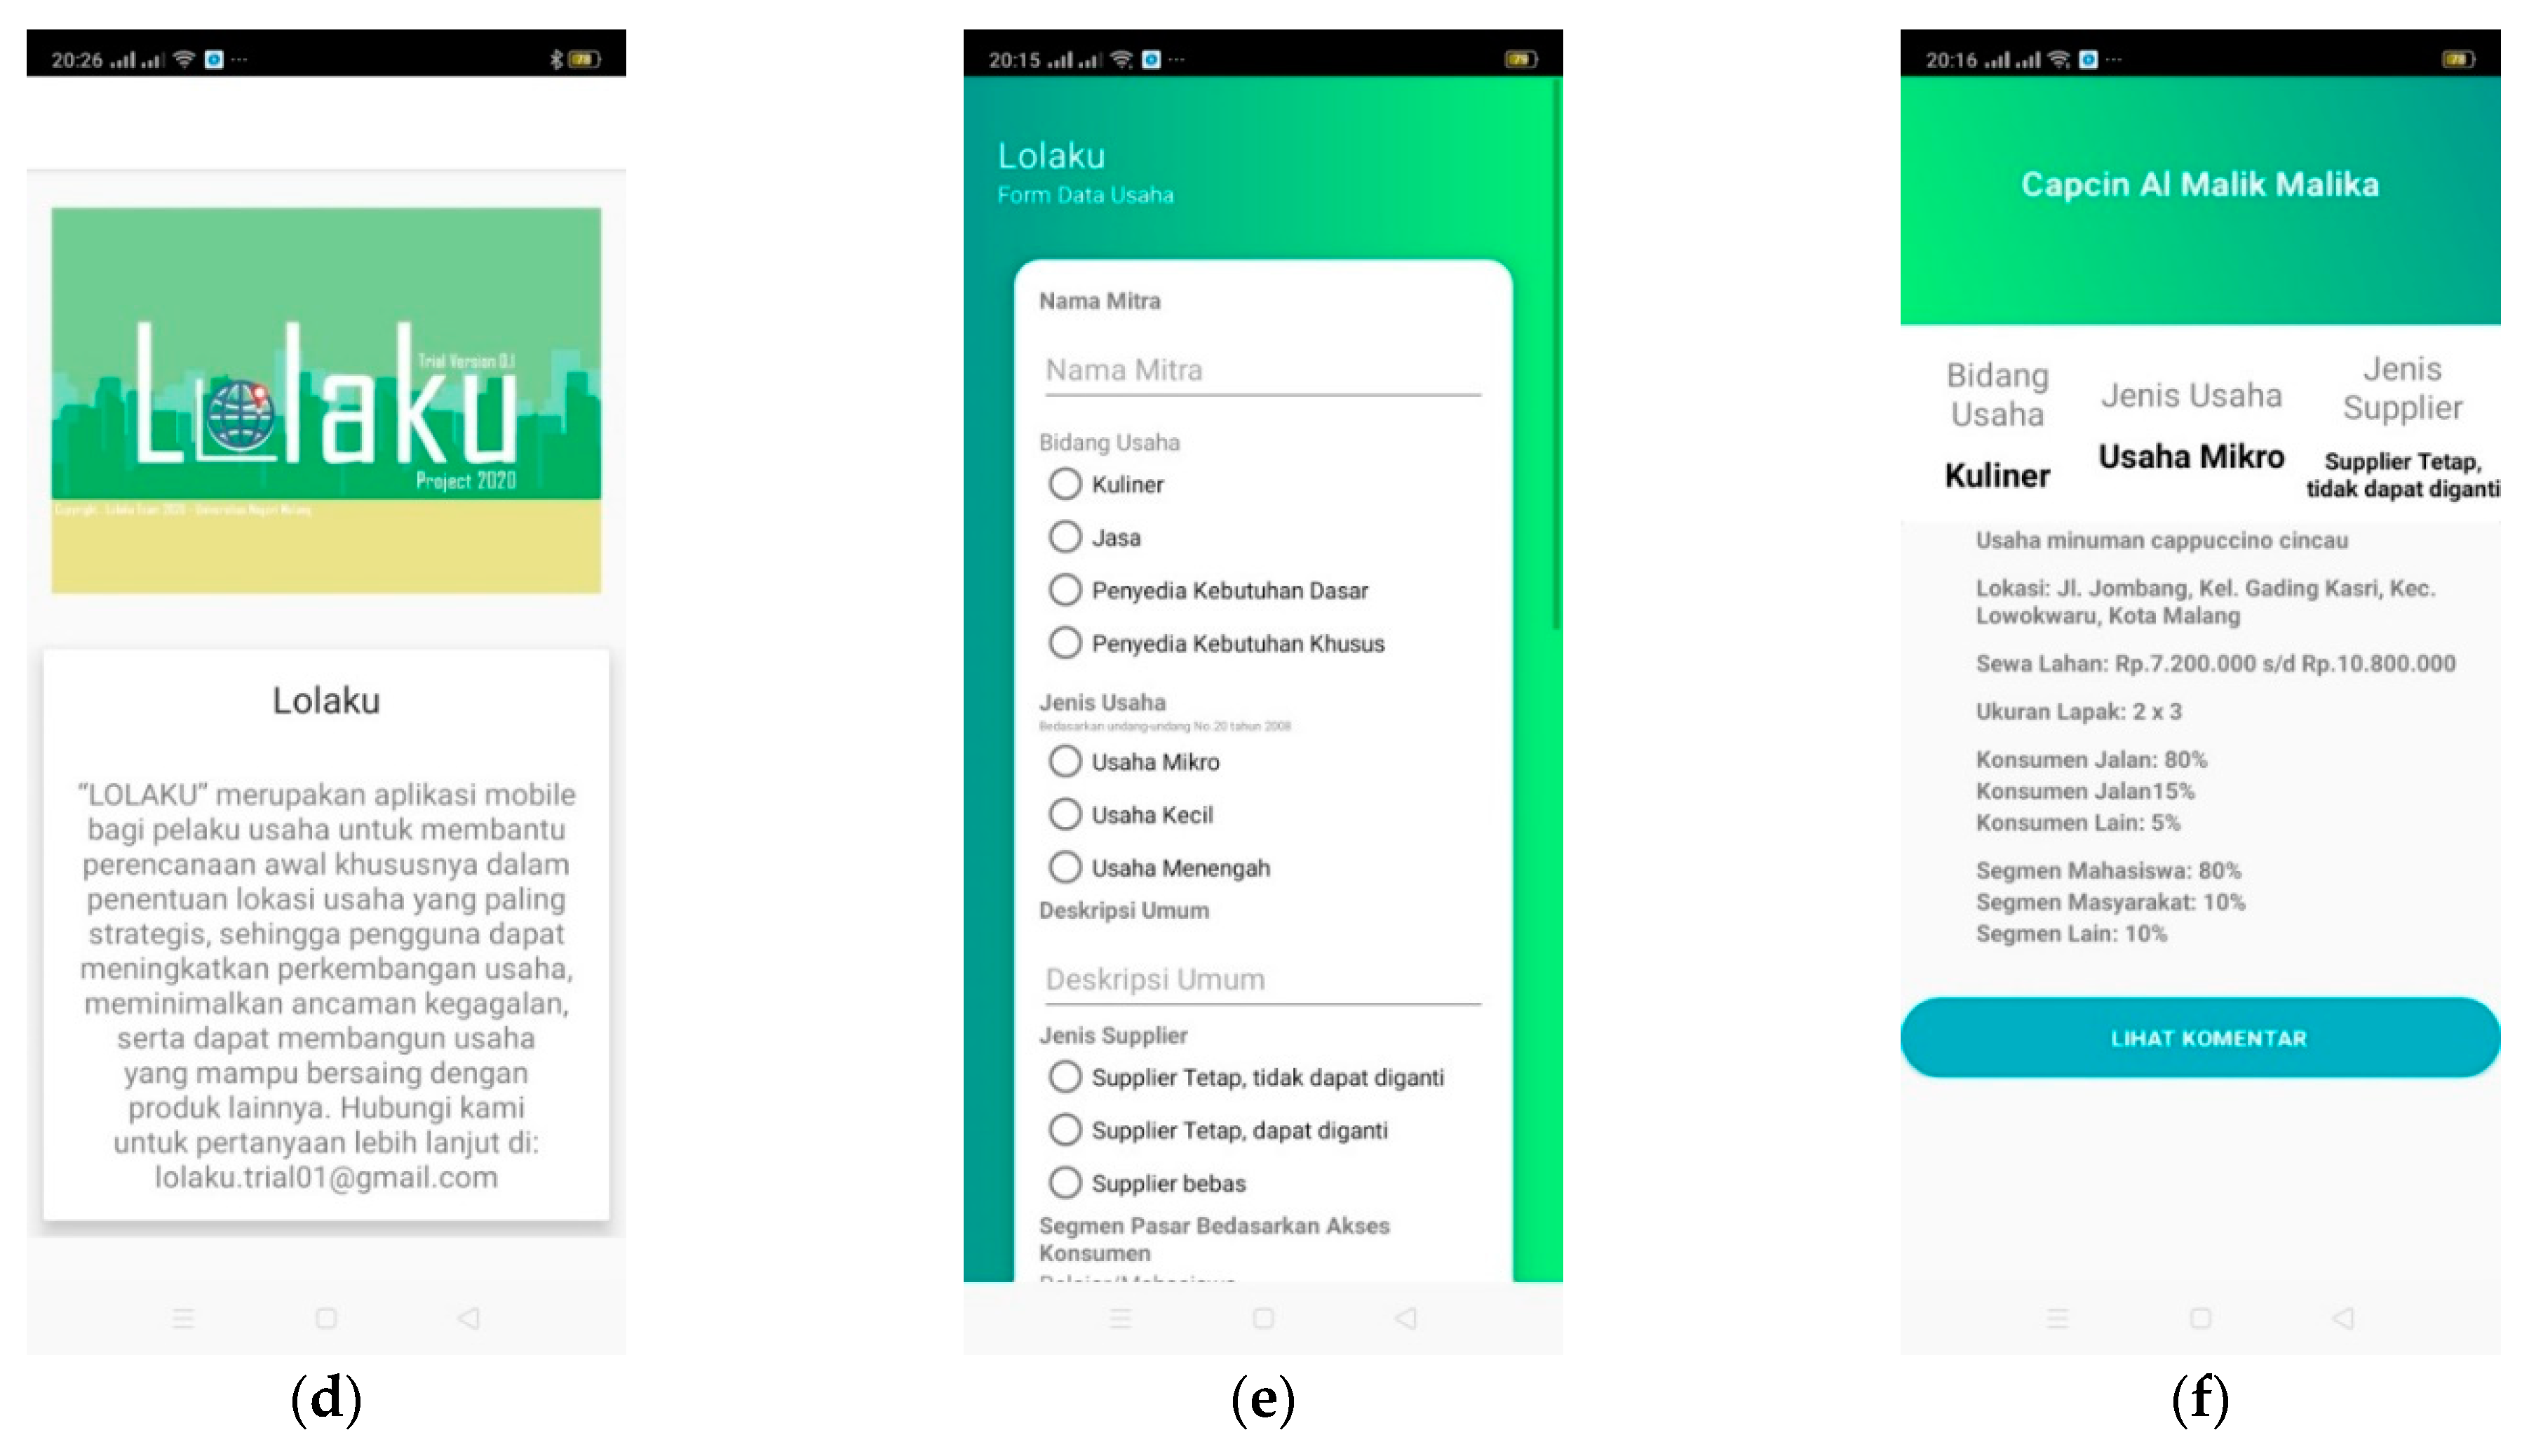
  • After logging into the account, users are provided four option features. These features have specific actions to meet users’ needs. These features are: “Data Usaha” which is the entered business criteria data by users; “Form Data” is the form page provided to enter business criteria, and each business needs a specific form; “About Us” is a description feature which explains the general information about the LOLAKU application; “Log Out” feature is used to leave the application. The interface application for this step is shown in Figure 9c.
  • Users need to click “Form Data” and fill out the business criteria data to inform administrators for theanalysis progress. These criteria need to be specific for each business plan according to the users. This step is shown in Figure 9c.
  • Entered criteria data will stored in “Data Usaha” feature. This feature also providing The “Lihat Komentar” feature is a two-way communication medium between users and administrators. Administrators inform and send the analysis result by the“Lihat Komentar” feature. This step is shown in Figure 9f.
  • For more information about the LOLAKU application users can select the “About Us” feature, which is shown in Figure 9d. This feature includes general information about LOLAKU and the developer contact.
This operational step was introduced to the respondents in the trial section, in which all of the respondent literally gave positive responses towards LOLAKU. As researchers provided a short link to download the application, respondents declared that LOLAKU is easy to install and operate. Each feature was straight and not so complicated. They also easily input their business criteria by simple form and unambiguous questions. As the result of the analysis was a map supported by chart, table, and description, respondents can simply read and navigate it. Final evaluation also counted 100% of respondent as interested in using LOLAKU for their next business expansions.

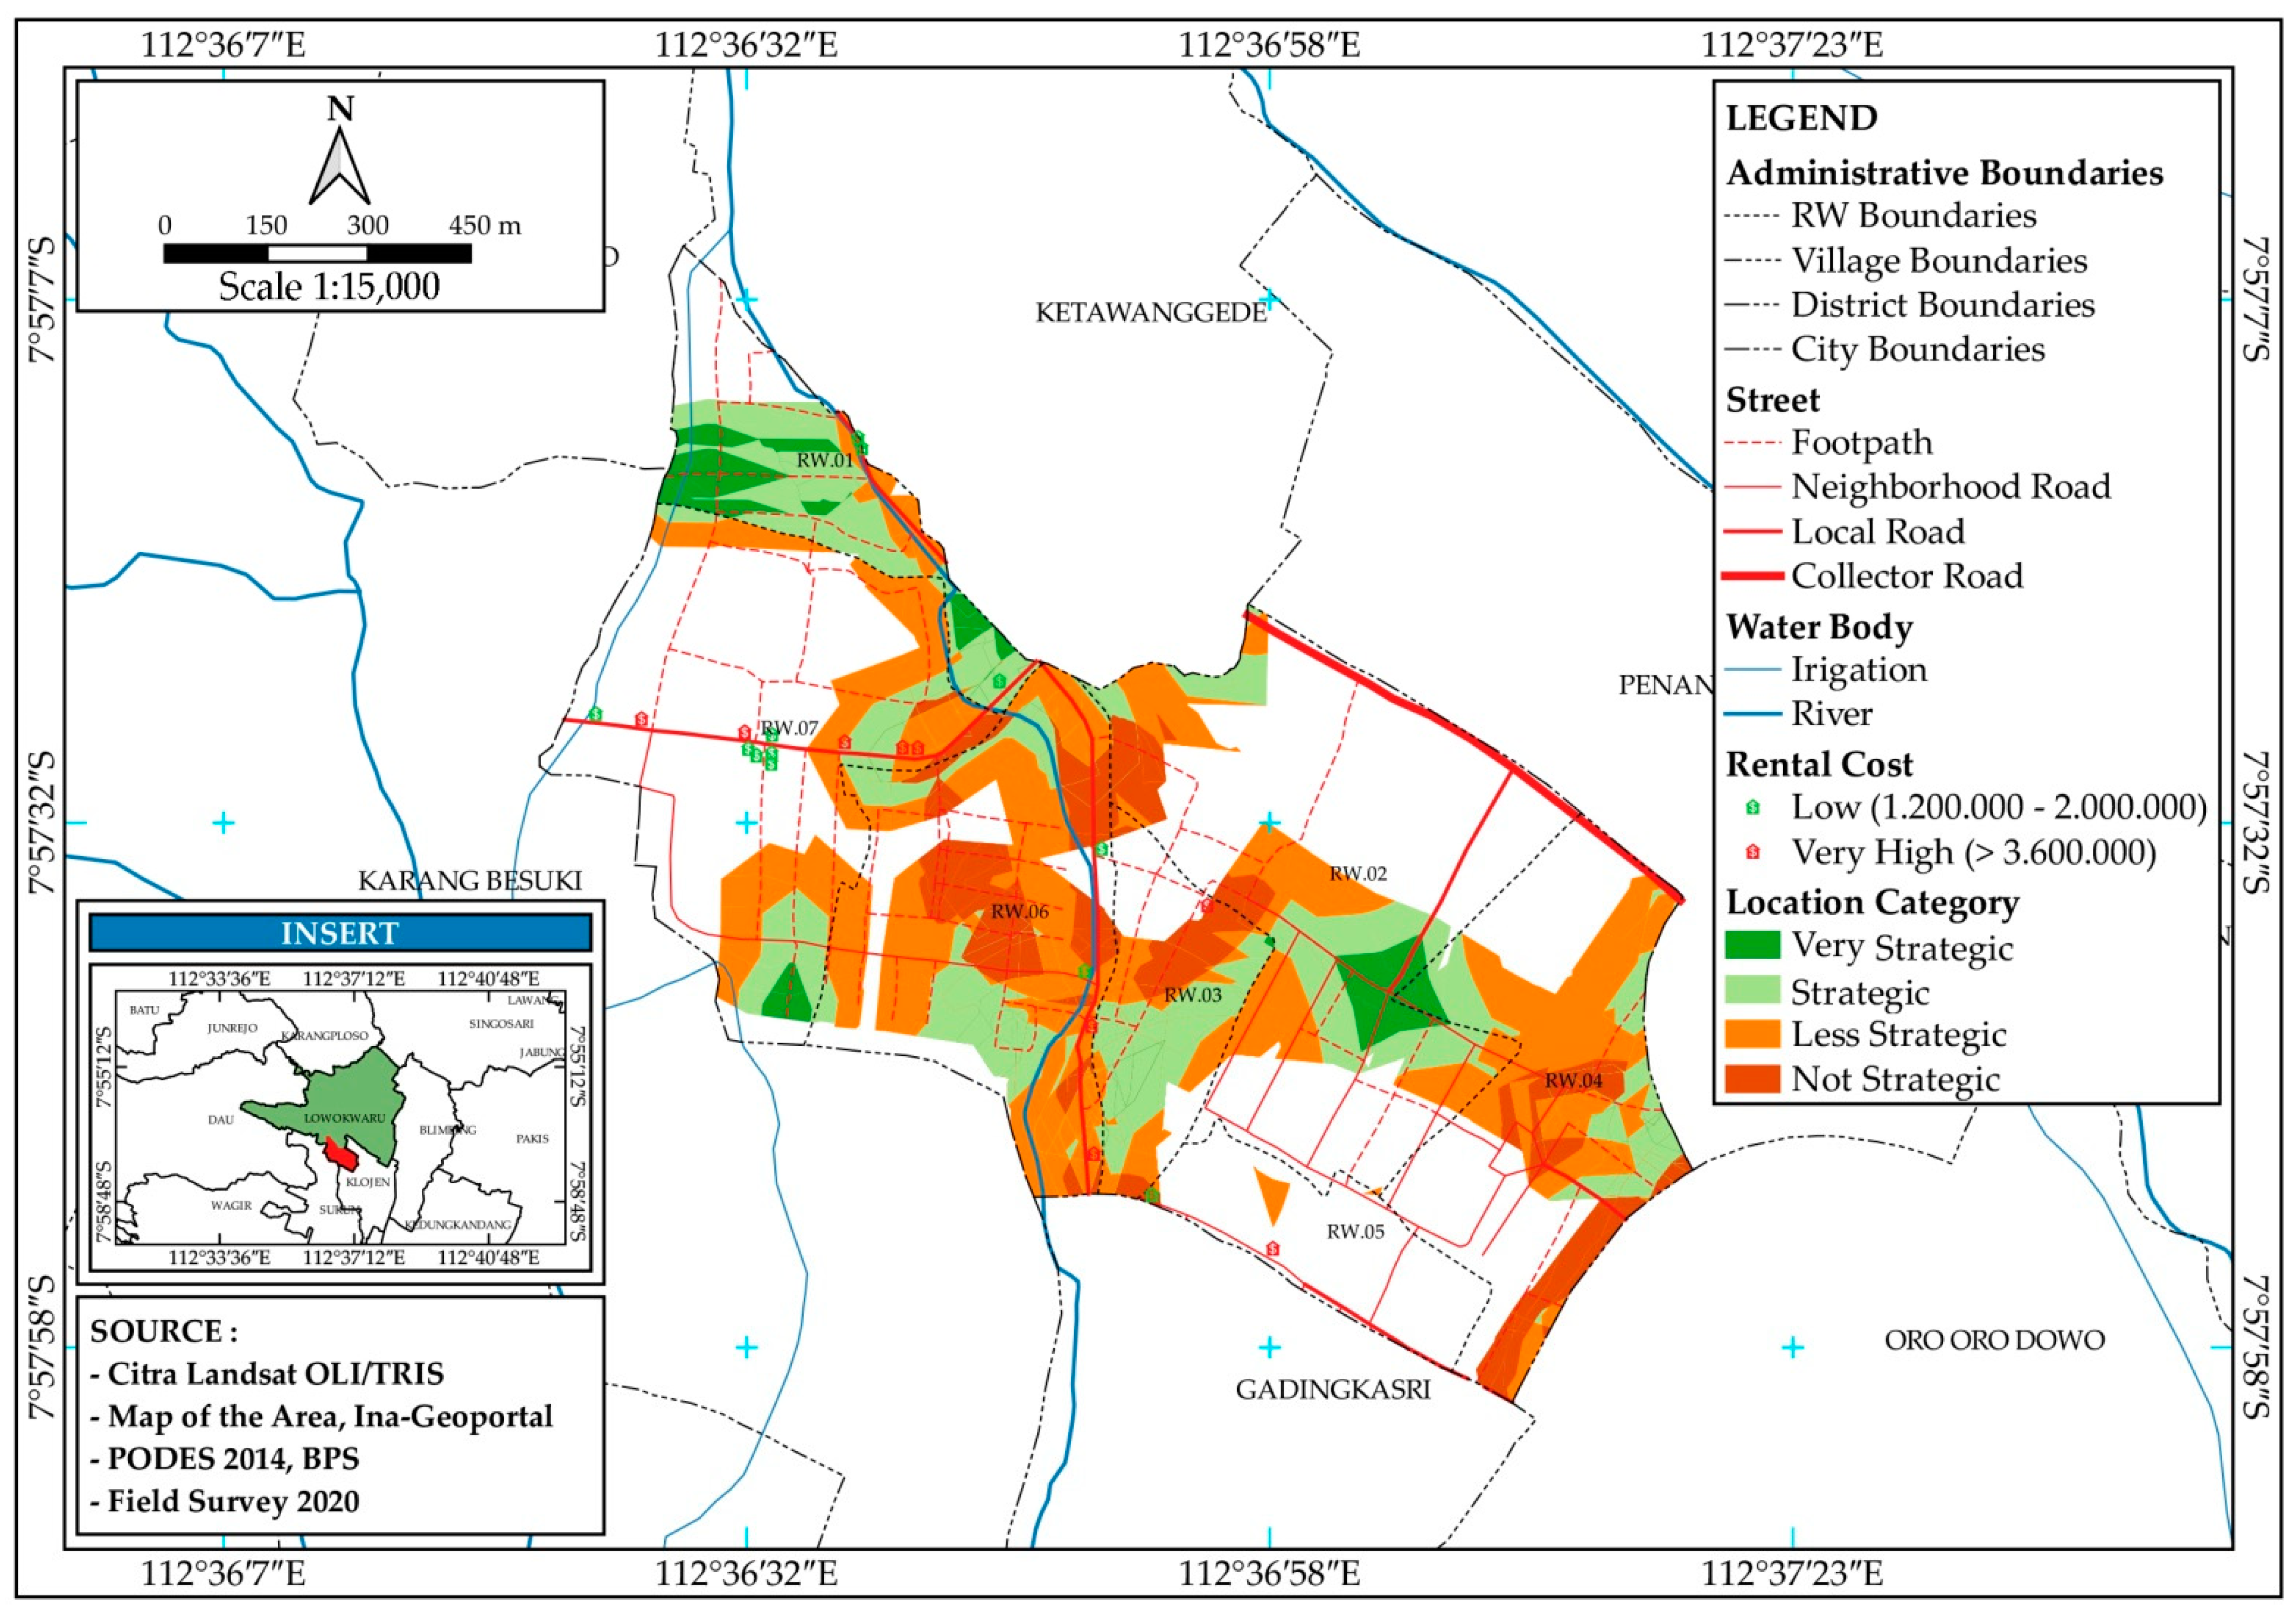
5.2. Distribution of Strategic Locations for Microbusinesses and Local Franchises as LOLAKU Results

In this section, SANA functions to determine the selling location, which in this study is called strategic location. The food and beverage stalls in Malang City are classfied as an imperfect competition market. Food and beverage sellers are classified as microbusiness actors and are located in certain areas along the road. At certain moments, consumers, which are mostly students, flock to one seller and can be seen crowding the stalls. This consumer class is the largest group of immigrants in Malang City.
SANA-integrated processes obtain strategic location distribution maps overlapping all three index calculations. This index calculation is: population density map ( N F K p ) , crowd center influence ( N F P k ) , and business potential customer map ( N F P u ) . This map also displays the rental-fee point to clearly show its distribution over the strategic location. Strategic location distribution maps are provided in the following Figure 10:
Rental points provided by survey are listed in above Table 8.
Strategic locations distribution is displayed and classified as four categories. Very strategic location is shown by the dark green area that appears as plot centers in some places. In this case. The location is highly recommended for businesses. There are minimum negative factors and the highest for the positive ones. There is almost no business competition or failure potential. However, this area is actually a crowded point center with zero business properties with no place to rent yet. Even though this area has a very high potential, microbusiness and local franchise owners need to provide their own stall.
The second category is strategic location, which is shown by light green scattered at some locations. This area indicates a recommended location for microbusinesses and local franchises. The positive factors are higher than the negative ones, and there is barely less business competition and failure potential. There are three rental points included in this category, they are point 6 (112°36′44,571″ E–7°57′25,556″ S), point 9 (112°36′37,116″ E–7°57′28,496″ S), and point 21 (112°36′49,114″ E–7°57′48,281″ S). These three points are compared with the business criteria (Bs) entered by respondents to obtain the most suitable strategic selling location.
The less strategic location categories are shown by orange areas that scatter barely wider that the strategic category. This area is barely maintained in the local road category, which has a high density of business competitors. This area is indicated as a not-recommended location for microbusinesses and local franchises. The positive factor is still less affected than the negative ones, affected high business competition and failure potential. There are six rental points included in this category.
The last ones are not-strategic areas which barely center in some locations. This area indicates as highly not recommended for microbusinesses and local franchises. The negative factors are more affected than the positive ones, affected high business competition with high failure potential. High business competition with similar products may cause unhealthy competition in this area. Fewer than 12 rental points are sadly maintained in this area.
Referring to the business criteria entered by respondents through LOLAKU, we calculated Bs as index qualification. A simple comparison was used to pick the most suitable location for microbusinesses and local franchises. We compared three locations maintained on a strategic area, which concludes point 6 as the most suitable ones (112°36′44,571″ E–7°57′25,556″ S). This rental point was supported by IDR 1,200,000 to 2,000,000 monthly fees and 6 m2 stall area as reported by respondents. Moreover, these points are located alongside local roads with a counted traffic density of 37.8 unit/min on weekdays and 32.0 unit/min on weekends. As we mentioned before, local roads are suitable for microbusinesses and local franchises related to their customer segmentation markets. Point 6 stall area conditions are the most suitable locations for respondents and are shown by Figure 11.
This result is not only for respondents but also would be identical for similar business criteria. Additionally, the specific franchise would have specific criteria for their microbusiness and local franchise. On trial sessions, we found similar criteria entered by identical products, which is dominated by light beverages. This research result can be used for them, but different criteria may be concerned for more specific and accurate analysis.
This research shows that SANA-integrated GIS on the LOLAKU mobile application is a useful application to assist microbusinesses’ and local franchises’ strategic selling location in order to decrease failure potential. LOLAKU in this research received good responses from respondents who took part in test trial sessions. Three main assessments are shown on the diagrams under the Figure 12.
For the ease-of-use factor, 46% of respondents considered the application very easy, another 54% as easy, while there were no difficult responses for this factor. Then, ease of determining strategic selling location showed 43% considering it as easy, and the rest, 57%, said very easy, while there were no difficult responses. The usefulness analysis showed 71% considering “agree” and the rest, 29%, saying “strongly agree”, while there were no “disagree” responses. These three assessed factors showed positive responses for this application.
Moreover, LOLAKU as an integrated implementation of SANA with mobile application can be applied on most common urban areas in Indonesia, which have relatively similar characteristics to Malang city. This city’s characteristics are: dominated by informal economic sectors, high population density by native inhabitants and immigrants that are mostly young populations, student dominated, and supported with high industrial sectors such as tourism attraction to intensify crowds as potential customers. We hope this application development will support and provide factual benefits for microbusinesses and local franchise actors in the future.

6. Conclusions

Malang City is supported by the informal sector represented by 50.41% informal employees, whereas 17.80% are small-business entrepreneurs. These entrepreneurs are usually street food vendors located by collectors, neighborhoods, locals, and alongside footpaths. This highly potential business opportunity is also equipped by high rates of competitors which could be a failure factor for this kind of business. Therefore, new local street food vendors—which is specified to small and medium microbusiness actors—are usually unable to compete with previously developed brands and are vulnerably distressed to maintain their business. The franchise system has a 70–80% business proportion consisting of self-employed vendors, which represent the people economy’s concept actualization and people’s prosperity enhancement (Rachman 2019). However, failure potential annually reaches 50–60% and continues to be the main problem without an effective solution yet. One of the most contributive supporting factors to local franchise business failure is rough location planning.
Integrated SANA in GIS would usefully help to determine strategic selling locations. SANA as a scientific complicated method can barely be simplified as a mobile application, called LOLAKU. Micro business and local franchise actors, which are dominated by low education levels, can easily use this service. Using advanced technology through LOLAKU may reduce failure potential while increasing business profits in the future.
LOLAKU also determines the strategic location based on specific criteria entered by respondents. This service is expected to reduce the failure potential and optimize microbusinesses and local franchises. By this application, microbusiness and local franchise actors can easily analyze location as a crucial factor for their business to minimize the failure potential in the future.
A quantitative approach was used to analyze numeric calculation of collected data to obtain a scientific conclusion. Then, SANA was applied in three factors, which are: (1) Business competitor (Pu), which is a negative effect to potential customers and displayed as a business competitor influence map (NFPU), while (2) crowd point (Tk), and (3) traffic density based on accessibility level (TA) are the positively effected potential customers, displayed as a business potential customer map (NFPK). These factors are scored using AHP and intersect with the population density map (NFKP) to obtain a strategic location distribution map. This map is then compared with respondents’ business criteria (Bs as index qualification) which contains location and rental-fee data (Bs-a) and respondents’ business criteria data entered through LOLAKU (Bs-b).
By their index score, strategic locations are classified into four categories, which are: not strategic (−6 to 0), less strategic (1 to 5), strategic (6 to 10), and very strategic (11 to 15). Analysis results show the strategic location, which is indicated by a light green area on strategic location distribution maps and scattered in the study area. This area indicates recommended locations for microbusinesses and local franchises. The positive factors are higher than the negative ones and have barely less business competition and failure potential. There are three rental points included in this category, which are point 6 (112°36′44,571″ E–7°57′25,556″ S), point 9 (112°36′37,116″ E–7°57′28,496″ S), and point 21 (112°36′49,114″ E–7°57′48,281″ S). These three points are compared with business criteria (Bs) to obtain the most suitable ones for microbusinesses and local franchises.
Referring to entered business criteria by respondents through LOLAKU, we can calculated Bs as an index qualification. A simple comparison is used to pick the most suitable location for respondents, which concludes as point 6 (112°36′44,571″ E–7°57′25,556″ S). This rental point is supported by IDR 1,200,000 to 2,000,000 monthly fees and 6 m2 stall size areas as requested by respondents. Moreover, these points are located alongside local roads, which have a counted traffic density of 37.8 unit/min on weekdays and 32.0 unit/min on weekends. As we mentioned before, local roads are suitable for microbusinesses and local franchises related to their customer segmentation markets.
This research represents LOLAKU as a useful application to assist microbusiness and local franchise strategic location in order to decrease failure potential. LOLAKU received good responses from respondents who took part in trial sessions. Moreover, LOLAKU as an integrated implementation of SANA with mobile application can be applied on most common urban areas in Indonesia which have relatively similar characteristic to Malang City. We hope this application development will support and provide factual benefits for microbusiness and local franchise actors in the future.

Author Contributions

Conceptualization, S.W., D.R.S., K.H.A. and J.S.L.; methodology, S.W. and D.R.S.; software, D.S.; validation, S.W.; formal analysis, S.W.; investigation, S.R. writing—original draft preparation, S.W., D.R.S., J.S.L. and K.H.A.; writing—review and editing, S.W.; visualization, D.S. and S.R.; supervision, S.W.; project administration, S.W.; funding acquisition, S.W. All authors have read and agreed to the published version of the manuscript.

Funding

The research was independently funded by the author team. The publication funding is by Universitas Negeri Malang.

Institutional Review Board Statement

Not applicable.

Informed Consent Statement

Not applicable.

Data Availability Statement

The data presented in this study are available upon request from the corresponding author.

Acknowledgments

Honorable acknowledgement of Fasih Auladi as the main programmer of the LOLAKU app. which supports this research. Else, we appreciate Riama as meritorious respondent in this research who provided an objective and fair review until the end.

Conflicts of Interest

The authors declare no conflict of interest.

References

  1. Ahmadzai, Farhad, K. M. Laksamana Raob, and Shahzada Ulfatc. 2019. Assessment and Modelling of Urban Road Networks Using Integrated. Graph of Natural Road Network (a GIS-Based Approach). Journal of Urban Management 8: 109–25. [Google Scholar] [CrossRef]
  2. Ailawadi, Kusum L., and Kevin Lane Keller. 2004. Understanding Retail Brand: Conceptual Insights and Research Priorities. Journal of Retailing 80: 331–42. [Google Scholar] [CrossRef]
  3. Ailawadi, Kusum L., Koen Pauwels, and Jan-Benedict E. M. Steenkamp. 2008. Private-Label Use and Store Loyalty. Journal of Marketing 72: 19–30. [Google Scholar] [CrossRef] [Green Version]
  4. Alma, Buchari. 2018. Manajemen Pemasaran Dan Pemasaran Jasa. Revisi. Bandung City: CV Alfabeta. [Google Scholar]
  5. Alon, Ilan. 2006. Springer Science Business Media, Inc. Service Franchising: A Global Perspective. Available online: https://0-link-springer-com.brum.beds.ac.uk/book/10.1007%2F0-387-28256-4 (accessed on 16 June 2020).
  6. Andriansyah, Yusuf, Rois Arifin, and Afi Rachmat Slamet. 2017. Pengaruh Label Halal, Citra Merek Dan Kualitas Produk Terhadap Keputusan Pembelian Teh Racek (Studi Kasus Pada Mahasiswa Fakultas Ekonomi Universitas Islam Malang). E-Jurnal Riset Manajemen 6: 98–112. [Google Scholar]
  7. Anghinolfi, Davide, Massimo Paolicci, and Flavio Tonelli. 2016. A Vehicle Routing Problem with Time Windows Approach for Planning Service Operations in Gas Distribution Network of a Metropolitan Area. IFAC-Paperonline 49: 1365–70. [Google Scholar] [CrossRef]
  8. Asakereh, Abbas, Mohsen Soleymani, and Mohammad Javad Sheikhdavoodi. 2017. A GIS-Based Fuzzy-AHP Method for the Evaluation of Solar Farms Locations: Case Study in Khuzestan Province, Iran. Journal of Solar Energy 155: 342–53. [Google Scholar] [CrossRef]
  9. Azizkhania, Mostafa, Abdullah Vakilib, Younes Noorollahic, and Farzin Naserid. 2017. Potential Survey of Photovoltaic Power Plants Using Analytical Hierarchy Process (AHP) Method in Iran. Renewable and Sustainable Energy Reviews 75: 1198–206. [Google Scholar] [CrossRef]
  10. Bajjali, William. 2018. ArcGIS for Environmental and Water Issues. Cham: Springer International Publishing, ISBN 978-3-319-61158-7. [Google Scholar]
  11. Barthelemy, Marc. 2018. Morphogenesis of Spatial Networks. Cham: Springer International Publishing, ISBN 978-3-319-20565-6. [Google Scholar]
  12. Beneke, Justin, and Stephen Carter. 2015. The Development of a Consumer Value Proposition of Private Label Brands and the Application Thereof in a South African Retail Context. Journal of Retailing and Consumer Services 25: 22–35. [Google Scholar] [CrossRef]
  13. Bennett, David, and Marc Armstrong. 2010. Manual of Geospatial Science and Technology, 2nd ed. London: CRC Press, ISBN 9780367884215. [Google Scholar]
  14. Boyle, Matthew. 2003. Brand Killers. Fortune 148: 89. [Google Scholar]
  15. BPS (Badan pusat Statistik). 2021. Kota Malang Dalam Angka. Malang. Available online: https://malangkota.bps.go.id/publication/2021/02/26/4ccb213f9a2a7ba007bff7c4/kota-malang-dalam-angka-2021.html (accessed on 10 December 2020).
  16. Cooper, Crispin H. V. 2015. Spatial Localization of Closeness and Betweenness Measures: A Self-Contradictory but Useful Form of Network Analysis. International Journal of Geographical Information Science 29: 1293–309. [Google Scholar] [CrossRef] [Green Version]
  17. Dashti, Rahman, Mohammad Daisy, Hamid Mirshekali, Hamid Reza Shaker, and Mahmood Hosseini Aliabadi. 2021. A Survey of Fault Prediction and Location Methods in Electrical Energy Distribution Networks. Mearusment 184: 109947. [Google Scholar] [CrossRef]
  18. Daskin, Mark S. 2014. Network and Discrete Location: Models, Algorithms, and Applications. Hoboken: John Wiley and Sons, Inc., ISBN 978-0-470-90536-4. [Google Scholar] [CrossRef]
  19. Dawes, John, and Magda Nenycz-Thiel. 2013. Analyzing the Intensity of Private Label Competition across Retailers. Journal of Business Research 66: 60–66. [Google Scholar] [CrossRef]
  20. De Wulf, Kristof, Gaby Odekerken-Schröder, Frank Goedertier, and Gino Van Ossel. 2005. Consumer Perceptions of Store Brands versus National Brands. Journal of Consumer Marketing 22: 223–32. [Google Scholar] [CrossRef]
  21. Dempsey, Nicola, Caroline Brown, Shibu Raman, Sergio Porta, Mike Jenks, Colin Jones, and Glen Bramley. 2010. Elements of Urban Form. Dimensions of the Sustainable City. London: Springer, pp. 21–51. [Google Scholar] [CrossRef] [Green Version]
  22. Demsar, Urška, Olga Špatenková, and Kirsi Virrantaus. 2008. Identifying Critical Locations in a Spatial Network with Graph Theory. Transactions in GIS 12: 61–82. [Google Scholar] [CrossRef]
  23. Docan, Daniela Cristiana. 2016. Learning ArcGIS for Desktop. Birmingham: Packt Publishing. [Google Scholar]
  24. Doljak, Dejan, and Gorica Stanojevi. 2017. Evaluation of Natural Conditions for Site Selection of Ground-Mounted Photovoltaic Power Plants in Serbia. Journal of Energy 127: 291–300. [Google Scholar] [CrossRef] [Green Version]
  25. Erdem, Tülin, Ying Zhao, and Ana Valenzuela. 2004. Performance of Store Brands: A Crosscountry Analysis of Consumer Store Brand Preferences, Perceptions, and Risk. Journal of Marketing Research 41: 86–100. [Google Scholar] [CrossRef] [Green Version]
  26. Firdaniaty. 2011. Bisnis Yang Terus Tumbuh. Majalah SWA. Available online: https://swa.co.id/ (accessed on 16 June 2020).
  27. Ghanbari, Ryan, Mahdi Jalili, and Xinghuo Yu. 2017. Correlation of Cascade Failures and Centrality Measures in Complex Networks. Future Generation Computer Systems 83: 390–400. [Google Scholar] [CrossRef]
  28. Godinho, Pedro, Paul Phillips, and Luiz Moutinho. 2018. Hotel Location When Competitors May React: A Game-Theoretic Gravitational Model. Journal Tourism Management 69: 384–96. [Google Scholar] [CrossRef]
  29. Honarparvar, Sepehr, Mohammadreza Malek, Sara Saeedi, and dan Steve Liang. 2021. IPAWL: An Integrated Power Aware Wireless Sensor Network and Location-Based Social Network for Incidence Reporting. International Journal of Applied Earth Observations and Geo-Information 104: 102540. [Google Scholar] [CrossRef]
  30. Huang, Jie, and David M. Levinson. 2015. Circuity in Urban Transit Networks. Journal of Transport Geography 48: 145–53. [Google Scholar] [CrossRef] [Green Version]
  31. Hyman, Michael, Dennis A. Kopf, and Dongdae Lee. 2010. Review of Literature- Future Research Suggestion: Private Label Brands: Benefit Success Factors and Future Research. Journal of Brand Management 17: 368–89. [Google Scholar] [CrossRef]
  32. Imanuwelita, Vienticentia, Rekyan Regasari Mardi Putri, and Faizatul Amalia. 2018. Penentuan Kelayakan Lokasi Usaha Franchise Menggunakan Metode AHP Dan Vikor. Jurnal Pengembangan Teknologi Informasi dan Ilmu Komputer 2: 122–32. [Google Scholar]
  33. Jiang, Bin, Sijian Zhao, and Junjun Yin. 2008. Self-Organized Natural Roads for Predicting Traffic Flow: A Sensitivity Study. Journal of Statistical Mechanics 2008: P07008. [Google Scholar] [CrossRef] [Green Version]
  34. Khalil, Naoras, Mohannad Mhanna, and Eng Haidar Assaf. 2021. Horizontal Corridor Optimization of Highway Using GIS & CFSC Method in Mountainous Areas. The Egyptian Journal of Remote Sensing and Space Sciences 24: 509–14. [Google Scholar] [CrossRef]
  35. Leng, Jun-Qiang, Jing Zhai, Qian-Wen Li, and Lin Zhao. 2017. Construction of Road Network Vulnerability Evaluation Index Based on General Travel Cost. Physica A: Statistical Mechanics and Its Applications 493: 421–29. [Google Scholar] [CrossRef]
  36. Levy, Michael, Barton Weitz, and Dhruv Grewal. 2007. Retailing Management. New York: McGraw Hill, ISBN10 1260912469/ISBN13 9781260912463. [Google Scholar]
  37. Lin, Jingyi, and Yifang Ban. 2017. Comparative Analysis on Topological Structures of Urban Street Networks. International Journal of Geo-Information 6: 295. [Google Scholar] [CrossRef] [Green Version]
  38. Liu, Yan, Sha Zhang, Jiahua Zhang, Lili Tang, and Yun Bai. 2021. Using Artificial Neural Network Algorithm and Remote Sensing Vegetation Index Improves the Accuracy of the Penman-Monteith Equation to Estimate Cropland Evapotranspiration. Applied Sciences 11: 8649. [Google Scholar] [CrossRef]
  39. Mead, G. C. 2004. Current Trends In The Microbiological Safety Of Poultry Meat. World’s Poultry Science Journal 60: 112–18. [Google Scholar] [CrossRef]
  40. Ngobo, Paul-Valentin. 2011. Private Label Share, Branding Strategy, and Store Loyalty. Journal of Retailing and Consumer Service 18: 259–70. [Google Scholar] [CrossRef]
  41. Nies, Salome, and Martin Natter. 2012. Does Private Label Quality Influence Consumers Decision on Where to Shop? Journal of Psychology & Marketing 29: 279–92. [Google Scholar] [CrossRef]
  42. Ormsby, Tim, Eileen J. Napoleon, Robert Burke, and Carolyn Groessl. 2010. Getting to Know ArcGIS Desktop. New York: ESRI Press, ISBN-13 978-1589482609/ISBN-10 1589482603. [Google Scholar]
  43. Panda, Swati, Audhesh K. Paswan, and Sailendra P. Mishrab. 2018. Impact of Positioning Strategies on Franchise Fee Structure. Industrial Marketing Management 81: 30–39. [Google Scholar] [CrossRef]
  44. Pepe, Michael. 2012. The Impact of Provate Label Sales Penetration on Category Profitability. Journal of Business & Economics Research 10: 513–19. [Google Scholar] [CrossRef] [Green Version]
  45. Porta, Sergio, Paolo Crucitti, and Vito Latora. 2006. The Network Analysis of Urban Streets: A Primal Approach. Environment and Planning B: Urban Analytics and City Science 33: 705–25. [Google Scholar] [CrossRef] [Green Version]
  46. Rabbi, Cahya Puteri Abdi. 2021. Waralaba Lokal Mulai Kuasai Pasar Dalam Negeri Dan Merambah Regional. Katadata News. Available online: https://katadata.co.id/maesaroh/berita/61af24db9e5e1/waralaba-lokal-mulai-kuasai-pasar-dalam-negeri-dan-merambah-regional (accessed on 16 June 2020).
  47. Rachman, Vicky. 2019. Waralaba Menunjang Ekonomi Kerakyatan. Available online: https://swa.co.id/swa/trends/waralaba-menunjang-ekonomi-kerakyatan (accessed on 16 June 2020).
  48. Ramya, Sakkeri, and Valanfap Devadas. 2019. Integration of GIS, AHP and TOPSIS in Evaluating Suitable Locations for Industrial Development: A Case of Tehri Garhwal District, Uttarakhand, India. Journal of Cleaner Production 238: 117872. [Google Scholar] [CrossRef]
  49. Rao, Yongheng, Jianjun Zhang, Qin Xu, and Shuqing Wang. 2018. Sustainability Assessment of Road Networks: A New Perspective Based on Service Ability and Landscape Connectivity. Sustainable Cities and Society 40: 471–83. [Google Scholar] [CrossRef]
  50. Retnawati, Berta Bekti, Elia Ardyan, and Naili Farida. 2018. The Important Role of Consumer Conviction Value in Improving Intention to Buy Private Label Product in Indonesia. Asia Pacific Management Review 23: 193–200. [Google Scholar] [CrossRef]
  51. Rodrigue, Jean Paul, Claude Comtois, and Brian Slack. 2006. The Geography of Transport Systems. London: Routledge. [Google Scholar]
  52. Sanny, Lim. 2016. Analisis Faktor Penyebab Kegagalan Kerjasama Dalam Bisnis Wara-Laba: Studi Pada Perusahaan Waralaba Makanan Dan Minuman Di Jabodetabek. Jurnal Ekonomi 7: 77983. [Google Scholar] [CrossRef]
  53. Semeijn, Janjaap, Allard van Riel, and Beatriz Ambrosini. 2004. Consumer Evaluations of Store Brands: Effects of Store Image and Product Attributes. Journal of Retailing and Consumer Service 11: 247–58. [Google Scholar] [CrossRef] [Green Version]
  54. Sevtsuk, Andres, and Michael Mekonnen. 2012. Urban Network Analysis. Revue Internationale de Géomatique 22: 287–305. [Google Scholar] [CrossRef]
  55. Singh, Prasoon, Vinay Shankar Prasad Sinha, Ayushi Vijhani, and Neha Pahuja. 2018. Vulnerability Assessment of Urban Road Network from Urban Flood. International Journal of Disaster Risk Reduction 28: 237–50. [Google Scholar] [CrossRef]
  56. Sudhir, K., and Debabrata Talukdar. 2004. Does Store Brand Patronage Improve Store Patronage? Review of Industrial Organization 24: 143–60. [Google Scholar] [CrossRef]
  57. Sujata, Abhijeet Anand, and Priyanka Kaushal. 2021. Life Cycle Assessment of Strategic Locations to Establish Molasses Based Bioethanol Production Facility in India. Cleaner Environmental Systems 3: 100055. [Google Scholar] [CrossRef]
  58. Surono, Adrian, Bintang Pramudya, and Ayyub Anshari Sukmaraga. 2021. Rebranding UMKM Kafe ‘Kopiright’ Malang Berbasis Analisis SWOT, Untuk Meningkatkan Brand Awareness. Jurnal Ilmiah Sains & Teknologi 2: 125–43. [Google Scholar] [CrossRef]
  59. Toms, Silas. 2015. ArcPy and ArcGIS—Geospatial Analysis with Python. Birningham: Packt Publishing Ltd., ISBN 978-1-78398-866-2. [Google Scholar]
  60. Vragović, I., E. Louis, and A. Díaz-Guilera. 2005. Efficiency of Informational Transfer in Regular and Complex Networks. Physical Review 71: 036122. [Google Scholar] [CrossRef] [Green Version]
  61. Walsh, Gianfranco, and Vincent-Wayne Mitchell. 2010. Consumers’ Intention to Buy Private Label Brands Revisited. Journal of General Management 35: 3–24. [Google Scholar] [CrossRef]
  62. Yu, Wenhao. 2017. Assessing the Implications of the Recent Community Opening Policy on the Street Centrality in China: A GIS-Based Method and Case Study. Applied Geography 89: 61–76. [Google Scholar] [CrossRef]
  63. Zaky, Ian Maulana. 2015. Sistem Pendukung Keputusan Penentuan Kelayakan Lokasi Cabang Usaha Kuliner Dengan Metode AHP-TOPSIS. Available online: http://repository.ub.ac.id/id/eprint/146217 (accessed on 16 June 2020).
  64. Zhang, Xue-yang, Xiao-kang Wang, Su-min Yu, Jian-qiang Wang, and Tie-li Wang. 2020. Location Selection of Offshore Wind Power Station by Consensus Decision Framework Using Picture Fuzzy Modeling. Journal of Cleaner Production 202: 990–92. [Google Scholar] [CrossRef]
Figure 1. Network analysis (a) and service area network illustrations (b).
Economies 10 00103 g001
Figure 2. Research area, Sumbersari Village, Lowokwaru Subdistrict, Malang City.
Economies 10 00103 g002
Figure 3. Research design diagram.
Economies 10 00103 g003
Figure 4. Diagram process of SANA-integrated analysis through LOLAKU to determine strategic location distribution map.
Economies 10 00103 g004
Figure 5. Population density distribution map of Sumbersari Vilage, Lowokwari Subdistrict, Malang City.
Economies 10 00103 g005
Figure 6. Business competitor distribution map.
Economies 10 00103 g006
Figure 7. Crowd center distribution map.
Economies 10 00103 g007
Figure 8. Rental point location and fee distribution map.
Economies 10 00103 g008
Figure 9. The interface display of LOLAKU application; (a) application home page asking users to log in to their account or register a new one if they do not have one yet; (b) if the user did not have an account yet, the registration page after clicking “User Baru? Daftar Sekarang” and entering the personal data required; (c) interface for main page that provides four main features of this application; (d) interface page for “About Us” feature which describes general information about the program; (e) interface for “Data Form” future for entering users’ business criteria; (f) interface for business characterisitcs entered by the user (in this figure Chapcin Al-Malik Malika is shown as an example). These feature are equipped with a comment column named “Lihat Komentar”. From this comment column, LOLAKU administrators send analysis results and users also have a two-way communication medium to consult for more explanation.
Economies 10 00103 g009aEconomies 10 00103 g009b
Figure 10. Strategic selling location distribution map for microbusinesses and local franchises.
Economies 10 00103 g010
Figure 11. Point 6, which is the rcommended selling location for microbusinesses and local franchises.
Economies 10 00103 g011
Figure 12. Three main respondents’ feedback toward LOLAKU, (a) ease of use, (b) ease of determining strategic selling location, and (c) usefulness analysis.
Economies 10 00103 g012
Table 1. Factors, collecting and scoring method.
FactorsCollecting MethodScoring Method
Business competitor (Pu) *Plotting survey of location coordinate and equipped information(Pu) refers to any beverage vendors found around the research area as competitors of the respondents. Scoring system used SANA using 3 threshold classes by range: 100 m for strong; 200 m for average; and 300 m for weak. Pu is classified into three based on business scale: microbusiness (Score 1); small-scaled (Score 2); and medium-scaled (Score 3). Pu indicates service coverage area of business competitors that probably decrease the potential profits for the microbusiness and local franchise.
Crowd level (Tk) *(Tk) classified based on the following criteria: tourism objects and education center scored 4; shopping center scored 3; civic center scored 2; and residence center scored 1. Meanwhile, SANA for this factor uses 3 threshold classes by range: 100 m for strong; 200 m for average; and 300 m for weak.
Rental and facility costs (Bs-a) *(Bs-a) were identified based on the location plot that could be rented for the respondents business expansion. Bs compared with the stall sizes requested by respondents. Six squares are the requested size and scored by 4; 5 squares are scored by 3; 4 squares are scored by 2; and <4 squares are scored by 1.
Traffic density based on accessibility level (TA) **Purposive survey by each road classification(TA) is defined as the traffic density for each class of roads, which is: collector road, local road, neighborhood road, and footpath. TA referred to the accumulation of pedestrians and motorcycle rider unit passes per minute. TA was identified through field survey on each road class. This survey is divided into four time sessions: morning, noon, afternoon, and evening. For each weekday and weekend category. Average result counts unit per minute for each road class, in weekday and weekend.
Population density for Each neighborhood (Kp) **Purposive data by each neighborhood(Kp) are people density, which is calculated as total population divided by the large area of each neighborhood in Sumbersari Village. The denser population would provide more potential consumers for microbusinesses and local franchises. Furthermore, population density was classified into 4 levels spanning from 1 (the lowest)–4 (the highest)
Criteria of business (Bs-b) ***Entered data by LOLAKU on “Data Form” features by respondents(Bs-b) conducted by respondents specific criteria, which are: (1) business brand; (2) stall size; (3) business type; (4) supplier criteria; (5) marketing segmentation; and (6) estimated rental cost expected. Rent fee and stall area are scored relatively by respondents’ request. Scoring counts 4 for the most fitted ones and lessens for unfitted ones.
*, Location based data; **, purposive classified data, and *** interview-based data.
Table 2. Index score and strategic location classifications.
Index ScoreClassIndication
−6 to 0Not strategicLocation is highly not recommended for the business location. The negative factors are more affected than the positive ones. This location indicates a high business competition with high failure potential.
1 to 5Less strategicLocation is not recommended for business location. The positive factor is still less affected than the negative ones. This location indicates a high business competition with failure potential.
6 to 10StrategicLocation is recommended for business location. The positive factors are higher than the negative ones with less business competition and failure potential.
11 to 15Very strategicLocation is highly recommended for business location. There are minimum negative factors and the highest amount of positive ones. There is almost no business competition or failure potential.
Table 3. Respondents criteria data by interview and entered via LOLAKU.
CriteriaRespondents Business Criteria
Business Name(enter by respondents)
Kind of BusinessCulinary
Market segmentationPedestrian, motorcycle rider—students
Stall Area2 m × 3 m (6 m2)
Suplier criteriaSolo supplier
Range of stall rent feeIDR 1,200,000 to 2,000,000 monthly fees
Table 4. Population density for each neighborhood.
Neighborhood (RW *)Large Area (km2)Total PopulationPopulation Density (Person/km2) Score   ( N F K p )
RW 10.107075512484
RW 20.323362390121
RW 30.085845513604
RW 40.207304200101
RW 50.076671136181
RW 60.22131519591
RW 70.283018342121
* RW: Rukun Warga, which is a neighborhood in Indonesian.
Table 5. Traffic density data based on the road classes.
Weekday (Unit/Menit)Weekend (Unit/Menit)
SessionRoad ClassCountSessionRoad ClassCount
MorningCollector42MorningCollector33
Neighborhood22Neighborhood12
Local34Local31
Footpath6Footpath3
NoonCollector51NoonCollector36
Neighborhood24Neighborhood18
Local37Local30
Footpath3Footpath2
AfternoonCollector44AfternoonCollector30
Neighborhood25Neighborhood16
Local45Local33
Footpath4Footpath1
EveningCollector38EveningCollector36
Neighborhood18Neighborhood18
Local35Local34
Footpath5Footpath4
Table 6. Daily traffic density calculation based on the road classes.
SessionRoad ClassCountSessionRoad ClassCount
Weekday (unit/min)Collector43.8Weekend (unit/min)Collector33.8
Neighborhood22.3Neighborhood16.0
Local37.8Local32.0
Footpath4.5Footpath2.5
Average27.1Average21.1
Table 7. Rent fee and stall size scoring.
Monthly Rent Fee (per m2)ScoreStall Area
1,200,000 to 2,000,00046 m2
>2,000,000 to 2,800,00035 m2
>2,800,000 to 3,600,00024 m2
>3,600,0001<4 m2
Table 8. Listed rental point on Strategic Selling Location Map.
Rental PointCoordinate XCoordinate YLocation CategoryIndex Score
Point 1112°36′57,742″ E7°57′52,833″ SNot strategic−6 to 0
Point 2112°36′49,007″ E7°57′42,158″ SLess strategic1 to 5
Point 3112°36′48,663″ E7°57′39,513″ SLess strategic1 to 5
Point 4112°36′37,759″ E7°57′13,838″ SLess strategic1 to 5
Point 5112°36′37,933″ E7°57′14,338″ SLess strategic1 to 5
Point 6 *112°36′44,571″ E7°57′25,556″ SStrategic6 to 10
Point 7112°36′39,901″ E7°57′28,749″ SLess strategic1 to 5
Point 8112°36′40,632″ E7°57′28,777″ SLess strategic1 to 5
Point 9112°36′37,116″ E7°57′28,496″ SStrategic6 to 10
Point 10112°36′33,593″ E7°57′29,020″ SNot strategic−6 to 0
Point 11112°36′33,612″ E7°57′28,142″ SNot strategic−6 to 0
Point 12112°36′33,570″ E7°57′29,532″ SNot strategic−6 to 0
Point 13112°36′32,860″ E7°57′29,135″ SNot strategic−6 to 0
Point 14112°36′32,296″ E7°57′28,017″ SNot strategic−6 to 0
Point 15112°36′32,461″ E7°57′28,814″ SNot strategic−6 to 0
Point 16112°36′25,119″ E7°57′27,133″ SNot strategic−6 to 0
Point 17112°36′27,324″ E7°57′27,379″ SNot strategic−6 to 0
Point 18112°36′49,486″ E7°57′33,624″ SNot strategic−6 to 0
Point 19112°36′51,905″ E7°57′50,245″ SNot strategic−6 to 0
Point 20112°36′54,582″ E7°57′36,350″ SNot strategic−6 to 0
Point 21112°36′49,114″ E7°57′48,281″ SStrategic6 to 10
* The most recommended location that could meet the partners’ needs.
Publisher’s Note: MDPI stays neutral with regard to jurisdictional claims in published maps and institutional affiliations.

