
India–Republic of Korea CEPA: Assessment and Future Path

1
School of Management, Mahindra University, Hyderabad 500100, India
2
Institute of Indian Studies, Hankuk University of Foreign Studies, Seoul 02450, Korea
*
Author to whom correspondence should be addressed.
Economies 2022, 10(5), 104; https://0-doi-org.brum.beds.ac.uk/10.3390/economies10050104
Submission received: 2 February 2022
/
Revised: 22 April 2022
/
Accepted: 24 April 2022
/
Published: 28 April 2022
Abstract
:India and the Republic of Korea (ROK) are on the path to forging deeper economic cooperation. Both countries signed a Comprehensive Economic Partnership in 2009, which was in effect in 2010, and agreed to reduce and/or eliminate tariffs on goods. In this paper, we examine the sectors—both merchandise goods and services—where India and the ROK have a comparative advantage. We analyze the tariffs and non-tariff measures in the context of India–ROK trade and the gains from trade that can result from a reduction in tariff barriers. Our results suggest that India has a comparative advantage in services and the ROK in merchandise goods. Therefore, future negotiations must focus on India offering market access to the ROK’s merchandise goods and the ROK providing access to India’s services.
Keywords:
India; Korea; CEPA; market comparative advantage; Grubel–Lloyd index; non-tariff measures; servicesJEL Classification:
F10; F13; F151. Introduction
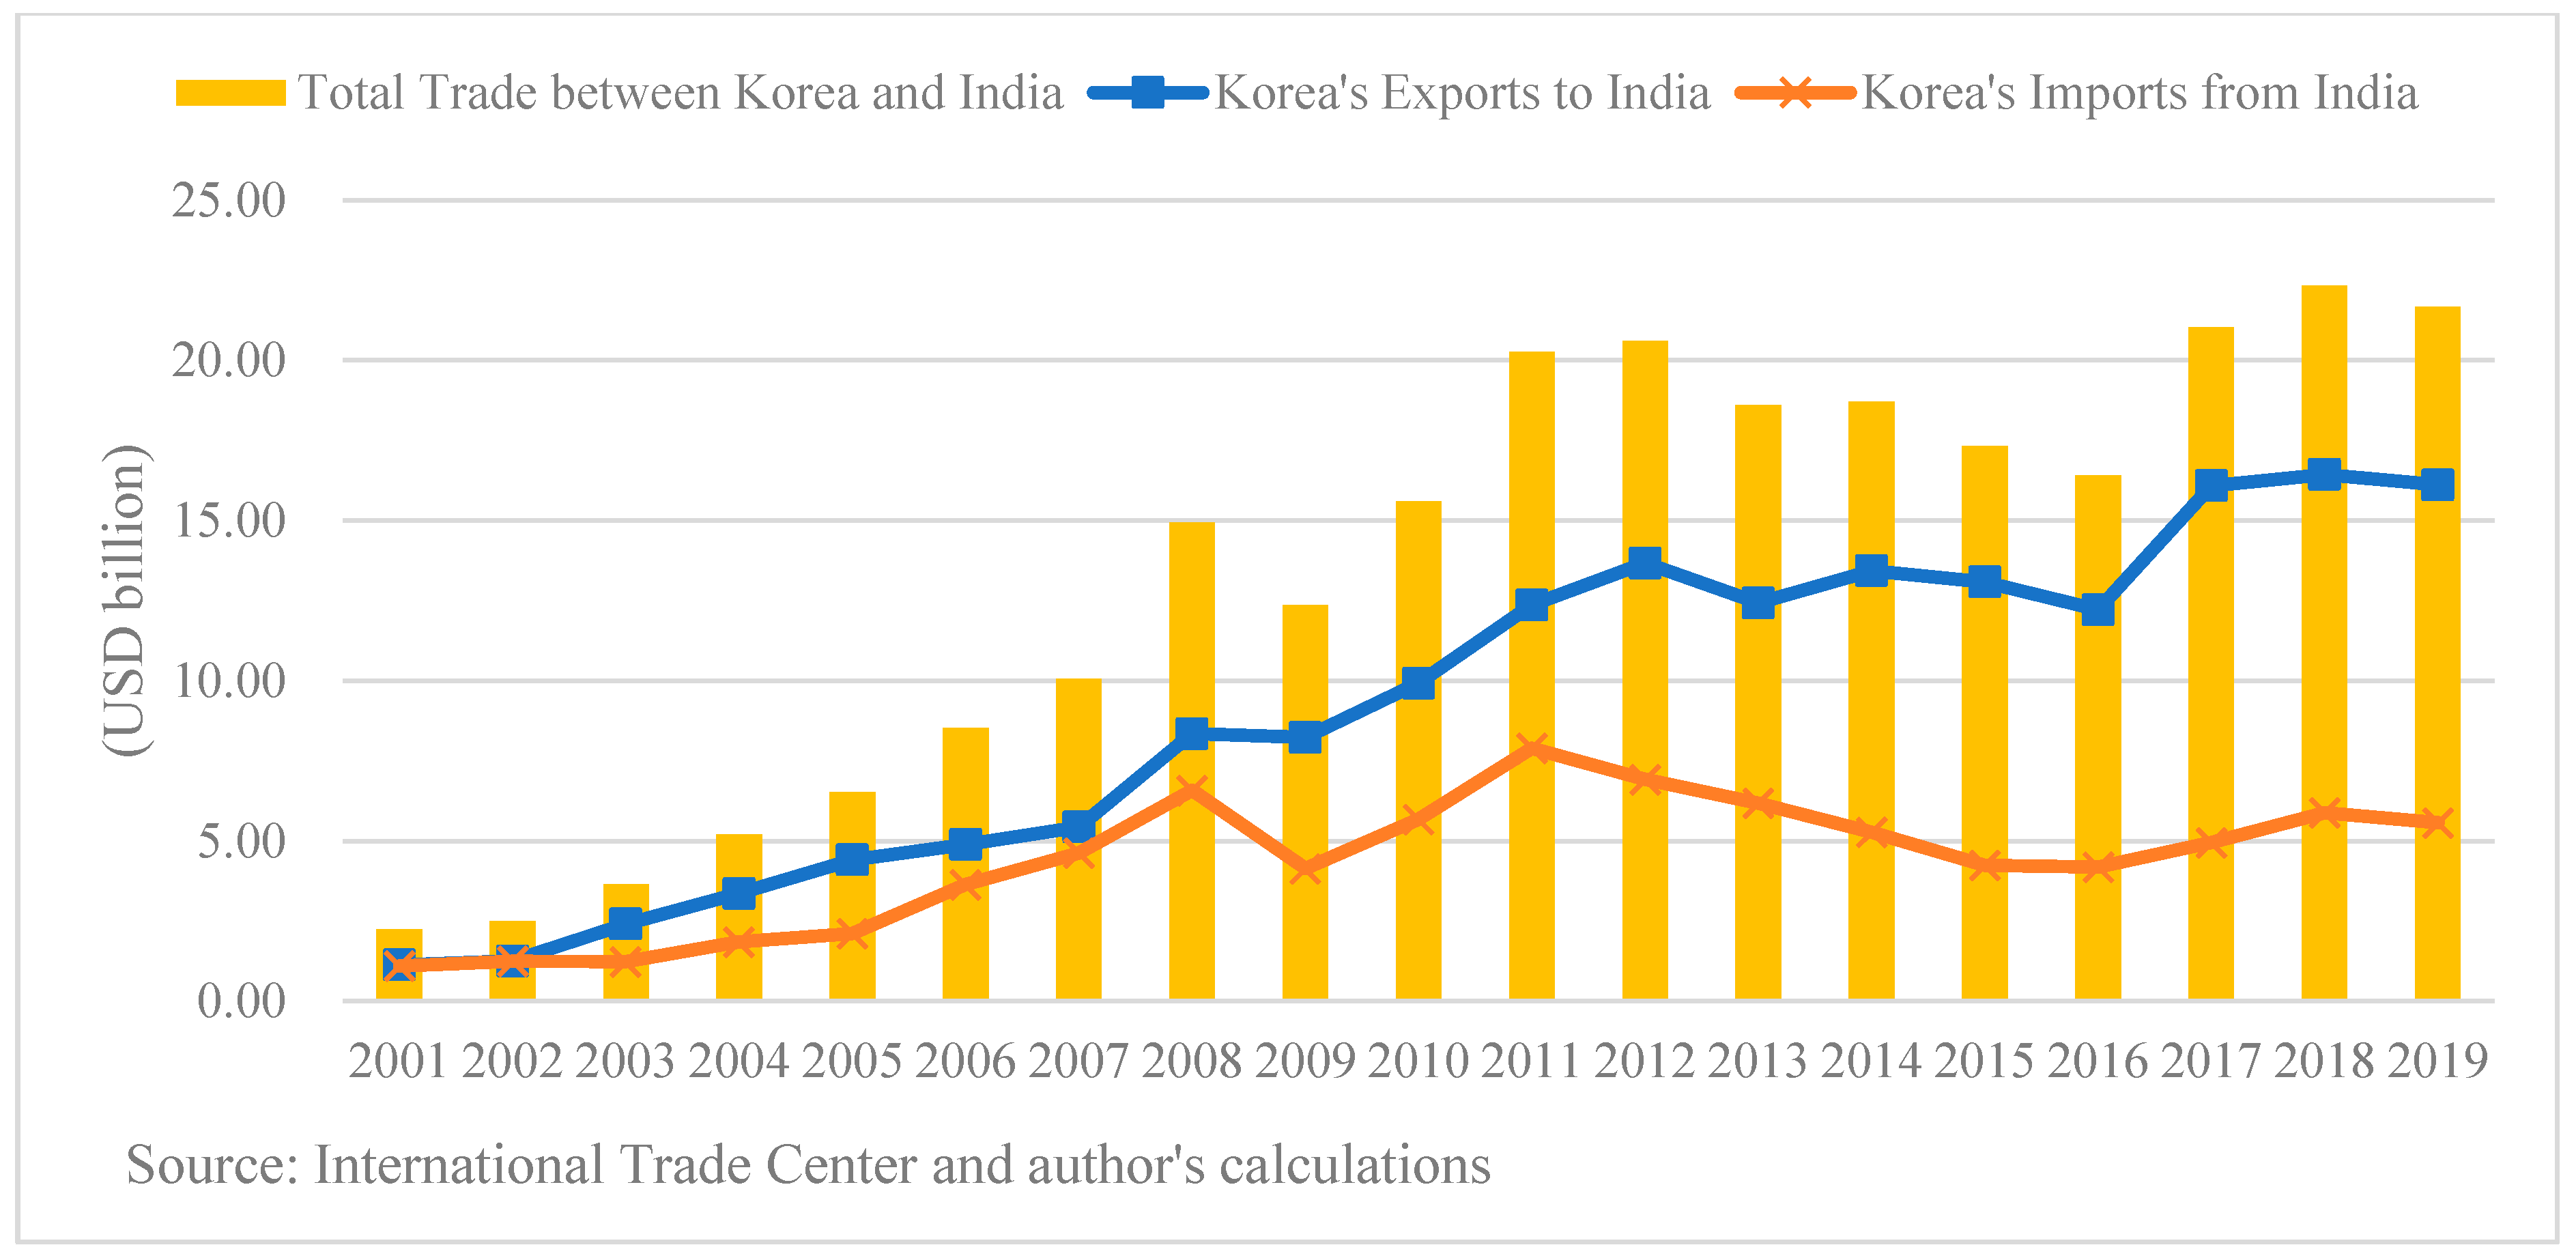
India and the Republic of Korea (ROK) are on the path to forging deeper economic cooperation. Both countries signed a Comprehensive Economic Cooperation (CEPA) in 2009, which came into effect in 2010, and agreed to reduce and/or eliminate tariffs on goods—on 93% of India’s exports (number of items) to ROK and 85% of ROK’s exports to India. The CEPA gathered momentum with the visit of India’s prime minister, Narendra Modi, during 18–19 May 2015. Hastening trade in areas related to energy, electronics, and shipbuilding was emphasized (GOI 2021). The CEPA was further strengthened with the visit of the ROK’s president, Moon, during 10–12 July 2018. For the ROK’s “New Southern Policy”, India is cited as the main partner. Similarly, the ROK features as a prominent partner in India’s “Look East Policy”. The trade between India and the ROK crossed USD 20 billion for the first time, reaching USD 21.5 billion in 2018. In 2019, this figure was USD 20.6 billion. At an official level, both these countries have targeted achieving USD 30 billion in bilateral trade by 2030 (GOI 2021).
However, India has sought to review its existing CEPA partnership agreement with the ROK because of its growing trade deficit with the ROK, which totaled USD 10 billion in 2019. Achieving a bilateral trade of USD 30 billion entails going beyond merchandise trade and including areas such as trade in services, investments, intellectual property, competition, mutual recognition of standards, and technological cooperation.
In this paper, we illustrate that India’s trade deficit emanates from trade in merchandise items, with the ROK exporting high-value products such as electronics and automobiles to India, while importing low-value items such as metals, minerals, agriculture, fisheries, and textiles from India. Countering this trade deficit in merchandise items necessitates including services trade under the ambit of negotiations. India has a comparative advantage in services, which can outweigh its deficit in merchandise products. In this context, examining merchandise products and services components where India and the ROK have comparative advantages is important. Therefore, we compute and analyze a comparative advantage measure, such as the Market Comparative Advantage (MCA) relevant to merchandise as well as services trade. As intra-industry trade may also grow, we compute the Grubel–Lloyd index (GLI) for merchandise items. In addition, we identify the tariffs and non-tariff measures (NTMs) impacting the India–ROK merchandise trade and compute the gains from trade at zero tariffs. This aspect of gains from trade has not been investigated in previous studies. Additionally, no study has examined the competitiveness of the services sector and its constituent elements for these two countries. These aspects, which can form an important basis for future negotiations, are covered in this study. The research question that we address is to identify the sectors where India and the ROK have comparative advantages and how giving each other market access in sectors of comparative advantages may lead to an overall increase in trade. Our results indicate that the ROK has a comparative advantage in tradable items, whereas India has a comparative advantage in services. The provision of market access to services and merchandise products by the ROK and India, respectively, will be crucial for the fulfillment of the bilateral trade target of USD 30 billion by 2030. We complement the extant literature by introducing issues related to the services trade and areas where India and the ROK can negotiate.
This paper is organized as follows. The literature review is covered in the context of India–ROK trade in Section 2, and in Section 3, we present the theoretical framework and the data. In Section 4, we estimate the comparative advantage and examine its dynamics with respect to the merchandise trade and services for both countries. In Section 5, we examine the services trade, while in Section 6, we discuss the results and link them with the trade policy concerning tariffs and NTMs, and gains from trade resulting from tariff reductions. The last section concludes the paper with policy suggestions.
2. Literature Review
The literature on India–ROK trade is limited. Few studies have identified tradable items that are likely to gain from the implementation of the CEPA. Ahmed (2011) points out that with a decrease in tariff rates, India’s merchandise export items that are likely to gain are light oils and preparations (HS Code 271011); maize (corn) other than seed (HS Code 100590); cashew nuts, shelled (HS Code 80132); smoking tobacco, whether or not containing tobacco substitutes in any proportion (HS Code 240310); machinery for liquefying air/other gases, whether or not electrically heated (HS Code 841960); and tobacco partly or wholly stemmed or stripped (HS Code 240120).1 Similarly, the merchandise items from the ROK that are likely to gain are vehicles principally designed for the transport of persons (HS Code 870332); a line pipe of the kind used for oil or gas pipelines, having internal and external circular cross-sections (HS Code 730512); other parts and accessories for motor vehicles (HS Code 870110); flat-rolled products of iron or non-alloy steel (HS Code 720836); newsprint, in rolls or sheets (HS Code 480100); and unbalance motors, rubber buffers, coil springs, leaf springs, crankshaft drive, and fuses (HS Code 847989). In a more recent study, Cho et al. (2018) calculated the ROK’s competitiveness in exports to India by calculating the RCA and MCA, along with conducting interviews and surveys with more than 300 Korean companies in India. According to the results, vehicles (HS Code 87) from the ROK have lost competitiveness in India because of the increased local sourcing. In addition, the ROK’s electrical machinery (HS Code 85) and machinery and mechanical appliances (HS Code 84) also experienced a decline in competitiveness in the Indian market because Chinese goods gained competitiveness. The India–Japan CEPA also caused a decrease in the competitiveness of Korean products such as plastics and articles thereof (HS Code 39). Cho and Choi (2019) investigated the utilization rate and rules of origin of the India–ROK CEPA2 and argued that restrictive rules of origin discouraged the use of the CEPA.
The overall trend suggests that the ROK, an industrially advanced economy, has been supplying electrical machinery and equipment (HS Code 85), iron and steel (HS Code 72), and mechanical items (HS Code 84) to India. By contrast, India has been exporting items such as organic chemicals (HS Code 29), refined petroleum (HS Code 27), rubber (HS Code 40), paper and paperboard (HS Code 48), and rubber articles, which are mostly low-value-added input items. The overall trend suggests that merchandise items traded between India and the ROK are more a case of inter-industry trade than intra-industry trade—something related to vertical and horizontal supply chain networks. We find evidence of intra-industry3 trade with respect to electrical machinery (HS Code 85), iron and steel (HS Code 72), vehicles (HS Code 84), and mineral fuels (HS Code 27). After the CEPA, machinery enjoyed an increase in the trade specialization index (TSI). Similarly, Cho (2012) studied changes in the ROK’s TSI with India after the CEPA became effective and found that machinery, agriculture and fisheries products, mining, textiles, and dairy experienced an increase in the TSI, whereas electrical goods, metals, chemicals, and plastics/rubber/leather experienced a decrease in the TSI. However, given the short study period, these studies have limitations in reflecting the impact of the CEPA.
Nevertheless, trade between India and the ROK has continued to increase, with a spillover effect on national income. Trade encourages resource allocation from low- to high-productivity sectors, thereby increasing overall productivity (Feder 1983). By opening access to newer markets, trade not only provides an opportunity for domestic firms to use unutilized resources but also makes them more efficient because of the expansion in the production capacity leading to economies of scale (Chuang 1998). The CEPA has facilitated the purchase of capital goods and technology transfers from the industrially advanced ROK. Lee (2019) analyzed the effect of the India–ROK CEPA, focusing on trade creation and trade diversion using bilateral trade data from 2001 to 2018, and found that the India–ROK CEPA encouraged trade creation in the automobile, machinery, and services sectors. Table 1 illustrates that the ROK enjoys a trade surplus with India. However, the opposite is true for services trade—compared to merchandise items, India has a better position in the export of services. India is among the top 10 services-exporting countries in the world (World Bank 2020). The services sector has achieved the fastest growing global trade (Sauve and Mattoo 2003). For India, the contribution of services in its total trade increased from 20% in 1995 to 26% in 2019. Since 1998, India has enjoyed a surplus in services trade every year except for 2001. The inclusion of services trade and increasing its coverage in the India–ROK CEPA will enable India to reduce its bilateral trade deficit and help sustain the CEPA. We examine the constituent elements of services that can facilitate India and the ROK to benefit from the CEPA.
This is important as the CEPA, in addition to trade in goods, includes services, investment, government procurement, and other issues such as intellectual property rights and the mutual recognition of standards. Considering the overall services export data between 1980 and 2007, India has a comparative advantage in commercial services, excluding traditional services such as transportation and travel, as Burange et al. (2010) show in their research. Among commercial services, India has a comparative advantage in computer and information services. Using more sophisticated econometric methods covering the same period, Pailwar and Shah (2009) found similar results. In addition, Dash and Parida (2013) argued that India’s overall growth was attributed to global service exports, considering the period between 1996 and 2010. Nath and Goswami (2018) examined the export performance of 10 disaggregated service items between 2000 and 2013 and found that India has a comparative advantage in terms of travel, communication, and personal and cultural services over the rest of the world However, India’s comparative advantage in communication services in the world has lost.
3. Trade Relations between India and the ROK
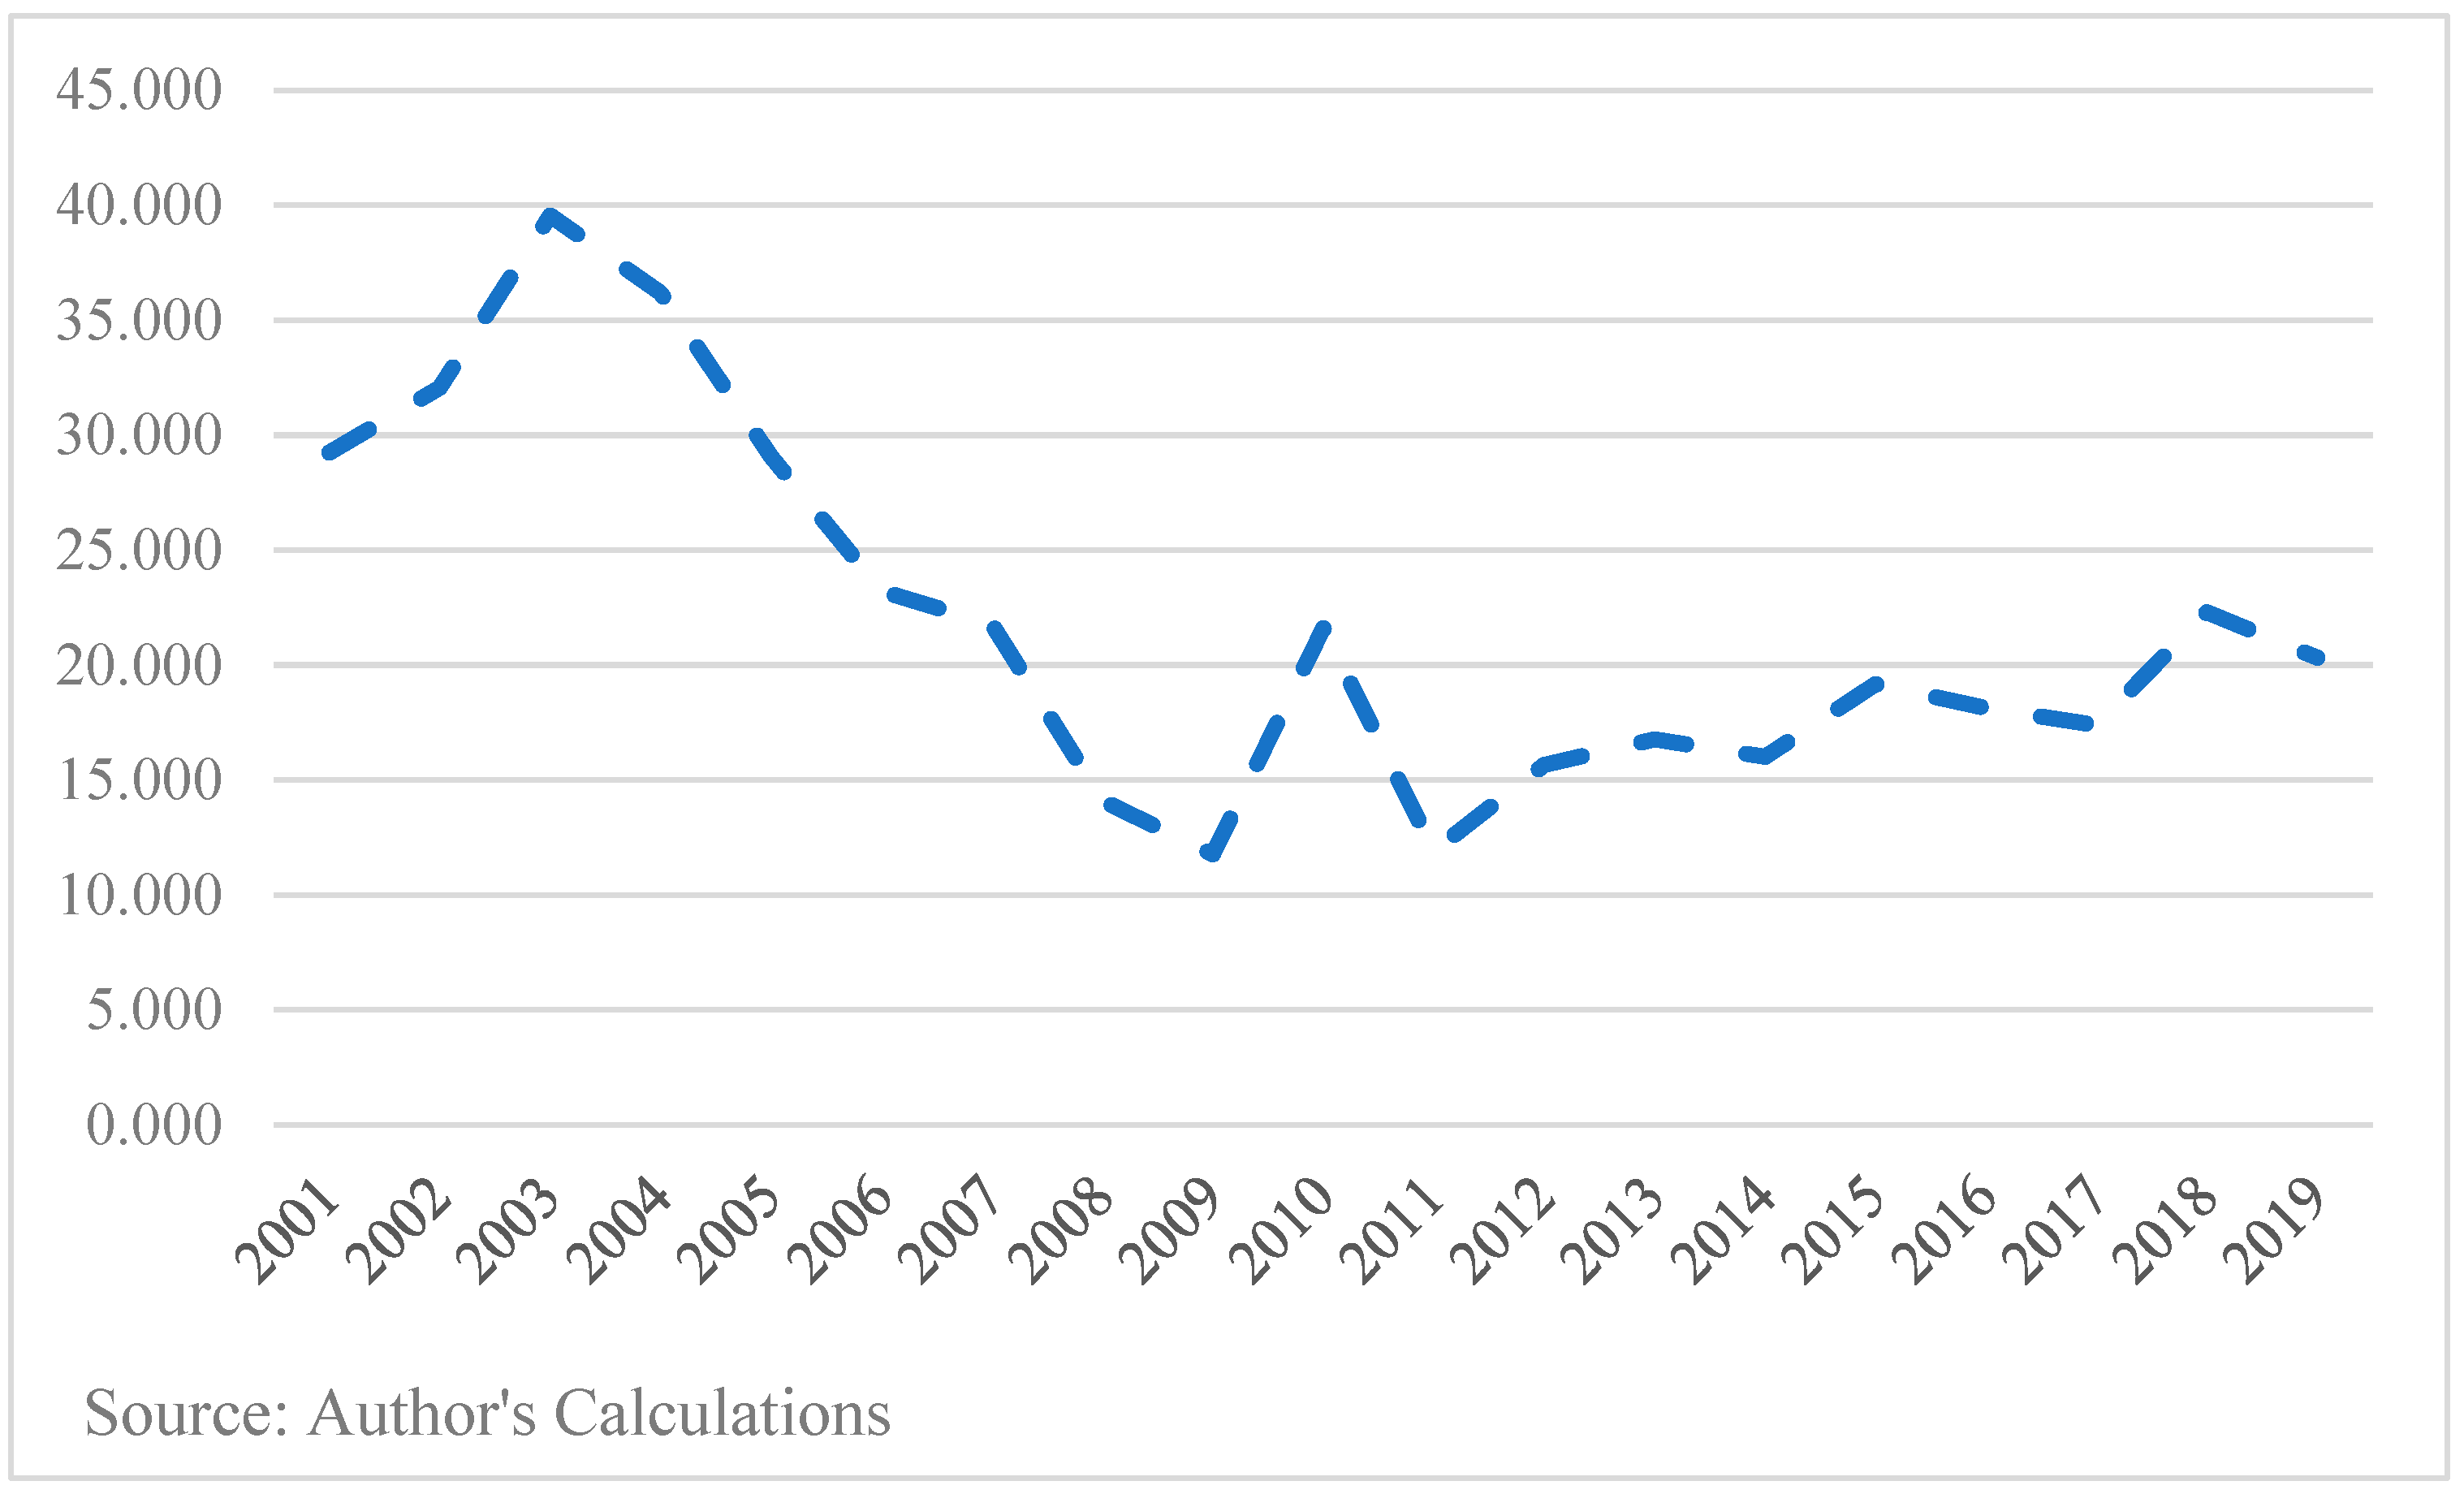
The ROK’s exports to India expanded from USD 1.1 billion in 2001 to USD 16.1 billion in 2019, with the ROK’s share in India’s total imports increasing from 0.8% to 3% during the same period. However, India’s exports to the ROK did not increase significantly, resulting in a trade deficit. In 2001, India’s exports to the ROK were USD 457 million, increasing to USD 4.6 billion in 2019. As of 2019, the ROK was the seventh largest importing country for India, although not a major export destination for the country. The contribution of India’s exports in the ROK’s total imports increased from 1.0% to only 1.4% between 2001 and 2019 (Table 1). This led to an increase in India’s trade deficit with the ROK from USD 679 million in 2001 to USD 11,457.3 million in 2019. A few other trends are noteworthy. First, the growth of the ROK’s merchandise exports to India increased rapidly between 2002 and 2012. This was when India signed various regional trade agreements (RTAs), thereby reducing tariffs. Between 2006 and 2010, India signed six different RTAs: (1) South Asian Free Trade Area (SAFTA), 2006; (2) India–Bhutan Trade Agreement (2006); (3) India–Chile Preferential Trade Agreement (2007); (4) India–MERCOSUR Preferential Trade Agreement (2009); (5) India–ASEAN FTA (2010); and (6) India–ROK CEPA (2010). However, this led to an overall increase in India’s trade deficit. The current account deficit as a percentage of gross domestic product increased from 0.70% in 2003 to 6.72% in 2012 (World Bank 2020). This prompted policymakers in India to adopt an “inward” looking policy by increasing tariffs on electronics, mechanical, and electrical items. Simple average tariffs for India have increased from 8.9% to 11.1% between the period from 2010–2011 to 2020–2021 and the proportion tariff lines exceeding the 15% also increased from 11.9% to 25.4% during the same period (Shukla 2021)4. To reduce the dependence on imports, the GOI has launched various policies such as the “National Manufacturing Policy” in 2011, “Make-in-India” in 2014, and “Atmanirbhar Bharat Abhiyan” in 2020.5 All these macro-level policies undertaken by the GOI reduced the growth of the ROK’s exports to India, as illustrated in Table 1. Figure 1 depicts the trade imbalance of merchandise goods between India and the ROK.
Table 2 lists the top nine trading items between India and the ROK in 20196. During 2019, the ROK’s main exporting items to India were capital goods, such as electrical machinery and equipment (HS Code 85); iron and steel (HS Code 72); and machinery, mechanical appliances, nuclear reactors, and boilers (HS Code 84). By contrast, India’s main exporting commodities to the ROK included raw materials, such as aluminum (HS Code 76) and organic chemicals (HS Code 29), and low-value-added products, such as cotton (HS Code 52) and ores, slag, and ash (HS Code 26).
The situation of trade in services7 differs from that observed for trade in goods. As shown in Table 3, India’s service exports to the ROK have been greater than the latter’s service exports to India. The ROK’s exports of commercial services to India expanded from USD 1179 million in 2005 to USD 2271 million in 2019, with the share of India in the ROK’s commercial services exports increasing from 1.52% to 2.24%. India’s exports of commercial services to the ROK expanded from USD 948 million to USD 3965 million during the same time. However, the share of the ROK in India’s commercial service exports was 1.83% in 2005 and remained stagnant at 1.86% in 2019.
The above data imply that India has a comparative edge in the service sector over the ROK. Thus, boosting trade in services between the ROK and India can enhance the two countries’ economic relations, with India offering market access to the ROK’s merchandise goods in return for accessing the services sector in the ROK’s market. Figure 2 depicts the trade imbalance related to commercial service trade between ROK and India.
4. Identifying Comparative Advantage between the ROK and India
To determine each country’s export competitiveness, we employed two measurements: MCA. Both are derived from the Revealed Comparative Advantage by Balassa (1965) to analyze a country’s comparative advantage in the world market. As we consider specific markets, India and the ROK, we apply extensions of the RCA, that is, MCA. In recent times there are other measures of RCA, namely additive RCA and implied RCA, which are used to compute comparative advantage (Danna-Buitrago and Stellian 2021). However, to ensure that our results can be compared with the earlier studies undertaken on India–ROK trade, we used MCA. In addition, Grubel–Lloyd index is also calculated to examine intra-industry level between ROK and India.
For the analysis, we considered six different merchandise items: electrical machinery (HS Code 85), iron and steel (HS Code 72), machinery and mechanical appliances (HS Code 84), plastics and articles thereof (HS Code 39), organic chemicals (HS Code 29), and vehicles other than railway or tramway rolling stock and parts and accessories (HS Code 87) from ROK to India, while aluminum and articles (HS Code 76), mineral fuels, mineral oils, and products of their distillation (HS Code 27), organic chemicals (HS Code 29), iron and steel (HS Code 72), machinery and mechanical appliances (HS Code 84), and cotton (HS Code 52) from India to ROK.8 Trade data are based on HS Codes (at a two-digit level of HS classification) from 2001 to 2019, acquired from the International Trade Centre.9 Services trade data are sourced from the World Trade Organization (WTO) and cover the period from 2005 to 2019, years for which data are available.
4.1. Theoretical Framework
Country k’s RCA of product c in the world market is as below:
where refers to k country’s total exports of product c, refers to k country exports to the world, is the total exports of product c in the world, and WX is the total exports in the world. The RCA is the ratio of the share of country k in the world’s exports of commodity c to that of country k in the world’s exports. RCA with greater than one indicates a country’s comparative advantage, and vice versa.
The MCA is similar to the concept of RCA measuring comparative advantage in the global market; however, MCA captures that in a distinct country10. Export competitiveness can be different depending on market size and it is necessary to revise RCA to show comparative advantage in a specific country (Kim et al. 1997; Kim 2009).
Country k’s MCA of product c in country i is as follows:
where is k country’s exports of product c to i country, is k country’s exports to i country, is i country’s imports of product c from the world, and is country i’s imports from the world11. k country’s MCA of product c in i country is calculated as the proportion of the share of commodity c in country k’s exports to i and the share of commodity c in country i’s imports from the world. If country k’s commodity c has a comparative advantage in country i, the MCA is greater than one, and vice versa.
Additionally, following Grubel and Lloyd (1975), we calculate the GLI for evaluating the trade overlap for industry between two countries as follows:
We perform the analysis at the 2-digit level of HS classification. GLI has the value between zero to one. If GLI is one, two countries are engaged in intra-industry trade, while if GLI is zero, there is no intra-industry trade. Based on GLI, we can draw policy suggestions to strengthen the relations between India and ROK.
4.2. MCA Results and Analysis
In this subsection, we analyze how the comparative advantage of the important tradable items between India and the ROK changed between 2001 and 2019. The detailed results are presented in Appendix A12.
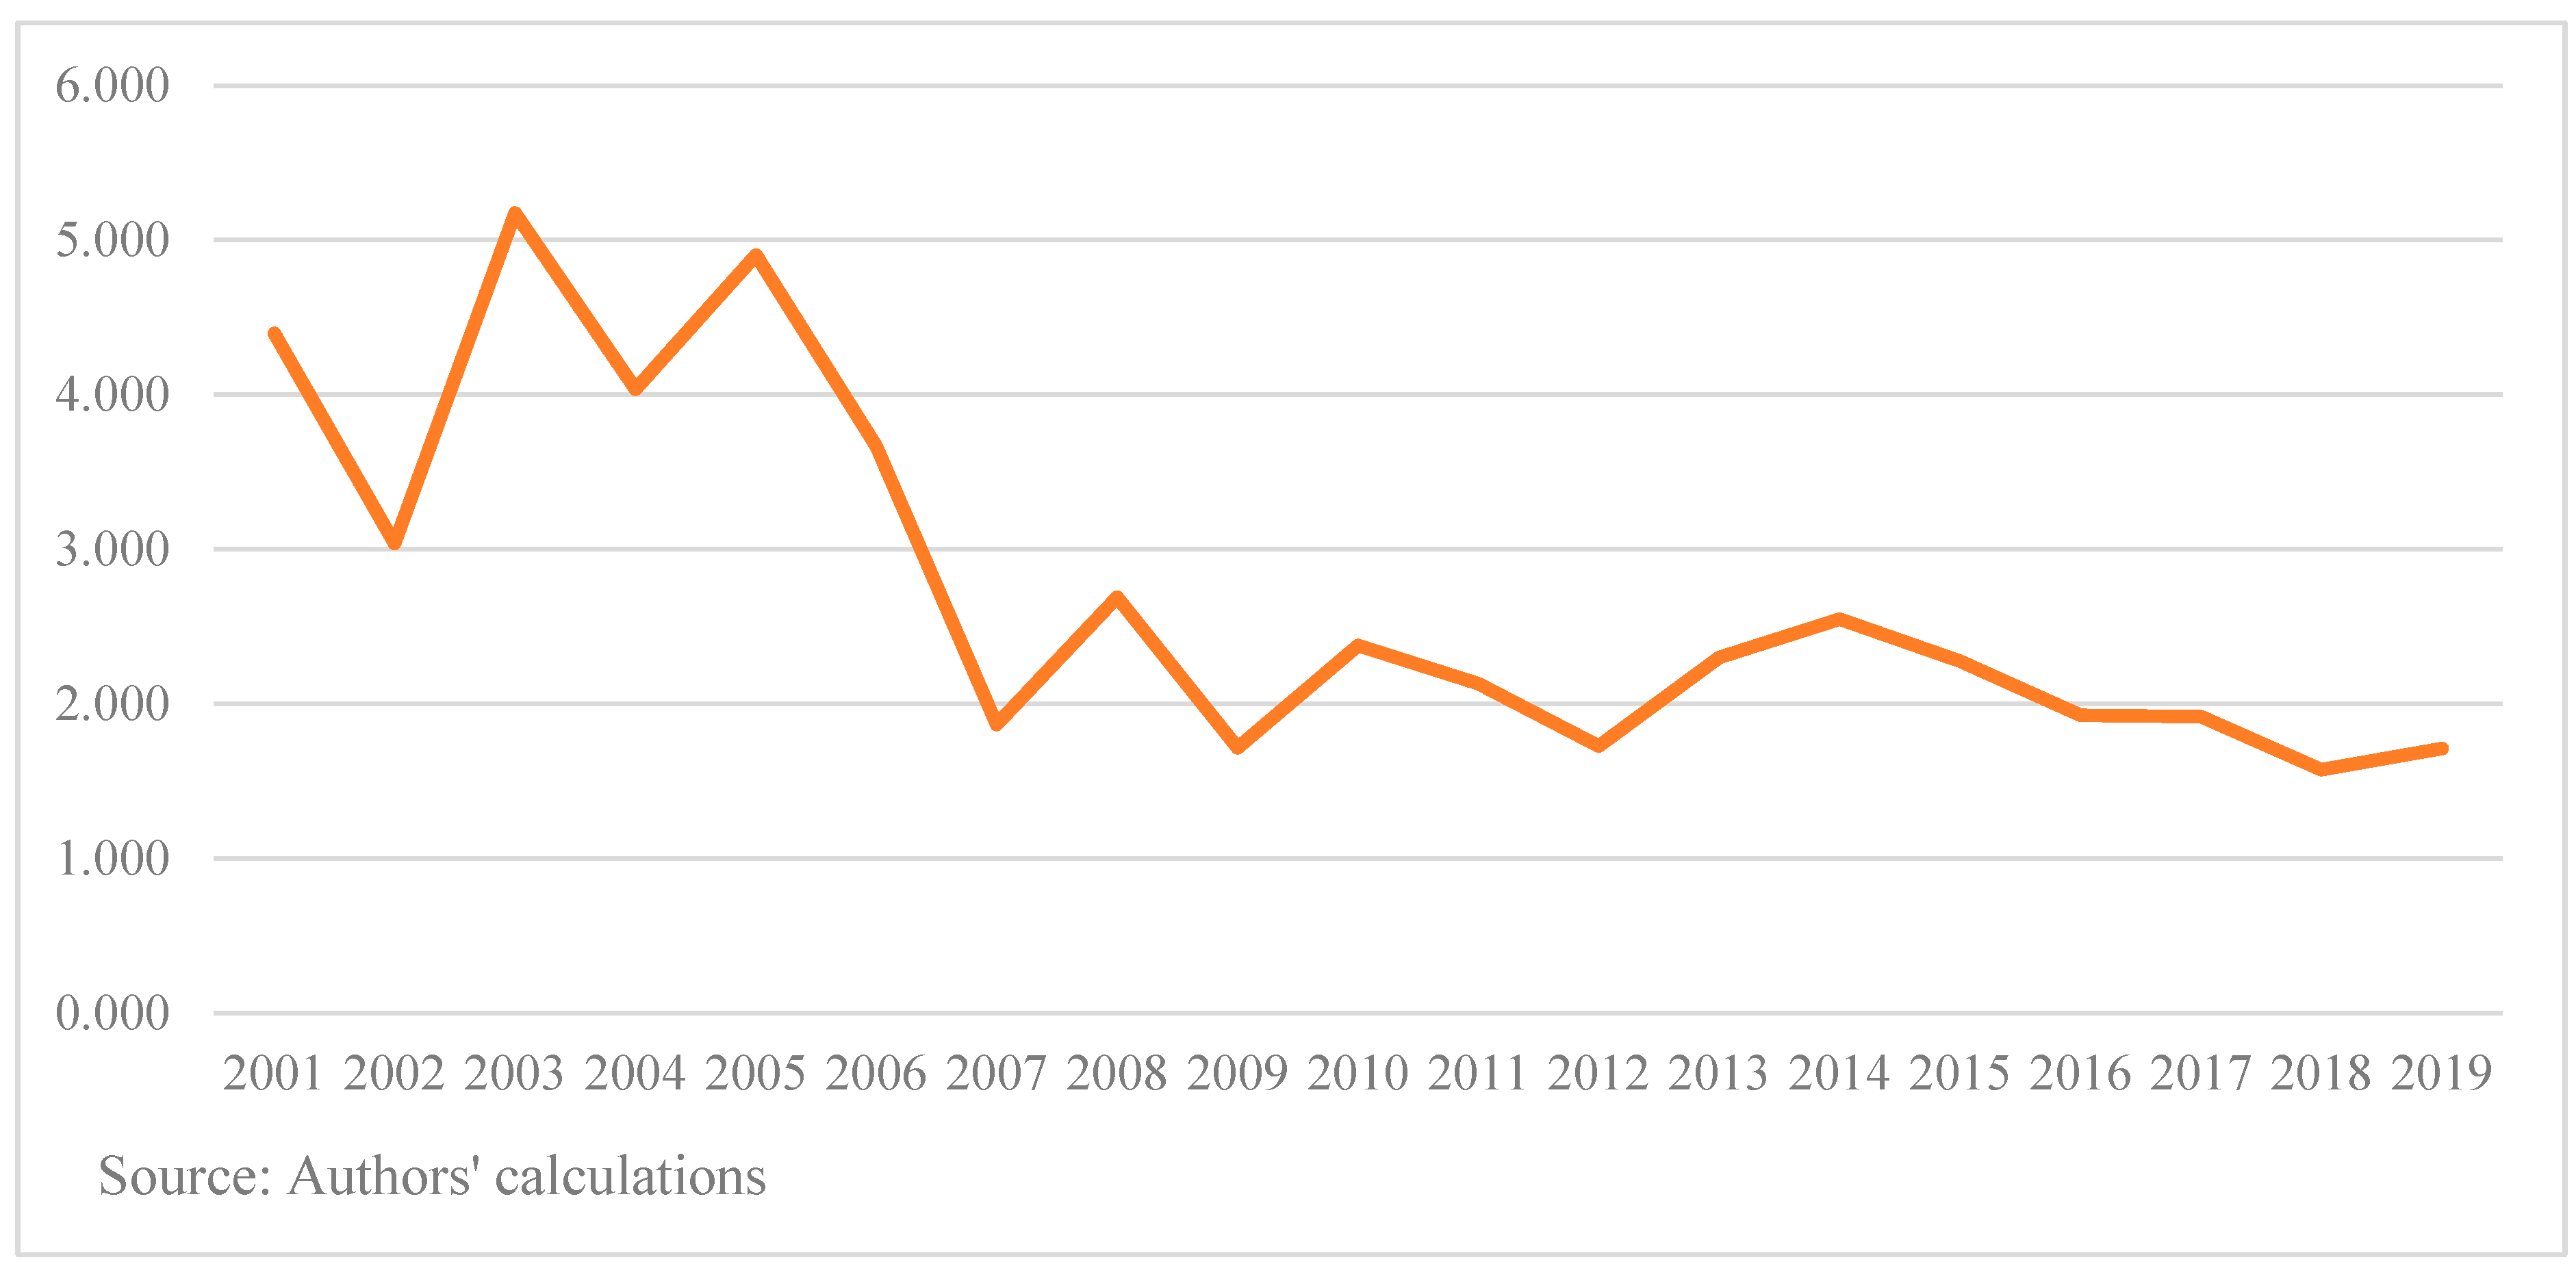
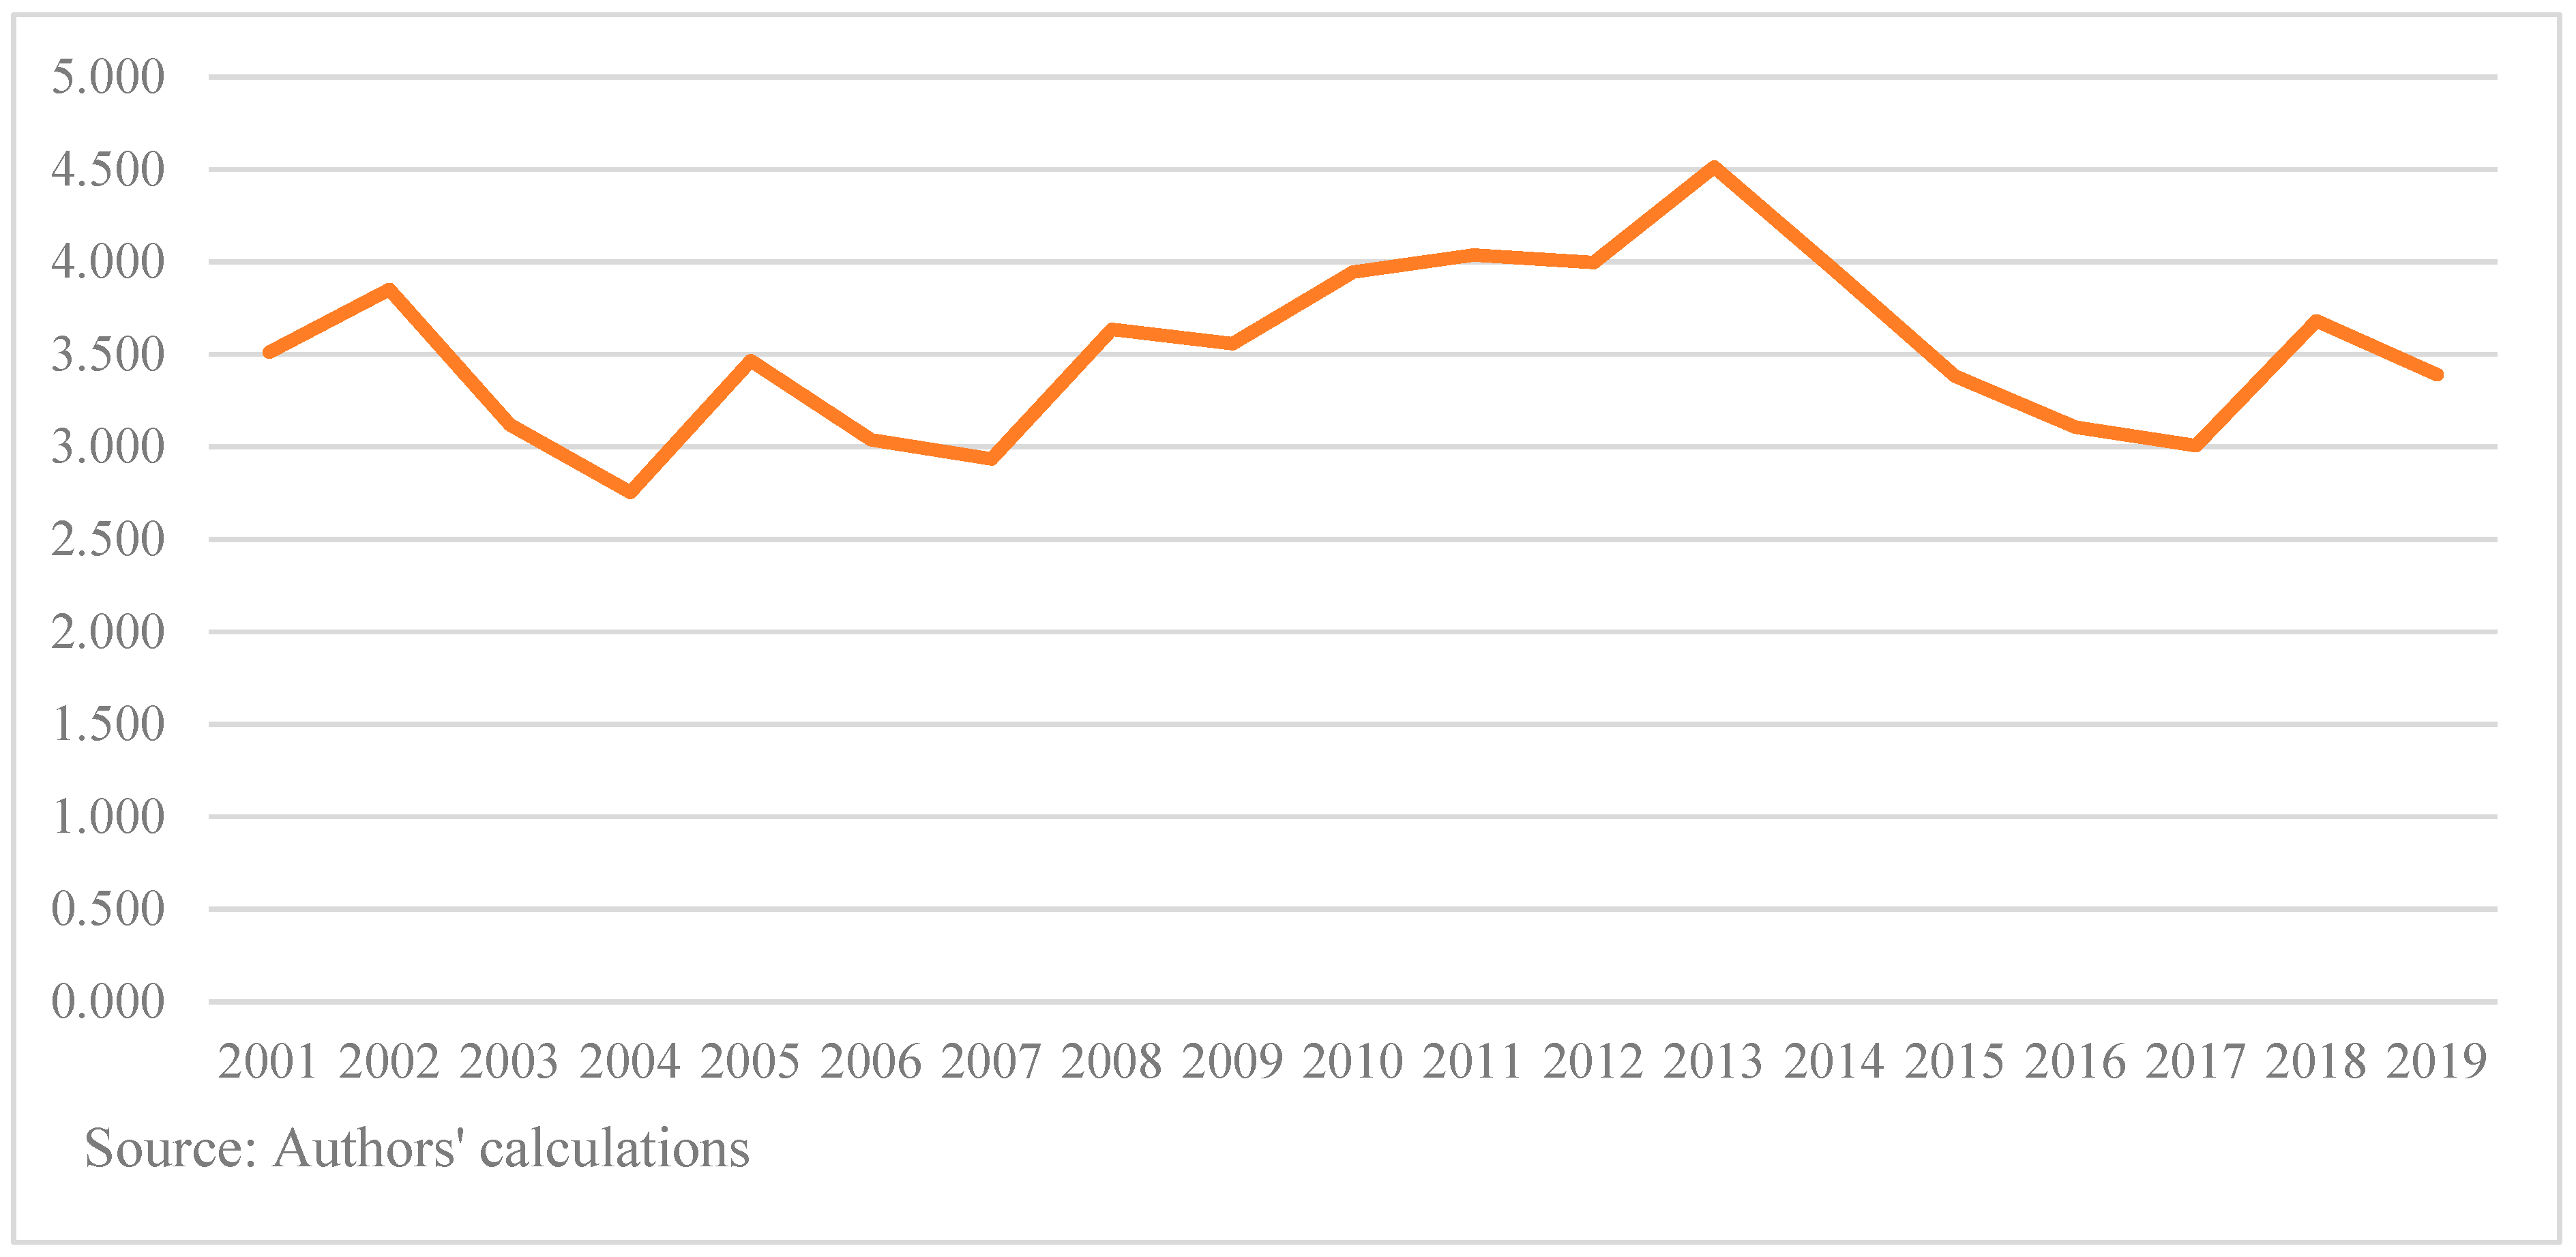
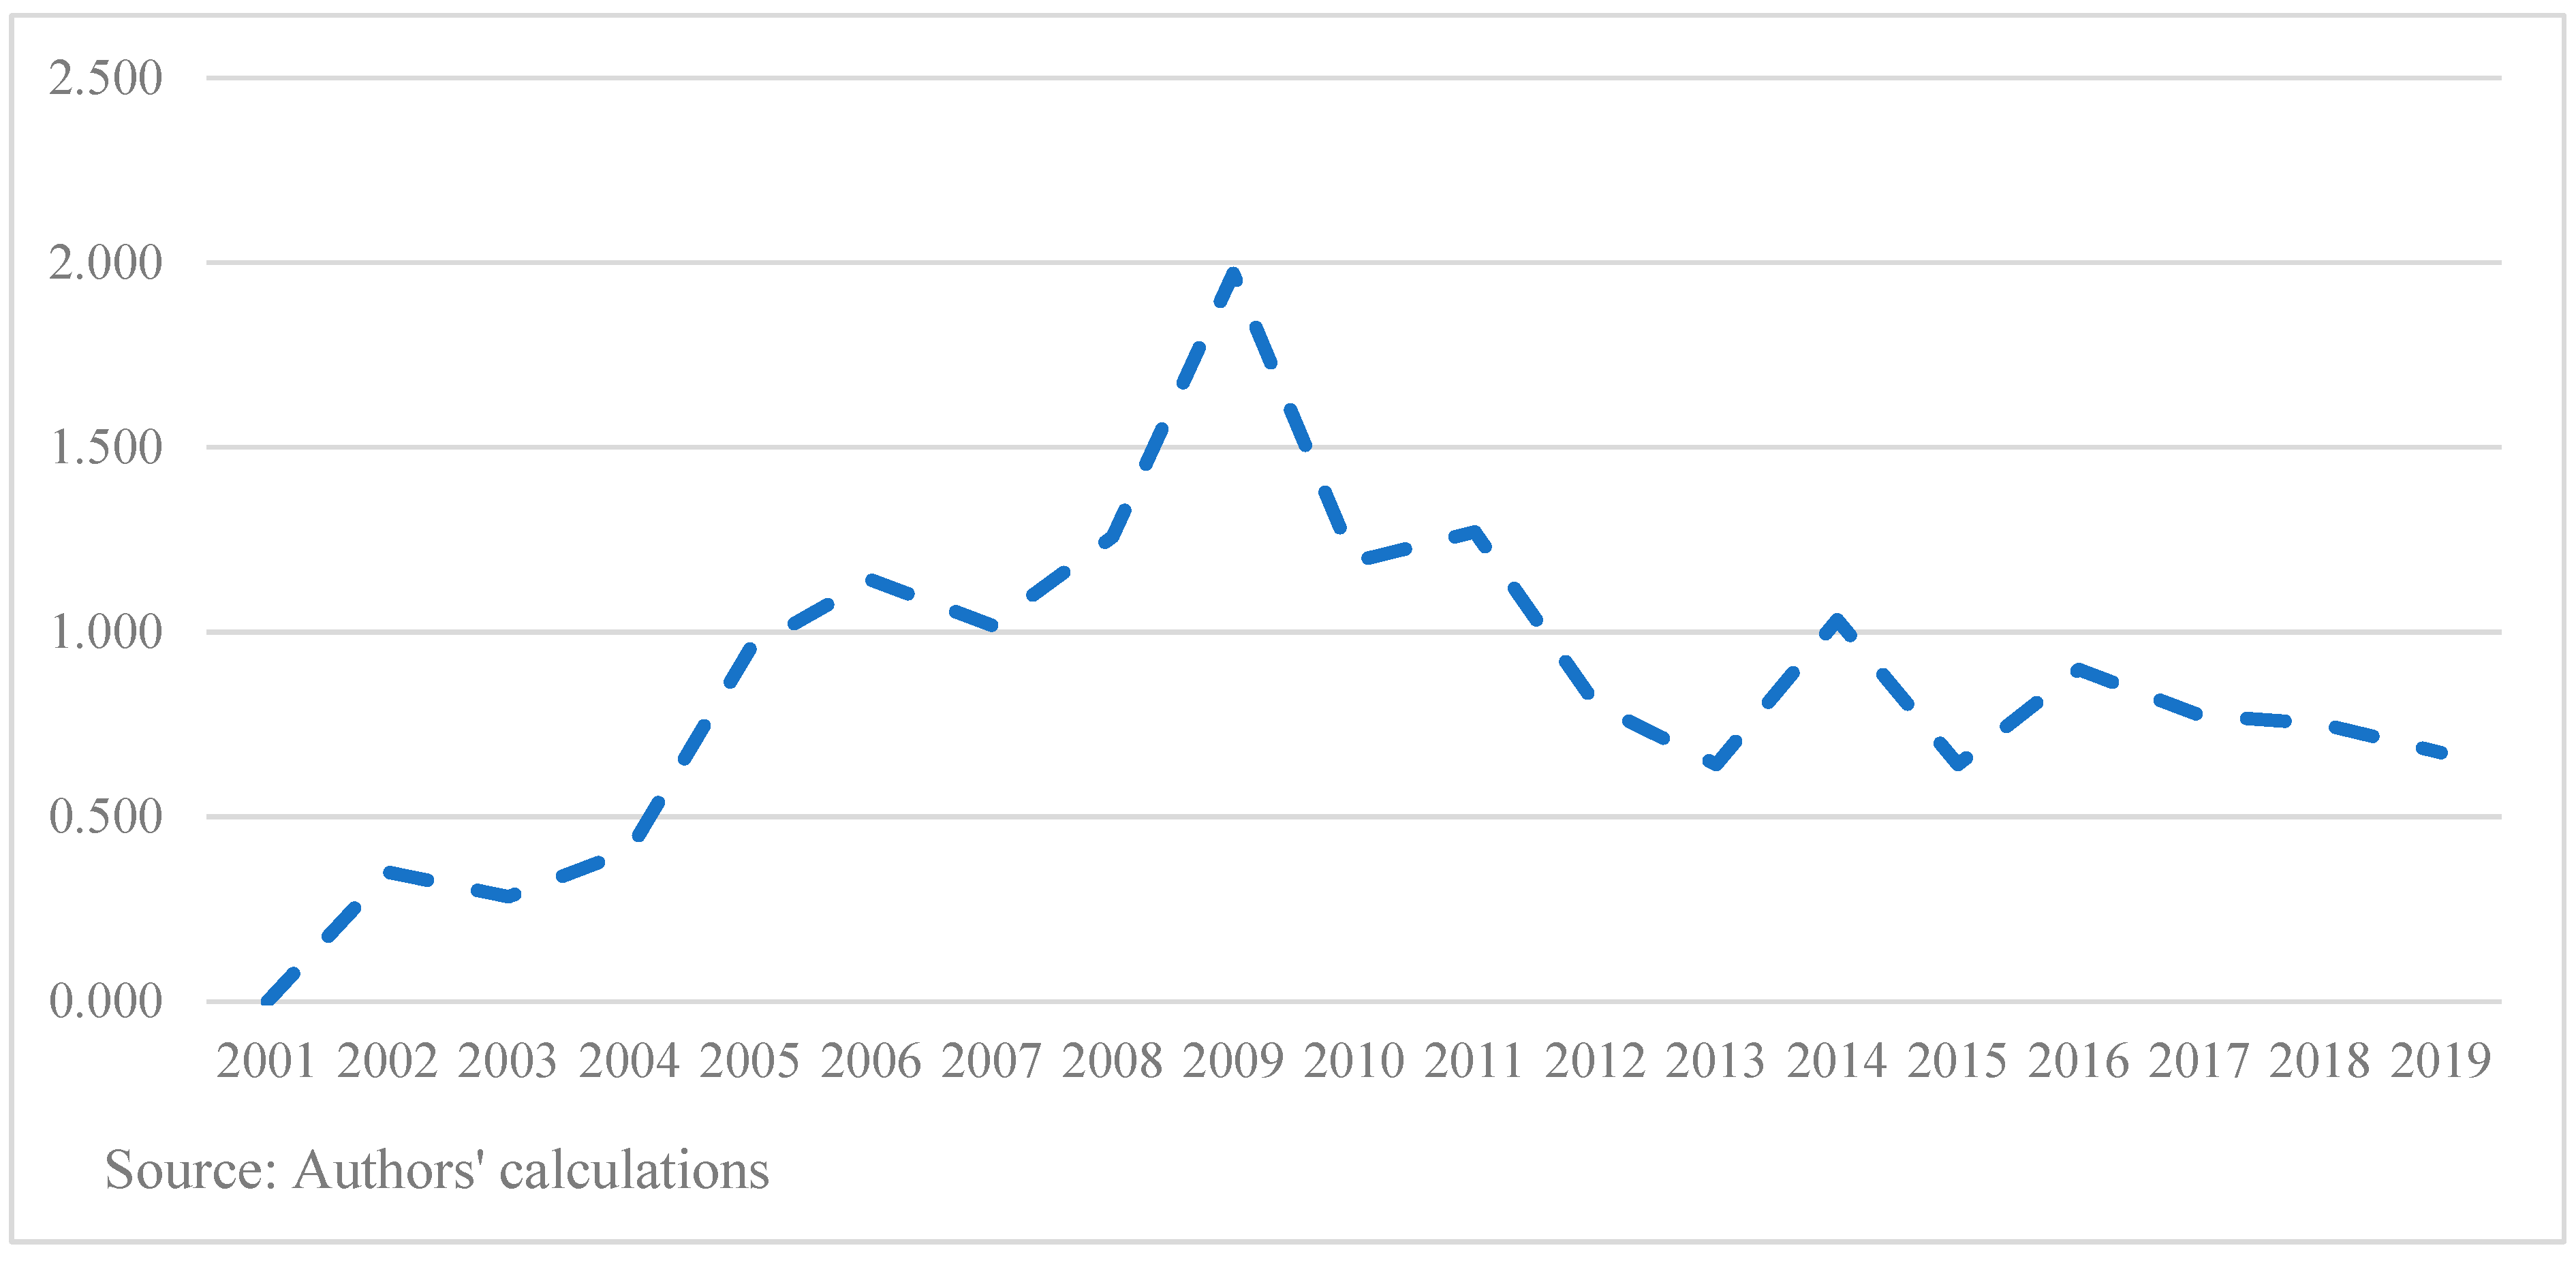
The ROK’s MCA for electrical machinery products (HS Code 85) declined from 4.39 in 2001 to 1.71 in 2019 (see Figure 3), implying that the ROK has lost the comparative advantage in the electrical machinery segment in the Indian market. The ROK has lost the market share to imports from China, Hong Kong, and Vietnam. The proportion of China in India’s imports of HS Code 85 increased significantly from 7.1% in 2001 to 39.3% in 2019, whereas the share of the ROK decreased from 9.9% to 5.8% during this period. The share of Hong Kong and Vietnam in India’s HS Code 85 imports also increased during the same period, from 2.5% to 17.3% and from 0.03% to 7.6%, respectively.
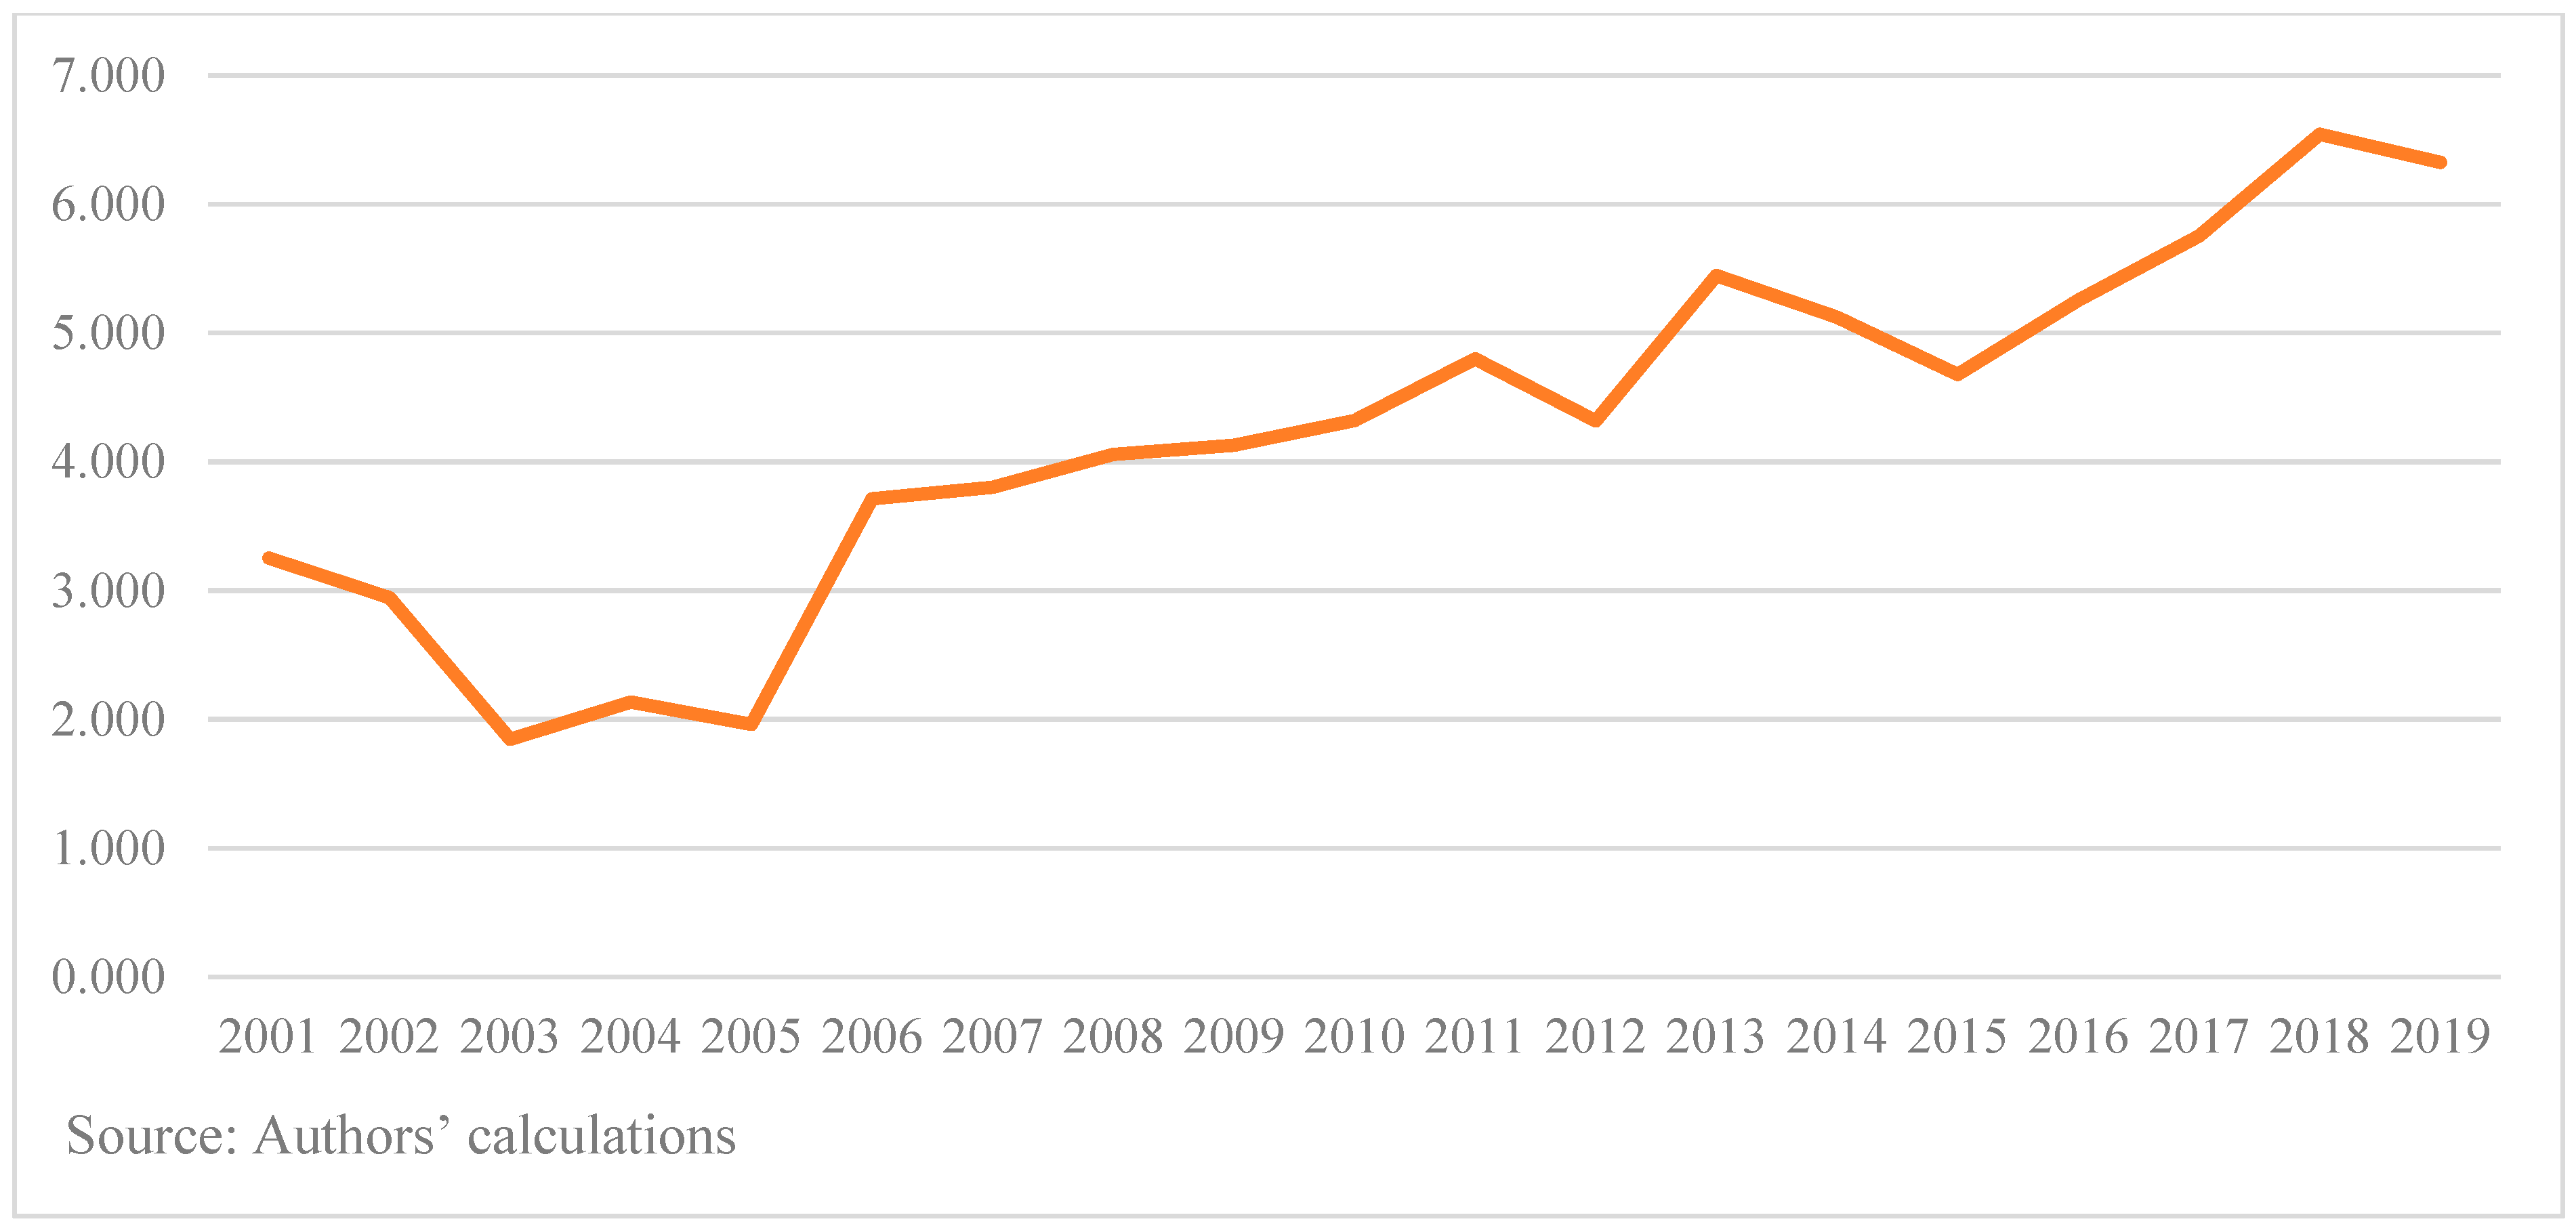
The ROK’s MCA for iron and steel products (HS Code 72) improved from 3.2 in 2001 to 6.3 in 2019, as illustrated in Figure 4. This indicates that the ROK’s comparative advantage for iron and steel with respect to India increased during the same time. The contribution of the ROK in India’s imports of iron and steel increased substantially from 7.29% in 2001 to 21.28% in 2019. As of 2019, India was the third largest export destination for iron and steel from the ROK, driven by the increasing demand for iron and steel by India, which has a growing economy.
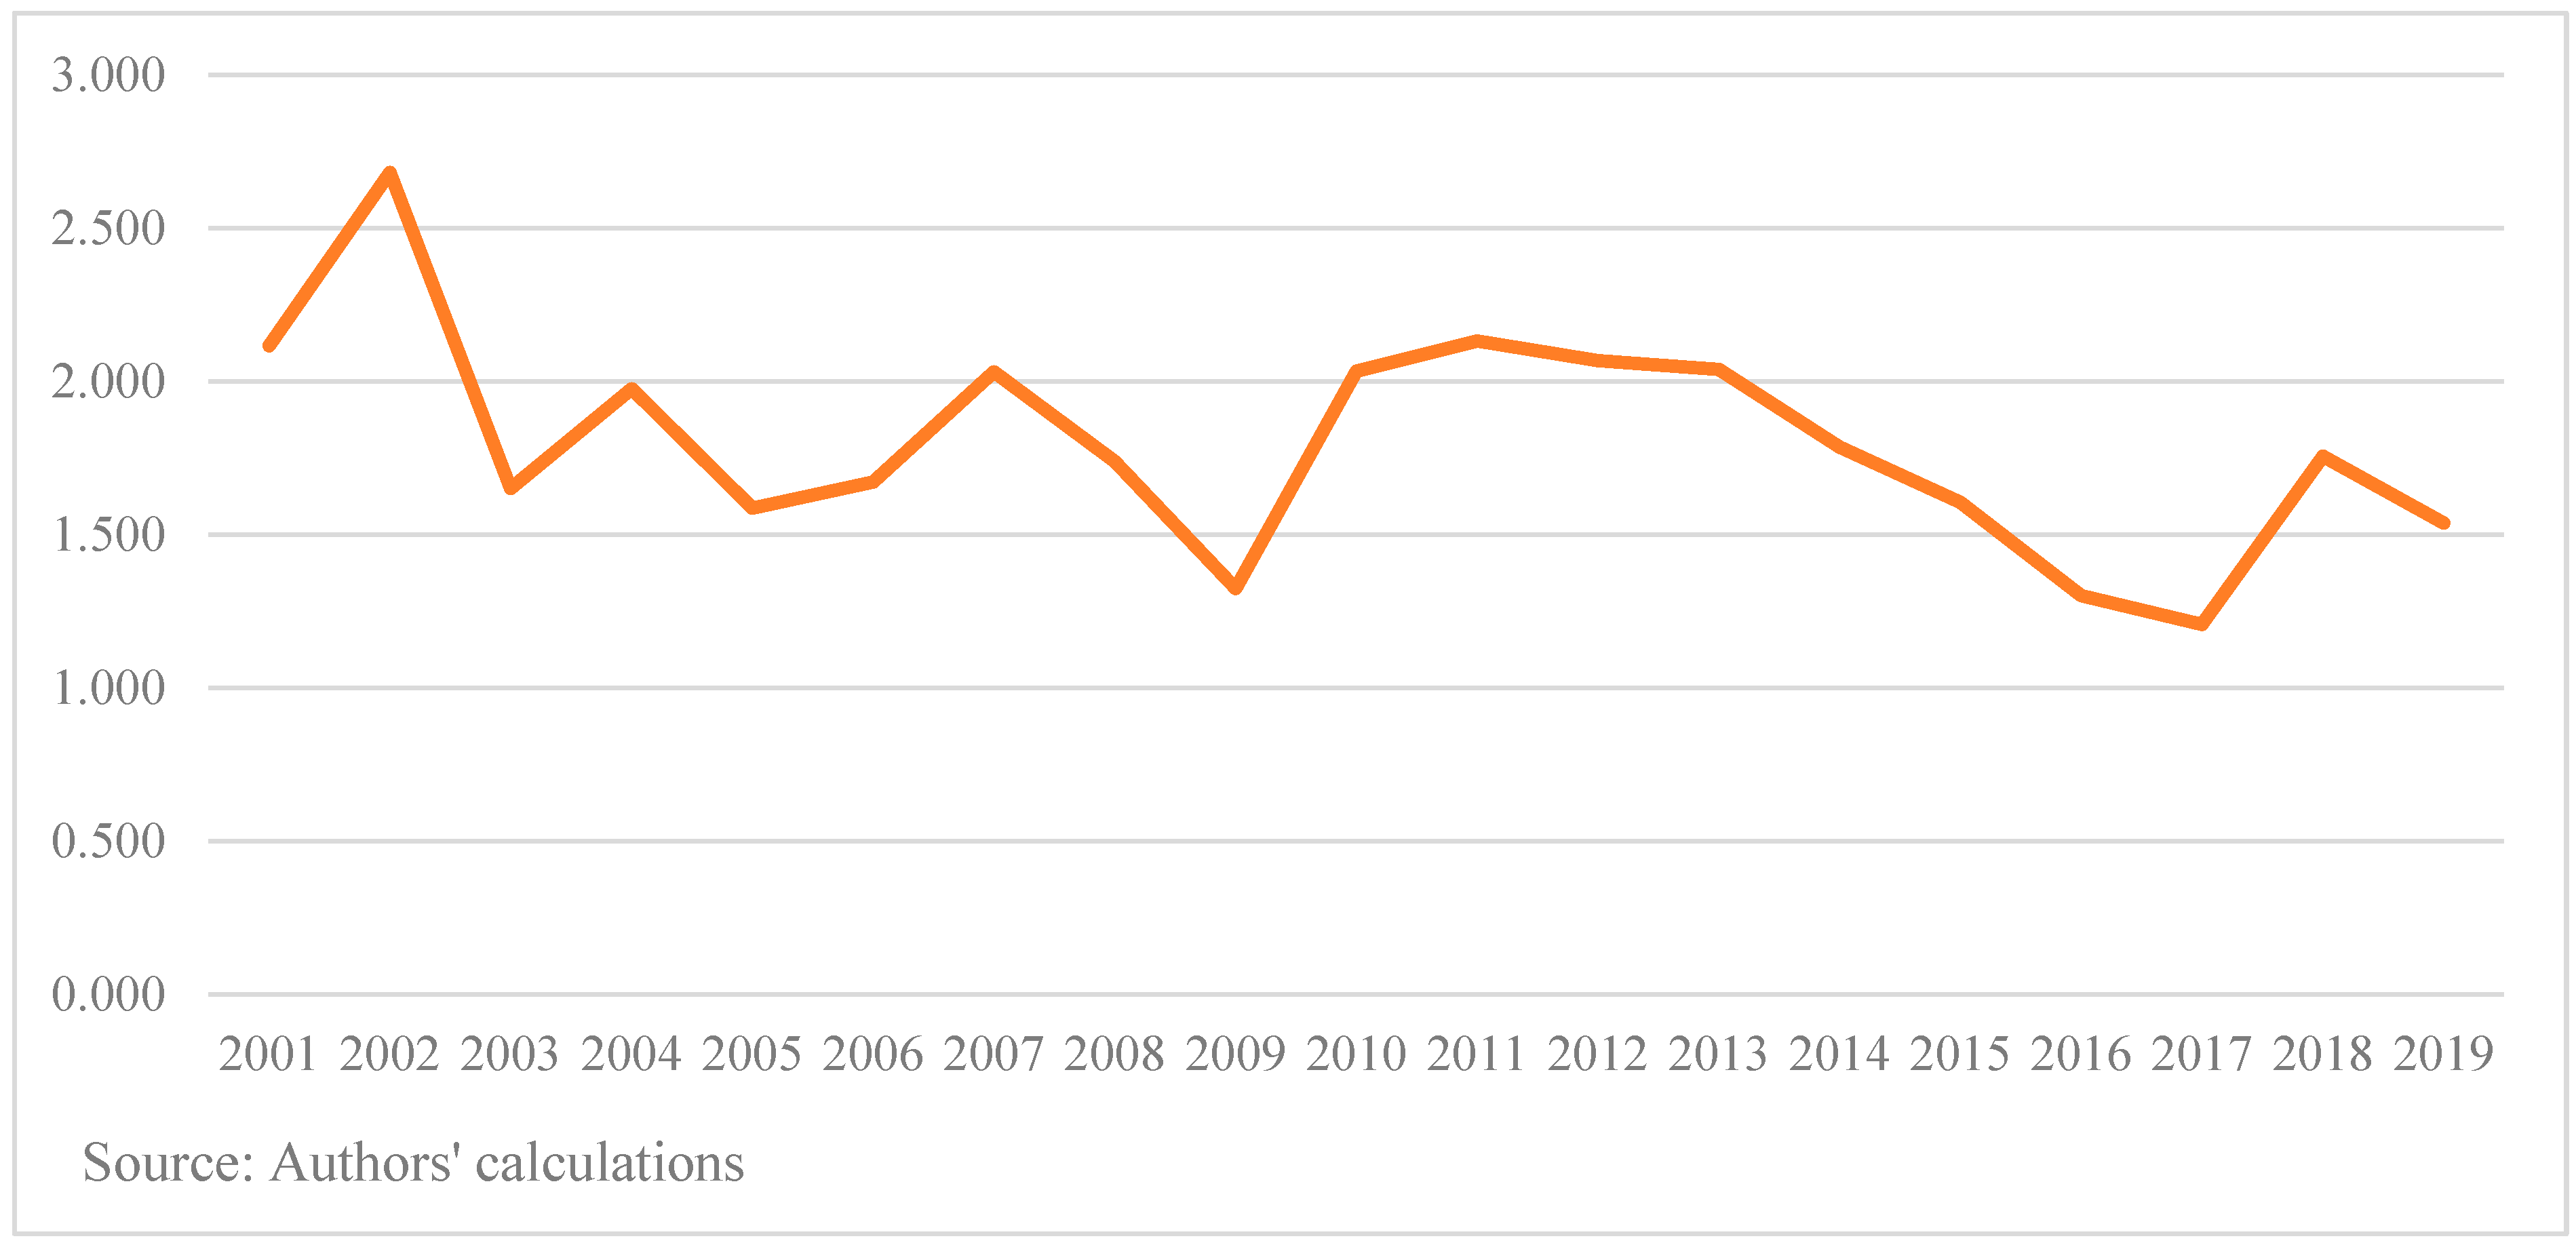
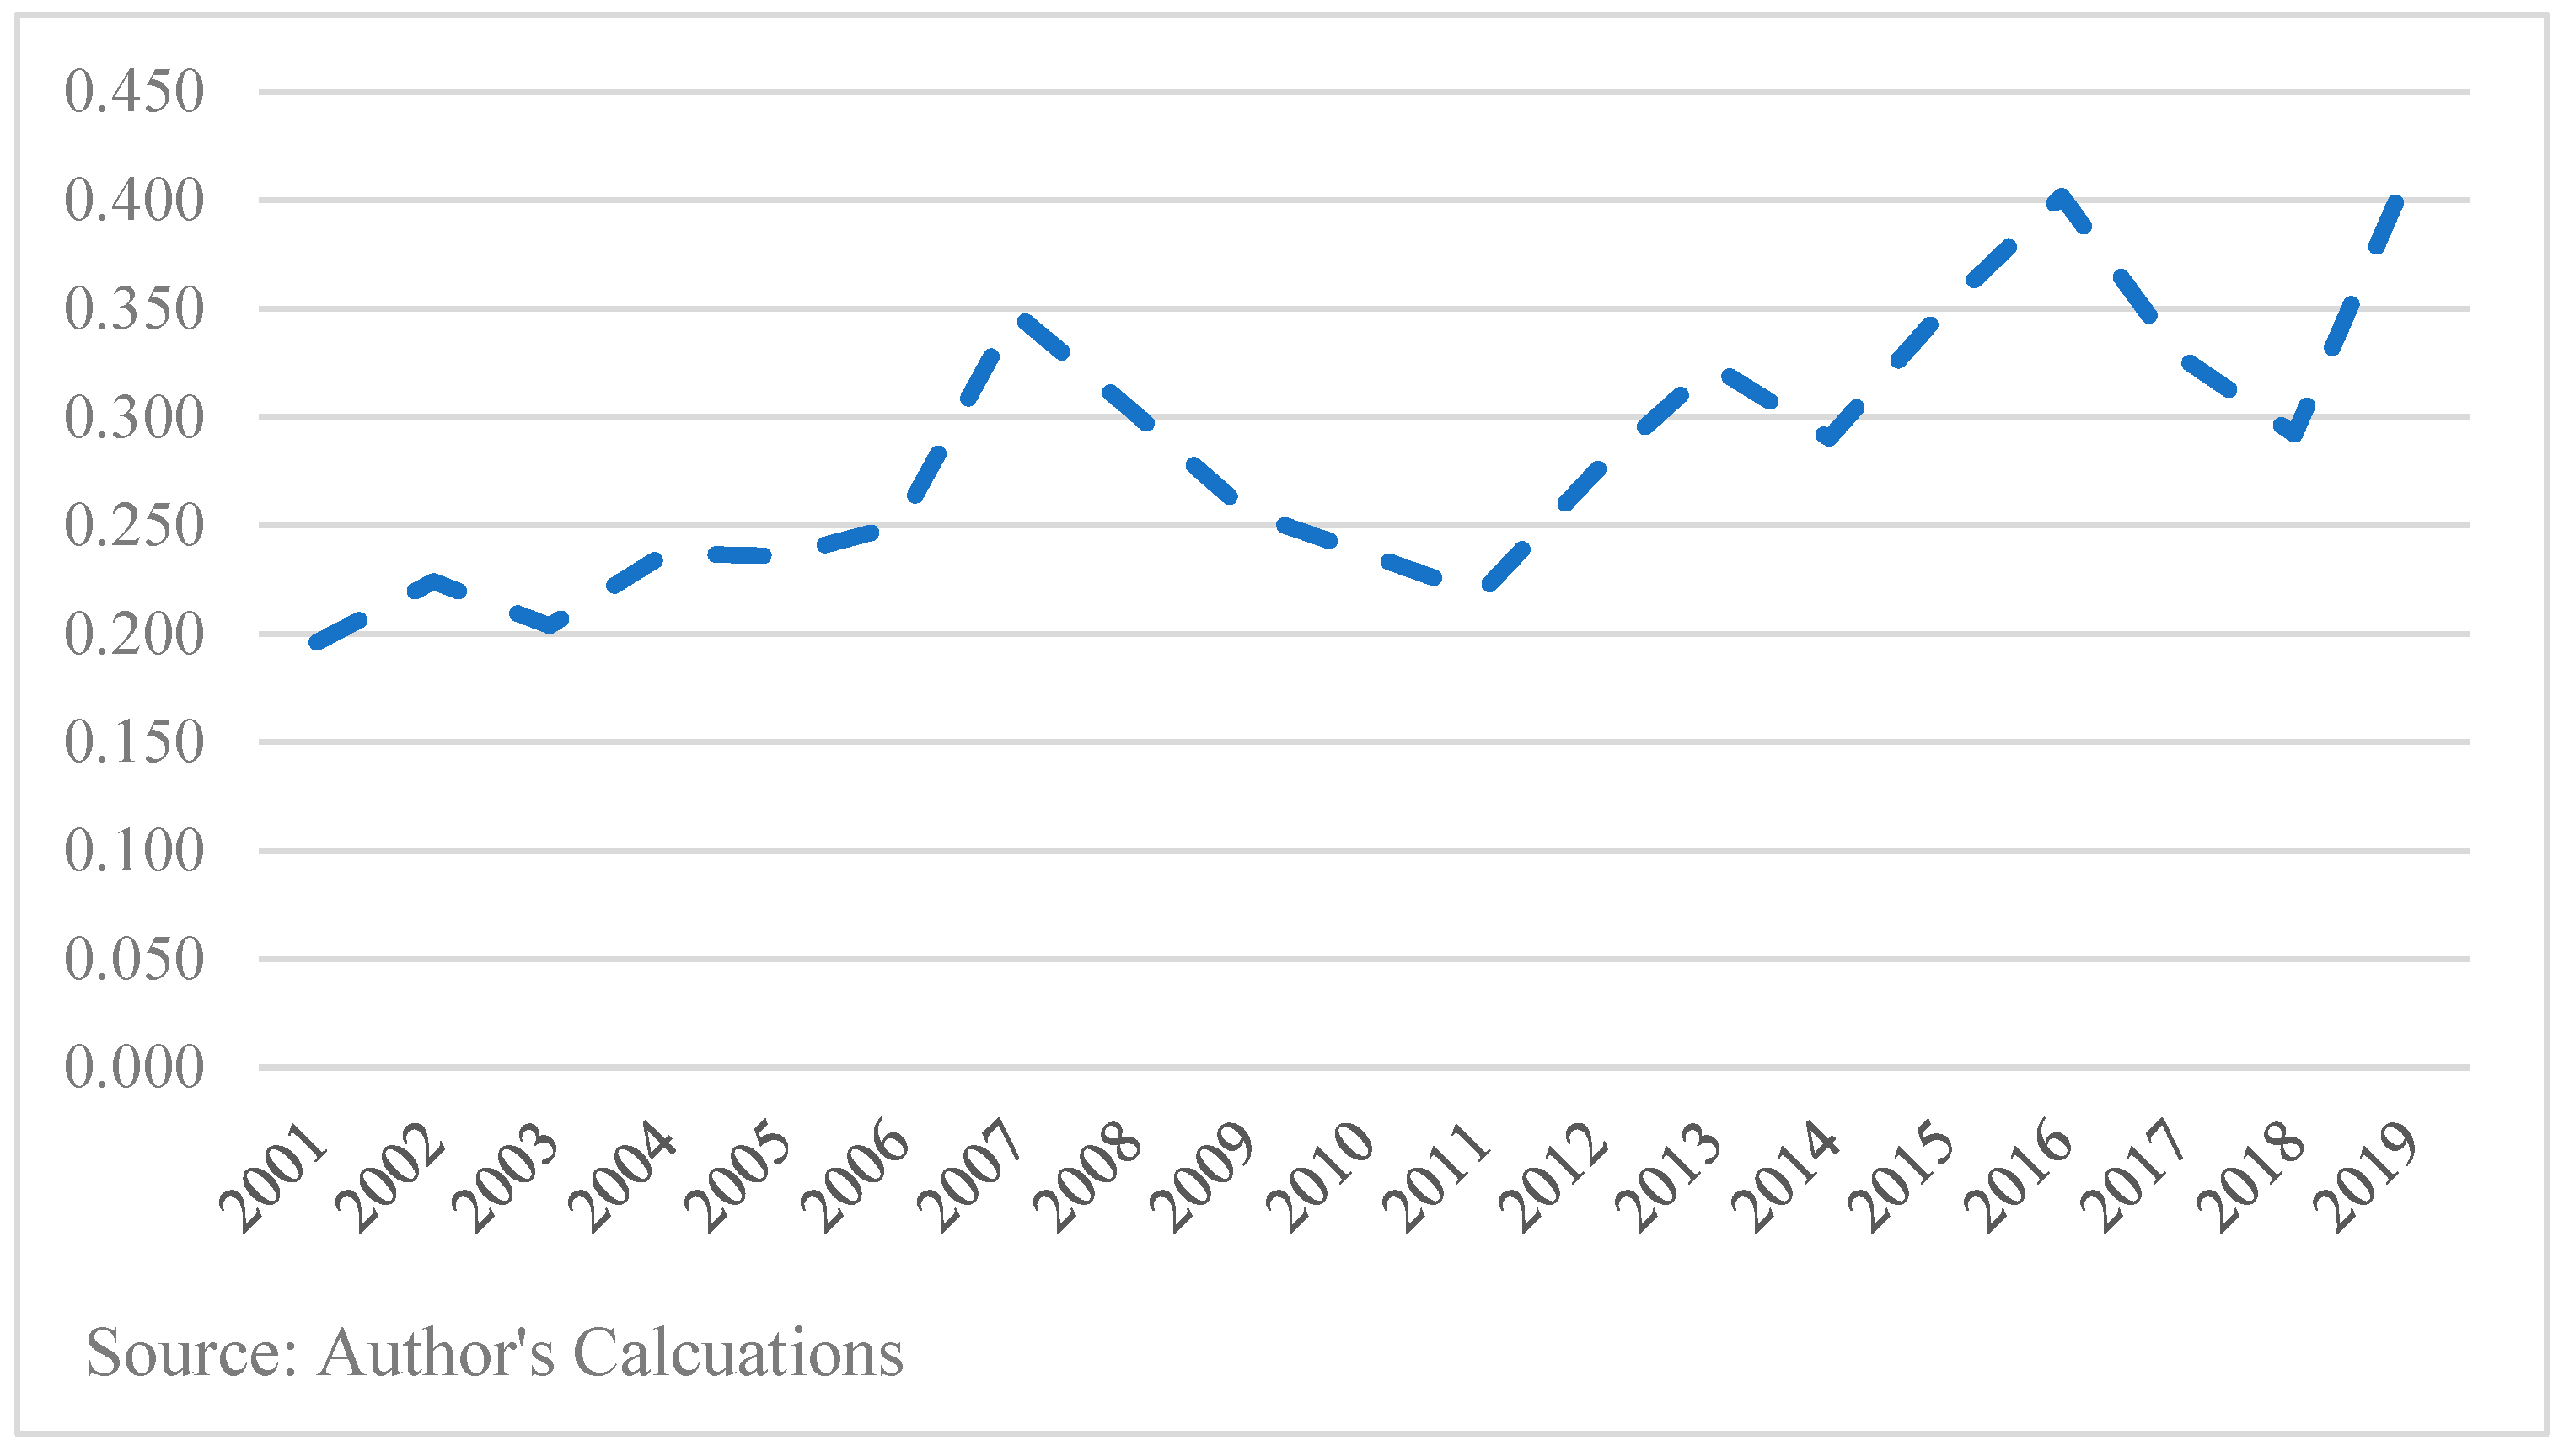
The comparative advantage for machinery and mechanical appliances (HS Code 84) in the Indian market has decreased with the MCA for HS Code 84 declining marginally from 2.1 in 2001 to 1.5 in 2019 (see Figure 5). However, the share of the ROK in India’s imports of machinery and mechanical appliances has increased marginally, from 4.8% to 5.2% during the same period. By contrast, the share of China, the largest sourcing country of HS Code 84 for India, increased drastically from 5.1% in 2001 to 31.2% in 2019.
The ROK’s MCA for plastics and articles thereof (HS Code 39) changed little, from 3.5 in 2001 to 3.4 in 2019 (see Figure 6). The ROK is the second largest exporter of plastics and articles thereof to India and China. The share of the ROK in India’s imports of plastics and articles thereof was 7.9% in 2001 and 11.4% in 2019. The ROK has been a major importing country of HS Code 39 for India during the study period. From 2001 to 2010, the ROK and the United States were the major sourcing countries, while from 2011 to 2019, China has emerged as the largest sourcing country of HS Code 39. The share of China in India’s imports of HS Code 39 was 2.2% in 2001 and 19.3% in 2019. This indicates that although the ROK’s share in India’s plastic market increased, the presence of China has increased more than that of the ROK in the Indian market.
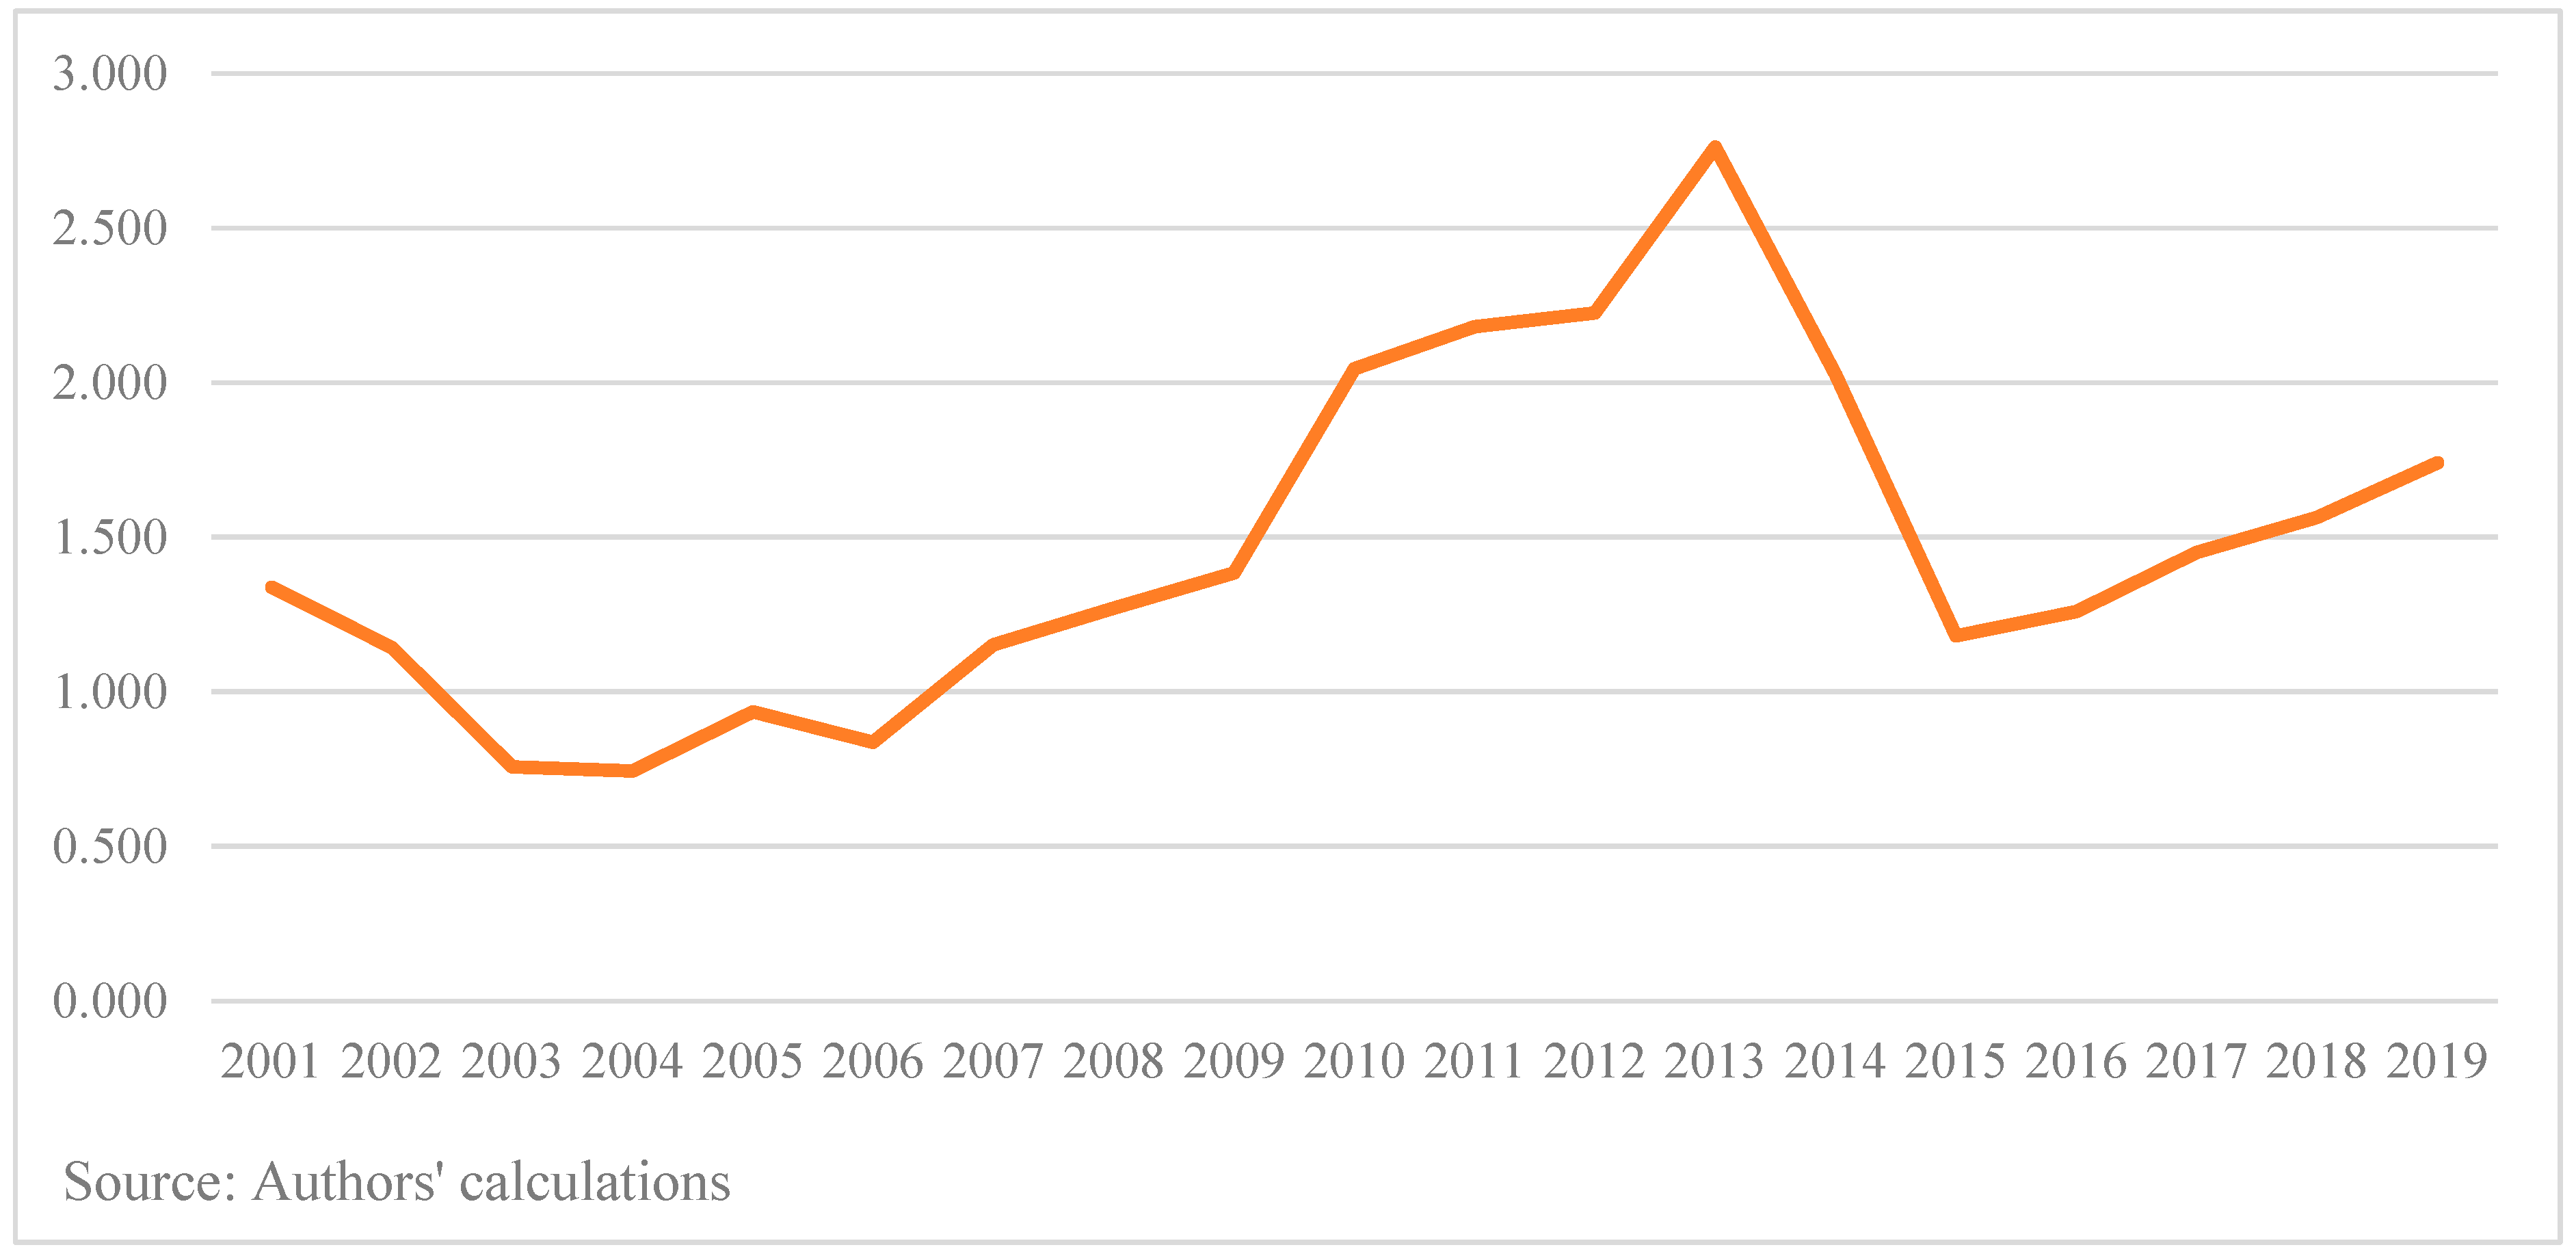
The ROK’s comparative advantage of organic chemicals (HS Code 29) in India rose from 1.3 in 2001 to 1.7 in 2019, as shown in Figure 7. India’s main sourcing countries for organic chemicals are the ROK, China, the US, and Singapore. The share of the ROK in India’s imports of HS Code 29 increased from 3% to 5.9% during the same period, while that of China jumped from 16.5% to 40.1%. By contrast, the shares of the US and Singapore decreased from 11% to 8.7% and from 7.9% to 6.2%, respectively.
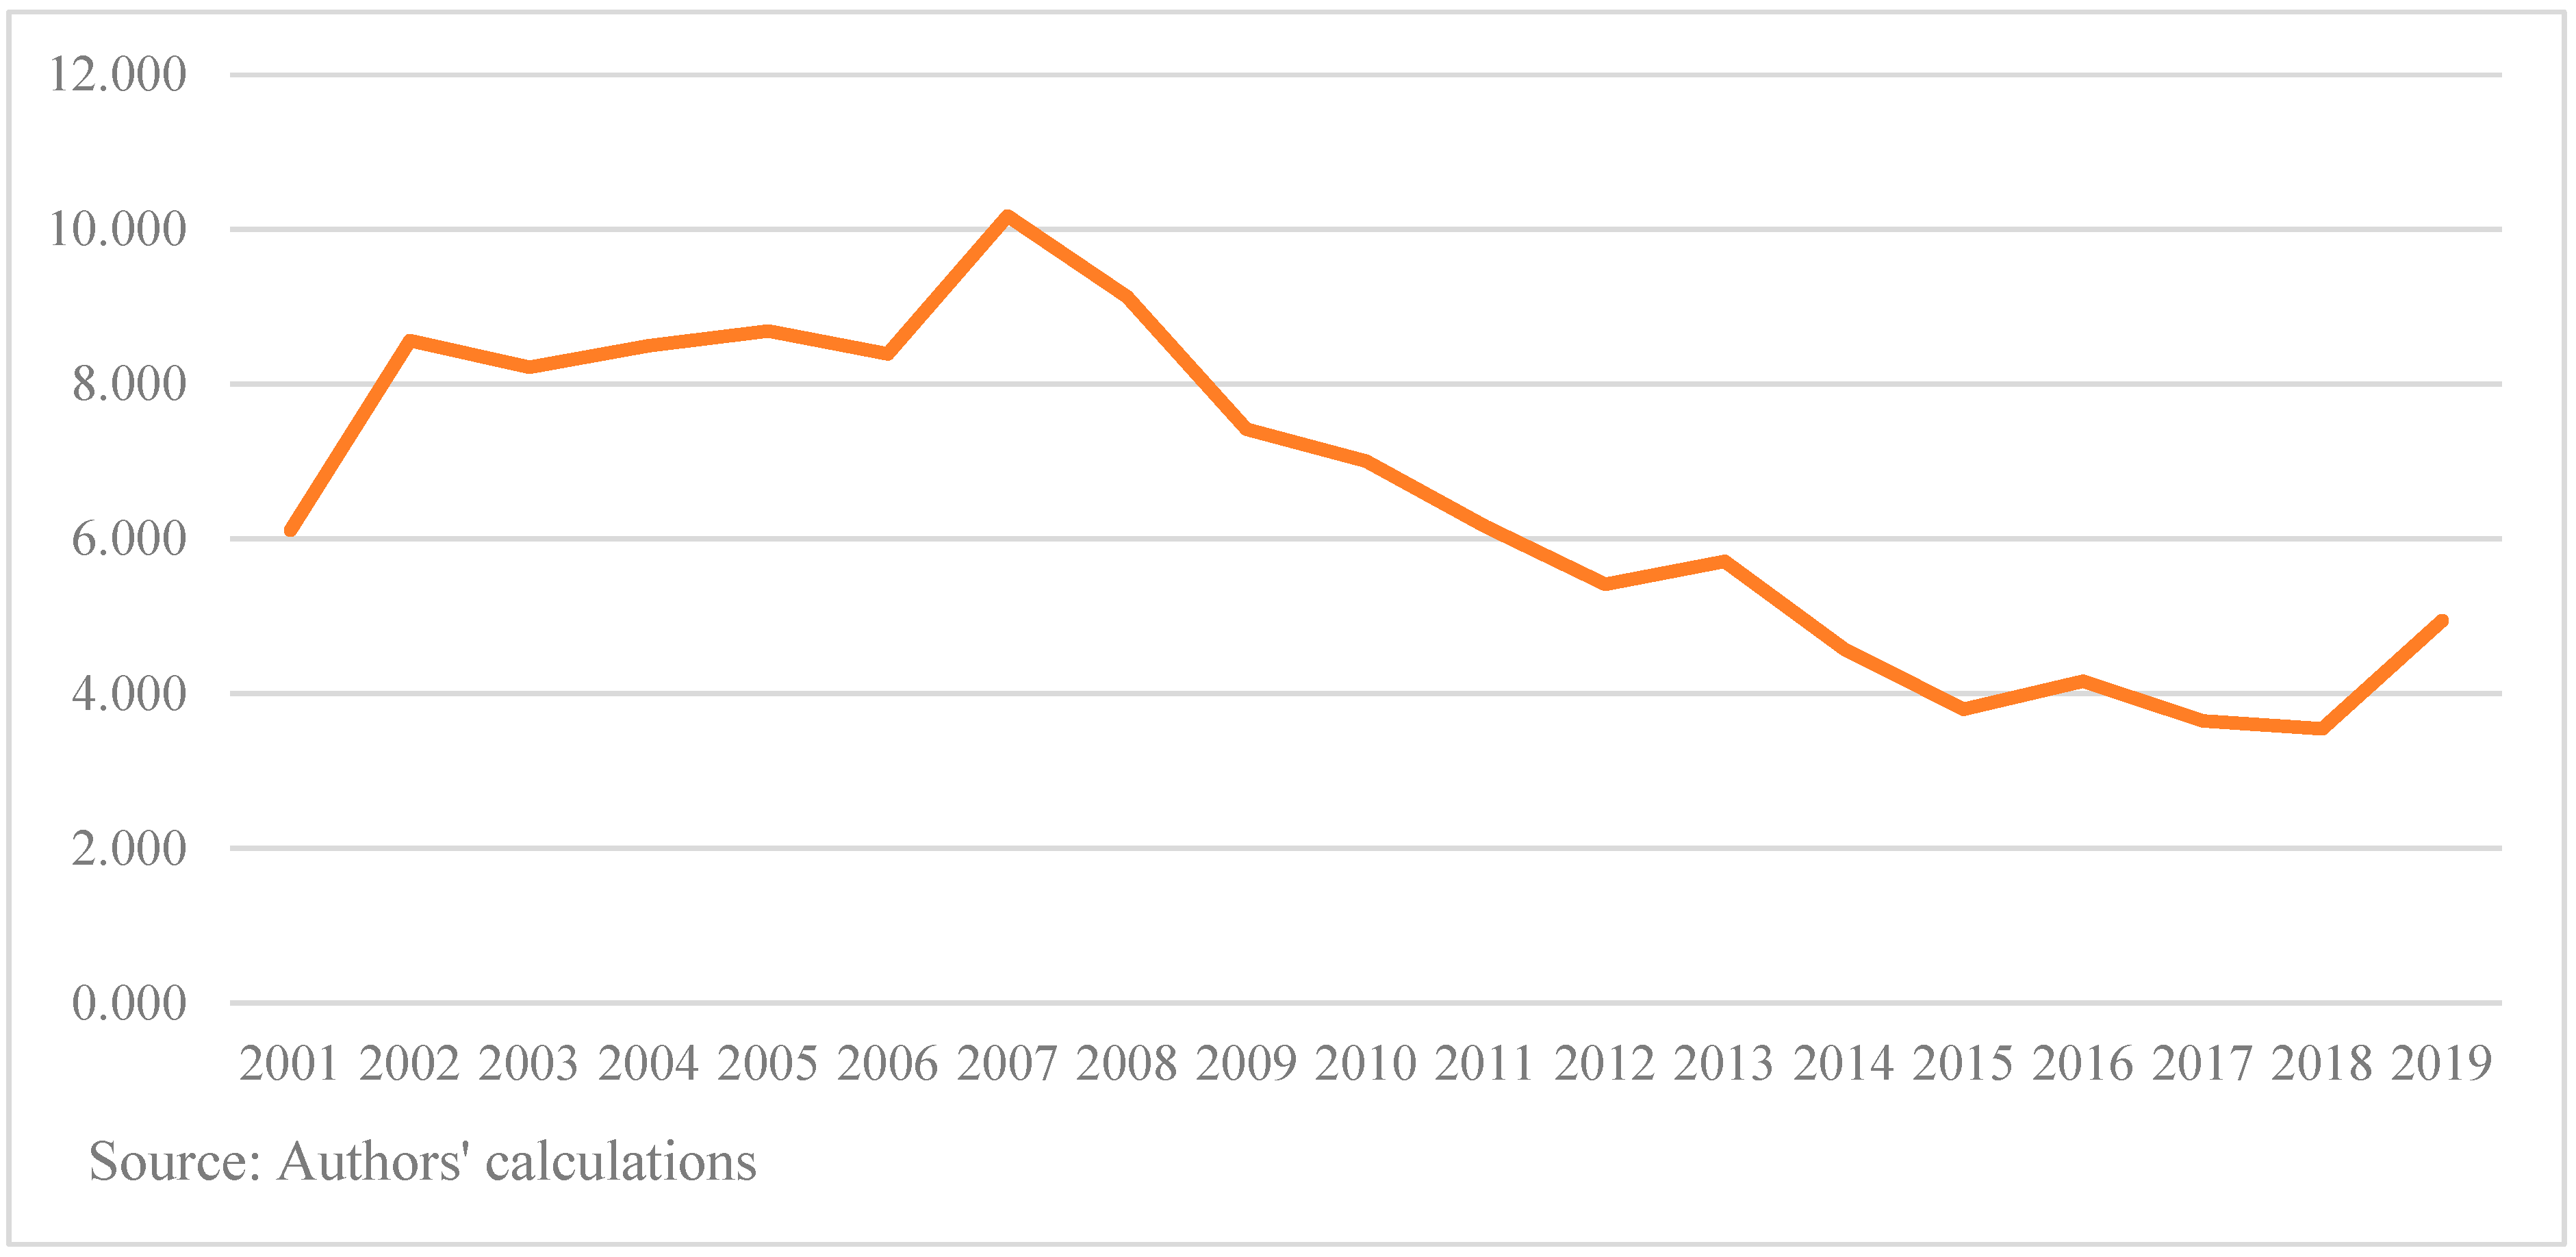
For vehicles (HS Code 87), the ROK’s MCA decreased from 6.1 in 2001 to 4.9 in 2019 (see Figure 8), implying a decrease in the ROK’s comparative advantage in India’s automobile market. China, Japan, the US, and Germany are the ROK’s competitors for the same product category in the Indian market. The ROK’s share in India’s automobile imports increased from 13.7% in 2001 to 17.8% in 2019, while China’s share shot up from 2.6% to 27.9% during the same period. During the 2000s, the ROK’s share in India’s imports of HS Code 87 substantially increased from 13.7% in 2001 to 25.3% in 2007, when the ROK was the top sourcing country from India’s side. However, the emergence of China in India’s importing of HS Code 87 had impacts on the ROK’s comparative advantage in India’s vehicles market. China has become the top sourcing country for India’s HS Code 87 commodity since 2011.
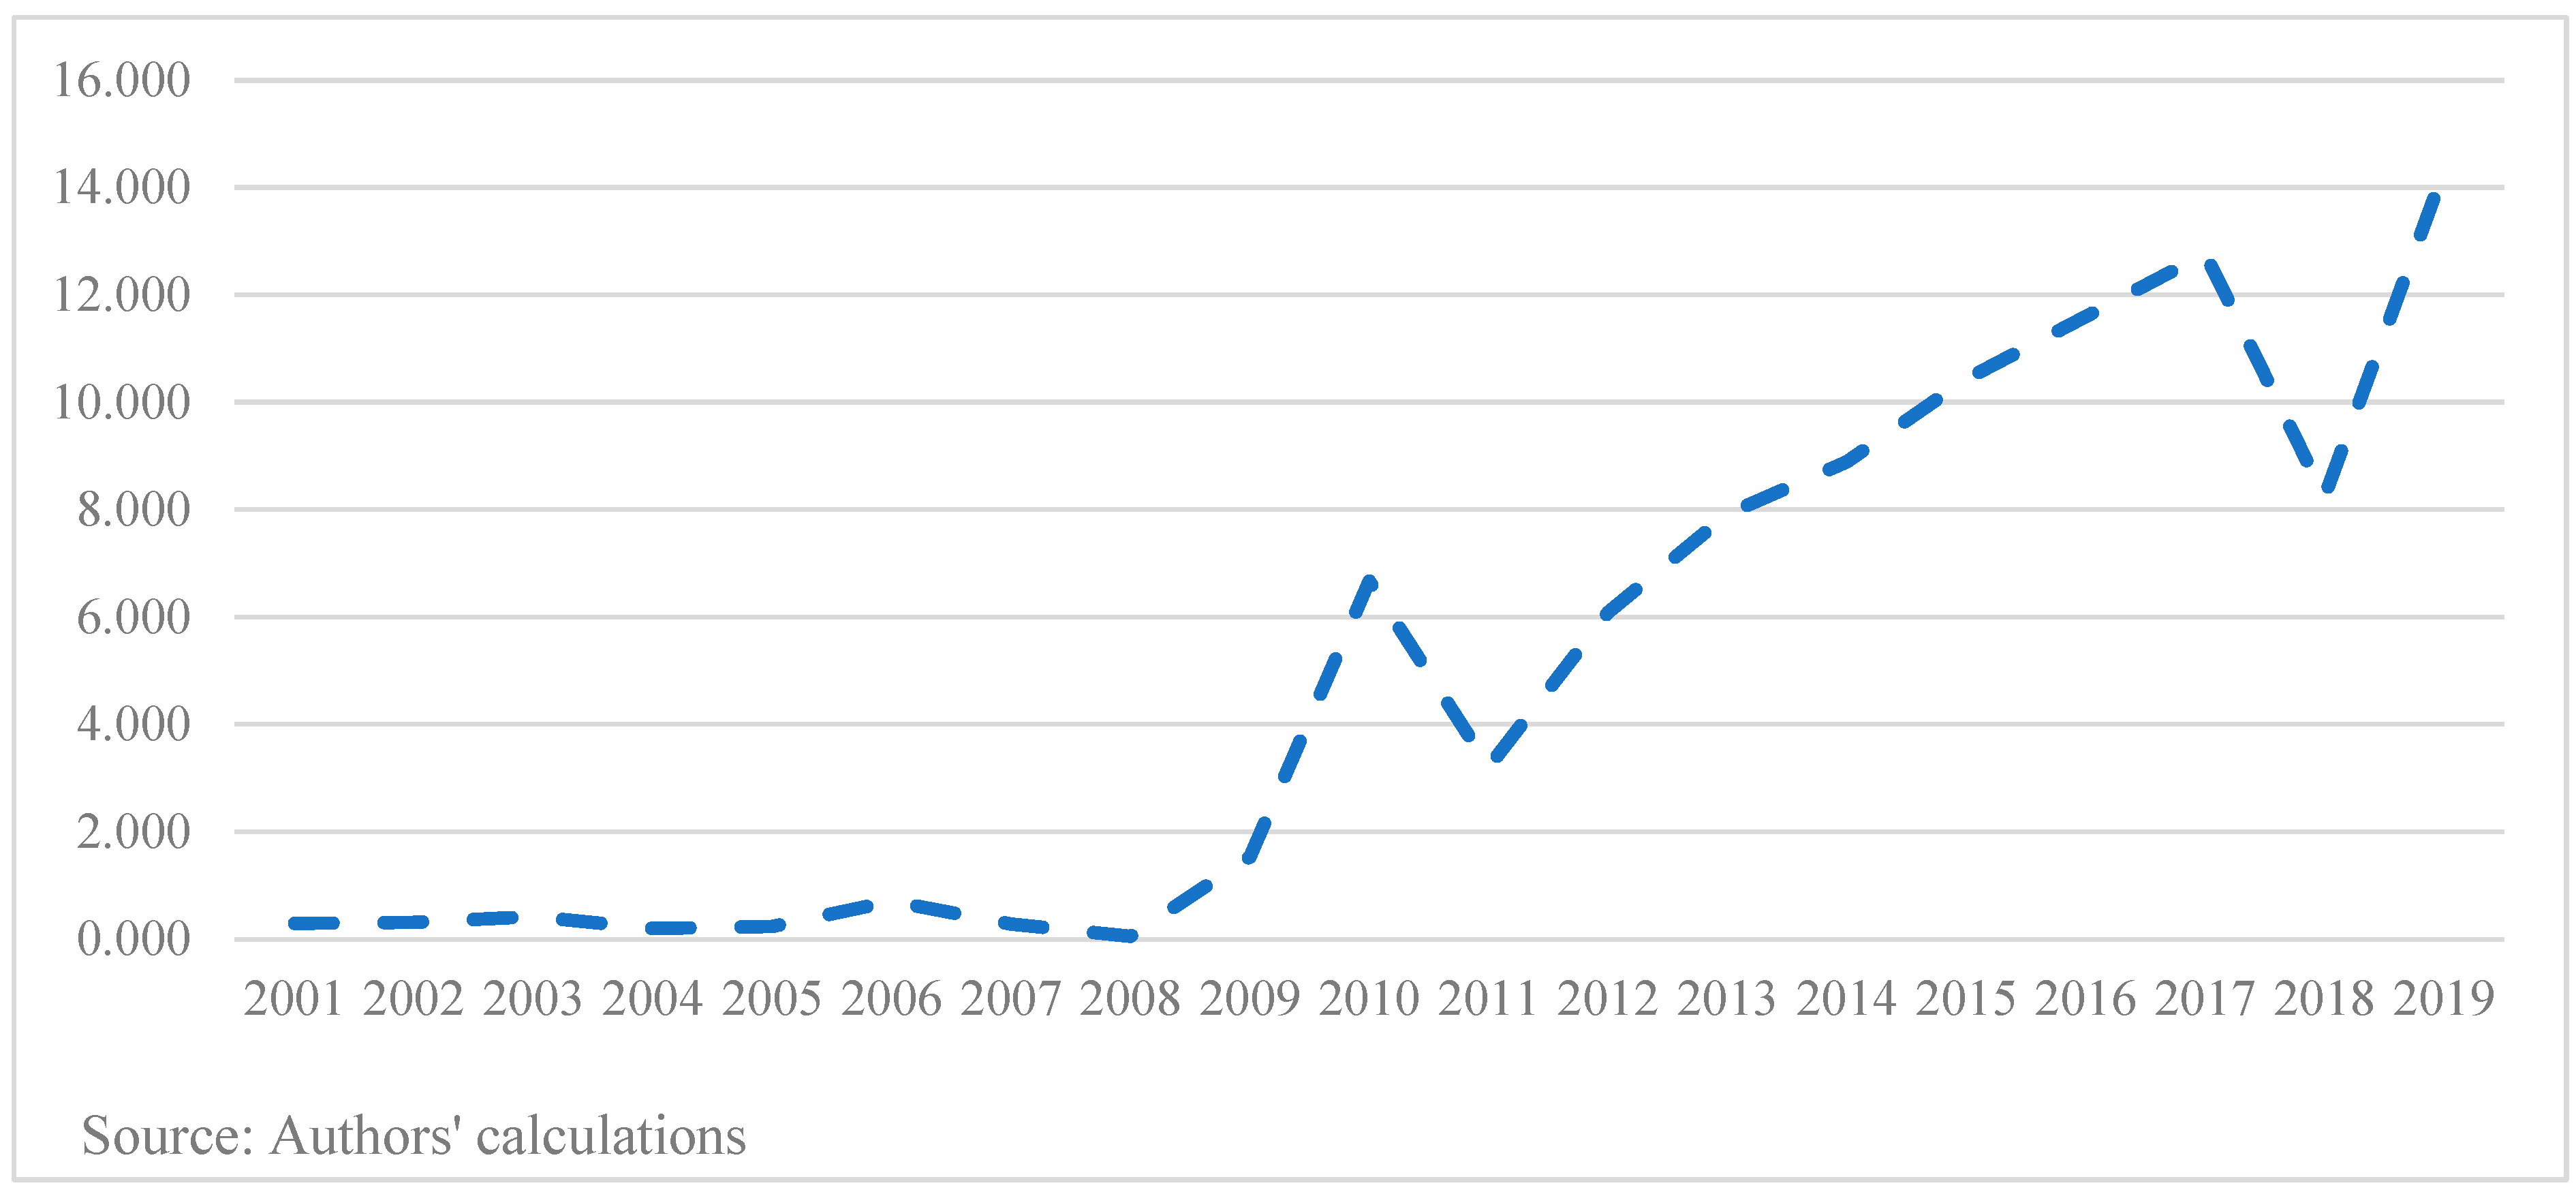
India’s MCA for aluminum and articles thereof (HS Code 76) in the ROK increased notably from 0.3 in 2001 to 14.8 in 2019 (see Figure 9), indicating an improvement in India’s export competitiveness in the Korean market. The share of India in the ROK’s imports of aluminum and articles thereof was 0.18% in 2001, increasing to 12.3% in 2019, catapulting India to become the second largest exporting country to the ROK after China. The share of China in the ROK’s imports of HS Code 87 increased from 9.7% to 19.6% during the same period. However, the share of Australia, the third largest exporting country of HS Code 76 to the ROK, declined from 17.4% in 2001 to 10.3% in 2019.
For mineral fuels (HS Code 27), India’s MCA in the ROK changed significantly from 2001 to 2019, as depicted in Figure 10. India’s share of mineral fuels in the ROK’s imports was 0.8% in 2001, increasing to 2.8% in 2008, before decreasing to 0.9% in 2019. The main sourcing countries of HS Code 27 for the ROK are Saudi Arabia, the US, and Russia, with India being the 14th largest exporting country. More specifically, the main commodity under HS Code 27 imported by the ROK from India is naphtha (HS Code 2710), which is a raw material for plastics.
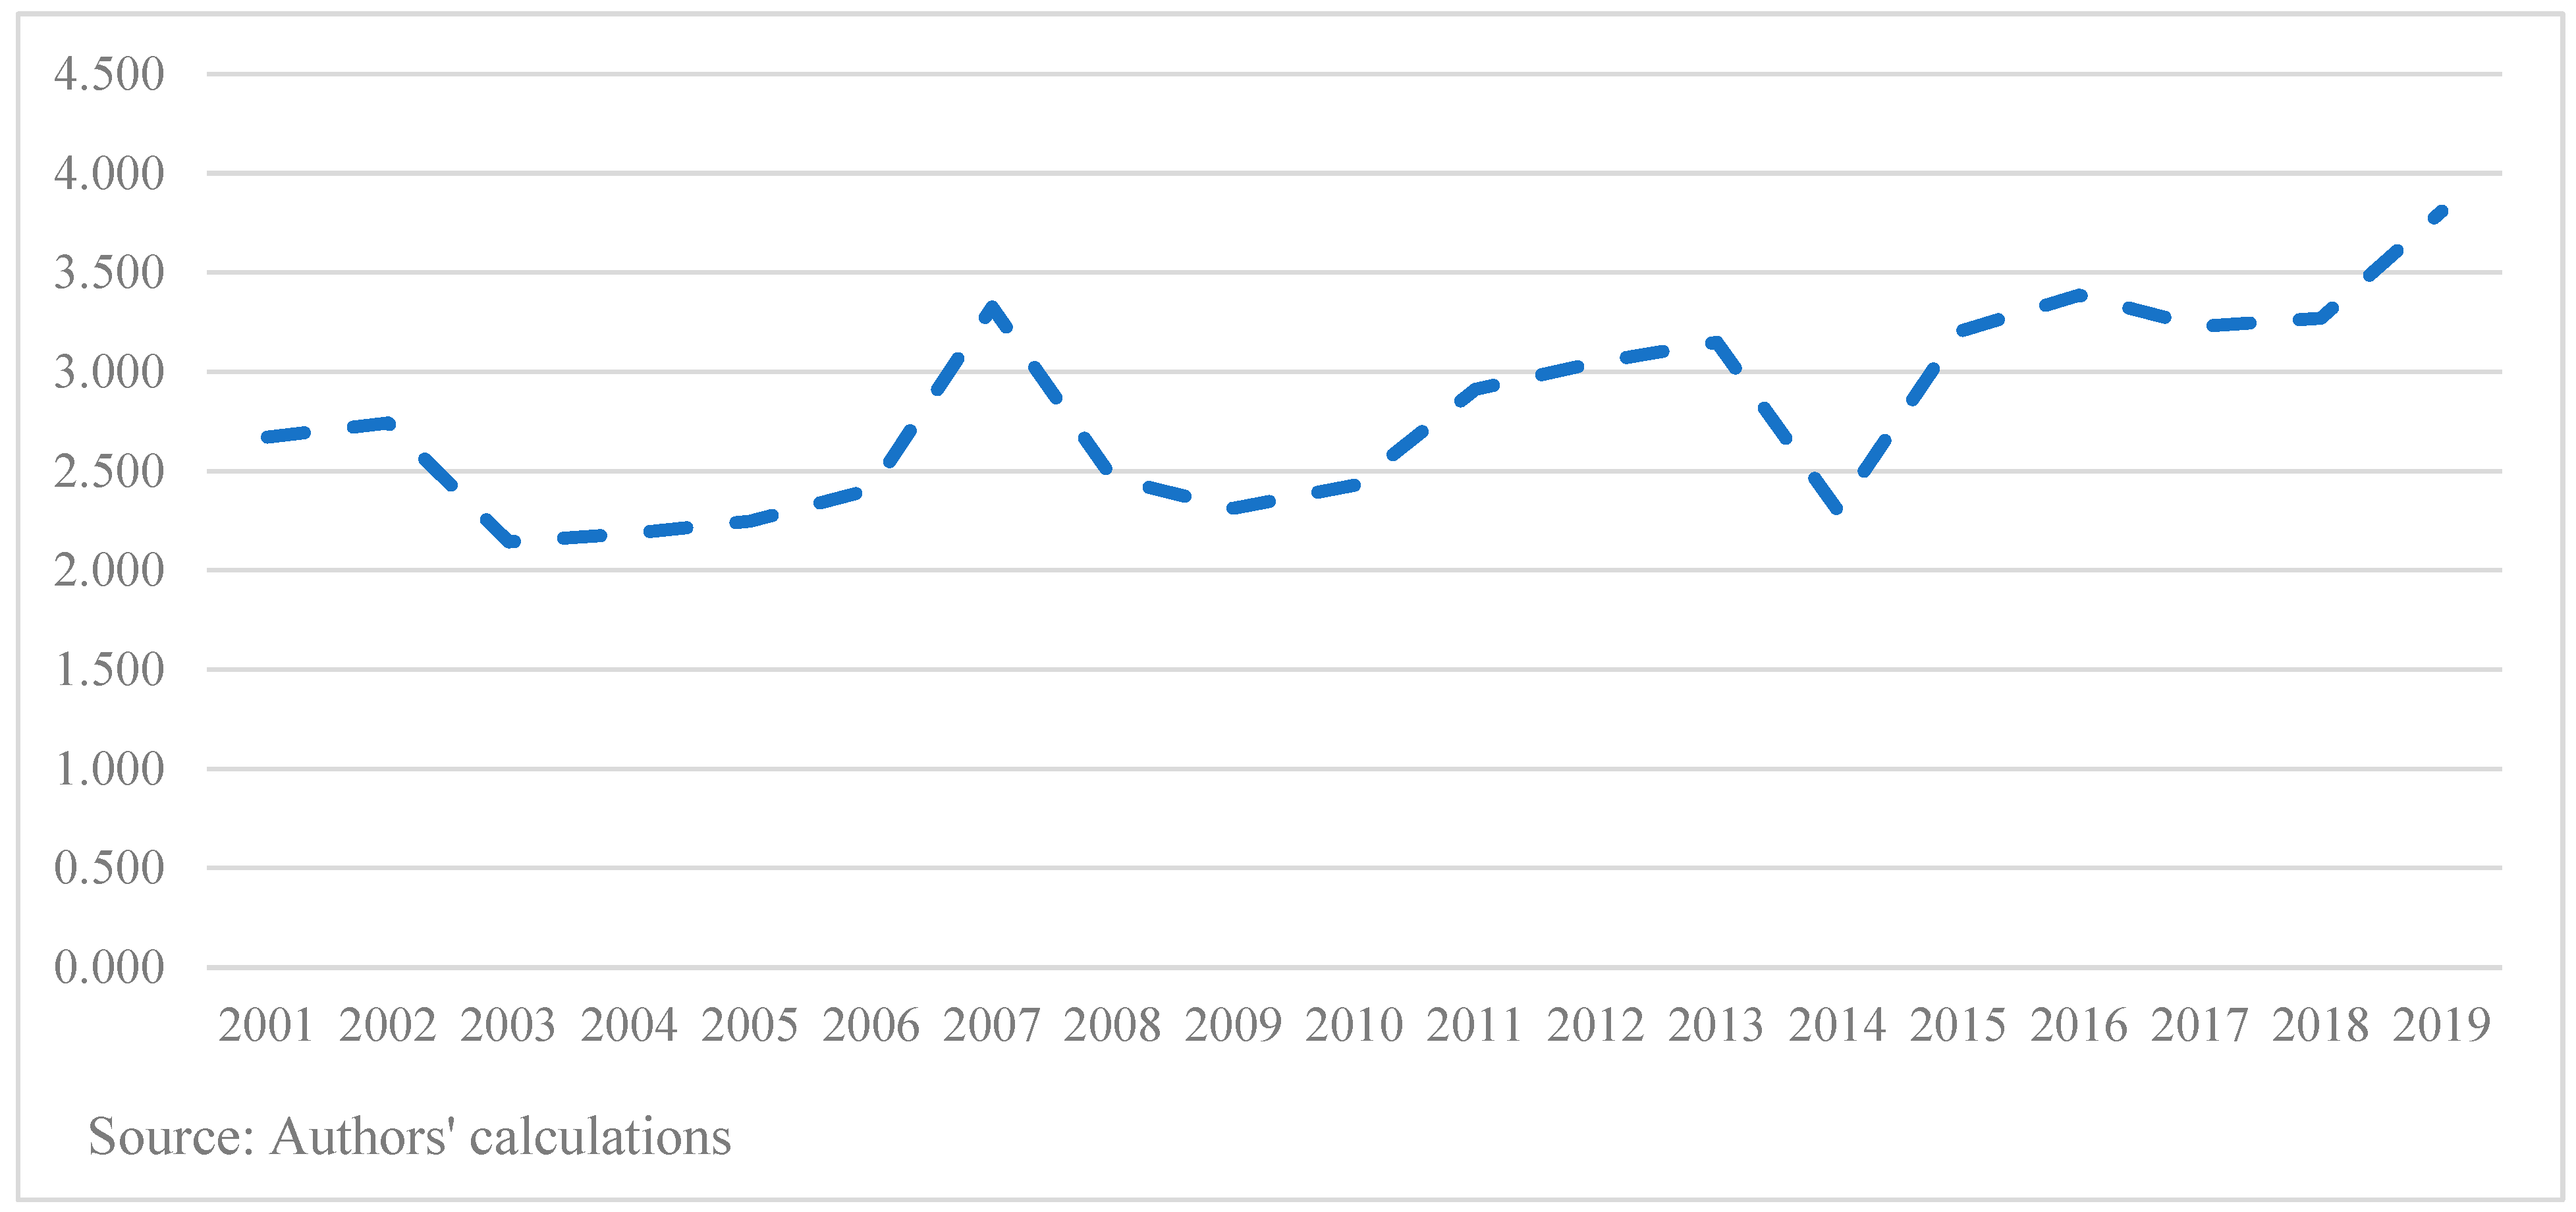
As evident from Figure 11, India’s MCA for organic chemicals (HS Code 29) increased from 2.6 in 2001 to 3.8 in 2019, implying an advancement in competitiveness in the ROK. The other major countries exporting products under this category to the ROK are China, Japan, the US, Germany, and Taipei. The share of China in the ROK’s imports of HS Code 29 products jumped from 7.2% to 28.9%, while that for India improved from 2.1% in 2001 to 4.7% in 2019.
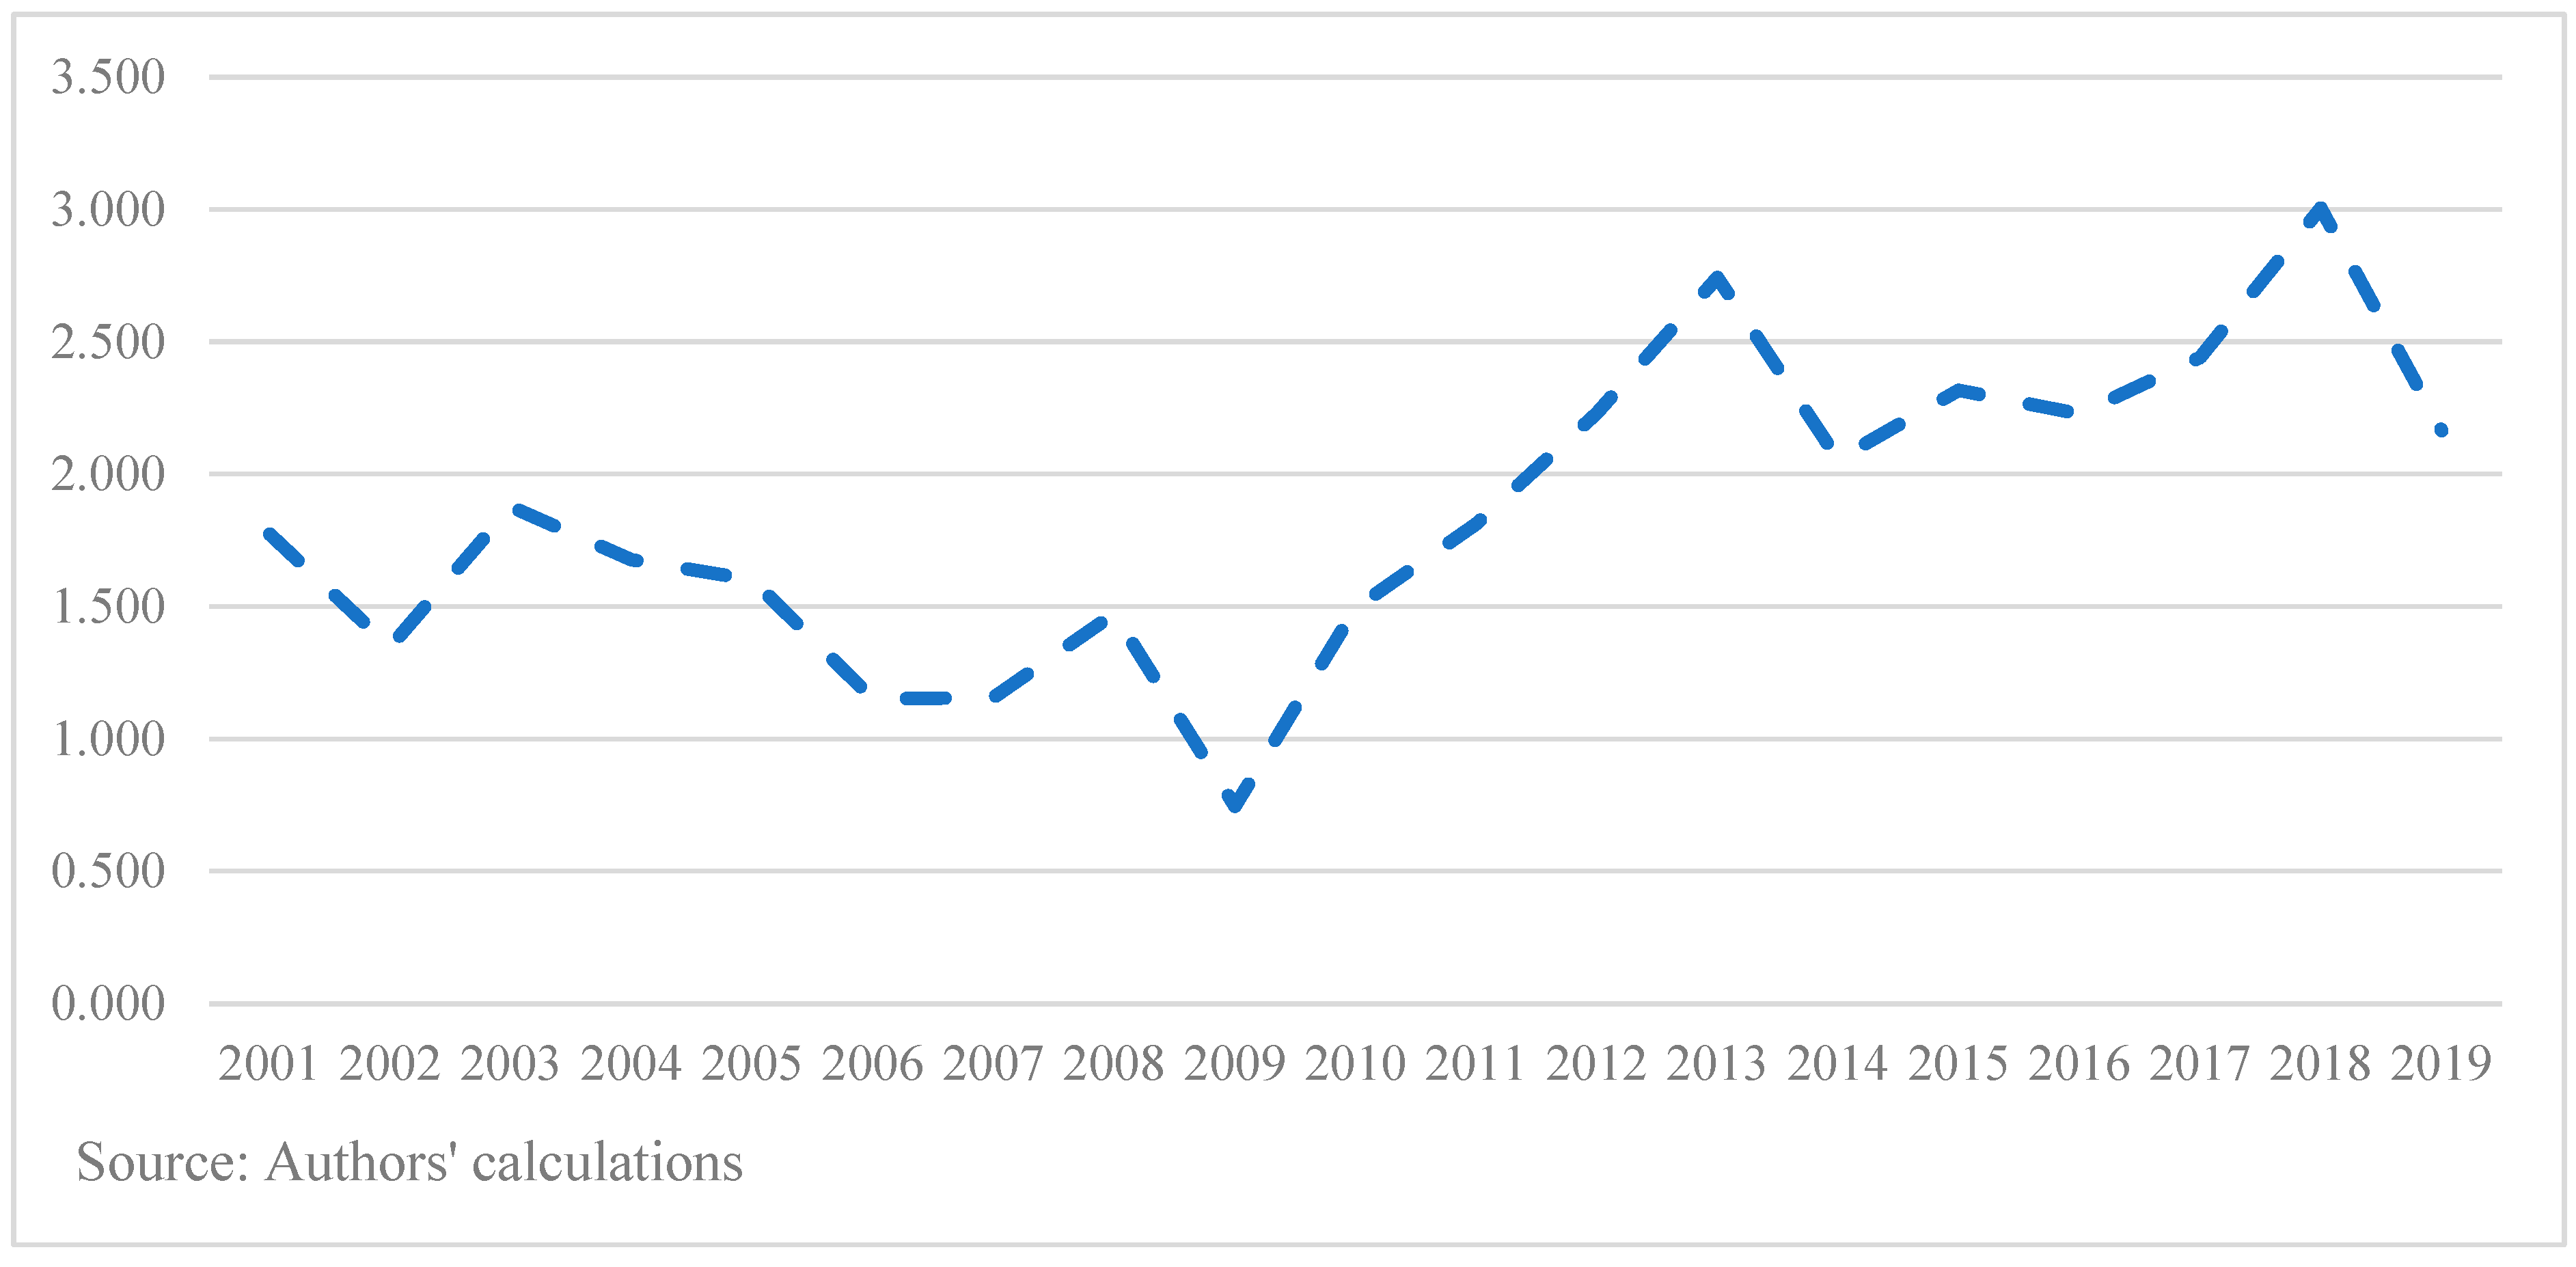
India’s comparative advantage for iron and steel (HS Code 72) in the ROK market improved from 1.7 in 2001 to 2.2 in 2019, as illustrated in Figure 12. The other main exporting countries for this product category are Japan, China, Indonesia, and Taipei. The share of India in the ROK’s imports of HS Code 72 products improved from 1% in 2001 to 2.1% in 2019, while that of Japan decreased from 48.9% to 33.5% during the same period. For China, this share shot up from 8.3% to 34.3% during the same period.
In the case of machinery and mechanical appliances (HS Code 84), India did not have the comparative advantage in the ROK as shown in Figure 13. The MCA value had been less than zero throughout the study period.
India has a comparative advantage of cotton (HS Code 52) in Korea because the MCA has been greater than one throughout the study period (see Figure 14). The value of the MCA reached a peak in 2003 and has decreased with ups and downs. The share of India in Korea’s cotton market was 17.6% in 2002, increasing to 19.2% in 2019. Other suppliers of cotton to the ROK are Vietnam, the USA, and China. The share of China in Korea’s cotton sourcing has decreased from 23.7% to 17% during the same period, while the share of Vietnam has significantly increased from less than 1% to 12.5%. It seems that India has a large market share in Korea, but Vietnam has emerged as a main competitor with a gaining power in the Korean market.
4.3. Grubel–Lloyd Index Results and Analysis
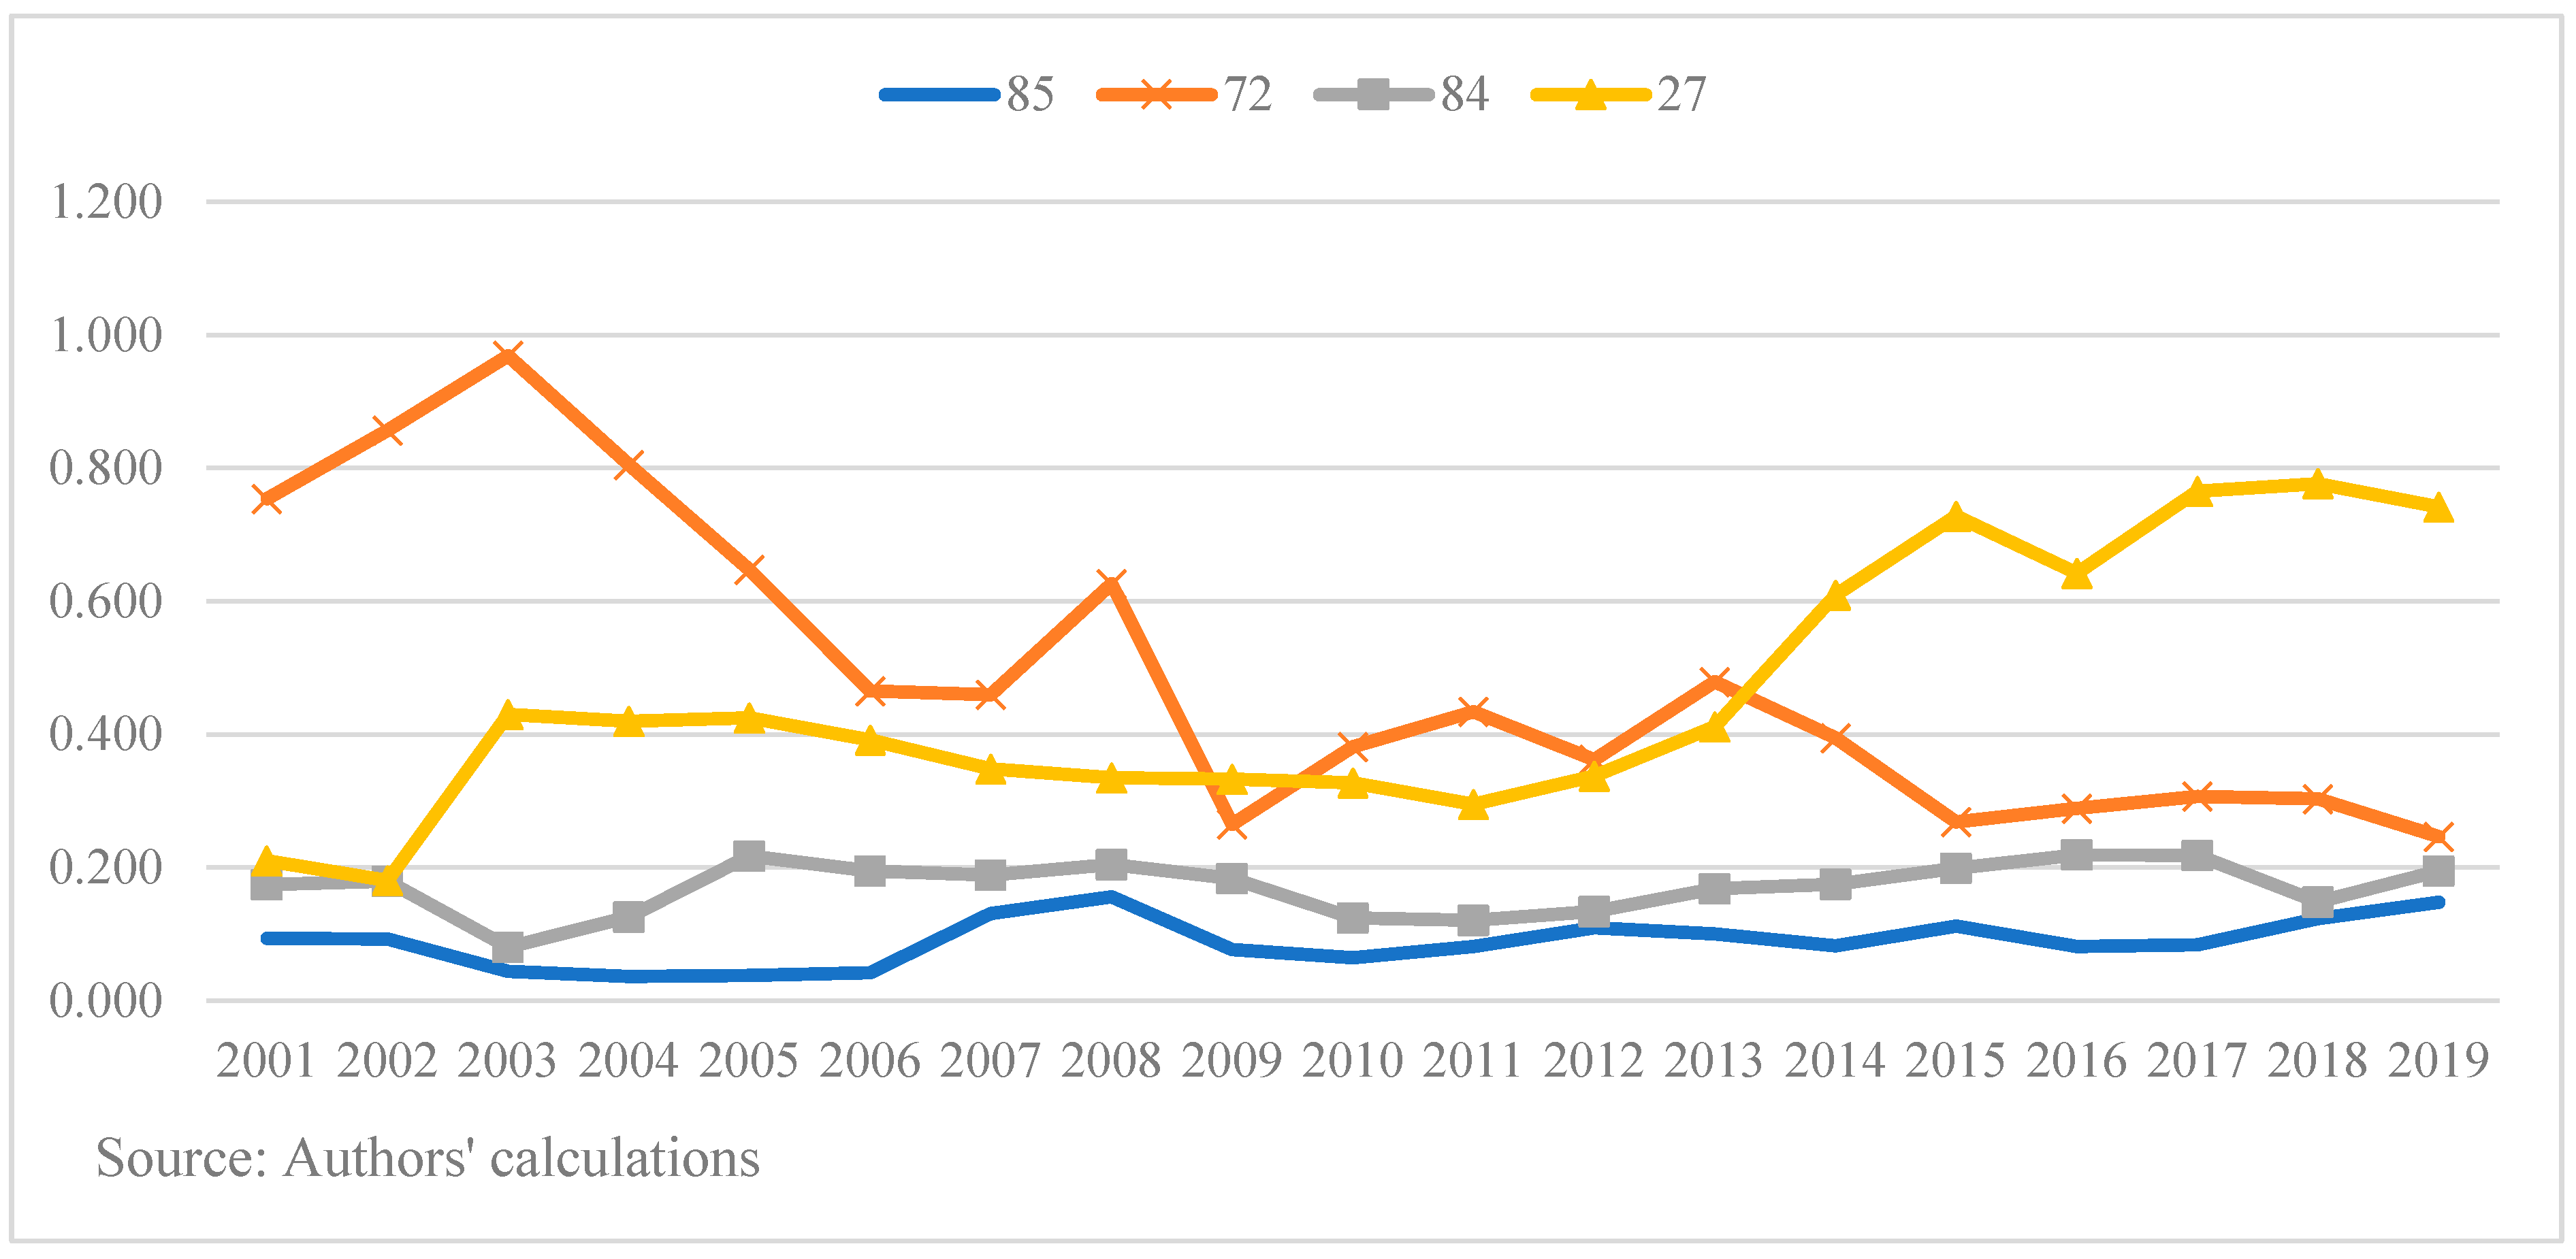
Although a major part of India–ROK trade is inter-industry, we find evidence of intra-industry trade in some important product categories, such as electrical machinery (HS Code 85), iron and steel (HS Code 72), vehicles (HS Code 84), and mineral fuels (HS Code 27). We calculate the Grubel–Lloyd index to identify the trend that emerges in intra-industry trade for these sectors. If India and the ROK want a deeper economic collaboration, it is essential to put emphasis on intra-industry trade and stress the importance of participating in each other’s supply chain network. As evident from transnational firm-level activities, the multinational firms find it profitable to allocate a value-added production network across global geography (Feenstra 1998; Kemeny and Rigby 2012). It is to be noted that over the last three decades, in comparison to the final manufactured output, trade in intermediate inputs has grown faster (Feenstra 1998; Gereffi 1999).
As illustrated in Figure 15, except for iron and steel (HS Code 72), the GLI increased in all the other three product categories between 2001 and 2019. For mineral oils (HS Code 27), the intra-industry level of trade improved significantly between the ROK and India during the 2001–2019 period. The higher values of the GLI and the concomitant increase in India’s trade deficit indicate that although India and the ROK have been trading in similar commodities, the value of the ROK goods is much higher compared to the goods manufactured in India. This also suggests that Indian firms manufacturing electrical machinery, vehicles, and mineral fuels are less productive than their counterparts in the ROK. Plouffe (2017) finds that exporting firms are more productive and favor liberalization. By contrast, less productive firms are less competitive and demand protectionism. For India, the majority of manufacturing firms are non-exporting. Considering data from the Center for Monitoring Indian Economy, Gupta et al. (2018) found that most of India’s manufacturing sector firms are not exporting. Between 1989 and 2015, India had 3391 non-exporting firms and only 465 firms were exporting. All the policy initiatives, such as “Make-in-India” and “Self-Reliant India”, are part of government-led initiatives seeking to help the country’s industry become productive and, eventually, make it export-oriented (Banik et al. 2021). The GOI has categorically adopted the stance that India is not aiming for import substitution but attempting to support the country’s industry to become competitive and follow the East Asian export-led development strategy (as opposed to the import substitution policy pursued by the Latin American economies).
5. Services Trade
The ROK’s services exports to India have steadily expanded from USD 748 million in 2005 to USD 2271 million in 2019. India’s share in the ROK’s total services exports increased from 1.5% to 2.2% during the same period. As illustrated in Table 4, the ROK’s main services exports to India include transport and travel sector services, followed by other business services,13 telecommunications, computers, and information services. More specifically, as of 2019, the share of transport and travel services exports to India was 22.81% and 24.83% of the ROK’s total services exports to India, respectively. The share of construction services increased from 16.31% in 2005 to around 30% in 2013 but dipped to 16.16% in 2019. The contribution of other business services improved from 12.17% in 2005 to 15.32% in 2019. The share of telecommunications, computers, and information services exports in the ROK’s services exports to India increased substantially, jumping from 1% in 2005 to 10.5% in 2019.
India’s service exports to the ROK increased from USD 948 million in 2005 to USD 3965 million in 2019 (see Table 5). India exported transport, travel, telecommunications, computer and information services, and other business services to the ROK. As of 2019, other business services had the highest share of 30.8% in India’s service exports to the ROK. The share of travel, telecommunications, and computer and information services was 26.8% and 24.1%, respectively.
Analyzing the Comparative Advantage for Service Trade
We compute elements of the comparative advantage in services trade using the MCA. Table 6 illustrates that the ROK has a comparative advantage in the service categories of manufacturing services on physical inputs owned by others and construction. This is because over 80% of the ROK’s direct investment in India is in the manufacturing sector according to data published by the Export–Import Bank of Korea. Recently, the ROK has gained a comparative advantage in the export of telecommunications and computer and information services to India, with the MCA greater than one between 2014 and 2019. In addition, the ROK has a comparative advantage in travel over India throughout the study period because the MCA is greater than one.
Table 7 demonstrates that India has a comparative advantage in the majority of the services exports to the ROK. The MCA is greater than one for the majority of the services categories, including, telecommunications, computer and information services, other business services, and insurance and pension services. For travel and financial services, the MCA is greater than one, except for a few years.
6. Trade Policy Framework
The trade policy framework primarily relates to the application of tariffs and NTMs.15 For NTMs, we used the Global Trade Alert database, which reflects the total number of NTMs in place for 2020. Data on tariffs data were obtained from the World Integrated Trade Solution database of the World Bank.
6.1. Tariffs
A quick examination of the tariff barriers on the merchandise items of importance between India and the ROK reveals that India continues to impose tariffs on items of interest to the ROK. However, the ROK’s tariffs on most items of interest to India were zero. Table 8 lists the important tradable (top five items in value terms) and the bound and applied tariff rates for these items. Thus, room for negotiation exists and reducing tariff barriers to zero from the present level for the four major export items, namely petroleum oils and oils from bituminous minerals, vehicle parts and accessories (not elsewhere classified (nec)), vehicle parts and accessories (gearbox), and vinyl chloride and other halogenated olefin polymers, can create a gain of USD 111.23 million for the ROK (see Table 9). To estimate the gains from a tariff reduction, we use the Trade Intelligence and Negotiation Advisor (TINA), a software developed by the UNESCAP. The tariffs on electronic integrated circuits are already zero. Similarly, the reduction in the existing tariffs on petroleum oils and oils from bituminous minerals that the ROK imports from India would create a trade value of USD 28 million. These numbers are for 2019 and are calculated assuming that the elasticity of demand for these commodities is constant. As the ROK will gain from a further reduction in tariffs, going forward, India can negotiate for market access in services (in which it has a comparative advantage) to provide market access to merchandise items (where the ROK has a comparative advantage).
6.2. NTMs
While reducing tariffs is important, reducing NTMs is even more critical as the WTO obligations require member countries to only reduce tariffs. NTMs become non-tariff barriers (NTBs) when used solely to restrict market access. NTMs are allowed under the WTO framework. For example, Antidumping Measures, which are a predominant form of an NTM, were introduced during the Tokyo Round of GATT Negotiations (1973–1979). The idea was to prevent “predatory pricing”. Antidumping Measures became an NTB when they were used to prevent market access and not to stop predatory pricing policies. NTBs can also affect the free flow of imported medicines. As tariff increases are not permissible, many countries now impose NTBs under the garb of NTMs to protect their domestic economies (Banik 2001). Another example of an NTB is sanitary and phytosanitary standards. If a country sets their health standards at levels higher than those prescribed internationally, then sanitary and phytosanitary standards can be a case for NTBs. For example, in the case of tobacco exports, the internationally permissible level of DDT residue is four parts per million, while Japan and the US have set their permissible levels at less than one part per million (ibid.) to block tobacco exports from other countries.
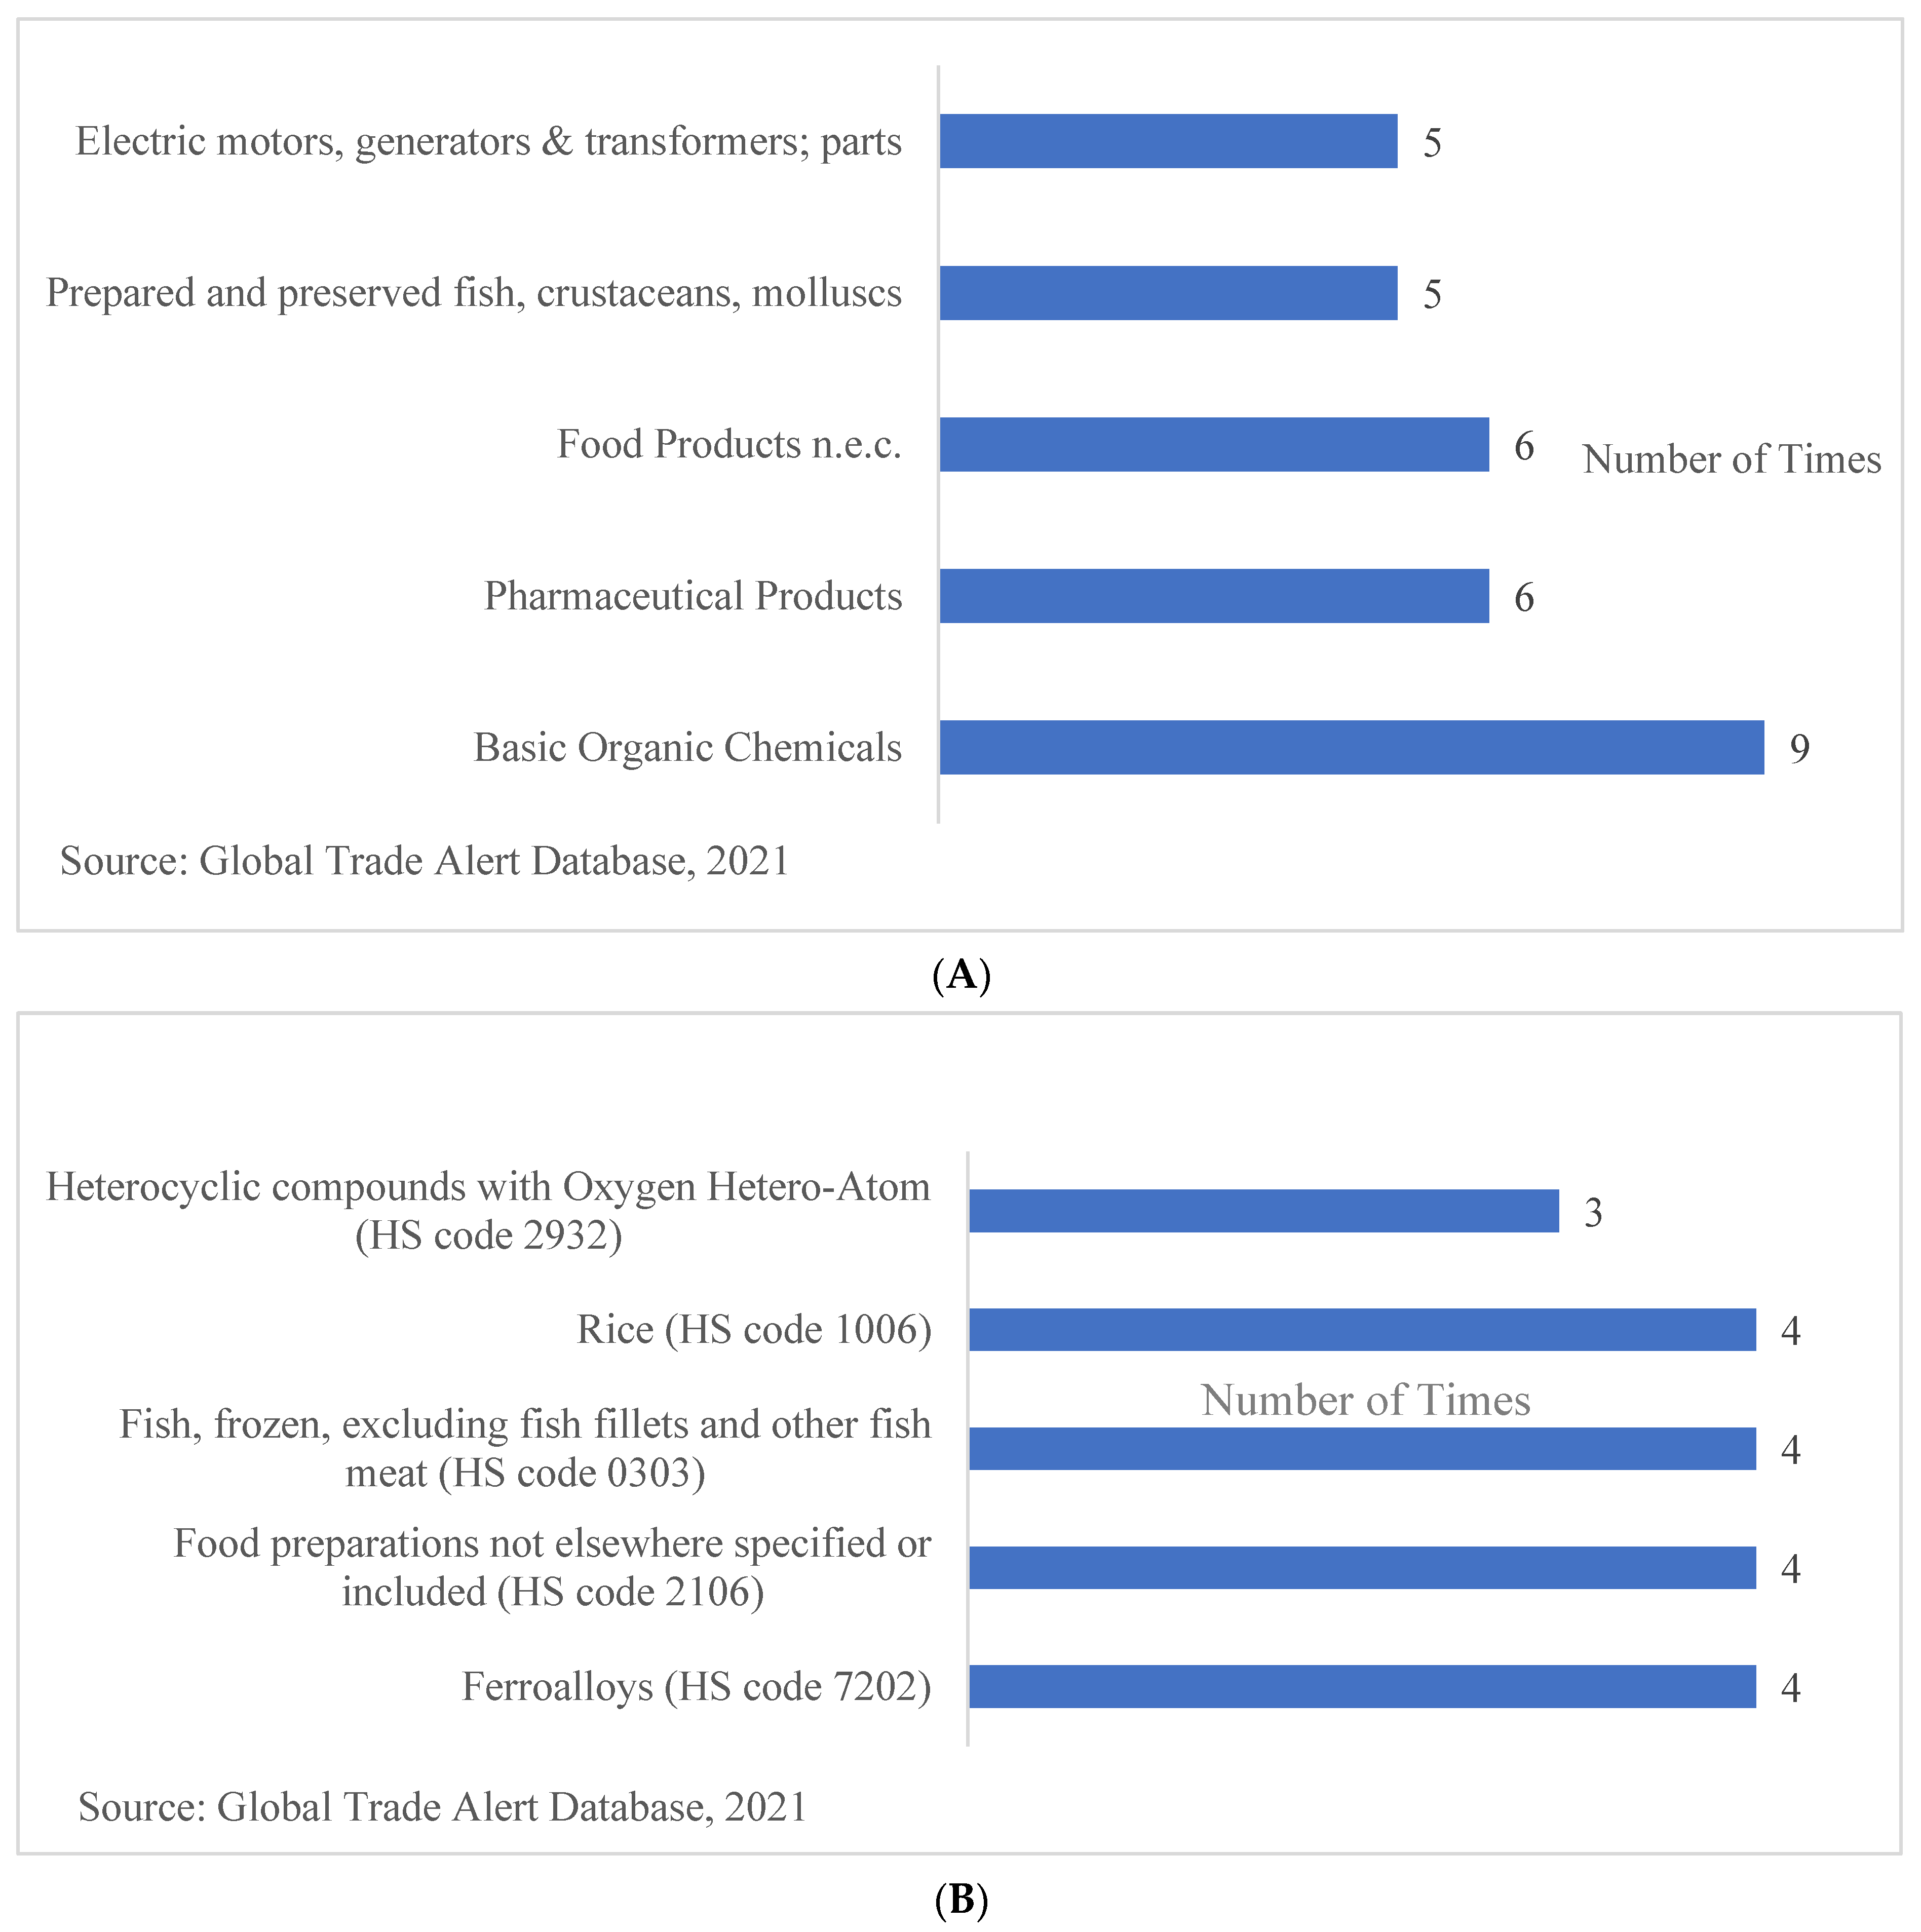
Below, we explore the sectors affected by NTMs in the context of India–ROK trade. Considering India’s exports to the ROK, basic organic chemicals, pharmaceutical products, food products, and electric motors, generators, and transformer parts are the sectors that are the most affected. Item-wise, ferro-alloys, frozen fish, rice, and heterocyclic compounds such as diazepam and vitamins are impacted the most (see Figure 16A,B). The numbers indicate the number of state interventions that impacted the sectors and items between 2009 and 2020.
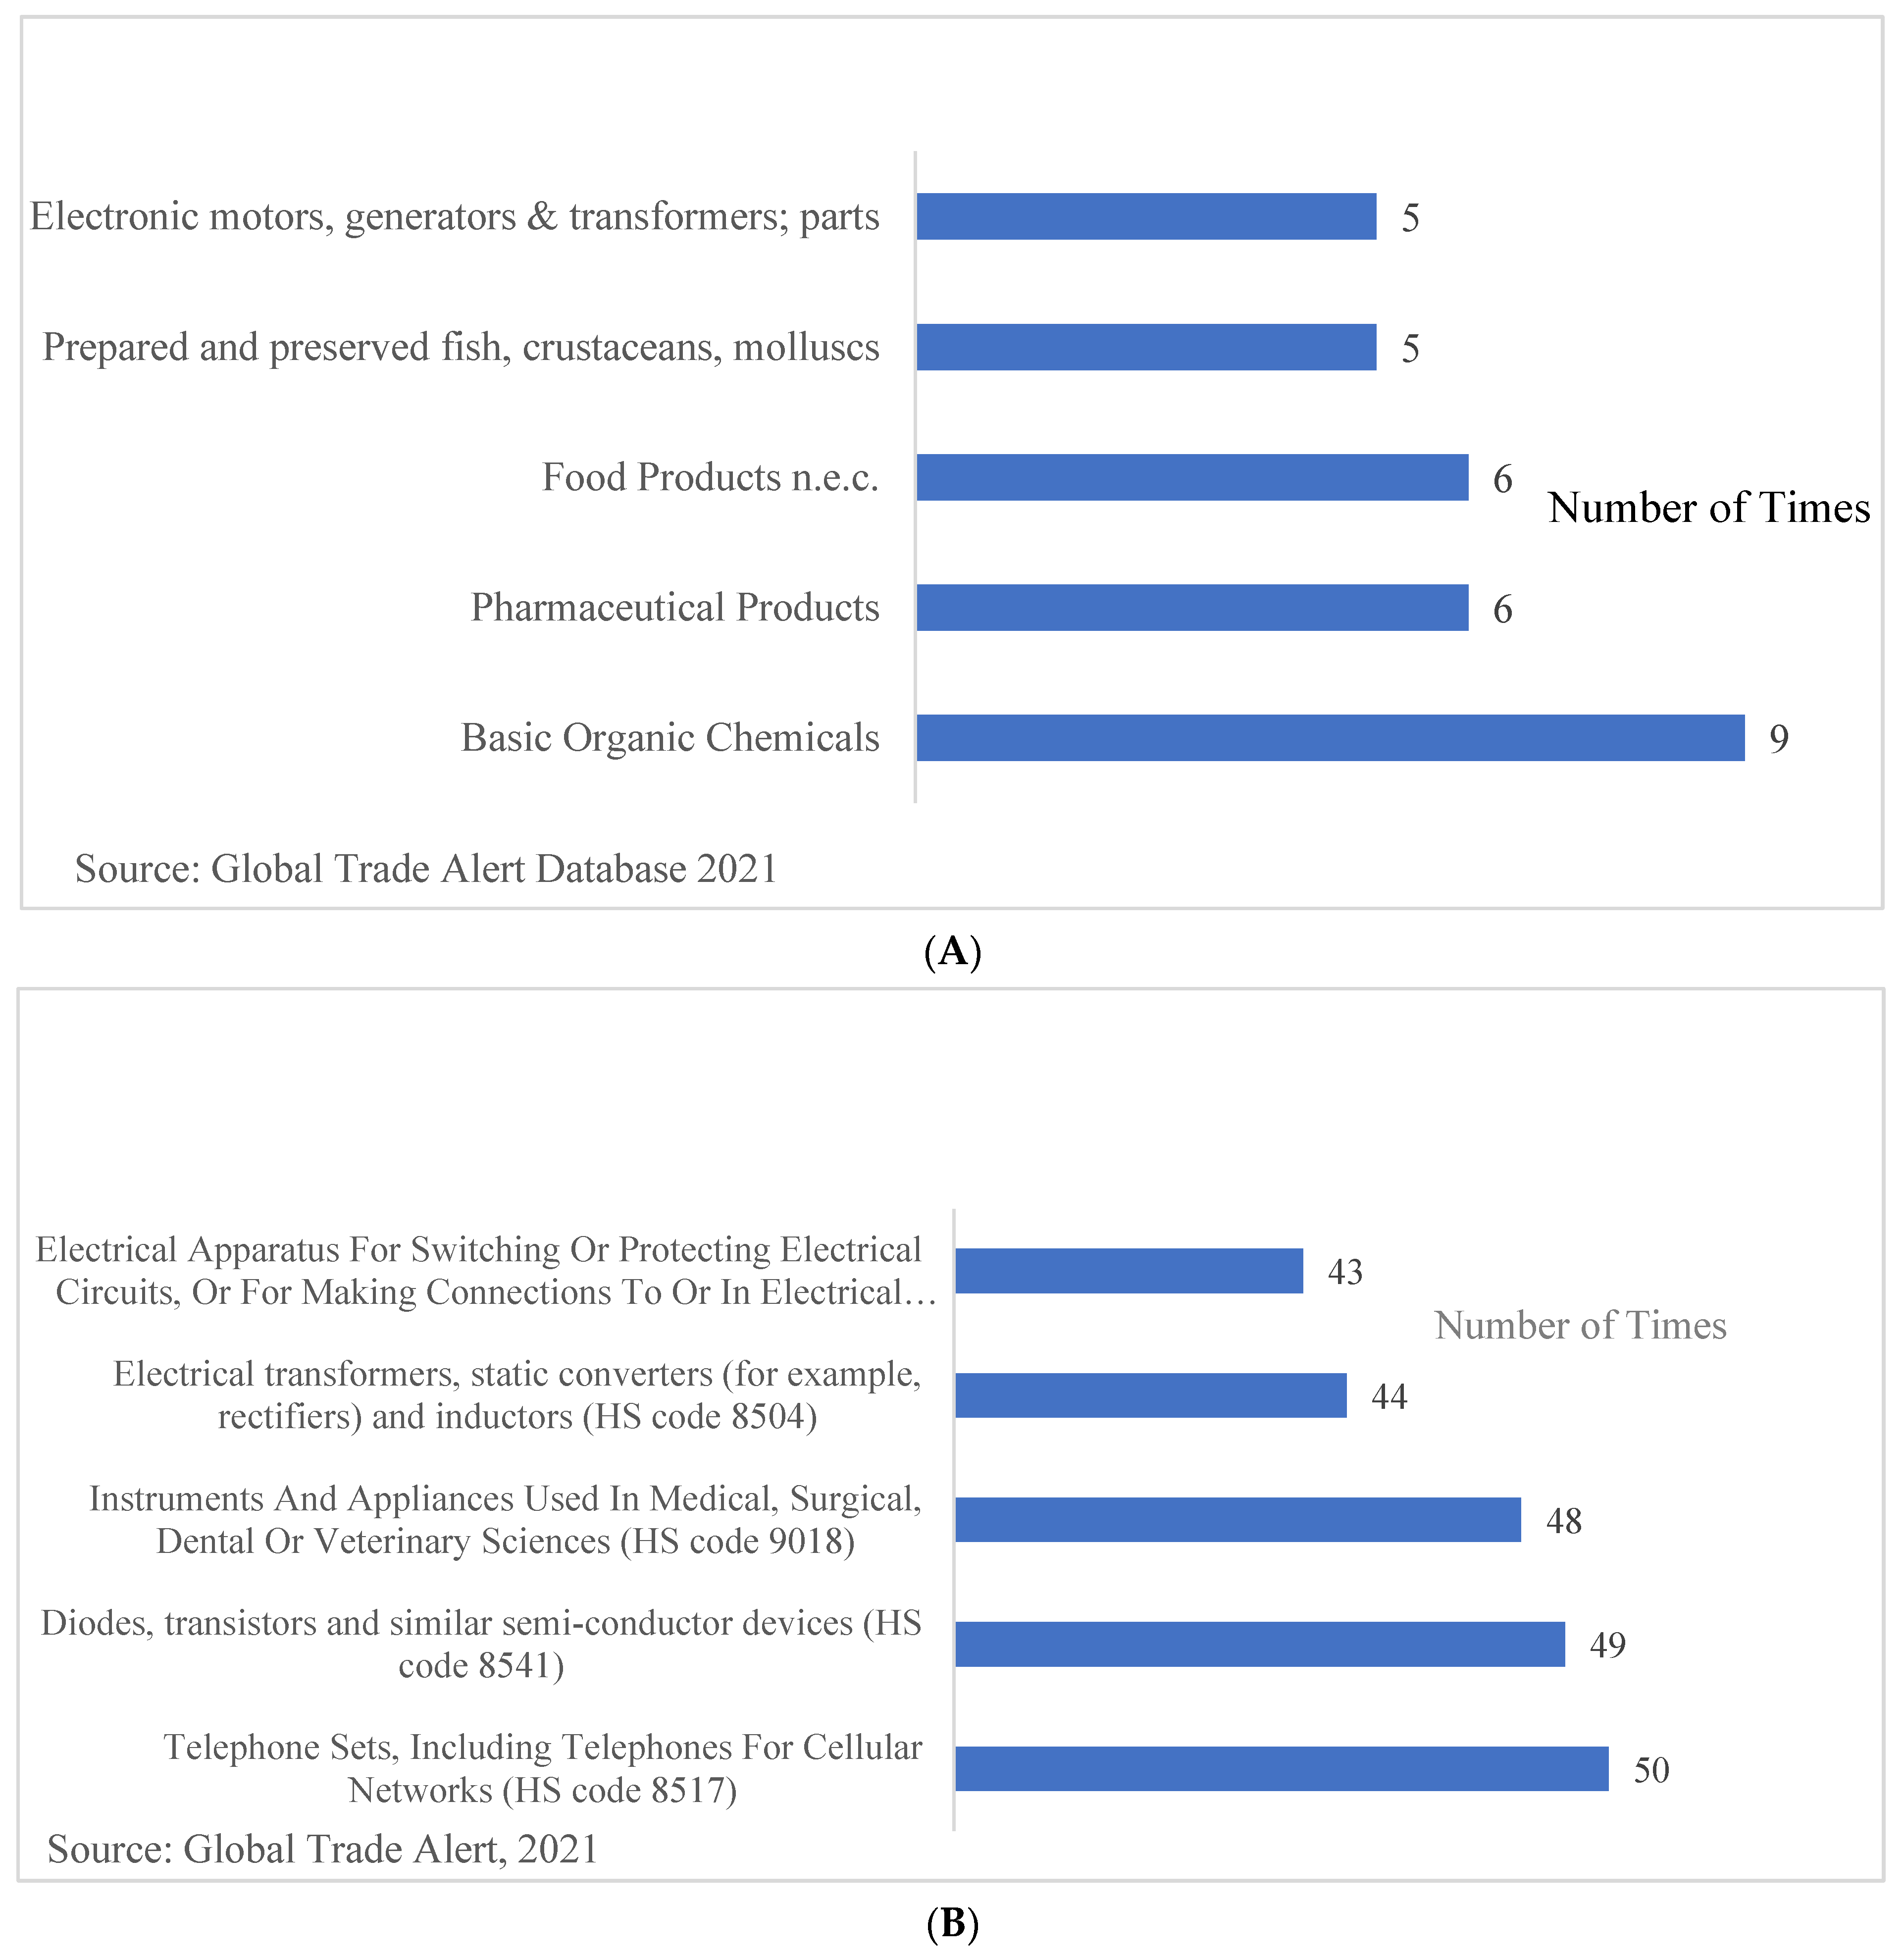
Similarly, considering the ROK’s exports to India, we find that items such as telephone sets, diodes and transistors, electrical transformers, and apparatus are the most affected. Sector-wise, iron and steel, basic organic chemicals, electronic valves and tubes, medical and surgical equipment, electric motors, generators, and transformer parts are impacted the most (see Figure 17A,B). The numbers indicate the number of state interventions that impacted the sectors and items between 2009 and 2020.
7. Conclusions
The ROK has emerged as an important trading partner for India. These two countries are planning to engage with each other in a big way through India’s “Look East Policy” and the ROK’s “New Southern Policy”. In this paper, we identify the sectors, both in trade and services, where India and the ROK have a comparative advantage. We argue that future negotiations involving the items where these countries have comparative advantages will help to augment trade. As of 2020–2021, trade between the ROK and India achieved USD 17.5 billion. In particular, post-Galwan crisis in 2020–2021, where India and China engaged in an aggressive face-off, the ROK can emerge as a trusted partner for engaging in digital trade, particularly in the presence of data privacy issues. Additionally, for the ROK’s electronic, automobile, and consumer durable products, such as white goods, India can serve as a big market. There is a certain amount of demand which is created for these items that the ROK specializes in, with the rise in consumerism, income, and aspiration of the young population in India. Likewise, in the presence of the current geo-political tension involving China and the US, there is an opportunity for India to emerge as a global destination hub. For this, there is a need to reform the manufacturing supply chain by bringing down tariffs and NTBs. While India primarily exports raw materials to the ROK, the latter usually exports finished manufactured goods to India. We examined the tariffs and non-tariff measures in the context of India–ROK trade and the gains from trade that will result from a reduction in tariff barriers. Among the exports from India that are facing market access issues in the ROK are bovine meat, grapes, pomegranate, okra, and eggplants, belonging to food and vegetable categories, and steel products. Likewise, for the ROK, four export items, namely petroleum oils and oils from bituminous minerals, vehicle parts and accessories (not elsewhere classified (nec)), vehicle parts and accessories (gear box), and vinyl chloride and other halogenated olefin polymers, are facing high tariff barriers in India. Our results suggest that India has a comparative advantage in services and the ROK has a comparative advantage in goods. Considering goods, reducing tariff barriers to zero from the present level for the major four export items, namely petroleum oils and oils from bituminous minerals, vehicle parts and accessories (not elsewhere classified (nec)), vehicle parts and accessories (gear box), and vinyl chloride and other halogenated olefin polymers, is going to create a gain of USD 111.23 million for the ROK. Likewise, if the ROK were to reduce the existing tariffs on petroleum oils and oils from bituminous minerals that it imports from India, it is going to create a trade value of USD 28 million. To minimize the impact of NTBs, there is a need for product standardization and to set up mutual recognition agreements. For better identification of these NTBs on a real-time basis, there is a need for a business-to-business interaction between these two countries, so that the information can be shared with the policymakers from both these countries. Relating to services trade, India has a comparative advantage in the majority of the services exports to the ROK, such as telecommunications, computer and information services, other business services, and insurance and pension services. Indian software firms can provide information and technology services for Korean small and medium sector enterprises. A direction of future negotiation will need India giving market access to the ROK’s merchandise items and the ROK giving access to India’s services.
Author Contributions
Conceptualization, M.K. and N.B.; methodology, M.K.; formal analysis, M.K. and N.B.; writing—original draft preparation, M.K. and N.B.; writing—review and editing, M.K. and N.B. All authors have read and agreed to the published version of the manuscript.
Funding
The authors acknowledge that this work was supported by the National Research Foundation of Korea Grant funded by the Korean Government (NRF-2017S1A6A3A02079749). Misu Kim acknowledges that this work was supported by the Hankuk University of Foreign Studies.
Institutional Review Board Statement
Not applicable.
Informed Consent Statement
Not applicable.
Data Availability Statement
Not applicable.
Conflicts of Interest
The authors declare no conflict of interest.
Appendix A
| MCA of Korea’s Goods Export to India | |||||||||
| HS Code 85 | HS Code 72 | HS Code 84 | HS Code 39 | HS Code 29 | HS Code 87 | HS Code 27 | HS Code 90 | HS Code 73 | |
| 2001 | 4.397 | 3.251 | 2.117 | 3.512 | 1.338 | 6.112 | 0.000 | 1.443 | 2.365 |
| 2002 | 3.037 | 2.945 | 2.683 | 3.851 | 1.143 | 8.563 | 0.000 | 1.641 | 3.370 |
| 2003 | 5.176 | 1.848 | 1.650 | 3.118 | 0.757 | 8.219 | 0.002 | 1.141 | 2.185 |
| 2004 | 4.035 | 2.135 | 1.976 | 2.754 | 0.744 | 8.496 | 0.001 | 1.057 | 2.293 |
| 2005 | 4.904 | 1.962 | 1.586 | 3.466 | 0.935 | 8.685 | 0.000 | 1.030 | 1.903 |
| 2006 | 3.668 | 3.712 | 1.671 | 3.038 | 0.837 | 8.391 | 0.232 | 0.944 | 1.607 |
| 2007 | 1.866 | 3.802 | 2.031 | 2.934 | 1.152 | 10.176 | 0.250 | 1.197 | 3.356 |
| 2008 | 2.690 | 4.056 | 1.739 | 3.636 | 1.270 | 9.129 | 0.248 | 1.387 | 4.241 |
| 2009 | 1.716 | 4.128 | 1.325 | 3.558 | 1.384 | 7.414 | 0.384 | 1.335 | 1.837 |
| 2010 | 2.379 | 4.319 | 2.033 | 3.945 | 2.045 | 7.003 | 0.221 | 1.749 | 2.408 |
| 2011 | 2.130 | 4.797 | 2.132 | 4.038 | 2.181 | 6.160 | 0.207 | 1.665 | 1.905 |
| 2012 | 1.729 | 4.317 | 2.068 | 3.996 | 2.225 | 5.411 | 0.173 | 1.412 | 2.201 |
| 2013 | 2.301 | 5.446 | 2.039 | 4.513 | 2.762 | 5.708 | 0.141 | 1.594 | 2.541 |
| 2014 | 2.550 | 5.122 | 1.786 | 3.955 | 2.026 | 4.576 | 0.186 | 1.500 | 2.258 |
| 2015 | 2.277 | 4.678 | 1.605 | 3.383 | 1.181 | 3.794 | 0.193 | 1.455 | 2.299 |
| 2016 | 1.927 | 5.252 | 1.301 | 3.105 | 1.259 | 4.160 | 0.218 | 1.207 | 1.832 |
| 2017 | 1.918 | 5.753 | 1.208 | 3.006 | 1.450 | 3.644 | 0.196 | 1.150 | 2.156 |
| 2018 | 1.577 | 6.543 | 1.756 | 3.681 | 1.564 | 3.544 | 0.166 | 1.384 | 2.111 |
| 2019 | 1.712 | 6.324 | 1.538 | 3.390 | 1.741 | 4.940 | 0.161 | 1.416 | 2.102 |
| MCA of India’s Goods Export to Korea | |||||||||
| HS Code 76 | HS Code 27 | HS Code 29 | HS Code 72 | HS Code 84 | HS Code 52 | HS Code 85 | HS Code 23 | HS Code 26 | |
| 2001 | 0.293 | 0.000 | 2.671 | 1.773 | 0.196 | 29.243 | 0.099 | 20.907 | 4.308 |
| 2002 | 0.313 | 0.350 | 2.743 | 1.347 | 0.224 | 32.065 | 0.058 | 23.593 | 5.620 |
| 2003 | 0.422 | 0.283 | 2.144 | 1.877 | 0.204 | 39.553 | 0.059 | 22.695 | 7.387 |
| 2004 | 0.195 | 0.407 | 2.185 | 1.676 | 0.237 | 36.176 | 0.068 | 19.122 | 5.808 |
| 2005 | 0.235 | 0.954 | 2.248 | 1.602 | 0.236 | 29.067 | 0.066 | 13.615 | 5.701 |
| 2006 | 0.705 | 1.141 | 2.407 | 1.151 | 0.250 | 23.205 | 0.047 | 26.476 | 4.273 |
| 2007 | 0.280 | 1.018 | 3.326 | 1.156 | 0.348 | 21.756 | 0.070 | 24.086 | 4.936 |
| 2008 | 0.057 | 1.258 | 2.462 | 1.472 | 0.303 | 14.093 | 0.095 | 15.558 | 0.780 |
| 2009 | 1.533 | 1.971 | 2.313 | 0.746 | 0.256 | 11.781 | 0.068 | 5.669 | 1.685 |
| 2010 | 6.670 | 1.191 | 2.429 | 1.494 | 0.237 | 21.613 | 0.057 | 7.492 | 0.402 |
| 2011 | 3.209 | 1.271 | 2.911 | 1.812 | 0.218 | 11.904 | 0.100 | 8.234 | 0.680 |
| 2012 | 6.084 | 0.803 | 3.045 | 2.230 | 0.275 | 15.662 | 0.119 | 13.409 | 0.338 |
| 2013 | 7.919 | 0.641 | 3.148 | 2.742 | 0.323 | 16.761 | 0.112 | 14.637 | 0.523 |
| 2014 | 8.888 | 1.033 | 2.302 | 2.056 | 0.290 | 16.010 | 0.118 | 10.000 | 0.444 |
| 2015 | 10.433 | 0.641 | 3.202 | 2.316 | 0.350 | 19.162 | 0.129 | 9.558 | 0.155 |
| 2016 | 11.598 | 0.898 | 3.385 | 2.227 | 0.402 | 18.121 | 0.139 | 5.381 | 0.012 |
| 2017 | 12.766 | 0.775 | 3.228 | 2.440 | 0.328 | 17.392 | 0.124 | 5.313 | 0.813 |
| 2018 | 8.234 | 0.752 | 3.269 | 3.005 | 0.292 | 22.296 | 0.197 | 7.285 | 0.885 |
| 2019 | 14.323 | 0.674 | 3.810 | 2.165 | 0.415 | 20.310 | 0.211 | 7.644 | 0.923 |
| Grubel–Lloyd Index | |||||||||
| From Korea to India | From India to Korea | ||||||||
| HS Code 85 | HS Code 72 | HS Code 84 | HS Code 27 | HS Code 85 | HS Code 72 | HS Code 84 | HS Code 27 | ||
| 2001 | 0.093 | 0.754 | 0.174 | 0.210 | 0.062 | 0.538 | 0.099 | 0.580 | |
| 2002 | 0.092 | 0.857 | 0.179 | 0.180 | 0.051 | 0.630 | 0.109 | 0.000 | |
| 2003 | 0.044 | 0.969 | 0.080 | 0.430 | 0.015 | 0.748 | 0.084 | 0.065 | |
| 2004 | 0.036 | 0.805 | 0.126 | 0.419 | 0.023 | 0.682 | 0.084 | 0.022 | |
| 2005 | 0.038 | 0.647 | 0.217 | 0.425 | 0.022 | 0.637 | 0.113 | 0.000 | |
| 2006 | 0.042 | 0.465 | 0.195 | 0.391 | 0.026 | 0.409 | 0.139 | 0.691 | |
| 2007 | 0.131 | 0.460 | 0.188 | 0.348 | 0.064 | 0.378 | 0.153 | 0.803 | |
| 2008 | 0.156 | 0.626 | 0.205 | 0.335 | 0.063 | 0.566 | 0.150 | 0.657 | |
| 2009 | 0.077 | 0.265 | 0.183 | 0.333 | 0.063 | 0.259 | 0.191 | 0.635 | |
| 2010 | 0.064 | 0.381 | 0.124 | 0.327 | 0.035 | 0.390 | 0.114 | 0.714 | |
| 2011 | 0.081 | 0.434 | 0.121 | 0.295 | 0.064 | 0.424 | 0.088 | 0.625 | |
| 2012 | 0.109 | 0.362 | 0.134 | 0.337 | 0.083 | 0.402 | 0.091 | 0.867 | |
| 2013 | 0.100 | 0.479 | 0.168 | 0.411 | 0.074 | 0.498 | 0.143 | 0.814 | |
| 2014 | 0.082 | 0.394 | 0.175 | 0.610 | 0.065 | 0.392 | 0.147 | 0.736 | |
| 2015 | 0.112 | 0.268 | 0.199 | 0.728 | 0.059 | 0.277 | 0.145 | 0.894 | |
| 2016 | 0.081 | 0.289 | 0.219 | 0.642 | 0.070 | 0.296 | 0.197 | 0.969 | |
| 2017 | 0.084 | 0.307 | 0.218 | 0.765 | 0.056 | 0.302 | 0.207 | 0.942 | |
| 2018 | 0.123 | 0.303 | 0.148 | 0.777 | 0.106 | 0.298 | 0.121 | 0.954 | |
| 2019 | 0.148 | 0.247 | 0.195 | 0.742 | 0.113 | 0.222 | 0.159 | 0.981 | |
| 1 | The number in the parentheses refers to the HS Code at the six-digit tariff line. |
| 2 | The rules of origin, as the name suggests, determines from which country the products originate from. It is important as tariffs and NTMs in several cases depend upon a national source of a product. |
| 3 | Intra-industry trade can be of the horizontal intra-industry type which is trading in products which are similar in quality, for instance, the ROK exporting and importing automobiles from India. IIT can also be of a vertical intra-industry type where trade in high- and low-quality technology intensive items happens (Krugman 1981). |
| 4 | https://www.ideasforindia.in/topics/trade/india-s-trade-protectionism-and-low-productivity-vicious-cycle.html (accessed on 3 January 2022). |
| 5 | In September 2014, the Indian government announced the policy “Make in India” to establish India as the global manufacturing hub. Moreover, “Atmanirbhar Bharat Abhiyan” was also introduced in May 2020 for India’s self-reliance and economic revival in the time of the COVID-19 pandemic. |
| 6 | We selected nine items for the analysis because it is necessary to discuss iron and steel in this study. India has imposed anti-dumping on iron and steel from Korea (The Economic Times 2020). |
| 7 | Based on the definition of the World Trade Organization, commercial services include manufacturing services on physical inputs owned by others, maintenance and repair services, transport, travel, construction, insurance and pension services, financial services, charges for the use of intellectual property, telecommunications, computers and information services, other business services, and personal, cultural, and recreational services. (https://www.wto.org/english/res_e/statis_e/technotes_e.htm, accessed on 10 June 2021). |
| 8 | We chose six items as opposed to the five most important items as vehicles, the sixth most important item, are extensively exported by the ROK to India. |
| 9 | We are looking at the broad trend of India–Korea trade relations and hence we did not go for a higher degree of product disaggregation (beyond the HS Codes two-digit level). |
| 10 | Basically, the RCA and MCA are similar concepts. In some papers, the RCA has been employed to analyze the comparative advantage in a specific market, rather than measuring the comparative advantage in the world market. Please refer to Kuzmenko et al. (2022) for the RCA. |
| 11 | Theoretically, country a’s import from b is the same as country b’s export to a. Generally, exports are recorded on the FOB while imports are recorded on the CIF basis which could contribute to the difference. Therefore, we strictly follow this formula. |
| 12 | We also calculated the RSCA (Revealed Symmetric Comparative Advantage) and found that the RSCA exhibits a similar result with the use of the MCA. Hence, we do not report that in this article. |
| 13 | According to the WTO, other business services include trade-related services, operational leasing (rentals), and miscellaneous business, professional, and technical services such as legal, accounting, management consulting, public relations services, advertising, market research and public opinion polling, research and development services, architectural, engineering, and other technical services, agricultural, mining, and on-site processing (https://www.wto.org/english/res_e/statis_e/technotes_e.htm, accessed on 10 June 2021). |
| 14 | A: Manufacturing services on physical inputs owned by others; B: Maintenance and repair services n.i.e.; C: Transport; D: Travel; E: Construction; F: Insurance; G: Financial services; H: Charges for the use of intellectual property n.i.e.; I: Telecommunications, computer, and information services; J: Other business services; K: Personal, cultural, and recreational services. |
| 15 | Trade policy measures pertain to merchandized trade; therefore, in this section, we examine tariffs and NTMs impacting merchandise tradable items. The government measures impacting services trade are not available. |
References
- Ahmed, Shahid. 2011. India-Korea CEPA: An Assessment. Korea and the World Economy 12: 45–98. [Google Scholar]
- Balassa, Bela. 1965. Trade Liberalisation and “Revealed” Comparative Advantage. The Manchester School 33: 99–123. [Google Scholar] [CrossRef]
- Banik, Nilanjan. 2001. An Analysis of India’s Exports during the 1990s. Economic and Political Weekly 36: 4222–30. [Google Scholar]
- Banik, Nilanjan, Debashis Chakraborty, and Sampada Kumar Dash. 2021. IPR Waiver in Vaccines and Opportunities for India: What Does the Data Show? UNESCAP Working Paper. Bankok: United Nations Economic and Social Commission for Asia and the Pacific. [Google Scholar]
- Burange, L. G., Sheetal J. Chaddha, and Poonam Kapoor. 2010. India’s Trade in Services. The Indian Economic Journal 58: 44–62. [Google Scholar] [CrossRef]
- Cho, Choongjae, Young Chul Song, Jung-Mi Lee, and Chi Hyun Yun. 2018. An Analysis of the Competitiveness and Difficulties in Korea’s Export to India; Research Paper 18-15; Sejong: Korea Institute of International Economic Policy. (In Korean)
- Cho, Jun-Hyon. 2012. The Change and Tendency of TSI of Korean Industries after Korea-India CEPA. Journal of Industrial Economics and Business 25: 1559–85. (In Korean). [Google Scholar]
- Cho, Mee Jin, and Bo Young Choi. 2019. The Analysis on the Use of Korea-India CEPA. Journal of International Trade and Industry Studies 24: 51–75. (In Korean). [Google Scholar]
- Chuang, Yih-Chyi. 1998. Learning by doing, the technology gap, and growth. International Economic Review 39: 697–721. [Google Scholar] [CrossRef]
- Danna-Buitrago, Jenny P., and Remi Stellian. 2021. A New Class of Revealed Comparative Advantage Indexes. Open Economies Review 2021: 1–27. [Google Scholar] [CrossRef]
- Dash, Ranjan Kumar Das, and P. C. Parida. 2013. FDI, services trade and economic growth in India: Empirical evidence on causal links. Empirical Economics 45: 217–38. [Google Scholar] [CrossRef]
- Feder, Gershon. 1983. On exports and economic growth. Journal of Development Economics 12: 59–73. [Google Scholar] [CrossRef]
- Feenstra, Rober C. 1998. Integration of trade and disintegration of production in the global economy. Journal of Economic Perspectives 12: 31–50. [Google Scholar] [CrossRef] [Green Version]
- Gereffi, Gary. 1999. International trade and industrial upgrading in the apparel commodity chain. Journal of International Economics 48: 37–70. [Google Scholar] [CrossRef]
- Government of India (GOI). 2021. Brief on India-Korea Economic and Commercial Relations. Available online: https://www.indembassyseoul.gov.in/page/india-rok-trade-and-economic-relations/#:~:text=1.,mark%20for%20the%20first%20time.&text=Korea’s%20total%20FDI%20to%20India,2020%20stands%20at%20%246.94%20billion (accessed on 12 December 2021).
- Grubel, Herb, and Peter John Lloyd. 1975. Intra-Industry Trade: The Theory and Measurement of International Trade in Differentiated Products. New York: Wiley. [Google Scholar]
- Gupta, Apoorva, Ila Patnaik, and Ajay Shah. 2018. Exporting and Firm Performance: Evidence from India. NIPFP Working Paper No. 243. New Delhi: NIPFP. [Google Scholar]
- International Trade Center (ITC). 2020. Available online: https://intracen.org/resources/tools?it%5B126%5D=126 (accessed on 12 November 2021).
- Kemeny, Thomas, and David Rigby. 2012. Trading away what kind of jobs? Globalization, trade and tasks in the US economy. Review of World Economics 148: 1–16. [Google Scholar] [CrossRef] [PubMed] [Green Version]
- Kim, Nam Doo, Yongkul Won, Chaiwook Chun, and Hoon Chung. 1997. Changing Patterns of East Asia’s Trade and Direct Investment and a Policy Agenda; Seoul: Korea Institute of International Economic Policy, pp. 97–109. (In Korean)
- Kim, Tae-Heon. 2009. An Empirical Study on the Export Competitiveness of Korean Automobiles in the Local Chinese Market. International Area Studies Review 13: 583–611. (In Korean). [Google Scholar]
- Krugman, Paul R. 1981. Intraindustry Specialization and the Gains from Trade. Journal of Political Economy 89: 959–73. [Google Scholar] [CrossRef]
- Kuzmenko, Elena, Lenka Rumankova Irena Benesova, and Lubos Smutka. 2022. Czech Comparative Advantage in Agricultural Trade with Regard to EU-27: Main Developmental Trends and Peculiarities. Agriculture 12: 217. [Google Scholar] [CrossRef]
- Lee, Soon Chul. 2019. The Effect of the Korea-India CEPA and 3rd FTAs on the Bilateral Trade between Korea and India. Journal of International Trade and Industry Studies 24: 49–79. (In Korean). [Google Scholar]
- Nath, Hiranya K., and Binoy Goswami. 2018. India’s comparative advantages in services trade. Eurasian Economic Review 8: 323–42. [Google Scholar] [CrossRef]
- Pailwar, Veena, and Nirav R. Shah. 2009. Revealed comparative advantages for India in services trade. International Journal of Trade and Global Markets 2: 109–27. [Google Scholar] [CrossRef]
- Plouffe, Michael. 2017. Firm heterogeneity and trade-policy stances evidence from a survey of Japanese producers. Business and Politics 19: 1–40. [Google Scholar] [CrossRef] [Green Version]
- Sauve, Pierre, and Aaditya Mattoo, eds. 2003. Domestic Regulation and Service Trade Liberalization. Washington, DC: World Bank Publications. [Google Scholar]
- Shukla, Srijan. 2021. India’s Trade Protectionism and Low-Productivity Vicious Cycle. Available online: https://www.ideasforindia.in/topics/trade/india-s-trade-protectionism-and-low-productivity-vicious-cycle.html (accessed on 4 January 2022).
- The Economic Times. 2020. India imposes anti-dumping duty on certain steel products from China, Vietnam, Korea. The Economic Times, June 23. [Google Scholar]
- World Bank. 2020. World Development Indicators 2014. Washington, DC: The World Bank. [Google Scholar]
Figure 1.
Trade between India and the ROK.

Figure 2.
Service Trade between India and the ROK.

Figure 3.
ROK’s MCA in India for electrical machinery (HS Code 85).

Figure 4.
ROK’s MCA for iron and steel (HS Code 72) in India.

Figure 5.
ROK’s MCA for machinery and mechanical appliances (HS Code 84) in India.

Figure 6.
ROK’s MCA for plastics and articles thereof (HS Code 39) in India.

Figure 7.
ROK’s MCA for organic chemicals (HS Code 29) in India.

Figure 8.
ROK’s MCA for vehicles (HS Code 87) in India.

Figure 9.
India’s MCA for aluminum and articles thereof (HS Code 76) in the ROK.

Figure 10.
India’s MCA for mineral fuels (HS Code 27) in the ROK.

Figure 11.
India’s MCA for organic chemicals (HS Code 29) in the ROK.

Figure 12.
India’s MCA for iron and steel (HS Code 72) in the ROK.

Figure 13.
India’s MCA for machinery and mechanical appliances (HS Code 84) in the ROK.

Figure 14.
India’s MCA for cotton (HS Code 52) in the ROK.

Figure 15.
GLI between the ROK and India.

Figure 16.
(A) All state interventions of ROK affecting India’s exports; (B) India’s exports (item wise) impacted by harmful intervention by ROK.
Figure 16.
(A) All state interventions of ROK affecting India’s exports; (B) India’s exports (item wise) impacted by harmful intervention by ROK.

Figure 17.
(A) Sectors most affected by harmful interventions; (B) ROK’s exports (item wise) impacted by harmful intervention by India.
Figure 17.
(A) Sectors most affected by harmful interventions; (B) ROK’s exports (item wise) impacted by harmful intervention by India.


Table 1.
Trends in International Trade between India and the ROK.
| ROK’s Exports to India (USD mil) | Growth Rate of ROK’s Exports to India (%) | ROK’s Export to the World (USD mil) | Share of India in ROK’s Total Exports (%) | India’s Exports to ROK (USD mil) | Growth Rate of India’s Exports to ROK (%) | India’s Exports to the World (USD mil) | Share of ROK in India’s Total Exports (%) | |
|---|---|---|---|---|---|---|---|---|
| 2001 | 1136 | 150,430 | 0.8 | 457 | 43,878 | 1.0 | ||
| 2002 | 1256 | 10.6 | 162,466 | 0.8 | 623 | 36.2 | 50,097 | 1.2 |
| 2003 | 2409 | 91.8 | 193,817 | 1.2 | 663 | 6.4 | 59,360 | 1.1 |
| 2004 | 3363 | 39.6 | 253,844 | 1.3 | 970 | 46.2 | 75,904 | 1.3 |
| 2005 | 4412 | 31.2 | 284,418 | 1.6 | 1519 | 56.7 | 100,352 | 1.5 |
| 2006 | 4891 | 10.9 | 325,457 | 1.5 | 2321 | 52.8 | 121,200 | 1.9 |
| 2007 | 5437 | 11.2 | 371,477 | 1.5 | 2462 | 6.1 | 145,898 | 1.7 |
| 2008 | 8350 | 53.6 | 422,003 | 2.0 | 3773 | 53.2 | 181,860 | 2.1 |
| 2009 | 8229 | −1.4 | 363,531 | 2.3 | 3772 | 0.0 | 176,765 | 2.1 |
| 2010 | 9922 | 20.6 | 466,380 | 2.1 | 3634 | −3.7 | 220,408 | 1.6 |
| 2011 | 12,362 | 24.6 | 555,208 | 2.2 | 4549 | 25.2 | 301,483 | 1.5 |
| 2012 | 13,675 | 10.6 | 547,854 | 2.5 | 4076 | −10.4 | 289,564 | 1.4 |
| 2013 | 12,426 | −9.1 | 559,648 | 2.2 | 4495 | 10.3 | 336,611 | 1.3 |
| 2014 | 13,437 | 8.1 | 573,091 | 2.3 | 4794 | 6.7 | 317,544 | 1.5 |
| 2015 | 13,085 | −2.6 | 526,900 | 2.5 | 3603 | −24.9 | 263,889 | 1.4 |
| 2016 | 12,213 | −6.7 | 495,465 | 2.5 | 3464 | −3.8 | 260,963 | 1.3 |
| 2017 | 16,084 | 31.7 | 573,716 | 2.8 | 4378 | 26.4 | 295,862 | 1.5 |
| 2018 | 16,441 | 2.2 | 605,169 | 2.7 | 4817 | 10.0 | 323,997 | 1.5 |
| 2019 | 16,111 | −2.0 | 542,333 | 3.0 | 4653 | −3.4 | 323,250 | 1.4 |
Source: International Trade Center and authors’ calculations.
Table 2.
Top trading commodities between India and the ROK in 2019.
| ROK’s Exporting Commodities to India | India’s Exporting Commodities to the ROK | |
|---|---|---|
| 1 | HS Code 85: Electrical machinery and equipment and parts thereof (18.1%) | HS Code 76: Aluminum and articles thereof (17.9%) |
| 2 | HS Code 72: Iron and steel (15.5%) | HS Code 27: Mineral fuels, mineral oils, and products of their distillation (17.0%) |
| 3 | HS Code 84: Machinery, mechanical appliances, nuclear reactors, and boilers (14.3%) | HS Code 29: Organic chemicals (9.6%) |
| 4 | HS Code 39: Plastics and articles thereof (10.5%) | HS Code 72: Iron and steel (6.7%) |
| 5 | HS Code 29: Organic chemicals (7.2%) | HS Code 84: Machinery, mechanical appliances, nuclear reactors, and boilers (4.3%) |
| 6 | HS Code 87: Vehicles other than railway or tramway rolling stock, and parts and accessories thereof (6.2%) | HS Code 52: Cotton (4.0%) |
| 7 | HS Code 27: Mineral fuels, mineral oils, and products of their distillation (4.8%) | HS Code 85: Electrical machinery and equipment and parts thereof (3.8%) |
| 8 | HS Code 90: Optical, photographic, cinematographic instruments (3.2%) | HS Code 23: Residues and waste from the food industries; prepared animal fodder (3.4%) |
| 9 | HS Code 73: Articles of iron or steel (1.9%) | HS Code 26: Ores, slag, and ash (2.8%) |
Table 3.
Commercial trade in services between India and the ROK.
| ROK’s Export of Commercial Services to India (USD mil) | ROK’s Export of Commercial Services to the World (USD mil) | Share of India in ROK’s Commercial Services Export (%) | India’s Export of Commercial Services to ROK (USD mil) | India’s Export of Commercial Services to the World (USD mil) | Share of ROK in India’s Commercial Services Export (%) | |
|---|---|---|---|---|---|---|
| 2005 | 1179 | 49,312 | 1.52% | 948 | 51,851 | 1.83% |
| 2006 | 897 | 55,503 | 1.62% | 1405 | 69,166 | 2.03% |
| 2007 | 1179 | 69,793 | 1.69% | 1677 | 86,235 | 1.94% |
| 2008 | 1654 | 89,839 | 1.84% | 2185 | 105,668 | 2.07% |
| 2009 | 1391 | 71,427 | 1.95% | 1983 | 92,484 | 2.14% |
| 2010 | 1703 | 81,932 | 2.08% | 2288 | 116,563 | 1.96% |
| 2011 | 1860 | 89,365 | 2.08% | 2652 | 137,906 | 1.92% |
| 2012 | 2066 | 101,899 | 2.03% | 2669 | 145,016 | 1.84% |
| 2013 | 2020 | 102,116 | 1.98% | 2728 | 148,699 | 1.83% |
| 2014 | 2260 | 110,757 | 2.04% | 3019 | 156,601 | 1.93% |
| 2015 | 2052 | 96,443 | 2.13% | 2854 | 155,701 | 1.83% |
| 2016 | 2001 | 93,893 | 2.13% | 2934 | 161,221 | 1.82% |
| 2017 | 2104 | 88,720 | 2.37% | 3500 | 184,621 | 1.90% |
| 2018 | 2160 | 97,957 | 2.21% | 3778 | 204,258 | 1.85% |
| 2019 | 2271 | 101,473 | 2.24% | 3965 | 213,702 | 1.86% |
Source: World Trade Organization (data.wto.org, accessed on 28 May 2021).
Table 4.
ROK’s Services Exports to India. (Unit: USD million, annual figures).
| 2005 | 2010 | 2015 | 2017 | 2019 | |
|---|---|---|---|---|---|
| A. Manufacturing services on physical inputs owned by others | 3 | 5 | 8 | 7 | 6 |
| B. Maintenance and repair services n.i.e. | 0 | 0 | 11 | 14 | 21 |
| C. Transport | 374 | 735 | 665 | 536 | 518 |
| D. Travel | 124 | 323 | 435 | 468 | 564 |
| E. Construction | 122 | 384 | 360 | 319 | 267 |
| F. Insurance and pension services | 2 | 8 | 11 | 18 | 12 |
| G. Financial services | 7 | 17 | 18 | 28 | 34 |
| H. Charges for the use of intellectual property n.i.e. | 17 | 42 | 107 | 136 | 134 |
| I. Telecommunications, computer, and information services | 8 | 35 | 140 | 212 | 238 |
| J. Other business services | 91 | 147 | 278 | 345 | 348 |
| K. Personal, cultural, and recreational services | 1 | 7 | 18 | 22 | 29 |
| Total commercial services | 748 | 1703 | 2052 | 2104 | 2271 |
| Share of India in ROK’s total services exports | 1.5% | 2.1% | 2.1% | 2.4% | 2.2% |
Source: WTO Statistics (2021).
Table 5.
India’s Services Exports to the ROK. (Unit: USD million, annual figures).
| 2005 | 2010 | 2015 | 2017 | 2019 | |
|---|---|---|---|---|---|
| A. Manufacturing services on physical inputs owned by others | 0 | 0 | 15 | 11 | 22 |
| B. Maintenance and repair services n.i.e. | 0 | 0 | 2 | 3 | 3 |
| C. Transport | 154 | 355 | 340 | 430 | 509 |
| D. Travel | 253 | 517 | 714 | 1000 | 1062 |
| E. Construction | 2 | 4 | 9 | 15 | 19 |
| F. Insurance and pension services | 17 | 39 | 38 | 50 | 49 |
| G. Financial services | 13 | 77 | 66 | 58 | 60 |
| H. Charges for the use of intellectual property n.i.e., | 6 | 5 | 15 | 22 | 28 |
| I. Telecommunications, computer, and information services | 229 | 642 | 811 | 842 | 956 |
| J. Other business services | 273 | 632 | 823 | 1039 | 1222 |
| K. Personal, cultural, and recreational services | 2 | 18 | 22 | 27 | 36 |
| Total commercial services | |||||
| Share of ROK in India’s total services exports | 1.8% | 2.0% | 1.8% | 1.9% | 1.9% |
Source: WTO Statistics.
Table 6.
ROK’s MCA in Services Exports to India14.
Table 6.
ROK’s MCA in Services Exports to India14.
| A | B | C | D | E | F | G | H | I | J | K | |
|---|---|---|---|---|---|---|---|---|---|---|---|
| 2005 | - | - | 0.911 | 1.612 | 16.302 | 0.044 | 0.648 | 2.035 | 0.436 | 0.539 | 0.766 |
| 2006 | - | - | 0.867 | 1.521 | 20.032 | 0.077 | 0.512 | 1.969 | 0.663 | 0.488 | 2.402 |
| 2007 | - | - | 0.843 | 1.459 | 28.400 | 0.058 | 0.451 | 1.193 | 0.459 | 0.571 | 1.819 |
| 2008 | - | - | 0.920 | 1.503 | 30.568 | 0.049 | 0.283 | 0.830 | 0.331 | 0.357 | 0.813 |
| 2009 | - | - | 0.771 | 1.658 | 24.148 | 0.014 | 0.214 | 0.987 | 0.425 | 0.357 | 0.090 |
| 2010 | - | - | 0.977 | 1.912 | 24.014 | 0.099 | 0.156 | 1.069 | 0.601 | 0.358 | 0.104 |
| 2011 | - | - | 0.748 | 1.812 | 27.093 | 0.062 | 0.139 | 1.248 | 0.881 | 0.428 | 1.668 |
| 2012 | 12.505 | 1.234 | 0.726 | 1.928 | 33.133 | 0.047 | 0.202 | 0.708 | 0.811 | 0.386 | 1.330 |
| 2013 | 13.835 | 0.000 | 0.668 | 2.090 | 25.529 | 0.079 | 0.120 | 0.754 | 0.960 | 0.426 | 0.975 |
| 2014 | 15.546 | 0.993 | 0.636 | 1.843 | 28.059 | 0.092 | 0.184 | 0.792 | 1.241 | 0.524 | 0.623 |
| 2015 | 16.488 | 2.029 | 0.724 | 1.668 | 21.410 | 0.120 | 0.329 | 1.215 | 2.097 | 0.530 | 0.748 |
| 2016 | 7.872 | 2.068 | 0.666 | 1.766 | 21.739 | 0.107 | 0.240 | 1.290 | 2.067 | 0.547 | 0.764 |
| 2017 | 11.130 | 1.829 | 0.623 | 1.683 | 17.296 | 0.190 | 0.320 | 1.384 | 2.317 | 0.646 | 0.680 |
| 2018 | 11.802 | 1.252 | 0.584 | 1.722 | 11.131 | 0.131 | 0.600 | 1.235 | 2.176 | 0.599 | 0.694 |
| 2019 | 6.271 | 1.278 | 0.574 | 1.843 | 10.326 | 0.133 | 1.117 | 1.272 | 1.856 | 0.566 | 0.734 |
Source: Authors’ calculations.
Table 7.
India’s MCA of Services Exports to ROK.
| A | B | C | D | E | F | G | H | I | J | K | |
|---|---|---|---|---|---|---|---|---|---|---|---|
| 2005 | 0.000 | 0.000 | 0.461 | 1.024 | 0.142 | 1.447 | 3.450 | 0.079 | 34.837 | 1.290 | 0.885 |
| 2006 | 0.000 | 0.000 | 0.478 | 0.864 | 0.188 | 1.327 | 2.133 | 0.021 | 13.754 | 1.530 | 0.643 |
| 2007 | 0.000 | 0.000 | 0.438 | 0.877 | 0.136 | 1.493 | 1.498 | 0.047 | 16.794 | 1.544 | 0.892 |
| 2008 | 0.000 | 0.000 | 0.425 | 1.014 | 0.118 | 2.076 | 1.420 | 0.045 | 18.848 | 1.371 | 1.116 |
| 2009 | 0.000 | 0.000 | 0.559 | 1.146 | 0.117 | 2.005 | 0.803 | 0.045 | 17.122 | 1.058 | 3.824 |
| 2010 | 0.000 | 0.000 | 0.491 | 1.156 | 0.073 | 1.855 | 1.687 | 0.023 | 18.674 | 1.131 | 1.180 |
| 2011 | 0.000 | 0.000 | 0.581 | 1.210 | 0.060 | 3.068 | 1.531 | 0.052 | 17.974 | 1.021 | 0.378 |
| 2012 | 0.022 | 1.057 | 0.550 | 1.160 | 0.072 | 2.277 | 1.166 | 0.047 | 18.844 | 1.102 | 0.678 |
| 2013 | 0.023 | 6.284 | 0.534 | 1.105 | 0.066 | 1.825 | 1.514 | 0.057 | 16.967 | 1.104 | 1.026 |
| 2014 | 0.083 | 0.637 | 0.559 | 1.115 | 0.102 | 2.344 | 1.542 | 0.079 | 15.464 | 1.054 | 0.961 |
| 2015 | 0.067 | 0.221 | 0.447 | 1.097 | 0.135 | 1.769 | 1.494 | 0.058 | 11.247 | 1.128 | 1.284 |
| 2016 | 0.051 | 0.228 | 0.466 | 1.046 | 0.221 | 1.565 | 1.361 | 0.064 | 10.752 | 1.165 | 1.364 |
| 2017 | 0.043 | 0.229 | 0.507 | 1.125 | 0.197 | 1.461 | 1.063 | 0.081 | 8.689 | 1.107 | 1.322 |
| 2018 | 0.075 | 0.196 | 0.506 | 1.096 | 0.227 | 1.842 | 1.187 | 0.089 | 10.013 | 1.156 | 1.351 |
| 2019 | 0.073 | 0.150 | 0.541 | 1.139 | 0.187 | 1.143 | 0.868 | 0.088 | 8.955 | 1.109 | 1.175 |
Source: Authors’ calculations.
Table 8.
Tariffs and Number of Tariffs Lines for Important Tradable Items.
| India’s Exports to ROK | Number of Tariffs Lines | Average Tariffs (%) | Maximum Average Tariffs (%) |
| Petroleum oils and oils from bituminous minerals | 6 | 0.5 | 3 |
| Aluminum; unwrought (not alloyed) | 1 | 0 | 0 |
| Ferro-alloys; ferro-chromium | 1 | 0 | 0 |
| Zinc; unwrought (not alloyed) | 1 | 0 | 0 |
| Oil-cake and other solid residues | 1 | 0 | 0 |
| ROK’s Exports to India | Number of Tariffs Lines | Average Tariffs (%) | Maximum Average Tariffs (%) |
| Electronic integrated circuits | 1 | 0 | 0 |
| Petroleum oils and oils from bituminous minerals | 9 | 4.94 | 6 |
| Vehicle parts and accessories, nec | 1 | 5 | 5 |
| Vehicle parts; gearboxes and parts thereof | 1 | 7.5 | 7.5 |
| Vinyl chloride, other halogenated olefin polymers | 1 | 7.5 | 7.5 |
Source: UN COMTRADE, 2021.
Table 9.
Gains from trade through tariffs reduction.
| Existing Tariffs (%) | Simulated Tariffs (%) | Current Trade (USD mil) | Simulated Trade Value (USD mil) | |
|---|---|---|---|---|
| India’s exports to ROK | ||||
| Petroleum oils and oils from bituminous minerals | 0.5 | 0 | 1206.07 | 1234.36 |
| ROK’s exports to India | ||||
| Petroleum oils and oils from bituminous minerals | 4.94 | 0 | 704.86 | 747.67 |
| Vehicle parts and accessories, nec | 5 | 0 | 325.82 | 344.08 |
| Vehicle parts; gearboxes and parts thereof | 7.5 | 0 | 308.10 | 331.09 |
| Vinyl chloride, other halogenated olefin polymers | 7.5 | 0 | 306.83 | 333.99 |
Source: UNESCAP, 2021, and author’s calculation.
Publisher’s Note: MDPI stays neutral with regard to jurisdictional claims in published maps and institutional affiliations. |
© 2022 by the authors. Licensee MDPI, Basel, Switzerland. This article is an open access article distributed under the terms and conditions of the Creative Commons Attribution (CC BY) license (https://creativecommons.org/licenses/by/4.0/).
Share and Cite
MDPI and ACS Style
Banik, N.; Kim, M. India–Republic of Korea CEPA: Assessment and Future Path. Economies 2022, 10, 104. https://0-doi-org.brum.beds.ac.uk/10.3390/economies10050104
AMA Style
Banik N, Kim M. India–Republic of Korea CEPA: Assessment and Future Path. Economies. 2022; 10(5):104. https://0-doi-org.brum.beds.ac.uk/10.3390/economies10050104
Chicago/Turabian StyleBanik, Nilanjan, and Misu Kim. 2022. "India–Republic of Korea CEPA: Assessment and Future Path" Economies 10, no. 5: 104. https://0-doi-org.brum.beds.ac.uk/10.3390/economies10050104
Note that from the first issue of 2016, this journal uses article numbers instead of page numbers. See further details here.