
Determinants of Qualified Investor Sentiment during the COVID-19 Pandemic in North America, Asia, and Europe


CISeD—Research Center in Digital Services, Polytechnic Institute of Viseu, 3504-510 Viseu, Portugal
Economies 2022, 10(6), 143; https://0-doi-org.brum.beds.ac.uk/10.3390/economies10060143
Submission received: 20 April 2022
/
Revised: 3 June 2022
/
Accepted: 7 June 2022
/
Published: 14 June 2022
(This article belongs to the Section Macroeconomics, Monetary Economics, and Financial Markets)
Abstract
:This work delineates the factors determining investor sentiment in specific regions during the pandemic and the influence of attitudes towards vaccination. The findings show that the reactions of knowledgeable investors in different regions to the economic effects of the pandemic were not uniform but depended on a variety of individual factors. Risk perception varied widely due to idiosyncrasies in specific countries and regions, the level of pandemic information, reaction to case reports and deaths, attitudes towards vaccination, lockdown compliance, and government measures to support businesses. These various elements combined to create different outlooks in the minds of investors that strongly influenced their investment strategies. For this investigation, we tested three estimation models: the classic robust standard error for time series regression, the new robust standard errors regression, and the Prais robust estimation. This study applied the lasso system of machine learning to select relevant explanatory variables. The novelty of our work resides in its analysis of the conduct of informed investors, using a reliable proxy, and the discussion of how government policies and different pandemic-related factors, specifically the vaccination status, affected investor sentiment in different regions. As for practical implications, an understanding of how the various economic factors related to the pandemic influenced the behavior of qualified investors in different regions can help regulators, government leaders, fund managers, and investors deal with a future virus outbreak.
1. Introduction
Most financial articles analyzing the impact of COVID-19 focused on its effect on asset returns or volatility. Recent studies covered the pandemic’s effect on commodities, stocks, bonds, currencies, and cryptocurrencies. Thus, it is common in academic studies to find works covering stock volatility (Cheng 2020; Corbet et al. 2021) and returns (Bretscher et al. 2020; Shaikh 2021; Yilmazkuday 2021), bond volatility (Zaremba et al. 2021) and returns (Andrieș et al. 2021), commodity volatility (Farid et al. 2021) and returns (Gharib et al. 2021), currency volatility (Ilzetzki et al. 2020) and returns (Aslam et al. 2020), and cryptocurrency volatility (Umar and Gubareva 2020) and returns (Umar et al. 2021). There are works related to the outbreak’s effects on the overall economy (McKibbin and Fernando 2020), and many of them have generated sentiment indexes based on the influence of COVID-19 on asset pricing and volatility (Reis and Pinho 2020a; Duan et al. 2021; Biktimirov et al. 2021; Wang et al. 2021). However, there is a scarcity of studies addressing how the pandemic responses, including vaccination and government measures, influenced the sentiment of professional investors.
Our study utilized pandemic-related sentiment proxies to reflect the influence of the COVID-19 case load testing, inherent positivity, and number of reported deaths. Accordingly, this investigation used implied volatility options indexes, also known as fear-gauge indexes, such as the CBOE VIX for the U.S. and the VSTOXX for Europe, along with other similar indexes available for additional countries, as a professional investor sentiment proxy. The power of indexes such as the VIX to predict future stock market evolutions is well known. Consequently, this work aimed to analyze the influence of COVID-19 and public health measures on the sentiment proxies, considering the impact of the availability of vaccination. This approach is relevant, as those who negotiate stock options for the main indexes are well-informed, highly qualified traders with considerable knowledge of financial instruments. Hernandez et al. (2010) suggested that complex financial products might be too complicated for individual investors at the retail level to understand. For instance, the Chinese options market is restricted to qualified investors only (Yue et al. 2021). Knowing how they react under a pandemic state with severe government restrictions and vaccination is essential for portfolio managers, professional investors, and government leaders.
2. Literature Review
2.1. Investor Sentiment
Fama (1991) and Fama and French (1996a, 1996b) reviewed the theoretical and empirical evidence for explaining returns, including the use of a three-factor model. The proponents of the behavioral finance framework reject the expected utility theory and claim that stock markets are inefficient systems because investors can be ir-rational and nonobjective (Sharma and Kumar 2019), causing severe asset price fluctuations and increasing risk. Rational expectations about fundamentals do not drive market risk, and, therefore, investor sentiment must be taken into account. Ir-rational psychology has a more rapid and pronounced consequence on stock market returns than rational behavior (Verma et al. 2008), and is a vital consideration when making investment decisions.
2.2. Investor Sentiment Vis-à-Vis COVID-19’s Effect on Markets
Naseem et al. (2021) developed a sentiment index to study the effects of investor psychology on market decisions. The index was built upon PCA (principal component analysis) using individual investor proxies for money flow, relative strength, and turnover assessment in comparison with daily changes in COVID-19 case numbers and deaths over stock market failures from Chinese, Japanese, and American market indexes. The period covered four months in 2020, and results indicated that investor psychology was negatively associated with stock market returns under psychological resilience. Excessive investor pessimism caused traders to exit the market and lowered returns. Additionally, managers tended to exaggerate a firm’s bankruptcy risk based on sentiments during market peaks (Akbar et al. 2021).
Sun et al. (2021) developed an investor sentiment index using PCA and individual proxies reflecting the growth rates of new investor accounts, the discount rate, closed-end fund growth, the turnover rate, and the rate of change in the consumer confidence index for medical stocks in China, Hong Kong, Korea, Japan, and the U.S. The period of analysis was December 2019 to February 2020. They also evaluated the effects of COVID-19 news and macrogovernment news on the sentiment index to gauge their influence on medical stocks and concluded that COVID-19 news and economic announcements did not promote ir-rational investment behavior in medical stocks. However, economic reports did seem to have greater effects on institutional investor sentiment.
Wang et al. (2021) conducted a study in 2020 of the realized volatility obtained through the variance of stock prices and the fundamental volatility based on information obtained by the decomposition method of Beveridge and Nelson (1981). They developed a metric for expected attention using best-fit regression values for market attention (investor sentiment) relative to COVID-19 news, the number of new COVID-19 cases, and the number of COVID-19 deaths. The residuals were defined as unexpected attention. The expected investor attention was linked to pandemic severity, while unexpected investor attention was associated with factors unrelated to the pandemic. The researchers concluded that expected investor attention affected traders’ attitudes towards both realized and fundamental stock market volatility, whereas unexpected investor attention was primarily related to realized volatility. The connection between expected investor attention and both types of volatility was one-sided, while the link between unexpected investor attention and realized volatility was bidirectional; they claimed that unexpected investor attention was damaging to the stock market.
Chundakkadan and Nedumparambil (2021) found a direct link between investor sentiment as measured by COVID-19-related Google searches, low returns, and high volatility in the stock markets of several countries. Biktimirov et al. (2021) presented evidence that sentiment scores during 2020 were correlated with the intensity of COVID-19 news coverage and strongly associated with S&P 500 index returns. However, sentiment scores inducing polarity (trend) did not influence stock returns.
Van der Wielen and Barrios (2021) determined investor sentiment based on internet word searching, and claimed that it was more pronounced in E.U. countries that suffered the most economically. They also concluded that governments’ fiscal measures did not change investor sentiment. Caggiano et al. (2020) reported that COVID-19 caused serious uncertainty in world production, with an estimated cumulative one-year output loss of 14%.
Regarding vaccination, Yu et al. (2021) maintained that the correlation between the anxiety created by reading about COVID-19 cases and deaths, as a proxy for investor sentiment, decreased during periods of enhanced vaccination. Rouatbi et al. (2021) showed that increased vaccination and positive government policy responses decreased stock market volatility, but other factors were also involved. Vaccination rates had a greater significant impact on developed countries than in emerging economies.
Evidence for the relationship between investor sentiment and VIX can be found in the work of John and Li (2021), who constructed individual sentiment proxies with a Google search and divided them into news categories of COVID-19, lockdown, banking, market (negative words in the news), and government support efforts. These sentiment indexes were correlated with the VIX, the S&P 500, and the S&P 500 banks’ index. They concluded that the degree of pessimism among U.S. investors as measured in relation to negative reports on COVID-19 cases, market performance, lockdowns, and banking increased the VIX index. However, only the COVID-19 and market indexes were linked to the increase in realized volatility of the S&P 500 and S&P 500 banks. The index of government efforts decreased the VIX index and the realized volatility of S&P 500 and S&P 500 banks. Bogdan et al. (2021) also confirmed the efficiency of VIX, even during the COVID-19 pandemic period. Regarding VSTOXX, we found that Hachicha et al. (2021) applied the index as a potential inducer of some emerging Islamic stock market hedge factors. Furthermore, Grima et al. (2021) found a cointegration relation among VIX and COVID-19 features, in which new cases had a stronger effect on VIX than new deaths for the U.S. They also found a spillover effect between VIX and other major stock indexes.
3. Materials and Methods
3.1. Data
Daily data were obtained from 6 June 2020 to 19 August 2021, encompassing the COVID-19 period without and with vaccination. COVID-19-related data (variables 1 to 6 in Table 1) were obtained for Belgium, Italy, Spain, France, Germany, Ireland, Finland, and the Netherlands, as prominent representatives of the European Union. The VSTOXX reflects the implied volatility of E.U. countries. Switzerland and Russia are European countries, although they are not in the EU. For the analysis of other continents, we included data on the U.S., China, Japan, and Hong Kong, and the inherent options volatility indexes as proxies for qualified investors (Table 1).
We confirmed the relevance of these data in testing our model. The full range of data on COVID-19 is available (https://github.com/owid/covid-19-data/tree/master/public/data, accessed on 18 August 2021) for establishing the variables in the model using lasso and associated machine learning algorithms (Friedman et al. 2008). Lasso selects the best variables and avoids overfitting. Multicollinearity was corrected to eliminate the surplus variables, and the remaining ones related to COVID-19 are shown in Table 1.
3.2. Methods
In this study, we applied three modeling frames using time-series data to confirm the results’ robustness after testing for the absence of unit roots from the variables. The time series showed stationarity because a change in time did not cause a modification in the shape of the distribution. The first model was a robust regression model considering the assumption that homoscedasticity might be violated. To correct the heteroscedasticity and potentially the serial correlation, this regression was run through the cluster–robust standard errors model according to Arellano (1987). The robust variance estimator was used to estimate variance and calculate strong confidence intervals even in mis-specified models. The second model was an estimator using the generalized least squares (GLS) method to identify the linear regression parameters related to the situation where the errors are serially correlated (Prais and Winsten 1954a; 1954b; Becketti 2020). The last model was that of Newey and West (1987), comprising an estimator for robust serial correlations and standard errors (Wooldridge 1989; Newey and West 1987). The use of three models should provide a more efficient, robust, and reliable application of the power of the regressors. Kim et al. (2012) also applied the Prais–Winsten and ordinary least squares (OLS) methods with Newey West for standard errors. With the same goal in mind, Prais–Winsten, besides treating heteroscedasticity, yielded serially uncorrelated classical disturbances (Baltagi et al. 2007), and the Newey West procedure allowed robust inference of serial correlations of a certain order (Traub and Jayne 2006).
3.3. The Variables
Marginal daily COVID-19 cases and deaths were considered in the literature as relevant indicators for explaining dependent variables affecting market returns and volatility (Reis and Pinho 2021; Al-Awadhi et al. 2020). COVID-19 tests and inherent positive rates have not been included in financial studies, and only a few have addressed the impact of vaccination on the markets (Rouatbi et al. 2021; Kucher et al. 2021). Additionally, even fewer studies examined the influence of COVID-19-related policy measures on investor sentiment (Yu et al. 2021).
Sentiment indexes were available for North America, Europe (as a whole), Germany, Switzerland, China, Japan, Russia, and Hong Kong. For other European countries, the data were missing, or the index was not available. VIX is the CBOE volatility index widely used by academia as a sentiment indicator (Whaley 2000; Paserman 2017; Reis and Pinho 2020b; Van Hoang and Syed 2021). The VIX index (also known as the fear-gauge because of its use during periods of market turmoil) involved calculation of the 30-day expected volatility of the S&P 500 Index. The components of the VIX index used prices of out-of-the-money put and call options with >23 days and <37 days to expiration to assess the expected volatility. The price of each option reflected agents’ expectations about the future volatility of the S&P index (Chicago Board Options Exchange 2021). The VIX is primarily a fear sentiment rather than an optimistic measure, so it captures pessimism more efficiently than optimism (Smales 2017).
The VSTOXX index is the VIX counterpart for Europe and tracks the future volatility of the EURO STOXX 50 Index as reflected by the available option contracts (30 days). The index includes stocks from eight European countries (Belgium, Italy, Spain, France, Germany, Ireland, Finland, and the Netherlands) and is also called the ‘Eurex’. It has been applied in studies as a proxy for individual investor sentiment (Reis and Pinho 2020a, 2020b; Keiber and Samyschew 2019; Schadner 2020) and as a regressor for investor sentiment analysis (Concetto and Ravazzolo 2019). Similar fear-gauge indexes were built for the main stock indexes. The VDAX is the implied volatility index for the German DAX. It is derived implicitly from option prices and stands for market agents’ expectations within a trade sustained at a specific option price (DAX 2021). The RVI volatility index from Russia processes the market’s expectations of the volatility over a 30-day period (Moex 2021), using option prices from the RTS Index of fifty stocks trading in the Moscow market. Likewise, the ETF volatility index of the Chicago Board Options Exchange (CBOE) for China (VXFXICLS) tracks the implied volatility of the leading shares of China’s ETF (FXI ETF) (Chicago Board Options Exchange 2021). Similar data is obtainable for the Nikkei implied volatility index (VSMI), the implied volatility index of the Swiss market (SMI), and the HIS implied volatility index for the Hong Kong market. We could not obtain information from other European markets due to the lack of data or absence of an index. The intraday volatility of each sentiment proxy index mirrors the daily range of investor concern and mood variation. The implied volatility indexes were all retrieved from www.investing.com.
The government policy measures’ stringency index was obtained from the Oxford COVID-19 government response tracker, which measures nineteen subindexes grouped by containment and closure, economic response, and health systems (Hale et al. 2020). The stringency index score fell between 0 and 100, where 100 corresponded to those items most profoundly affected by government intervention. Several authors have used this indicator as an explanatory variable in asset pricing (Reis and Pinho 2021; Ashraf 2020; Alexakis et al. 2021; Bakry et al. 2021). All the estimations were calculated with Stata Software. Because macrovariables such as gold may influence the volatility index VIX, we used this variable as a control in all our estimations (Prasad et al. 2022).
In Table 2, we present the correlation matrix amongst COVID-19 related variables and the stringency field.
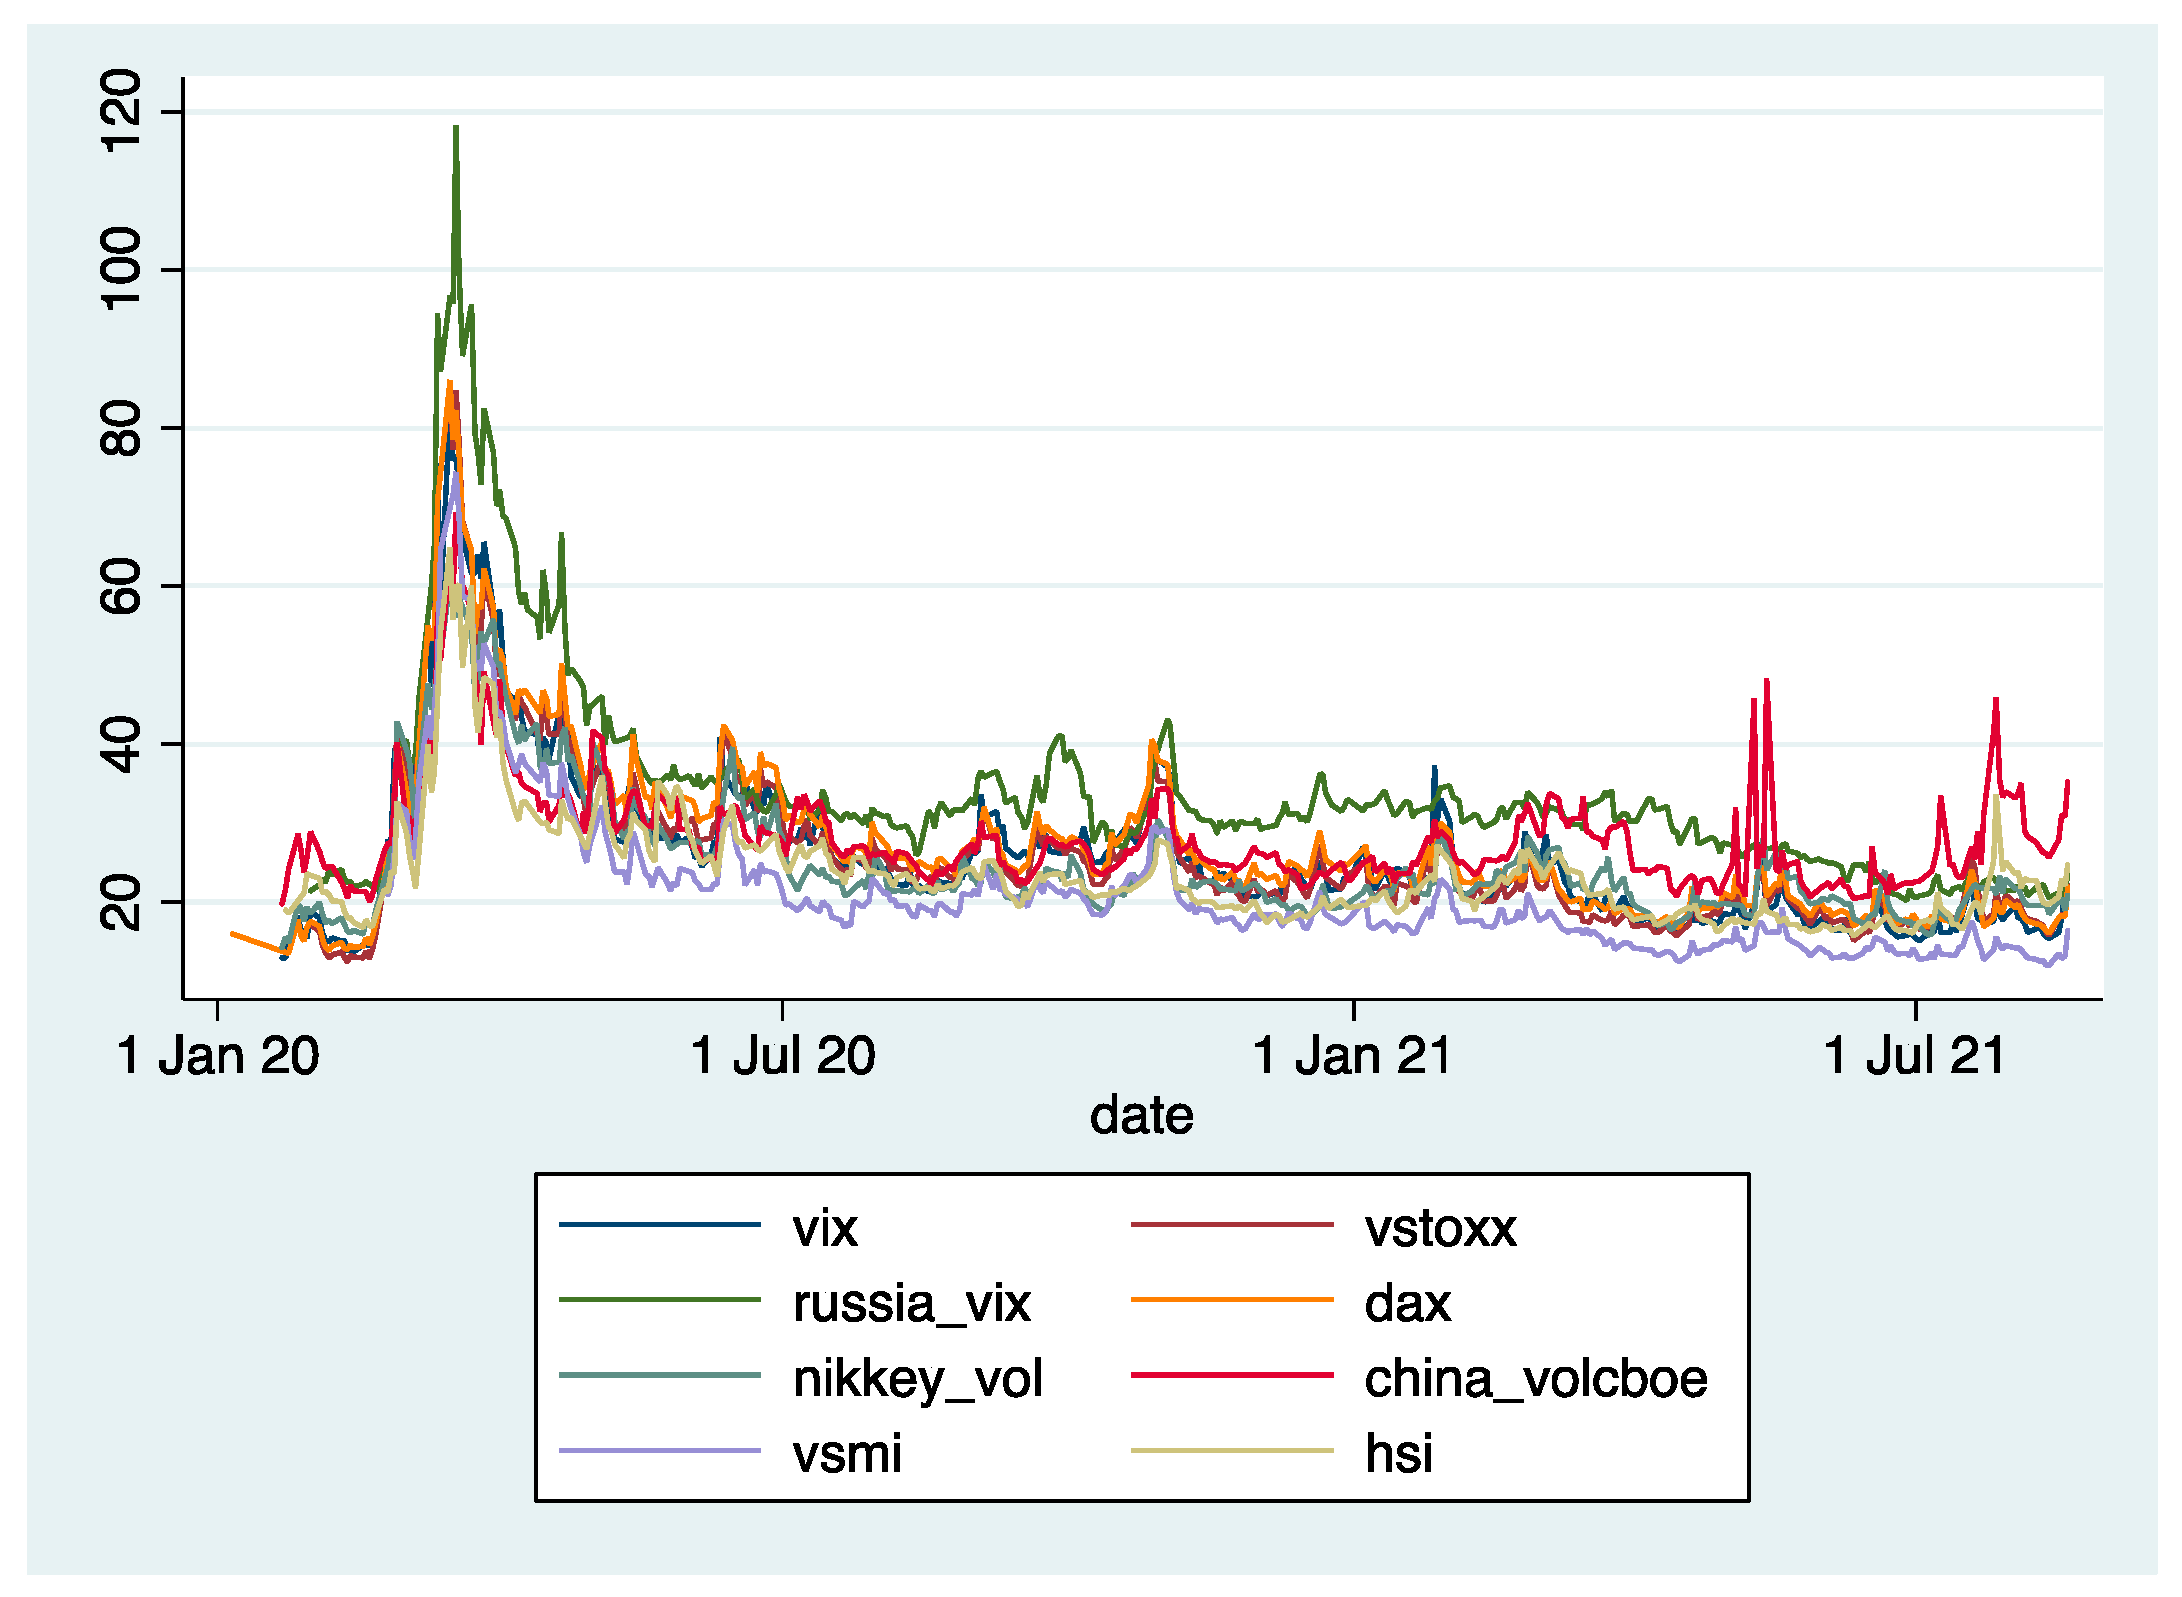
Sentiment-related variables were available for each specific country. We observed a high spillover effect between them, with the spike in the pandemic turmoil occurring in March and April of 2020, with higher indexes correlating with greater volatility and risk aversion. Afterwards, there were some small peaks attesting to the reincidence of cases and vaccine introduction and inherent efficacy concerns.
Figure 1, shows the evolution of the different Sentiment index proxies in the analysis period, showing a similar pattern of evolution.
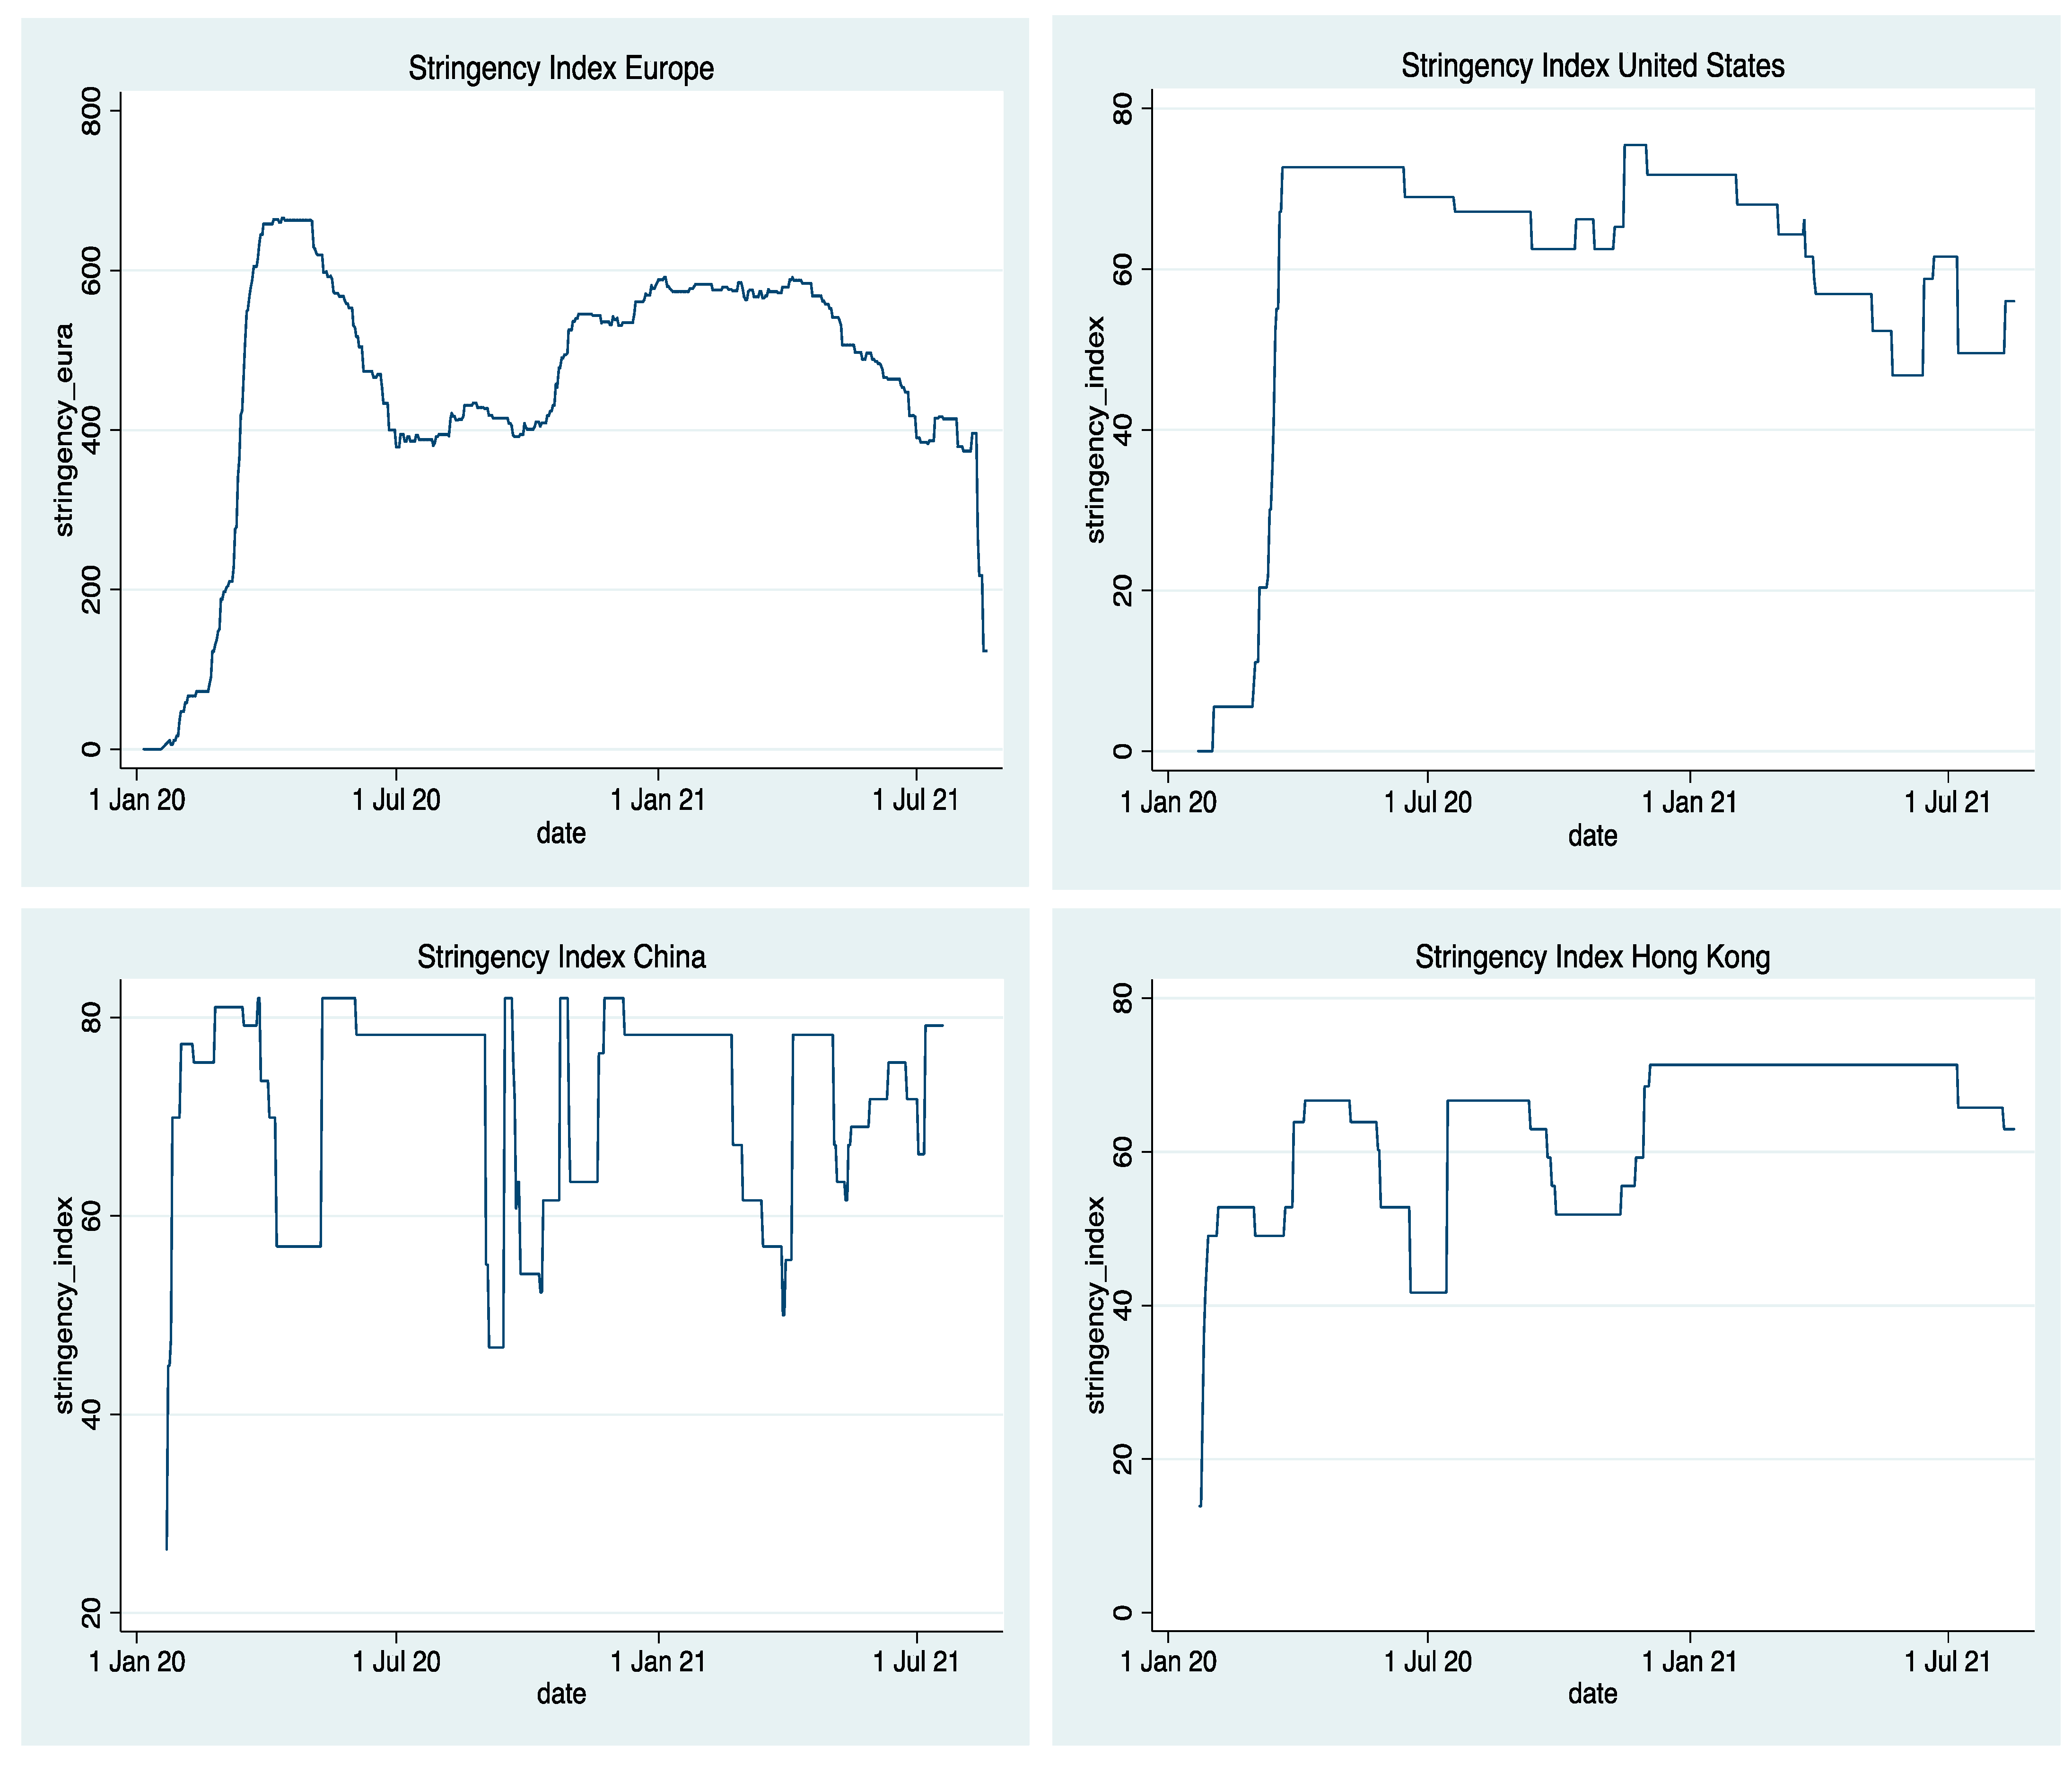
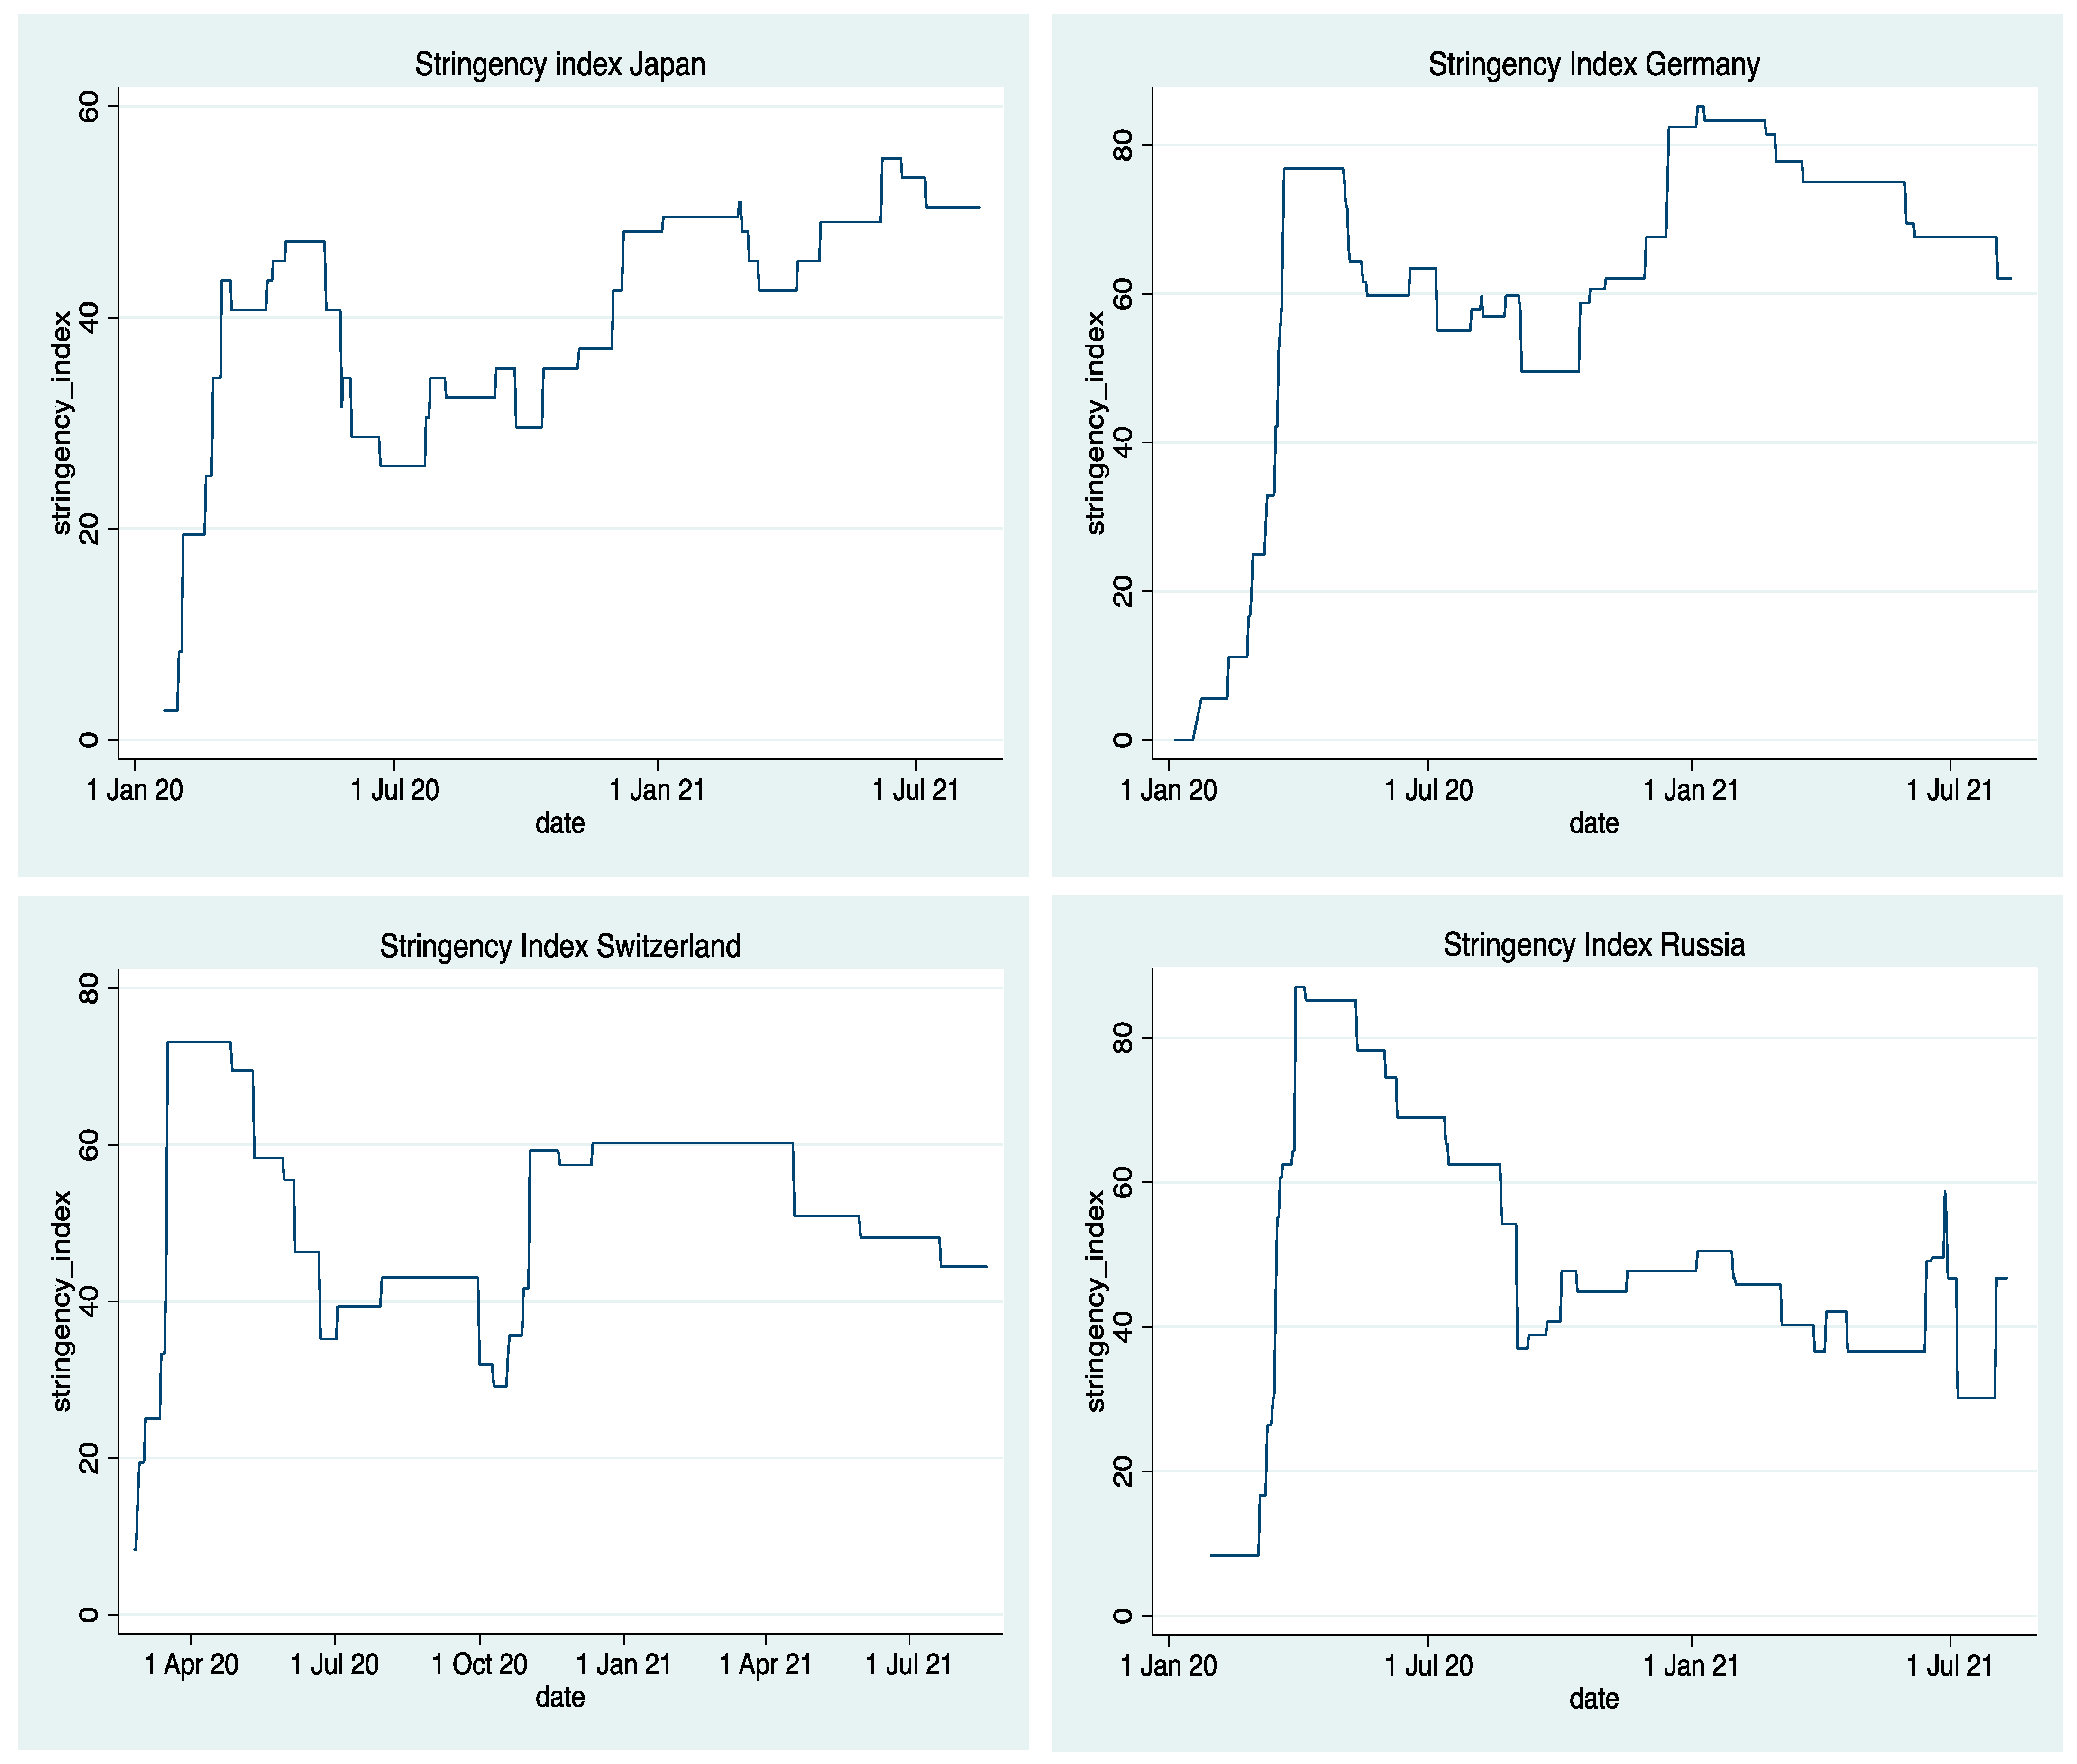
According to Figure 2, Europe (including Germany), China, and Russia had the highest level of government intervention, with values sometimes surpassing 80, while Japan presented the lowest values (below 60). Europe withdrew government support, cancelled lockdowns, and reduced health measures sooner than other countries. China showed the most ir-regular government support during the pandemic period.
The optimization model estimates variables such as the COVID-19-related intraday sentiment volatility, and government actions that increase investor anxiety (Table 1).
With being the sentiment measured by each country (z), for the implied options volatility indexes: VIX, VSTOXX, RVI, VDAX, VHSI, JNIV, VXFXICLS, and VSMI, daily (i). The first independent variable is each country’s intraday volatility followed by the COVID-19 variables: daily increase in cases, deaths, tests, positivity rate, and people fully vaccinated per hundred per country or region (z). The government measures are represented by the stringency index, and is the error term.
3.4. Explanatory Variables and Sentiment
The investor sentiment index, our dependent variable, as measured by implied volatility, is a future predictor of the markets. One goal of academic research is to improve the forecasting and predicting power of financial models (Altarawneh et al. 2022).
Increases in new COVID-19 cases were positively linked to pessimistic investor sentiment and fear of risk, which affected investor risk preferences (Shu and Chang 2015). The likelihood of future death, contagion, interruptions in service, business losses, and closures were given more weight by investors. Otherwise, if increases in cases reduces fear (decreasing stock options volatility indexes), then future immunity was privileged by investors, which may prove better than vaccination. Supposing that new deaths were positively linked to investor anxiety or investors prefer to take more risk (Shu and Chang 2015), the high economic uncertainty and increasing business losses will eventually lead to business closures. Otherwise, if an increase in death rate is accompanied by a decrease in risk aversion (Shu and Chang 2015), this may be a psychological sign that “the worst is almost passed,” or it may be an age effect, because mortality is higher in the elderly.
Regarding the positivity rate, a direct link between this variable and sentiment indicates an increase in future lockdowns and business closures, increasing state aid for the illness, loss of productivity, and psychological damage. An indirect liaison claimed that future immunity was achievable, which would reduce the number of new cases since most people will have already been infected. When larger numbers of people test positive, investor anxiety increases and they become risk-averse (although there are still investors that prefer to take more risk in these circumstances, (Shu and Chang 2015)), as they fear more infected people, more lockdowns, and economic constraints. On the other hand, when testing indicates declining case rates, anxiety decreases, and the level of trust increases as COVID-19 monitoring transmits optimism to the market.
When the stringency index is positively connected to the sentiment variable (more fear and pessimism), it may indicate that government policies, whether about health, containment, or incentives, may increase fear of lockdowns, decrease economic activity and income, and increase the public budget deficit. A negative connection means that government policies effectively reduce pessimism and fear and stimulate optimism, but this link may change because of changes in vaccination rates. Vaccination can leverage the efficacy of the government measures depending on the vaccination results, peoples’ trust, death rates in vaccinated people, and the duration of immunity. With vaccination, a direct link with the increase in sentiment-related fear, investors do not all believe in its efficacy in producing immunity and preventing economic lockdown, as fully vaccinated people can still become infected. However, vaccination and its potential for reducing the number of cases may increase investors’ optimism about the future economic prospects and a return to the status quo. The intraday sentiment volatility reflects the daily mood range, and shows how swings from fear and pessimism to optimism can influence the final investment decision.
4. Results
5. Discussion
Table 11 summarizes the data from each region shown in Table 3, Table 4, Table 5, Table 6, Table 7, Table 8, Table 9 and Table 10. If at least two models in each area showed significance for an explanatory variable, then it was considered relevant for the analysis. For the U.S., considering the intraday volatility index spread, when that mood spread was high, ranging from least to most anxious, having a broad ‘risk preference’ as Shu and Chang (2015) defined it, the outcome is generally one of extreme caution in all the studied markets (pessimism installs in the market). The increase in cases (the ‘surprise effect’, as used by (Reis and Pinho 2021)) lowered the future fear factor (less hesitancy in risk-taking) in U.S. markets in periods without and with vaccination. Qualified investors were expecting an increase in future immunity because of the current increase in new cases. This belief was reinforced in periods of vaccination where the immunity would be stronger and the disease less threatening. An increase in testing improves investor confidence, but a higher rate of positive infections in tested people could exacerbate investor pessimism. Investors react more negatively to a higher number of new positive tests than to absolute new cases, even without vaccination. According to Grima et al. (2021), new cases exert a more prominent effect on uncertainty than new deaths. Government policies on lockdowns and support to business had little influence on investor mood, and, although high in level (near 80, Figure 2), they did not increase investor confidence. John and Li (2021), however, did report an increase in investor anxiety as a result of government policies. Higher vaccination levels decrease anxiety, but this is offset by trepidation over increases in deaths. One possible explanation for this could be the fact that investors often question the efficacy of vaccination in preventing severe illness. Some investors with higher risk tolerance actually seek out turbulent markets because the opportunities for profit are greater with diminished competition.
Regarding Europe, our data analysis shows that investors’ reactions were similar to those of their U.S. counterparts. Without vaccination, the fear trigger is the rate of positivity and the number of deaths. However, testing more of the population gives advanced scrutiny controls for epidemic contagion and allows better illness monitoring and potentially more effective treatment. New cases can gain immunity to the dominant strain, but vaccination promoted investor confidence. In line with Van der Wielen and Barrios (2021), government policy measures did not seem to affect qualified investors’ concerns.
Considering China as a country less affected by the pandemic in relative terms (Appendix A), investors’ feelings are negatively influenced by an increase in deaths and positively by new cases during the nonvaccination period. This last effect cannot be attributed to immunity, but rather to the low absolute number of cases that are almost insignificant relative to the population. With vaccination, however, things change. Vaccination enhances optimism, but an increase in the number of new cases engenders greater anxiety and lowers peoples’ tendency to take risks as they observe infection rates increasing despite vaccination. Government measures promoting vaccination during the period can reduce fear and risk-aversion as the combination makes the result more robust. China presents a stringency index with higher peaks than the U.S. and Europe and more prolonged highs during the vaccination period (2021) (Figure 2).
Investors who trade Japanese securities during periods without vaccination are more likely to be optimistic about increased testing. Knowing earlier about the illness should limit future contagion and enhance disease control. Fear of risk increased at a relatively positive rate in step with government policies as lockdowns and containment increased investor anxiety. The country has implemented relatively few measures (Figure 2), resulting in greater market instability. When vaccination enters in force, deaths become a factor in investors’ hesitancy to take risks. The vaccine does not provide investors the expected calm because of lack of confidence in vaccination efficacy. Absolute government policy measures often increase in the vaccination period, which could leverage its effect and have a positive impact on investor sentiment, thus reducing pessimism. We must reiterate that Japan was also less affected by cases and deaths than Europe and the U.S. Furthermore, according to The Edelman Trust Barometer, which evaluates trust in governments’ actions, media accuracy, and business leaders, Japan has the third-lowest trust position. This indicator registers that confidence has deteriorated because of mishandling by leaders of the COVID-19 outbreak, which could reduce optimism for vaccination effectiveness. This idea could also explain the fluctuation in perceived efficacy of government measures in periods with and without vaccination (ETB 2021).
Investors in Hong Kong showed trust in government policies for containing the pandemic and in the effectiveness of immunization for enhancing economic prospects and market performance. New cases increase investors’ risk-aversion and reduce market stability.
Qualified Russian investors were more prone to anxiety from increased cases and government interventions, which lowered their risk tolerance. Russia also has one of the lowest Edelman Trust Barometer indexes, which helps to explain the change in sentiment during the vaccination period. In contrast, however, what drives future market optimism is the increased prevalence of testing and, unexpectedly, the positivity rate. The positive rate is 3.5% on average and is the lowest for the analyzed countries. Perhaps being a low rate may produce an asymmetric effect on mood. When vaccination is prevalent, investors see changes in government policies and vaccination as effective in reducing pessimism. As a surprise effect, the absolute number of cases may induce more significant concern in the markets.
On 21 September, over 60% of the German population was fully vaccinated, but this was still below the goal established by the Robert Koch Institute (VAC 2021).
A study by Rattay et al. (2021) revealed that 75% of respondents said that they believed more vaccination was un-necessary because most people were already vaccinated. The proportion of people sharing the same opinion (44%) increased from August to September 2021. Among the respondents, 72% are still worried about vaccine safety and believe the risks of taking the shot do not outweigh the benefits. This idea may explain why some investors reacted adversely to the inoculation, as it increased their fear of taking risks. Government policies reduced pessimism in the absence of available vaccines but increased it when vaccination was mandated. The growth of antilockdown movements (Bloomberg 2021) may also influence the sentiment and trust of qualified investors in the efficacy of government measures. The increase in new cases reduces pessimism, mainly because investors anticipate reaching complete population immunity with more cases, and they are not particularly worried about the disease symptoms, as they are usually minimal due to the excellent public health system. The country also has expert scientific institutions and prevention procedures, allowing the country’s rapid reaction to the pandemic (Wieler et al. 2021).
Qualified investors in Swiss markets tended to show greater risk-aversion because of the increase in COVID-19 cases and positivity, but widespread testing reduced anxiety in the period before vaccination. When vaccination was introduced, deaths and government policies triggered pessimism, while vaccination and testing, and the appearance of new cases, resulted in less severe disease, which produced optimism. Government health policies, COVID-19 containment measures, and business support in Switzerland, as measured by the stringency index, were quite low compared to other countries (Figure 1). During vaccination periods, government efforts increased investors’ fear of risk, as they anticipated negative effects from the policies of containment and lockdown, activity restriction, quarantine measures, reduced consumption, lower GDP, and government budget deficits.
All of the base regressions were free from multicollinearity as the VIF remained below 10 in agreement with the recommendation of Hair et al. (1995). When variables had some degree of significance, their coefficients kept the same signs even after changing the estimation method. The robust standard errors resulted in comfortable confidence intervals for the variables when significant and there was no change in sign. According to Lindner et al. (2020), multicollinearity does not introduce bias in the analysis because it does not violate the principles needed for regression models to work. Additionally, they argue that the coefficient instability is not a consequence of multicollinearity. VIF allows the identification of standard errors that are too large. In the presence of a higher correlation amongst the variables, it is more problematic to omit one of those variables in the estimation. Wooldridge (2022) also confirmed the idea that multicollinearity was overvalued, and stated that if two parameters were correlated, they must be included in the estimation as they are important for explaining the relevant variables.
6. Conclusions
Government health, containment, and economic measures were not globally significant in reducing the anxiety of informed investors, as they may have opposite effects on the economy. The outcomes of lockdowns and the increase of government spending may reduce activity and earnings, while increasing health spending, taxes, and incentives that promote impulsive activity.
Vaccination generally reduced fear and leveraged the efficiency of government measures in decreasing pessimism, except in Switzerland, which enacted few government measures, and Germany, where there were serious confidence issues about immunization.
Europe and the U.S. showed similar investor reactions to the same triggers of sentiment. We concluded that containment, healthcare, and financial measures cannot restore investors’ confidence in these regions. Testing, vaccination, and the occurrence of immunity from infection promote investor confidence. Qualified investors in Asian countries revealed a more robust response to government containment measures, compared to Europe and the U.S., mainly due to the traditional compliance features of those countries. Deaths and positive infection rates, when significant, represented a threat to the confidence of informed investors. However, Russian investors showed the opposite behavior in dealing with the positivity rate, which indicates higher risk tolerance towards relative infection; however, a change in absolute case numbers can induce pessimism.
Significant daily changes in mood always produce negativity and distrust in the market. When there is a wide range in investor feelings from optimism to pessimism, it usually results in lack of market confidence, indicating a tendency on the part of investors to attach more weight to bad news than the opposite. This tendency is a risk-aversion pattern, and investors chose the worst-case scenario before uncertainty.
A combination of government measures, vaccination, testing, and the pursuit of immunity is a remedy for reducing fear of investment risk. This combination can help investors, fund managers, and regulators address measures to reduce market instability in pandemic periods. Different regions react differently to pandemic indicators, primarily due to cultural, social, and economic characteristics. This work also sheds light on the different triggers of sentiment even among qualified investors, who invest in other regions and substantially influence the building of inherent investor sentiment.
Risk perception and risk taking are not the same among informed investors in different regions due to differences in cultural norms in specific countries and regional idiosyncrasies such as pandemic information, reaction to deaths, cases or testing, vaccination confidence, attitudes towards lockdowns, healthcare infrastructure, and measures to support businesses. Combinations of these create different assessments at different stages of sentiment that condition investment strategies.
Our intuition tells us that COVID-19 characteristics (cases, deaths, tests, and positivity) could make markets unstable and increase pessimism. Qualified investors can react differently to these different features, with some even seeing the disturbed market as an opportunity to take more risks to improve gains. The reasoning behind government policies (health, economics, and containment) was that they might induce more confidence and thus less volatility and more optimism. In fact, in several cases, the opposite occurred. Even during vaccination periods, there were different reactions in different countries. Some of them showed increases in volatility or lower investor sentiment due to some initial disbelief regarding vaccine effectiveness. This shows that the degree of government intervention can have very different impacts on informed investors’ sentiment in other countries. The notion that investors experience the same sentiments is unrealistic, and herding behavior, despite the spillover effect that coexists between markets, did not happen in periods of high COVID-19 market turbulence and decisive government intervention.
As to limitations, this work did not apply controls for volatility indexes that, according to some authors, under-react in the early stages of a pandemic. Additionally, different countries used different COVID-19 vaccines and we did not take this fact into consideration.
Funding
This work was supported by National Funds through the FCT—Foundation for Science and Technology, I.P., within the scope of the project Refª UIDB/05583/2020. Furthermore, we would like to thank the Research Centre in Digital Services (CISeD) and the Polytechnic of Viseu for their support.
Conflicts of Interest
The author declares no conflict of interest.
Appendix A

Table A1.
COVID-19 characteristics.
| Location | Cases | Deaths | Population | People Fully Vaccinated (%) | Death Rate |
|---|---|---|---|---|---|
| United States | 37,294,140 | 625,166 | 331,002,647 | 51 | 2% |
| France | 6,985,500 | 113,376 | 67,564,251 | 54 | 2% |
| Russia | 6,592,705 | 170,716 | 145,934,460 | 23 | 2% |
| Spain | 4,758,003 | 83,004 | 46,754,783 | 65 | 2% |
| Italy | 4,464,005 | 128,634 | 60,461,828 | 58 | 3% |
| Germany | 3,854,529 | 91,963 | 83,783,945 | 58 | 2% |
| Netherlands | 1,945,351 | 18,252 | 17,134,873 | 62 | 1% |
| Japan | 1,232,583 | 15,553 | 126,476,458 | 40 | 1% |
| Belgium | 1,161,558 | 25,312 | 11,589,616 | 67 | 2% |
| Switzerland | 750,186 | 10,934 | 8,654,618 | 50 | 1% |
| Ireland | 331,206 | 5074 | 4,937,796 | 64 | 2% |
| Finland | 120,186 | 1010 | 5,540,718 | 44 | 1% |
| China | 94,094 | 4619 | 1,439,323,774 | 54 | 5% |
Note: data retrieved from in https://github.com/owid/covid-19-data/tree/master/public/data, 19 August 2021.
References
- Akbar, Minhas, Ahsan Akbar, Muhammad Azeem Qureshi, and Petra Poulova. 2021. Sentiments–Risk Relationship across the Corporate Life Cycle: Evidence from an Emerging Market. Economies 9: 111. [Google Scholar] [CrossRef]
- Al-Awadhi, Abdullah M., Khaled Alsaifi, Ahmad Al-Awadhi, and Salah Alhammadi. 2020. Death and contagious infectious diseases: Impact of the COVID-19 virus on stock market returns. Journal of Behavioral and Experimental Finance 27: 100326. [Google Scholar] [CrossRef] [PubMed]
- Alexakis, Christos, Konstantinos Eleftheriou, and Patroklos Patsoulis. 2021. COVID-19 containment measures and stock market returns: An international spatial econometrics investigation. Journal of Behavioral and Experimental Finance 29: 100428. [Google Scholar] [CrossRef] [PubMed]
- Altarawneh, Ghada A, Ahmad B. Hassanat, Ahmad S. Tarawneh, Ahmad Abadleh Malek Alrashidi, and Malek Alghamdi. 2022. Stock Price Forecasting for Jordan Insurance Companies Amid the COVID-19 Pandemic Utilizing Off-the-Shelf Technical Analysis Methods. Economies 10: 43. [Google Scholar] [CrossRef]
- Andrieș, Alin Marius, Steven Ongena, and Nicu Sprincean. 2021. The COVID-19 pandemic and sovereign bond risk. The North American Journal of Economics and Finance 58: 101527. [Google Scholar] [CrossRef]
- Arellano, Manuel. 1987. Computing Robust Standard Errors for Within-Groups Estimators. Oxford Bulletin of Economics and Statistics 49: 431–34. [Google Scholar] [CrossRef]
- Ashraf, Badar Nadeem. 2020. Economic impact of government interventions during the COVID-19 pandemic: International evidence from financial markets. Journal of Behavioral and Experimental Finance 27: 100371. [Google Scholar] [CrossRef]
- Aslam, Faheem, Saqib Aziz, Duc Khuong Nguyen, Khurrum S. Mughal, and Maaz Khan. 2020. On the efficiency of foreign exchange markets in times of the COVID-19 pandemic. Technological Forecasting and Social Change 161: 120261. [Google Scholar] [CrossRef]
- Bakry, Walid, Peter John Kavalmthara, Vivienne Saverimuttu, Yiyang Liu, and Sajan Cyril. 2021. Response of stock market volatility to COVID-19 announcements and stringency measures: A comparison of developed and emerging markets. Finance Research Letters 46: 102350. [Google Scholar] [CrossRef]
- Baltagi, Badi H., Seuck Heun Song, Byoung Cheol Jung, and Won Koh. 2007. Testing for serial correlation, spatial autocorrelation and random effects using panel data. Journal of Econometrics 140: 5e51. [Google Scholar] [CrossRef]
- Becketti, Sean. 2020. Introduction to Time Series Using Stata, rev. ed. College Station: Stata Press. [Google Scholar]
- Beveridge, Stephen, and Charles Nelson. 1981. A new approach to the decomposition of economic time series into permanent and transitory components with particular attention to the measurement of the “business cycle”. Journal of Monetary Economics 7: 151–74. [Google Scholar] [CrossRef]
- Biktimirov, Ernest N., Tatyana Sokolyk, and Anteneh Ayanso. 2021. Sentiment and hype of business media topics and stock market returns during the COVID-19 pandemic. Journal of Behavioral and Experimental Finance 31: 100542. [Google Scholar] [CrossRef]
- Bloomberg. 2021. Facebook Remove Accounts. Available online: https://www.bloomberg.com/news/articles/2021-09-16/facebook-removes-accounts-tied-to-german-anti-lockdown-group (accessed on 8 October 2021).
- Bogdan, Dima, Ştefana Maria DIMA, and Ioan Roxana. 2021. Remarks on the behaviour of financial market efficiency during the COVID-19 pandemic. The case of VIX. Finance Research Letters 43: 101967. [Google Scholar]
- Bretscher, Lorenzo, Alex Hsu, Peter Simasek, and Andrea Tamoni. 2020. COVID-19 and the cross-section of equity returns: Impact and transmission. The Review of Asset Pricing Studies 1: 705–41. [Google Scholar] [CrossRef]
- Caggiano, Giovanni, Efrem Castelnuovo, and Richard Kima. 2020. The global effects of COVID-19-induced uncertainty. Economics Letters 194: 109392. [Google Scholar] [CrossRef]
- Cheng, Ing-Haw. 2020. Volatility markets underreacted to the early stages of the COVID-19 pandemic. The Review of Asset Pricing Studies 10: 635–68. [Google Scholar] [CrossRef]
- Chicago Board Options Exchange. 2021. CBOE China ETF Volatility Index [VXFXICLS], Retrieved from FRED, Federal Reserve Bank of St. Louis. Available online: https://fred.stlouisfed.org/series/VXFXICLS (accessed on 24 September 2021).
- Chundakkadan, Radeef, and Elizabeth Nedumparambil. 2021. In search of COVID-19 and stock market behavior. Global Finance Journal. [Google Scholar] [CrossRef]
- Concetto, Limongi Chiara, and Francesco Ravazzolo. 2019. Optimism in financial markets: Stock market returns and investor sentiments. Journal of Risk and Financial Management 12: 85. [Google Scholar] [CrossRef] [Green Version]
- Corbet, Shaen, Yang Greg Hou, Yang Hu, Les Oxley, and Danyang Xu. 2021. Pandemic-related financial market volatility spillovers: Evidence from the Chinese COVID-19 epicentre. International Review of Economics & Finance 71: 55–81. [Google Scholar]
- DAX. 2021. Available online: https://www.dax-indices.com/document/Resources/Guides/Guide_to_the_VDAX_Volatility_Indices.pdf (accessed on 24 September 2021).
- Duan, Yuejiao, Lanbiao Liu, and Zhuo Wang. 2021. COVID-19 Sentiment and the Chinese Stock Market: Evidence from the Official News Media and Sina Weibo. Research in International Business and Finance 58: 101432. [Google Scholar] [CrossRef]
- ETB. 2021. Edelman Trust Barometer. News in 14 January 2021. Available online: https://www.devdiscourse.com/article/politics/1405861-reuters-next-public-trust-crumbles-under-covid-19-fake-news--survey (accessed on 7 September 2021).
- Fama, Eugene F. 1991. Efficient capital markets: II. The Journal of Finance 46: 1575–617. [Google Scholar] [CrossRef]
- Fama, Eugene F., and Kenneth R. French. 1996a. Multifactor explanations of asset pricing anomalies. The Journal of Finance 51: 55–84. [Google Scholar] [CrossRef]
- Fama, Eugene F., and Kenneth R. French. 1996b. The CAPM is wanted, dead or alive. The Journal of Finance 51: 1947–58. [Google Scholar] [CrossRef]
- Farid, Saqib, Ghulam Mujtaba Kayani, Muhammad Abubakr Naeem, and Syed Jawad Hussain Shahzad. 2021. Intraday volatility transmission among precious metals, energy and stocks during the COVID-19 pandemic. Resources Policy 72: 102101. [Google Scholar] [CrossRef]
- Friedman, Jerome, Trevor Hastie, and Robert Tibshirani. 2008. Regularization Paths for Generalized Linear Models via Coordinate Descent. Journal of Statistical Software 33: 1–22. [Google Scholar] [CrossRef] [Green Version]
- Gharib, Cheima, Salma Mefteh-Wali, and Sami Ben Jabeur. 2021. The bubble contagion effect of COVID-19 outbreak: Evidence from crude oil and gold markets. Finance Research Letters 38: 101703. [Google Scholar] [CrossRef] [PubMed]
- Grima, Simon, Letife Özdemir, Ercan Özen, and Inna Romānova. 2021. Theinteractions between covid-19 cases in the usa, the vix indexand major stock markets. International Journal of FinancialStudies 9: 26. [Google Scholar] [CrossRef]
- Hachicha, Nejib, Ahmed Ghorbel, Mohamed Chiheb Feki, Sofiane Tahi, and Fredj Amine Dammak. 2021. Hedging Dow Jones Islamic and conventional emerging market indices with CDS, oil, gold and the VSTOXX: A comparison between DCC, ADCC and GO-GARCH models. Borsa Istanbul Review 22: 209–225. [Google Scholar] [CrossRef]
- Hair, Joseph F., Jr., Rolph Anderson, Ron Tatham, and William C. Black. 1995. Multivariate Data Analysis, 3rd ed. New York: Macmillan Publishing Company. [Google Scholar]
- Hale, Thomas, Noam Angrist, Thomas Boby, Emily Cameron-Blake, Laura Hallas, Beatriz Kira, Saptarshi Majumbar, Anna Petherick, Toby Phillips, Helen Tatlow, and et al. 2020. Variation in Government Responses to COVID-19. Blavatnik School of Government Working Paper, 31. Available online: www.bsg.ox.ac.uk/covidtracker (accessed on 18 August 2021).
- Hernandez, Rodrigo, Chrstopher Tobler, and Jorge Brusa. 2010. Contingent claim valuation of express certificates. Banking and Finance Review 2: 119–26. [Google Scholar]
- Ilzetzki, Ethan, Carmen M. Reinhart, and Kenneth S. Rogoff. 2020. Will the Secular Decline in Exchange Rate and Inflation Volatility Survive COVID-19? (No. w28108); Cambridge: National Bureau of Economic Research.
- John, Kose, and Jingrui Li. 2021. COVID-19, volatility dynamics, and sentiment trading. Journal of Banking & Finance 133: 106162. [Google Scholar]
- Keiber, Karl Ludwig, and Helene Samyschew. 2019. The pricing of sentiment risk in European stock markets. The European Journal of Finance 25: 279–302. [Google Scholar] [CrossRef]
- Kim, Hong-Bumm, Jung Ho Park, Seul Ki Lee, and Soocheong Shawn Jang. 2012. Do expectations of future wealth increase outbound tourism? Evidence from Korea. Tourism Management 33: 1141–47. [Google Scholar] [CrossRef] [PubMed]
- Kucher, Oleg, Alexander Kurov, and Marketa Wolfe. 2021. A Shot in the Arm: The Effect of COVID-19 Vaccine News on Financial and Commodity Markets. Available at SSRN 3852364. Available online: https://papers.ssrn.com/sol3/papers.cfm?abstract_id=3852364 (accessed on 18 January 2022).
- Lindner, Thomas, Jonas Puck, and Alain Verbeke. 2020. Misconceptions about multicollinearity in international business research: Identification, consequences, and remedies. Journal of International Business Studies 51: 283–98. [Google Scholar] [CrossRef] [Green Version]
- McKibbin, Warwick, and Roshen Fernando. 2020. The economic impact of COVID-19. In Economics in the Time of COVID-19. London: CEPR Press, p. 45. [Google Scholar]
- Moex. 2021. Available online: https://www.moex.com/s381 (accessed on 24 September 2021).
- Naseem, Sobia, Muhamed Mohsin, Wang Hui, Geng Liyan, and Kun Penglai. 2021. The investor psychology and stock market behavior during the initial era of COVID-19: A study of China, Japan, and the United States. Frontiers in Psychology 12: 16. [Google Scholar] [CrossRef] [PubMed]
- Newey, Whitney K., and Kenneth D. West. 1987. Hypothesis testing with efficient method of moments estimation. International Economic Review 28: 777–87. [Google Scholar] [CrossRef]
- Paserman, Michal. 2017. Comovement or safe haven? The effect of corruption on the market risk of sovereign bonds of emerging economies during financial crises. Journal of International Money and Finance 76: 106–32. [Google Scholar] [CrossRef]
- Prais, Sigbert J., and Christopher B. Winsten. 1954a. Available online: http://cowles.yale.edu/sites/default/files/files/pub/cdp/s-0383.pdf (accessed on 18 January 2021).
- Prais, Sigbert J., and Christopher B. Winsten. 1954b. Trend Estimators and Serial Correlation. Discussion Paper. Chicago: Cowles Commission, vol. 383, pp. 1–26. [Google Scholar]
- Prasad, Akhilesh, Priti Bakhshi, and Arumugam Seetharaman. 2022. The Impact of the US Macroeconomic Variables on the CBOE VIX Index. Journal of Risk and Financial Management 15: 126. [Google Scholar] [CrossRef]
- Rattay, Petra, Niels Michalski, Olga Maria Domanska, Anna Kaltwasser, Freia De Bock, Lothar H. Wieler, and Susanne Jordan. 2021. Differences in risk perception, knowledge and protective behaviour regarding COVID-19 by education level among women and men in Germany. Results from the COVID-19 Snapshot Monitoring (COSMO) study. PLoS ONE 16: e0251694. [Google Scholar] [CrossRef]
- Reis, Pedro Manuel Nogueira, and Carlos Pinho. 2020a. A new European investor sentiment index (EURsent) and its return and volatility predictability. Journal of Behavioral and Experimental Finance 27: 100373. [Google Scholar] [CrossRef]
- Reis, Pedro Manuel Nogueira, and Carlos Pinho. 2020b. A reappraisal of the causal relationship between sentiment proxies and stock returns. Journal of Behavioral Finance 22: 1–23. [Google Scholar] [CrossRef]
- Reis, Pedro Manuel Nogueira, and Carlos Pinho. 2021. COVID-19 Surprise Effect and Government Response Measures on the Influence on Asset Pricing Risk among European Travel and Airline Sectors. In Pandemics and Travel (Tourism Security-Safety and Post Conflict Destinations). Edited by C. Seabra, O. Paiva, C. Silva and J. L. Abrantes. Bingley: Emerald Publishing Limited, pp. 121–39. [Google Scholar]
- Rouatbi, Wael, Ender Demir, Renatas Kizys, and Adam Zaremba. 2021. Immunizing markets against the pandemic: COVID-19 vaccinations and stock volatility around the world. International Review of Financial Analysis 77: 101819. [Google Scholar] [CrossRef]
- Schadner, Wolfgang. 2020. An idea of risk-neutral momentum and market fear. Finance Research Letters 37: 101347. [Google Scholar] [CrossRef] [Green Version]
- Shaikh, Imlak. 2021. Impact of COVID-19 pandemic disease outbreak on the global equity markets. Economic Research-Ekonomska Istraživanja 34: 2317–36. [Google Scholar] [CrossRef]
- Sharma, Aditya, and Arya Kumar. 2019. A review paper on behavioral finance: Study of emerging trends. Qualitative Research in Financial Markets 12: 137–57. [Google Scholar] [CrossRef]
- Shu, Hui-Chu, and Jung Hsien Chang. 2015. Investor sentiment and financial market volatility. Journal of Behavioral Finance 16: 206–19. [Google Scholar] [CrossRef]
- Smales, Lee A. 2017. The importance of fear: Investor sentiment and stock market returns. Applied Economics 49: 3395–421. [Google Scholar] [CrossRef]
- Sun, Yunpeng, Qun Bao, and Zhou Lu. 2021. Coronavirus (COVID-19) outbreak, investor sentiment, and medical portfolio: Evidence from China, Hong Kong, Korea, Japan, and U.S. Pacific-Basin Finance Journal 65: 101463. [Google Scholar] [CrossRef]
- Traub, Lulama Ndibongo, and Thomas S. Jayne. 2006. The Effects of Market Reform on Maize Marketing Margins in South Africa: An Empirical Study. Paper presented at 2006 Annual Meeting, International Association of Agricultural Economists, Queensland, Australia, August 12–18. [Google Scholar]
- Umar, Zaghum, and Mariya Gubareva. 2020. A time–frequency analysis of the impact of the COVID-19 induced panic on the volatility of currency and cryptocurrency markets. Journal of Behavioral and Experimental Finance 28: 100404. [Google Scholar] [CrossRef]
- Umar, Zaghum, Francisco Jareño, and Maria de la O González. 2021. The impact of COVID-19-related media coverage on the return and volatility connectedness of cryptocurrencies and fiat currencies. Technological Forecasting and Social Change 172: 121025. [Google Scholar] [CrossRef]
- VAC. 2021. No Confidence and too Busy: Why Germans Don’t Want to Get Vaccinated. Available online: https://www.iamexpat.de/expat-info/german-expat-news/no-confidence-and-too-busy-why-germans-dont-want-get-vaccinated (accessed on 8 October 2021).
- Van der Wielen, Wouter, and S. Barrios. 2021. Economic Sentiment during the COVID pandemic: Evidence from search behaviour in the E.U. Journal of Economics and Business 115: 105970. [Google Scholar] [CrossRef]
- Van Hoang, Thi Hong, and Qasim Raza Syed. 2021. Investor sentiment and volatility prediction of currencies and commodities during the COVID-19 pandemic. Asian Economics Letters 1: 18642. [Google Scholar] [CrossRef]
- Verma, Rahul, Hasan Baklaci, and Gokçe Soydemir. 2008. The impact of rational and irrational sentiments of individual and institutional investors on DJIA and S&P500 index returns. Applied Financial Economics 18: 1303–17. [Google Scholar] [CrossRef]
- Wang, Hua, Liao Xu, and Susan Sunila Sharma. 2021. Does investor attention increase stock market volatility during the COVID-19 pandemic? Pacific-Basin Finance Journal 69: 101638. [Google Scholar] [CrossRef]
- Whaley, Robert E. 2000. The Investor Fear Gauge. The Journal of Portfolio Management 26: 12–17. [Google Scholar] [CrossRef]
- Wieler, Lothar H., Ute Rexroth, and René Gottschalk. 2021. Emerging COVID-19 Success Story: Germany’s Push to Maintain Progress. Available online: https://ourworldindata.org/covid-exemplar-germany (accessed on 18 January 2022).
- Wooldridge, Jeffrey. 2022. Multicolinearity. Available online: https://twitter.com/jmwooldridge/status/1483493723233259527 (accessed on 1 June 2022).
- Wooldridge, Jeffrey M. 1989. A computationally simple heteroskedasticity and serial correlation robust standard error for the linear regression model. Economics letters 31: 239–43. [Google Scholar] [CrossRef]
- Yilmazkuday, Hakan. 2021. COVID-19 effects on the S&P 500 index. Applied Economics Letters, 1–7. [Google Scholar] [CrossRef]
- Yu, X., K. Xiao, and J. Liu. 2021. Dynamic Co-movements of COVID-19 Pandemic Anxieties and Stock Market Returns. Finance Research Letters 46: 102219. [Google Scholar] [CrossRef]
- Yue, Tian, Sebastian A. Gehricke, Jin E. Zhang, and Zheyao Pan. 2021. The implied volatility smirk in the Chinese equity options market. Pacific-Basin Finance Journal 69: 101624. [Google Scholar] [CrossRef]
- Zaremba, Adam, Renatas Kizys, and David Y. Aharon. 2021. Volatility in international sovereign bond markets: The role of government policy responses to the COVID-19 pandemic. Finance Research Letters 43: 102011. [Google Scholar] [CrossRef]
Figure 1.
Sentiment index proxies.

Figure 2.
Stringency indexes. Note: The source of data was the Oxford COVID-19 government response tracker or index.
Figure 2.
Stringency indexes. Note: The source of data was the Oxford COVID-19 government response tracker or index.


Table 1.
Descriptive statistics.
| Variable | Obs | Mean | Std. Dev. | Min | Max | Description | |
|---|---|---|---|---|---|---|---|
| 1 | new_cases_~n | 3980 | 75.8668 | 154.4672 | −0.002 | 2533.445 | New COVID-19 cases (daily) per million |
| 2 | new_deaths~n | 3811 | 1.462601 | 2.588669 | −12.248 | 20.696 | New COVID-19 deaths (daily) per million |
| 3 | new_tests_~d | 1997 | 1.863897 | 1.550175 | 0 | 7.011 | New COVID-19 tests (daily) per hundred thousand |
| 4 | positive_r~e | 2158 | 0.0573855 | 0.0452539 | 0 | 0.271 | Positive rate (%) |
| 5 | people_ful~d | 1160 | 16.76415 | 16.49526 | 0 | 58.07 | People fully vaccinated per hundred thousand |
| 6 | stringency~x | 3927 | 56.79502 | 17.53061 | 0 | 87.04 | Oxford stringency index |
| 7 | vstoxx | 396 | 25.98636 | 11.00836 | 12.45 | 85.62 | European qualified investor sentiment index (VSTOXX) |
| 8 | vstoxx_vol~t | 396 | 0.0886371 | 0.049868 | 0.0231303 | 0.3391931 | European qualified investor sentiment intraday volatility |
| 9 | russia_vix | 392 | 33.86571 | 13.65535 | 20.23 | 118.24 | Russian qualified investor sentiment index (RVI) |
| 10 | russia_vol~t | 392 | 0.0664946 | 0.040202 | 0.0121616 | 0.3006145 | Russian qualified investor sentiment intraday volatility |
| 11 | dax | 400 | 27.1372 | 11.06237 | 13.54 | 86.01 | German qualified investor sentiment index (VDAX) |
| 12 | dax_int_vol | 400 | 0.0042145 | 0.0799711 | −0.1634 | 0.3739 | German qualified investor sentiment intraday volatility |
| 13 | nikkey_vol | 386 | 24.76728 | 8.192623 | 14.26 | 60.67 | Japanese qualified investor sentiment index (JNIV) |
| 14 | nikkeyint_~l | 386 | 0.0770017 | 0.0580183 | 0.0147601 | 0.4310345 | Japanese qualified investor sentiment intraday volatility |
| 15 | vix | 403 | 26.02256 | 10.80813 | 12.91 | 82.69 | North American qualified investor sentiment index (VIX) |
| 16 | vix_intra_~l | 403 | 0.1206631 | 0.0685835 | 0 | 0.4380771 | North American qualified investor sentiment intraday volatility |
| 17 | china_volc~e | 399 | 28.16298 | 6.939121 | 19.76 | 69.28 | Chinese qualified investor sentiment index (CBOE China—VXFXICLS) |
| 18 | cboe_chion~l | 399 | 0.1232257 | 0.1316906 | 0.0181525 | 1.492925 | Chinese qualified investor sentiment intraday volatility |
| 19 | vsmi | 374 | 21.0252 | 9.24926 | 11.9816 | 74.3865 | Swiss qualified investor sentiment index (VSMI) |
| 20 | hsi | 390 | 23.52556 | 7.184238 | 15.75 | 64.8 | Hong Kong qualified investor sentiment index (VHSI) |
| 21 | hsi_vol | 390 | 0.0037397 | 0.0775892 | −0.2545 | 0.5102 | Hong Kong qualified investor sentiment intraday volatility |
| 22 | xau_perc | 7898 | 0.0000883 | 0.0107905 | −0.0572 | 0.037 | Gold Price daily evolution |
Note: New cases present a negative value corresponding to two records, and new deaths present sixteen negative records due to original database corrections to previous days’ error calculations. All of these errors were distributed among the different countries not affecting the estimations. Investor sentiment intraday volatility is the difference between the maximum index daily value minus the index daily lower value, divided by the index close value, giving the daily range of the investor’s mood.
Table 2.
Correlation matrix.
| Variables | new_cases_~n | new_deaths~n | new_tests_~d | positive_r~e | people_ful~d | stringency~x |
|---|---|---|---|---|---|---|
| new_cases_~n | 1.0000 | |||||
| new_deaths~n | 0.5647 | 1.0000 | ||||
| new_tests_~d | 0.4464 | 0.3348 | 1.0000 | |||
| positive_r~e | 0.5764 | 0.4945 | 0.0667 | 1.0000 | ||
| people_ful~d | −0.1408 | −0.4504 | 0.0482 | −0.2365 | 1.0000 | |
| stringency~x | 0.3301 | 0.5013 | 0.2739 | 0.2565 | −0.3787 | 1.0000 |
Table 3.
Impact of variables on the investor sentiment measured by VIX in U.S. without and with vaccination.
Table 3.
Impact of variables on the investor sentiment measured by VIX in U.S. without and with vaccination.
| Variables | Robust Reg | Prais | Newey | Robust Reg (Vacc.) | Prais (Vacc.) | Newey (Vacc.) |
|---|---|---|---|---|---|---|
| vix_intra_vol | 62.65 *** | 15.88 *** | 62.65 *** | 32.62 *** | 25.10 *** | 32.62 *** |
| [47.44, 77.85] | [10.41, 21.34] | [45.17, 80.13] | [25.19, 40.06] | [19.90, 30.29] | [25.05, 40.20] | |
| new_cases_per_million | −0.0111 * | −0.0100 *** | −0.0111 + | −0.00505 ** | −0.00189 | −0.00505 ** |
| [−0.02, −0.00] | [−0.02, −0.00] | [−0.02, 0.00] | [−0.01, −0.00] | [−0.01, 0.00] | [−0.01, −0.00] | |
| new_deaths_per_million | −0.210 | 0.168 | −0.210 | 0.217 * | −0.0437 | 0.217 + |
| [−0.62, 0.20] | [−0.15, 0.48] | [−0.72, 0.30] | [0.00, 0.43] | [−0.29, 0.20] | [−0.02, 0.45] | |
| new_tests_per_thousand | −2.018 ** | −0.618 + | −2.018 * | −0.130 | 0.220 | −0.130 |
| [−3.31, −0.72] | [−1.27, 0.03] | [−3.63, −0.40] | [−0.70, 0.44] | [−0.27, 0.71] | [−0.74, 0.48] | |
| positive_rate | 126.9 *** | 84.62 *** | 126.9 *** | 43.84 *** | 28.46 + | 43.84 *** |
| [93.86, 160.04] | [40.82, 128.42] | [85.41, 168.48] | [22.70, 64.98] | [−1.21, 58.14] | [21.58, 66.10] | |
| stringency_index | 0.155 + | 0.117 | 0.155 | −0.0156 | 0.0220 | −0.0156 |
| [−0.02, 0.33] | [−0.04, 0.27] | [−0.07, 0.38] | [−0.07, 0.04] | [−0.09, 0.13] | [−0.07, 0.04] | |
| people_fully_vaccinated | −0.0990 *** | −0.109 *** | −0.0990 *** | |||
| [−0.14, −0.06] | [−0.16, −0.05] | [−0.14, −0.06] | ||||
| xau_perc | −31.98 | −13.06 | −31.98 | −10.58 | −8.583 | −10.58 |
| [−130.15, 66.18] | [−37.00, 10.88] | [−130.49, 66.53] | [−45.88, 24.71] | [−37.45, 20.28] | [−43.80, 22.63] | |
| Constant | 10.14 + | 14.36 ** | 10.14 | 17.85 *** | 16.63 *** | 17.85 *** |
| [−1.78, 22.06] | [4.71, 24.00] | [−5.21, 25.49] | [13.47, 22.24] | [8.67, 24.59] | [13.30, 22.41] | |
| Observations | 368 | 368 | 368 | 149 | 149 | 149 |
| R-squared | 0.536 | 0.623 | 0.536 | 0.761 | 0.852 | 0.536 |
| Adjusted R-squared | 0.527 | 0.615 | 0.527 | 0.748 | 0.844 | 0.527 |
Note: confidence intervals in parentheses; + p < 0.10, * p < 0.05, ** p < 0.01, *** p < 0.001; variance inflation factors (VIF) lower than eight in base estimations. First vaccination 14 January 2021.
Table 4.
Impact of variables on the investor sentiment measured by VSTOXX in Europe without and with vaccination.
Table 4.
Impact of variables on the investor sentiment measured by VSTOXX in Europe without and with vaccination.
| Variables | Robust Reg | Prais | Newey | Robust Reg (Vacc.) | Prais (Vacc.) | Newey (Vacc.) |
|---|---|---|---|---|---|---|
| vstoxx_vol_int_eura | 198.1 *** | 183.6 *** | 198.1 *** | 195.8 *** | 182.0 *** | 195.8 *** |
| [174.31, 221.89] | [169.43, 197.71] | [170.99, 225.21] | [171.97, 219.63] | [167.77, 196.13] | [168.63, 222.97] | |
| new_cases_per_million | −0.00133 | −0.00164 + | −0.00133 | −0.00187 * | −0.00195 * | −0.00187 + |
| [−0.00, 0.00] | [−0.00, 0.00] | [−0.00, 0.00] | [−0.00, −0.00] | [−0.00, −0.00] | [−0.00, 0.00] | |
| new_deaths_per_million | 0.0729 + | 0.115 ** | 0.0729 | 0.0664 | 0.104 ** | 0.0664 |
| [−0.01, 0.16] | [0.04, 0.19] | [−0.03, 0.17] | [−0.02, 0.15] | [0.03, 0.18] | [−0.03, 0.17] | |
| new_tests_per_thousand | −0.275 *** | −0.0926 | −0.275 *** | −0.157 + | 0.00236 | −0.157 + |
| [−0.42, −0.13] | [−0.29, 0.10] | [−0.43, −0.12] | [−0.33, 0.01] | [−0.21, 0.21] | [−0.34, 0.02] | |
| positive_rate | 64.25 ** | 63.40 ** | 64.25 * | 72.66 ** | 70.16 *** | 72.66 * |
| [15.92, 112.58] | [22.75, 104.04] | [6.10, 122.40] | [22.71, 122.62] | [29.57, 110.76] | [12.56, 132.77] | |
| stringency_index | −0.00614 | −0.0116 | −0.00614 | −0.0106 | −0.0174 * | −0.0106 |
| [−0.02, 0.01] | [−0.03, 0.00] | [−0.02, 0.01] | [−0.03, 0.00] | [−0.03, −0.00] | [−0.03, 0.01] | |
| people_fully_vaccinated | −0.0131 ** | −0.0178 * | −0.0131 * | |||
| [−0.02, −0.00] | [−0.03, −0.00] | [−0.02, −0.00] | ||||
| xau_perc | 1.440 | 49.39 | 1.440 | −0.187 | 47.83 | −0.187 |
| [−82.02, 84.90] | [−22.50, 121.29] | [−84.38, 87.26] | [−83.74, 83.36] | [−23.83, 119.48] | [−85.89, 85.51] | |
| Constant | 9.496 ** | 10.17 * | 9.496 * | 11.14 ** | 12.87 ** | 11.14 * |
| [2.39, 16.60] | [2.29, 18.04] | [1.13, 17.86] | [3.73, 18.55] | [4.75, 20.99] | [2.31, 19.97] | |
| Observations | 536 | 536 | 536 | 216 | 216 | 216 |
| R-squared | 0.634 | 0.594 | 0.634 | 0.638 | 0.599 | 0.638 |
| Adjusted R-squared | 0.629 | 0.589 | 0.629 | 0.632 | 0.593 | 0.632 |
Note: confidence intervals in parentheses; + p < 0.10, * p < 0.05, ** p < 0.01, *** p < 0.001; Variance Inflation factors (VIF) lower than four in base estimations. First vaccination 16 January 2021.
Table 5.
Impact of variables on the investor sentiment measured by CBOE China (VXFXICLS) without and with vaccination.
Table 5.
Impact of variables on the investor sentiment measured by CBOE China (VXFXICLS) without and with vaccination.
| Variables | Robust Reg | Prais | Newey | Robust Reg (Vacc.) | Prais (Vacc.) | Newey (Vacc.) |
|---|---|---|---|---|---|---|
| cboe_chion_volatil | 18.85 *** | 7.236 *** | 18.85 *** | 13.39 + | 14.10 *** | 13.39 + |
| [11.16, 26.55] | [4.92, 9.55] | [10.42, 27.29] | [−0.30, 27.08] | [8.27, 19.93] | [−0.52, 27.30] | |
| new_cases_per_million | −0.841 *** | 0.152 | −0.841 *** | 128.8 * | 86.68 | 128.8 * |
| [−1.32, −0.36] | [−0.34, 0.64] | [−1.29, −0.39] | [26.71, 230.96] | [47.24, 220.60] | [22.12, 235.56] | |
| new_deaths_per_million | 4.350 ** | −2.198 | 4.350 * | OMITTED | OMITTED | OMITTED |
| [1.20, 7.50] | [−8.52, 4.12] | [0.66, 8.04] | OMITTED | OMITTED | OMITTED | |
| stringency_index | −0.00870 | −0.0153 | −0.00870 | −0.257 *** | −0.225 ** | −0.257 *** |
| [−0.07, 0.05] | [−0.10, 0.07] | [−0.09, 0.07] | [−0.38, −0.14] | [−0.36, −0.08] | [−0.39, −0.13] | |
| people_fully_vaccinated | −1.484 * | −1.544 | −1.484 * | |||
| [−2.88, −0.09] | [−3.86, 0.77] | [−2.90, −0.07] | ||||
| xau_perc | −2.762 | −8.687 | −2.762 | −0.176 | 9.192 | −0.176 |
| [100.66, 95.13] | [−30.76, 13.39] | [109.76, 104.24] | [−99.73, 99.37] | [90.05, 108.44] | [−95.74, 95.39] | |
| Constant | 26.44 *** | 28.36 *** | 26.44 *** | 40.11 *** | 38.35 *** | 40.11 *** |
| [22.13, 30.75] | [21.86, 34.86] | [20.93, 31.94] | [33.04, 47.17] | [28.39, 48.31] | [32.27, 47.95] | |
| Observations | 375 | 375 | 375 | 82 | 82 | 82 |
| R-squared | 0.131 | 0.638 | 0.131 | 0.356 | 0.543 | 0.356 |
| Adjusted R-squared | 0.119 | 0.633 | 0.119 | 0.313 | 0.513 | 0.313 |
Note: confidence intervals in parentheses; + p < 0.10, * p < 0.05, ** p < 0.01, *** p < 0.001; variance inflation factors (VIF) less than two in base estimations. First vaccination 15 November 2020.
Table 6.
Impact of variables on the investor sentiment measured by Nikkei-JNIV without and with vaccination.
Table 6.
Impact of variables on the investor sentiment measured by Nikkei-JNIV without and with vaccination.
| Variables | Robust Reg | Prais | Newey | Robust Reg (Vacc.) | Prais (Vacc.) | Newey (Vacc.) |
|---|---|---|---|---|---|---|
| nikkeyint_vol | 20.76 ** | 10.99 *** | 20.76 ** | 3.266 | 3.924 | 3.266 |
| [6.75, 34.77] | [6.72, 15.25] | [5.49, 36.03] | [−5.92, 12.46] | [−0.84, 8.68] | [−7.27, 13.80] | |
| new_cases_per_million | 0.000948 | −0.0612 ** | 0.000948 | 0.0255 | 0.00418 | 0.0255 |
| [−0.05, 0.06] | [−0.10, −0.02] | [−0.06, 0.06] | [−0.02, 0.07] | [−0.03, 0.04] | [−0.03, 0.08] | |
| new_deaths_per_million | 0.933 | −1.122 | 0.933 | 4.856 *** | 0.866 | 4.856 *** |
| [−1.86, 3.73] | [−3.23, 0.99] | [−2.31, 4.17] | [2.59, 7.12] | [−0.79, 2.52] | [2.59, 7.12] | |
| new_tests_per_thousand | −23.20 *** | −2.873 ** | −23.20 *** | 0.106 | 0.756 | 0.106 |
| [30.34, −16.06] | [−4.92, −0.83] | [30.86, −15.53] | [−3.35, 3.56] | [−1.15, 2.67] | [−3.50, 3.71] | |
| positive_rate | 34.69 * | 29.01 * | 34.69 * | −20.04 | 0.453 | −20.04 |
| [7.15, 62.22] | [4.55, 53.46] | [1.04, 68.33] | [−57.13, 17.05] | [−38.13, 39.04] | [−60.06, 19.98] | |
| stringency_index | 0.351 *** | −0.000595 | 0.351 *** | −0.348 *** | −0.219 + | −0.348 *** |
| [0.21, 0.49] | [−0.15, 0.14] | [0.19, 0.52] | [−0.49, −0.21] | [−0.45, 0.01] | [−0.51, −0.19] | |
| people_fully_vaccinated | 0.0805 * | 0.00767 | 0.0805 + | |||
| [0.00, 0.16] | [−0.10, 0.11] | [−0.02, 0.18] | ||||
| xau_perc | −24.73 | 0.360 | −24.73 | −4.426 | 18.38 | −4.426 |
| [104.07, 54.61] | [−18.99, 19.71] | [108.44, 58.98] | [−64.14, 55.28] | [−15.86, 52.63] | [−59.43, 50.58] | |
| Constant | 14.44 *** | 25.63 *** | 14.44 *** | 34.66 *** | 29.62 *** | 34.66 *** |
| [10.69, 18.18] | [19.62, 31.63] | [9.79, 19.08] | [27.97, 41.34] | [18.41, 40.84] | [26.60, 42.72] | |
| Observations | 364 | 364 | 364 | 104 | 104 | 104 |
| R-squared | 0.419 | 0.690 | 0.419 | 0.317 | 0.877 | 0.317 |
| Adjusted R-squared | 0.407 | 0.684 | 0.407 | 0.260 | 0.867 | 0.260 |
Note: confidence intervals in parentheses; + p < 0.10, * p < 0.05, ** p < 0.01, *** p < 0.001; variance inflation factors (VIF) less than ten in base estimations. First vaccination 15 March 2021.
Table 7.
Impact of variables on the investor sentiment measured by Hong Kong stock exchange (HSI) without and with vaccination.
Table 7.
Impact of variables on the investor sentiment measured by Hong Kong stock exchange (HSI) without and with vaccination.
| Variables | Robust Reg | Prais | Newey | Robust Reg (Vacc.) | Prais (Vacc.) | Newey (Vacc.) |
|---|---|---|---|---|---|---|
| hsi_vol | 16.37 * | 14.76 *** | 16.37 ** | 11.96 | 9.794 *** | 11.96 |
| [2.83, 29.91] | [12.71, 16.82] | [4.66, 28.08] | [−5.04, 28.95] | [6.98, 12.61] | [−3.53, 27.45] | |
| new_cases_per_million | 0.151 + | −0.00263 | 0.151 | 0.913 *** | 0.116 | 0.913 *** |
| [−0.00, 0.30] | [−0.10, 0.09] | [−0.04, 0.34] | [0.42, 1.41] | [−0.17, 0.40] | [0.47, 1.36] | |
| new_deaths_per_million | −2.847 | 0.363 | −2.847 | 0.310 | −1.627 | 0.310 |
| [−7.11, 1.42] | [−1.62, 2.35] | [−7.95, 2.25] | [−11.02, 11.63] | [−5.81, 2.55] | [−10.38, 11.00] | |
| stringency_index | −0.326 *** | −0.184 *** | −0.326 *** | −0.880 *** | −0.553 ** | −0.880 *** |
| [−0.42, −0.23] | [−0.27, −0.10] | [−0.45, −0.20] | [−1.15, −0.61] | [−0.90, −0.21] | [−1.22, −0.54] | |
| people_fully_vaccinated | −0.108 ** | −0.0938 + | −0.108 * | |||
| [−0.18, −0.03] | [−0.20, 0.01] | [−0.20, −0.02] | ||||
| xau_perc | −10.36 | −0.0746 | −10.36 | −11.54 | −5.762 | −11.54 |
| [104.26, 83.53] | [−14.21, 14.06] | [112.78, 92.05] | [−63.57, 40.48] | [−26.94, 15.42] | [−63.04, 39.96] | |
| Constant | 43.93 *** | 35.03 *** | 43.93 *** | 81.49 *** | 58.87 *** | 81.49 *** |
| [37.70, 50.17] | [29.73, 40.34] | [35.70, 52.17] | [61.17, 101.80] | [33.70, 84.04] | [56.10, 106.88] | |
| Observations | 381 | 381 | 381 | 113 | 113 | 113 |
| R-squared | 0.195 | 0.770 | 0.195 | 0.395 | 0.887 | 0.395 |
| Adjusted R-squared | 0.184 | 0.767 | 0.184 | 0.361 | 0.881 | 0.361 |
Note: confidence intervals in parentheses; + p < 0.10, * p < 0.05, ** p < 0.01, *** p < 0.001; variance inflation factors (VIF) less than five in base estimations. First vaccination 23 March 2021.
Table 8.
Impact of variables on the investor sentiment measured by Germany’s VDAX without and with vaccination.
Table 8.
Impact of variables on the investor sentiment measured by Germany’s VDAX without and with vaccination.
| Variables | Robust Reg | Prais | Newey | Robust Reg (Vacc.) | Prais (Vacc.) | Newey (Vacc.) |
|---|---|---|---|---|---|---|
| dax_int_vol | 13.86 | 13.85 *** | 13.86 | 10.90 *** | 10.66 *** | 10.90 *** |
| [−4.57, 32.29] | [11.66, 16.05] | [−3.41, 31.12] | [6.96, 14.84] | [8.84, 12.47] | [7.25, 14.54] | |
| new_cases_per_million | −0.0195 *** | 0.000341 | −0.0195 *** | −0.00468 ** | −0.000133 | −0.00468 ** |
| [−0.03, −0.01] | [−0.00, 0.00] | [−0.03, −0.01] | [−0.01, −0.00] | [−0.00, 0.00] | [−0.01, −0.00] | |
| new_deaths_per_million | 0.377 | −0.00775 | 0.377 | 0.180 * | 0.0514 | 0.180 * |
| [−0.08, 0.83] | [−0.13, 0.12] | [−0.19, 0.94] | [0.02, 0.34] | [−0.02, 0.12] | [0.02, 0.33] | |
| stringency_index | −0.264 * | −0.112 + | −0.264 + | 0.376 *** | 0.413 *** | 0.376 *** |
| [−0.48, −0.05] | [−0.23, 0.01] | [−0.54, 0.01] | [0.25, 0.50] | [0.25, 0.57] | [0.25, 0.50] | |
| people_fully_vaccinated | 0.0398 * | 0.0449 | 0.0398 * | |||
| [0.01, 0.07] | [−0.01, 0.10] | [0.00, 0.08] | ||||
| xau_perc | 15.12 | −14.08 + | 15.12 | 4.805 | 2.369 | 4.805 |
| [131.12, 161.35] | [−29.14, 0.98] | [140.49, 170.72] | [−20.60, 30.21] | [−12.58, 17.32] | [−20.41, 30.02] | |
| Constant | 46.51 *** | 35.44 *** | 46.51 *** | −8.156 + | −11.19 + | −8.156 |
| [33.29, 59.73] | [27.12, 43.76] | [29.32, 63.71] | [−17.82, 1.51] | [−23.99, 1.62] | [−17.90, 1.59] | |
| Observations | 363 | 363 | 363 | 159 | 159 | 159 |
| R-squared | 0.114 | 0.649 | 0.114 | 0.691 | 0.934 | 0.691 |
| Adjusted R-squared | 0.101 | 0.644 | 0.101 | 0.678 | 0.931 | 0.678 |
Note: confidence intervals in parentheses; + p < 0.10, * p < 0.05, ** p < 0.01, *** p < 0.001; variance inflation factors (VIF) less than ten in base estimations. First vaccination 16 January 2021.
Table 9.
Impact of variables on the sentiment of Russia’s RVI without and with vaccination.
| Variables | Robust Reg | Prais | Newey | Robust Reg (Vacc.) | Prais (Vacc.) | Newey (Vacc.) |
|---|---|---|---|---|---|---|
| russia_vol_int | 99.18 *** | 14.48 * | 99.18 *** | 7.503 | −5.351 | 7.503 |
| [55.71, 142.65] | [3.13, 25.83] | [51.10, 147.26] | [−5.26, 20.26] | [−11.79, 1.09] | [−6.30, 21.30] | |
| new_cases_per_million | 0.0941 *** | −0.0126 | 0.0941 ** | 0.0400 * | −0.0135 | 0.0400 * |
| [0.04, 0.15] | [−0.06, 0.03] | [0.04, 0.15] | [0.01, 0.07] | [−0.05, 0.02] | [0.01, 0.07] | |
| new_deaths_per_milion | −0.803 | −0.272 | −0.803 | −0.0837 | −0.346 | −0.0837 |
| [−2.20, 0.60] | [−1.71, 1.17] | [−2.41, 0.81] | [−1.28, 1.12] | [−1.38, 0.69] | [−1.33, 1.16] | |
| new_tests_per_thousand | −6.129 *** | −1.523 * | −6.129 *** | −0.392 | −0.181 | −0.392 |
| [−8.40, −3.86] | [−2.70, −0.35] | [−8.80, −3.45] | [−0.98, 0.20] | [−0.72, 0.36] | [−1.01, 0.22] | |
| positive_rate | −241.0 ** | −124.6 + | −241.0 * | −142.3 * | 141.7 + | −142.3 + |
| [−402.95, −79.03] | [−265.94, 16.71] | [−432.09, −49.90] | [267.37, −17.30] | [−12.19, 295.53] | [−291.94, 7.27] | |
| stringency_index | 0.218 *** | 0.261 *** | 0.218 *** | −0.0523 + | −0.0909 * | −0.0523 |
| [0.14, 0.29] | [0.16, 0.37] | [0.13, 0.31] | [−0.11, 0.01] | [−0.16, −0.02] | [−0.12, 0.01] | |
| people_fully_vaccinated | −1.080 *** | −0.927 *** | −1.080 *** | |||
| [−1.22, −0.94] | [−1.18, −0.68] | [−1.25, −0.91] | ||||
| xau_perc | 52.64 | −9.642 | 52.64 | −12.00 | −7.217 | −12.00 |
| [−55.16, 160.44] | [−39.63, 20.35] | [−60.15, 165.43] | [−47.41, 23.40] | [−26.00, 11.57] | [−48.24, 24.24] | |
| Constant | 31.77 *** | 28.82 *** | 31.77 *** | 38.40 *** | 34.71 *** | 38.40 *** |
| [25.45, 38.09] | [21.67, 35.97] | [24.75, 38.78] | [35.15, 41.66] | [30.20, 39.22] | [35.12, 41.69] | |
| Observations | 308 | 308 | 308 | 79 | 79 | 79 |
| R-squared | 0.597 | 0.773 | 0.597 | 0.911 | 0.975 | 0.911 |
| Adjusted R-squared | 0.587 | 0.768 | 0.587 | 0.900 | 0.972 | 0.900 |
Note: confidence intervals in parentheses; + p < 0.10, * p < 0.05, ** p < 0.01, *** p < 0.001; variance inflation factors (VIF) mean less than ten in base estimations. First vaccination 2 March 2021.
Table 10.
Impact of variables on the investor sentiment measured Switzerland’s VSMI without and with vaccination.
Table 10.
Impact of variables on the investor sentiment measured Switzerland’s VSMI without and with vaccination.
| Variables | Robust Reg | Prais | Newey | Robust Reg (Vacc.) | Prais (Vacc.) | Newey (Vacc.) |
|---|---|---|---|---|---|---|
| new_cases_per_million | 0.00196 + | −0.000140 | 0.00196 + | −0.00213 * | −0.000497 | −0.00213 * |
| [−0.00, 0.00] | [−0.00, 0.00] | [−0.00, 0.00] | [−0.00, −0.00] | [−0.00, 0.00] | [−0.00, −0.00] | |
| new_deaths_per_million | −0.0250 | 0.00115 | −0.0250 | 0.235 *** | 0.0796 | 0.235 *** |
| [−0.16, 0.11] | [−0.07, 0.07] | [−0.19, 0.14] | [0.12, 0.35] | [−0.02, 0.18] | [0.10, 0.37] | |
| new_tests_per_thousand | −1.621 *** | −0.527 * | −1.621 *** | −0.490 ** | −0.222 | −0.490 * |
| [−1.98, −1.26] | [−0.93, −0.13] | [−2.08, −1.17] | [−0.80, −0.18] | [−0.61, 0.16] | [−0.86, −0.12] | |
| positive_rate | 16.12 * | 15.79 * | 16.12 * | −5.619 | −0.415 | −5.619 |
| [2.84, 29.39] | [2.56, 29.02] | [0.72, 31.51] | [−15.25, 4.01] | [−16.85, 16.02] | [−16.35, 5.11] | |
| stringency_index | −0.0229 | −0.0617 | −0.0229 | 0.126 * | 0.172 + | 0.126 + |
| [−0.08, 0.04] | [−0.15, 0.02] | [−0.10, 0.05] | [0.02, 0.23] | [−0.03, 0.37] | [−0.01, 0.26] | |
| people_fully_vaccinated | −0.0395 * | −0.0266 | −0.0395 * | |||
| [−0.07, −0.01] | [−0.10, 0.05] | [−0.08, −0.00] | ||||
| xau_perc | 0.497 | 2.114 | 0.497 | −13.68 | 0.310 | −13.68 |
| [−30.05, 31.05] | [−8.43, 12.66] | [−31.29, 32.28] | [−38.95, 11.59] | [−14.15, 14.77] | [−39.34, 11.98] | |
| Constant | 22.00 *** | 21.48 *** | 22.00 *** | 11.29 *** | 7.400 | 11.29 ** |
| [19.66, 24.34] | [17.38, 25.57] | [19.05, 24.96] | [5.53, 17.06] | [−4.24, 19.04] | [4.07, 18.51] | |
| Observations | 314 | 314 | 314 | 162 | 162 | 162 |
| R-squared | 0.316 | 0.769 | 0.316 | 0.543 | 0.880 | 0.543 |
| Adjusted R-squared | 0.303 | 0.764 | 0.303 | 0.522 | 0.874 | 0.522 |
Note: confidence intervals in parentheses; + p < 0.10, * p < 0.05, ** p < 0.01, *** p < 0.001; variance inflation factors (VIF) less than seven in base estimations. First vaccination 18 January 2021.
Table 11.
Resumed impact (sign) of variables on the investor sentiment of each region without and with vaccination (first and second columns, respectively).
Table 11.
Resumed impact (sign) of variables on the investor sentiment of each region without and with vaccination (first and second columns, respectively).
| Variables | The U.S. | Europe | China | Japan | Hong Kong | Russia | Germany | Switzerland | ||||||||
|---|---|---|---|---|---|---|---|---|---|---|---|---|---|---|---|---|
| Sentiment_intravol | + | + | + | + | + | + | + | N.S. | + | N.S. | + | N.S. | N.S. | + | N.A. | N.A. |
| new_cases_per_million | − | − | N.S. | − | − | + | N.S. | N.S. | N.S. | + | + | + | − | − | + | − |
| new_deaths_per_million | N.S. | + | + | N.S. | + | O. | N.S. | + | N.S. | N.S. | N.S. | N.S. | N.S. | + | N.S. | + |
| new_tests_per_thousand | − | N.S. | − | − | N.A. | N.A. | − | N.S. | N.A. | N.A. | − | N.S. | N.A. | N.A. | − | − |
| positive_rate | + | + | + | + | N.A. | N.A. | + | N.S. | N.A. | N.A. | − | − | N.A. | N.A. | + | N.S. |
| stringency_index | N.S. | N.S. | N.S. | N.S. | N.S. | − | + | − | − | − | + | − | − | + | N.S. | + |
| people_fully_vaccinatedd | − | − | − | + | − | − | + | − | ||||||||
Note: N.S.—nonsignificant; N.A.—non available in the database; O.—omitted by the model; +—positive effect; −—negative effect; black cell means no vaccination period.
Publisher’s Note: MDPI stays neutral with regard to jurisdictional claims in published maps and institutional affiliations. |
© 2022 by the author. Licensee MDPI, Basel, Switzerland. This article is an open access article distributed under the terms and conditions of the Creative Commons Attribution (CC BY) license (https://creativecommons.org/licenses/by/4.0/).
Share and Cite
MDPI and ACS Style
Reis, P.M.N. Determinants of Qualified Investor Sentiment during the COVID-19 Pandemic in North America, Asia, and Europe. Economies 2022, 10, 143. https://0-doi-org.brum.beds.ac.uk/10.3390/economies10060143
AMA Style
Reis PMN. Determinants of Qualified Investor Sentiment during the COVID-19 Pandemic in North America, Asia, and Europe. Economies. 2022; 10(6):143. https://0-doi-org.brum.beds.ac.uk/10.3390/economies10060143
Chicago/Turabian StyleReis, Pedro M. Nogueira. 2022. "Determinants of Qualified Investor Sentiment during the COVID-19 Pandemic in North America, Asia, and Europe" Economies 10, no. 6: 143. https://0-doi-org.brum.beds.ac.uk/10.3390/economies10060143
Note that from the first issue of 2016, this journal uses article numbers instead of page numbers. See further details here.