Does Foreign Direct Investment and Trade Promote Economic Growth? Evidence from Albania


1
Land, Farm and Agribusiness Management Department, Harper Adams University, Newport TF10 8NB, UK
2
Faculty of Commerce, Suez Canal University, Ismailia 41522, Egypt
3
Faculty of Business Administration, Economics & Political Science, The British University in Egypt, Cairo 11837, Egypt
*
Author to whom correspondence should be addressed.
Economies 2021, 9(1), 1; https://0-doi-org.brum.beds.ac.uk/10.3390/economies9010001
Submission received: 5 August 2020
/
Revised: 28 September 2020
/
Accepted: 30 September 2020
/
Published: 1 January 2021
(This article belongs to the Special Issue FDI (Foreign Direct Investment) and Economic Growth)
Abstract
:Albania has experienced a rapid transition from a centrally planned economy to a mixed economy since the fall of communism in 1989. Policy changes, trade liberalization, and privatization have come about at a rapid pace, allowing foreign direct investment (FDI) and international trade to become key components of Albania’s economy. Against this backdrop, this study investigates the relationships among FDI, trade, and economic growth in Albania. Annual time-series data were obtained from the World Bank. Then, the following econometric tests were performed on the variables representing FDI inflows, exports, and GDP as proxies for FDI, trade, and economic growth: the unit root test; the unit root test with a structural break; Johansen cointegration analysis; the error correction model; and the Granger causality test. The results revealed a long-term relationship between FDI, trade, and economic growth. The Granger causality tests found unidirectional causality. Economic growth brought about exports and FDI in the short term but not vice versa. In conclusion, policymakers need to design policies that promote technology-based, export-promoting FDI to meet the needs of the economy and develop specialized sectors that are competitive in the global market. Furthermore, the salient takeaway is that the penetration of export markets should be promoted as much as the furtherance of FDI.
JEL Classification:
C22; E22; E611. Introduction
The study of the relationship between foreign direct investment (FDI) and economic growth has been of great interest to both academics and policymakers. Globalization has been characterized by the growing interdependence of economic actors across countries and has witnessed trade barriers lowered and other incentives doled out to stimulate FDI, which now accounts for 10% of global gross fixed capital formation (Alfaro and Chauvin 2016; Vendrell-Herrero et al. 2018).
Until now, most research has focused on the developing world, where FDI accounts for a higher proportion of gross domestic product (GDP). FDI has been regarded as the most stable and prevalent component of foreign capital inflows in developing and transition countries. A preponderance of studies shows that FDI stimulates technology spillovers, develops human capital, and creates a more competitive business environment. All of these factors promote economic growth, which is essential toward alleviating poverty and increasing welfare standards (Adams 2009; Moran 2012). Nevertheless, empirical research on FDI’s real effect on economic growth remains inconclusive and ambiguous.
A transition economy is one that is undergoing the change from a centrally planned economy to a market economy, where forces of supply and demand, and not the government, determine economic decisions (Vendrell-Herrero et al. 2018).
Central and Eastern European (CEE) countries have experienced this transition ever since communism fell in 1989. Rapid structural change resulted in much initial economic hardship as centralized systems had failed to balance supply and demand for general goods and services in these economies. This situation came about because these systems failed to incentivize efficiency as production was focused on maximizing the gross product, which encouraged excessive use of input and the lack of innovation (Bevan and Estrin 2004). This created an obsolete capital stock and a large technology gap between CEE economies and developed economies. To resolve this issue, transition economies typically undertook the following processes (Stejskal et al. 2018; Svejnar 2002):
- Liberalization: Allowing prices to be determined by competitive free markets and lowering trade barriers.
- Macroeconomic stabilization: Reducing inflation through monetary and fiscal policies.
- Restructuring and privatization: Transferring the ownership of enterprises from the state to private owners and creating a viable financial sector to support private enterprises.
- Legal and institutional reforms: Introducing democracy and lowering government intervention in the economy.
Policymakers in transition countries have sought out FDI as it is the main avenue through which technology is transferred from developed countries (Borensztein et al. 1998).
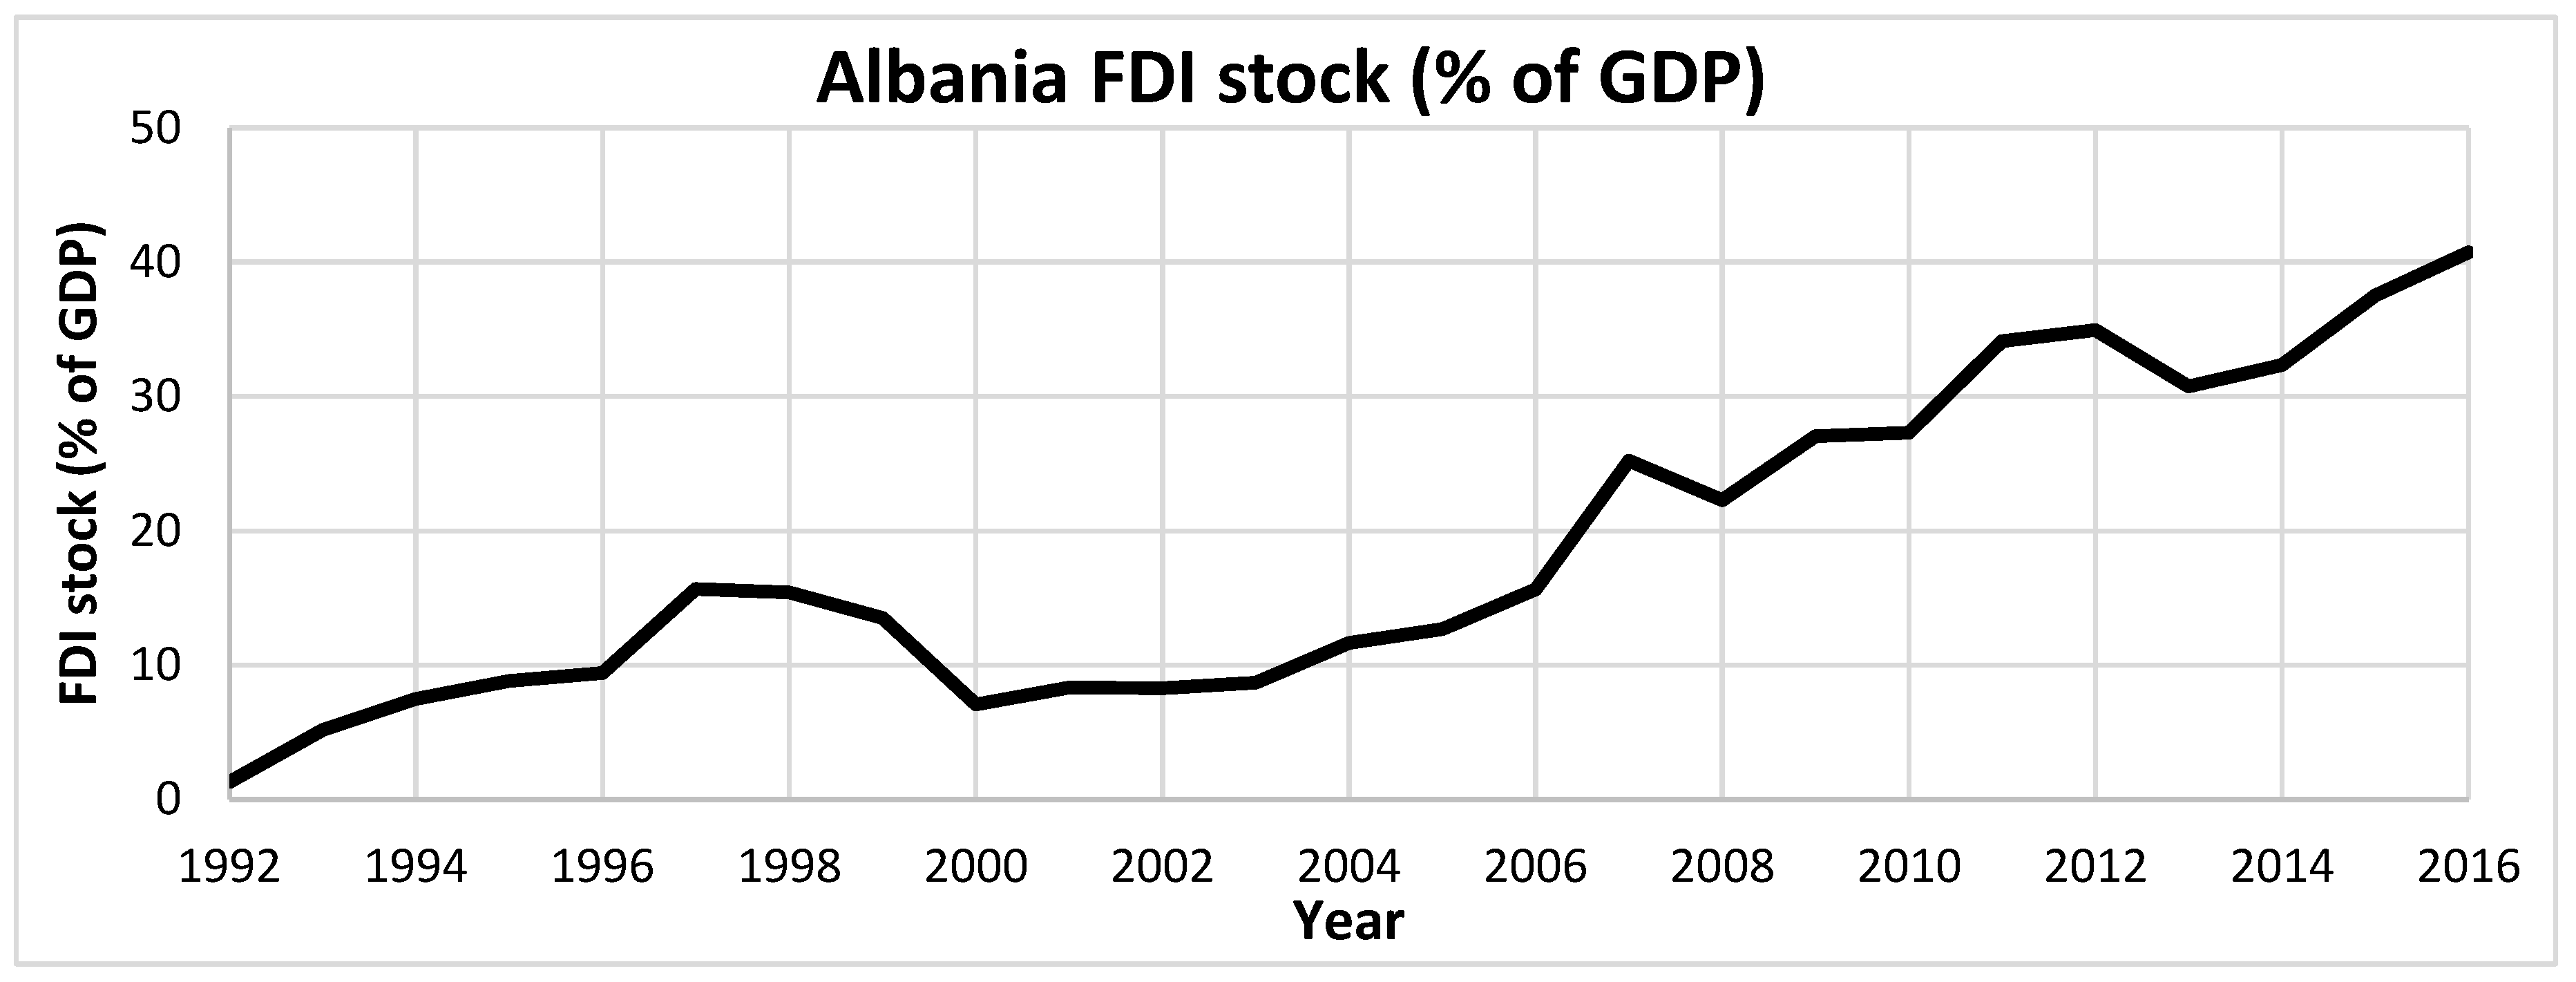
Albania has been in economic transition since the 1990s. Its government has actively supported FDI and open trade with favorable policies such as low taxes, subsidies, and supportive legislation. A key example of these policies is the abatement of fees in general (Boriçi and Osmani 2015). Albania has thus been able to accumulate a significant FDI stock, worth over 40% of GDP, according to the World Bank (2017), as shown in Figure 1. Albania is also in an attractive location for investors as it has ports on both the Adriatic and Ionian seas (Breitung 2008).
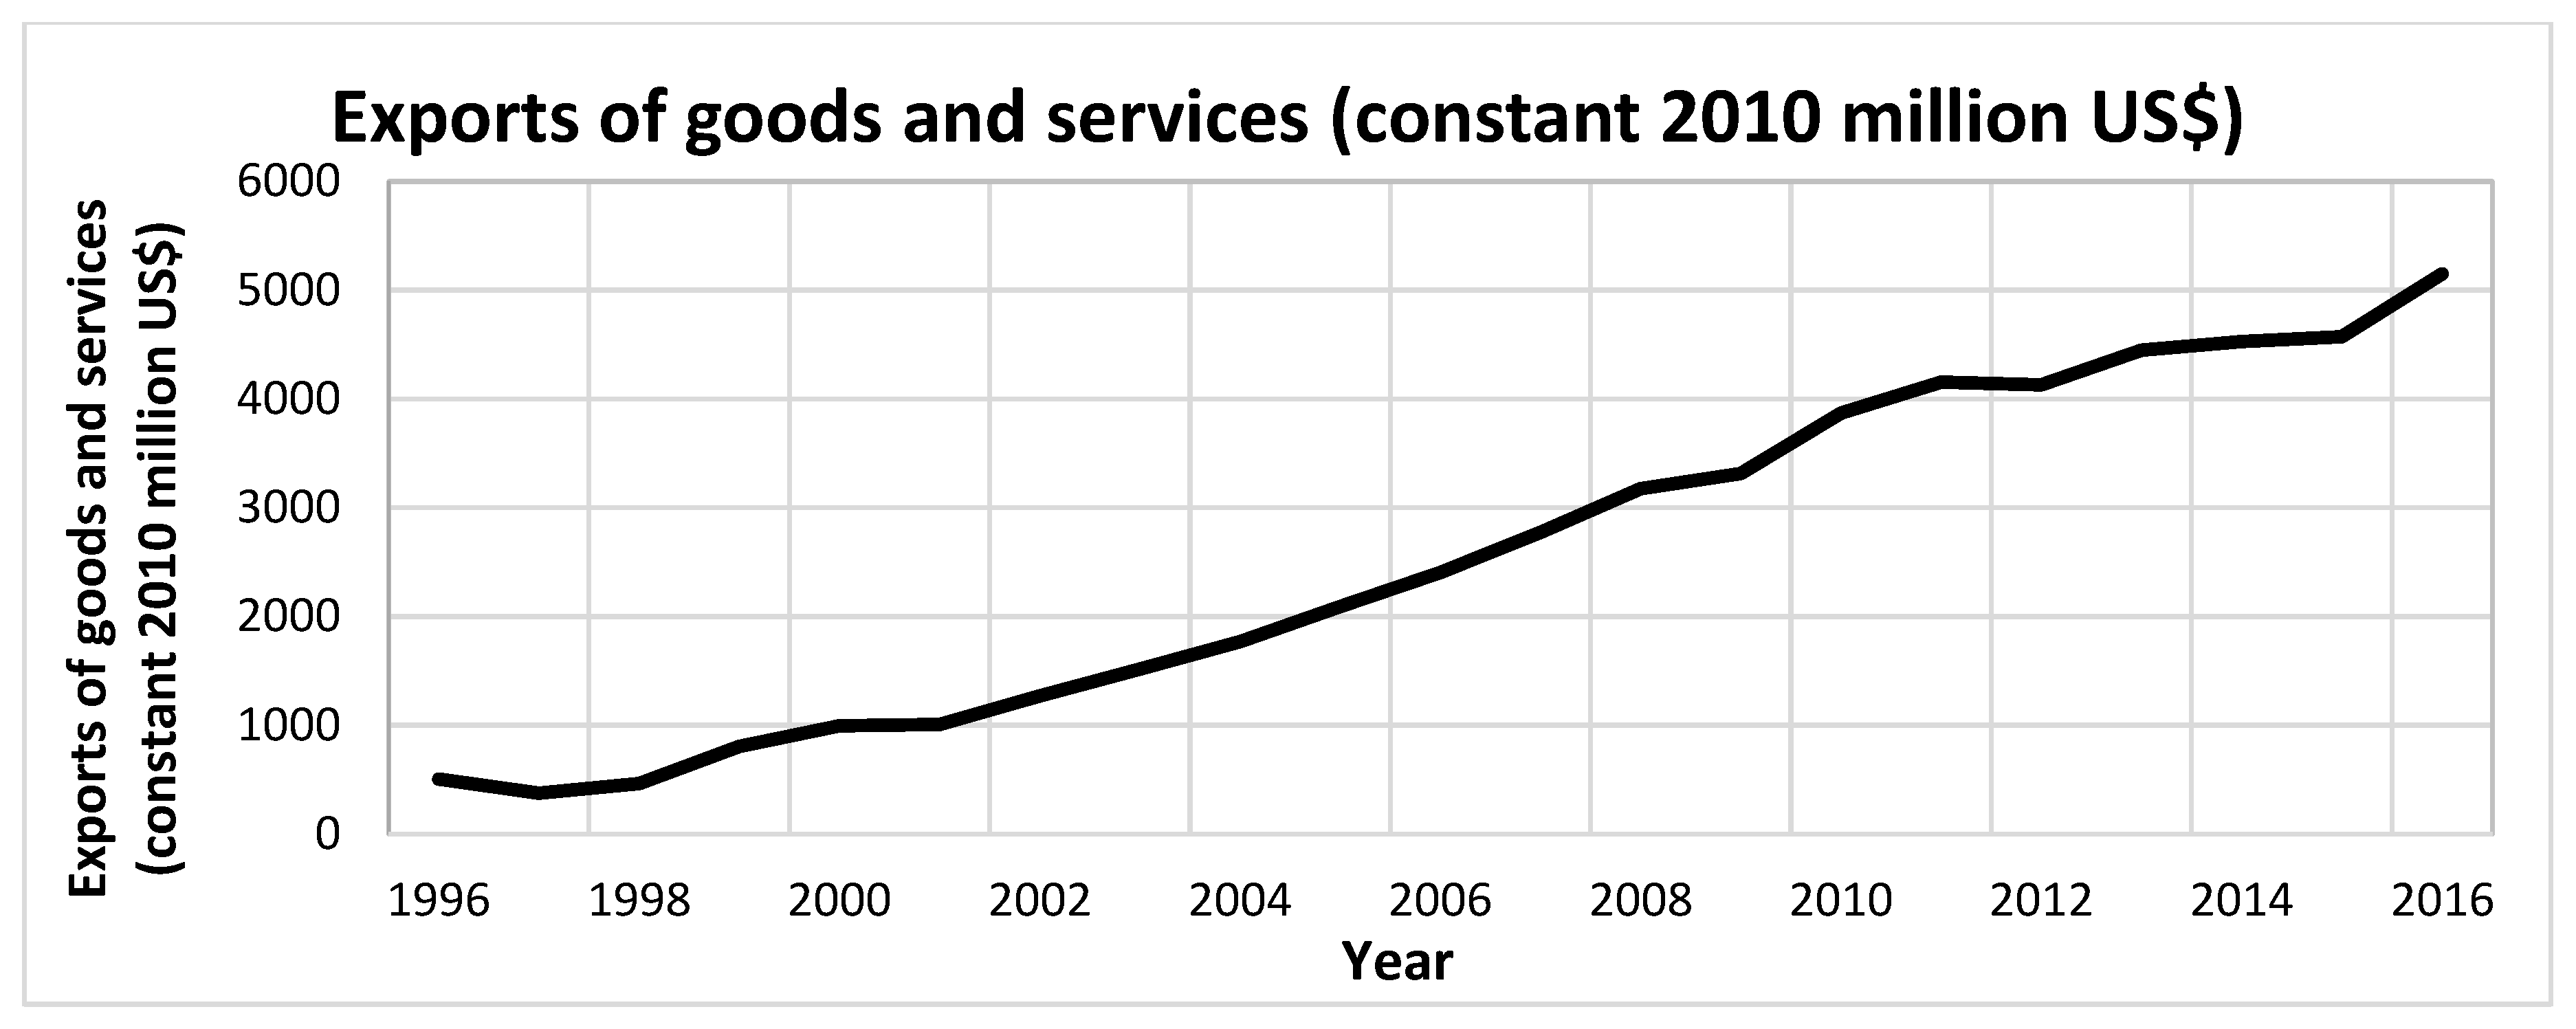
As Albania has opened its trade policy this has resulted in a rapid increase in international trade, a key indicator of economic development. Figure 2 shows how exports have consistently increased since 1996. Exports in 2016 accounted for about 28% of GDP, compared to around 11% in 1996.
Albania has furthermore experienced rapid GDP growth when compared with other CEE economies, which has been attributed to its many underdeveloped sectors, including mining, infrastructure, agribusiness, services, telecommunications, and energy. The government has sought to develop these key sectors, and the workforce, which is predominantly low-skilled but low cost, is therefore attractive to foreign investors (Boriçi and Osmani 2015).
This study adds to the previous literature on FDI and economic growth in CEE countries, by focusing on the case of Albania. The aim is to produce reliable results that enhance our understanding of the causal relationship among FDI, trade, and economic growth through an econometric analysis based on a structural break test and vector error correction model (VECM) to examine the dynamic interaction of the short- and long-run relationships among the selected variables used in the study.
The rest of the study is organized as follows. The next section presents a review of the previous literature. Next, the study reviews methodological differences to help explain the variance in the results of previous studies. Section 3 will present the methodology employed by the study in examining the relationships among FDI, exports, and economic growth. Section 4 reports the main empirical results. Section 5 presents and discusses the results of this analysis. Finally, Section 6 offers a conclusion and suggestions for future research.
2. Literature Review
Previous studies on the relationship between FDI and economic growth have tended to produce highly inconsistent and ambiguous results as the following literature review will show.
2.1. Technological Diffusion as a Key Stimulant for Economic Development
As endogenous growth theory suggests, FDI can most effectively stimulate economic growth through technology transfers from foreign companies to domestic companies. Sagafi-Nejad et al. (2017) found two key channels of technological transfers: internalized transfer, where a multinational enterprise (MNE) transfers technology to its foreign affiliates in the host country, and externalized transfer, also called technology diffusion, where an MNE introduces technology to a host country that spills over into domestic firms, leading to higher productivity and economic growth. This finding is supported in the wider literature (Campos and Kinoshita 2002; De Mello 1997, 1999; Keller and Yeaple 2009). In addition, Blomström and Kokko (1998) review past literature by focusing on the spillover effects of FDI. They conclude that FDI can shave substantial spillover effects but that the exact nature and magnitude of these effects are uncertain. They also find that research and development is enabled by FDI, which increases competition in domestic industries, subsequently incentivizing innovation.
Keller and Yeaple (2009) estimated technology spillovers to US manufacturing firms from FDI between 1987 and 1996. They found that 11% of productivity growth in US firms was gained as a result of FDI spillovers. FDI spillovers were greater in high-technology industries, highlighting the heterogeneity of FDI effects across different industries. This study found greater FDI spillovers using the Olley–Pakes estimation method as opposed to the more commonly used time-difference method used in previous studies.
Much of the literature on economic growth has highlighted the need for countries to adopt new technologies in order to increase their rate of growth. Easterly et al. (1994) theorize that human capital accumulation is a key channel for technology diffusion. Technological diffusion through capital flows is considered to be the main instrument of economic development in host countries; however, evidence on this diffusion is mixed. Therefore, much of the literature has focused on the absorptive capacity of organizations in the host country. Absorptive capacity is defined as an organization’s ability to identify, assimilate, transform, and use external knowledge, research, and practices (Elmawazini et al. 2008).
2.2. Absorptive Capacity of the Host Country
Empirical studies suggest that the effects of FDI depend on the host country’s characteristics, which determine its absorptive capacity (Alfaro et al. 2004; Balasubramanyam et al. 1996; Blomström and Kokko 1998; Borensztein et al. 1998; Li and Liu 2005). These characteristics include technological development, human capital development, financial development, the degree of trade openness, institution quality, etc., in the host country. Major studies find that host countries require a certain absorptive capacity or development threshold to efficiently exploit FDI.
Borensztein et al. (1998) examined cross-sectional data across 69 developing countries between 1970 and 1989 with regression estimates by using seemingly unrelated regression (SUR) techniques. The study found that FDI was a key driver of technology transfer and that FDI was more effective than domestic investment at stimulating economic growth. However, this result was only achieved at a certain level of educational attainment, which was used as a proxy for human capital. Educational attainment was measured by the average number of years of schooling of country inhabitants. These findings were consistent with those of Romer (1990), which emphasize the role of human capital accumulation and technical progress in accelerating economic growth.
Li and Liu (2005) used panel data from 84 countries (both developed and developing) from 1970 to 1999, applying both random-effect and simultaneous-system models, to conclude that FDI directly and indirectly promotes economic growth. This was because FDI interacted with human capital to accelerate economic growth in developed and developing countries. However, the study also found that as the technology gap between the source and host economies increased, economic growth decreased for host countries. This was because developing countries generally have a low level of human capital development, thereby lowering their absorptive capacity.
Various microeconomic empirical studies have also examined the effect of the technology gap on absorptive capacity. Kokko (1994) used the technology gap between foreign and domestic firms to determine absorptive capacity in 216 Mexican manufacturing firms. Kokko found that a small technology gap enabled effective technology diffusion between the foreign and domestic firms, supporting the results of most other studies. On the other hand, Castellani and Zanfei (2003) analyzed data from 3932 firms in Spain, France, and Italy, to find that a larger productivity gap favored the positive spillover effects of FDI and that absorptive capacity did not play a role in FDI spillovers. This may be because European countries share similar structural and institutional characteristics and therefore all surpass the absorptive capacity threshold required to benefit from FDI.
De Mello (1999) examined time-series and panel data from OECD and non-OECD countries, finding that the effect of FDI on output and total factor productivity (TFP) depends on the complementarity of FDI and domestic investment. That study concluded that technologically advanced (OECD) countries were open to greater substitutability between capital stocks embodying old (domestic) and new (FDI-related) technologies than developing host countries were. Therefore, a lower technology gap reduced economic growth.
Trade policy can also be a key interaction term between FDI and economic growth. Using annual cross-country data and Ordinary Least Squares (OLS) regressions for 46 developing countries, Balasubramanyam et al. (1996) found that FDI is higher in and has a greater positive impact on economic growth within export-promoting countries when compared with import-substituting countries. Export-promoting countries are defined here as countries where the average effective exchange rate (AEER) on imports equates to the AEER on exports, which categorizes them as trade neutral, while import-substituting countries are defined by the AEER on imports exceeding the AEER on exports, which categorizes them as protectionist. This suggests that MNEs can induce economic growth if they are supported with an open trade policy that enables them to expand output aimed at foreign markets.
A significant study by Hermes and Lensink (2003) using cross-sectional and panel data from 67 countries between 1970 and 1995 found that more developed financial markets enable more effective technological diffusion. Financial institutions reduce the risk of investing in new technology, thereby promoting technological innovation. Access to finance in order to invest in developing technology in the host country determines a firm’s ability to undertake innovation, increasing the potential of technology spilling over into domestic firms. In addition, considering the importance of foreign direct investment (FDI) inflows for the sustainable economic advancement of a host country, Islam et al. (2020) investigated the financial development and FDI nexus. The empirical findings offer the insight that financial markets are less attractive to FDI relative to financial institutions. Thus, policymakers are advised to uphold sound financial institutions to make the country more attractive to overseas investors.
Overall, future comparative studies will be essential for increasing understanding of how host country characteristics affect absorptive capacity and subsequent technology diffusion (Barrios et al. 2004).
2.3. Bidirectional Causality between FDI and Economic Growth
Few studies have recognized that FDI and economic growth could demonstrate bidirectional causality. Choe (2003) used panel data from 80 countries between 1971 and 1995 and a panel VAR model to find the Granger causal relationship among the relationships between each pair of the following: FDI, domestic investment, and economic growth. Choe’s study found bidirectional Granger causality between FDI and economic growth. However, the direction of causality from economic growth to FDI was more significant as the size of the host country’s market prompts market-seeking FDI. In support, Ruxanda and Muraru (2010) used Romanian economic quarterly data between 2001 and 2009 to analyze the effect of FDI on economic growth. Through simultaneous equation systems, the study found bidirectional causality between FDI and economic growth. This explained why most FDI flows are between developed countries: because the recipients of FDI have more attractive markets with higher income levels.
Moreover, microeconomic firm-level studies also found negative externalities from FDI on host country economic development. Aitken and Harrison (1999) analyzed panel data of over 4000 Venezuelan firms between 1976 and 1989. They found that FDI had mixed results. Firms that did not receive investment experienced declines in productivity growth, while firms that received FDI captured productivity gains. At the time of data collection, Venezuela was not export-oriented and lacked absorptive capacity to benefit from efficiency spillovers.
Overall, the previous empirical literature reveals that the relationship between FDI and economic growth is complex. The studies reviewed above suggest that host country characteristics determine what interaction FDI will have with economic growth. Therefore, the next section focuses solely on FDI and economic growth in transition economies as they have unique characteristics when compared with the rest of the world.
2.4. FDI and Economic Growth in Transition Economies
Transition economies in Central and Eastern Europe were characterized by worn-out infrastructure and poor technological development before the fall of communism. Therefore, government policy in these countries has focused on the modernization of capital stocks and the transfer of technology from developed economies through FDI (Popescu 2014). There is a vast literature on CEE transition economies that predominantly uses macroeconomic cross-country data. For instance, Zubović et al. (2009) analyzed the influence of foreign investments on the host economy. They found that foreign banking groups have brought significant positive trends, especially through improving the sector’s financial performances and providing stable funding sources from abroad. Moreover, Campos and Kinoshita (2002) analyzed data from 25 Eastern European transition countries between 1990 and 1998. This study produced robust results demonstrating FDI’s significant positive effect on economic growth by the transfer of technology and know-how to host country industries. In addition, human capital does not determine the effect of FDI inflows. Furthermore, the study suggested that it is difficult to distinguish channels of technology transfer because they are often interdependent. Campos and Kinoshita suggest that further research needs to identify these channels for macroeconomic policymakers to maximize positive spillovers.
Using data from 25 Eastern European transition economies from 1990 to 2005, Sapienza (2010) came to a different conclusion. He found that the effect of current FDI inflows on GDP was significantly negative but that using lagged coefficients led to a long-term positive effect. This suggested that MNEs initially crowd out domestic firms, leading to a decline in economic growth although the spillover effects of MNE presence are realized over time.
Curwin and Mahutga (2014) used data from 25 Eastern European countries between 1990 and 2010. Contrary to Sapienza (2010), they reached the robust conclusion that FDI inflows reduced economic growth rates in both the short and long terms. They argued that this was because of the rapid increase of FDI into these economies during this period, which was described as “shock therapy.” This finding was consistent with those of other studies, showing that privatization programs created massive fiscal shocks because of weak institutional frameworks in competition policy and governance. This enabled corruption and reduced the absorptive capacity of FDI spillovers into local firms. The results of this study, as well as those of Campos and Kinoshita (2002) and Sapienza (2010), were quite ambiguous as there was much heterogeneity in the dataset because of very different levels of economic growth, rates of transition, and FDI across the countries.
Acaravci and Ozturk (2012) recognized this heterogeneity and therefore analyzed 10 European transition economies individually between 1994 and 2008. By employing autoregressive distributed lag to investigate the long-run relationships among FDI, exports, and economic growth and an error correction-based Granger causality test to find both long-run and short-run causality between these variables, they revealed that causality was only found in four countries. Overall, they concluded that FDI is a more effective stimulant of economic growth than exports are and that FDI should be promoted by policymakers.
On the other hand, Kutan and Vukšić (2007) suggest that FDI and exports interact to stimulate economic growth. By investigating 12 CEE countries from 1996 to 2004, their study showed that FDI increases the supply-capacity of an economy, which, in turn, increases exports. This was found to be more important than FDI-specific effects that arise from MNE knowledge and technology transfers.
The small array of literature focusing solely on Albania during the transition period has also had inconsistent findings. Hysa and Hodo (2016) examined the real effects of FDI in the economic growth of Albania using the co-integration approach for the quarterly data from 1991 to 2012. The empirical findings of this study reveal strong correlation between GDP growth and FDI to GDP ratio which shows its significant contribution to Albanian economic growth. Furthermore, Boriçi and Osmani (2015) investigated the relationship between FDI and economic growth in Albania. Cointegration analysis of time-series data revealed a significant long-run relationship between FDI and GDP growth. They concluded that Albania should invest more into its economy to attract more FDI. In addition, Golitsis et al. (2018) tested the effect of remittances and FDI on economic growth, using quarterly data between 1996 and 2014 from the World Bank. Using a Granger causality test and a VAR test, they found that remittances cause economic growth in the short and long terms, while FDI appeared to have no relationship with economic growth. This suggests that investment from the diaspora of working-age Albanians to support their families is more significant than FDI.
Demeti and Rebi (2014) findings also supported the argument that FDI does not promote economic development in Albania. The study used data from the period between 2002 and 2013, employing the Pearson correlation coefficient and the Granger causality test. That study found a positive relationship between FDI and labor productivity, which is a key indicator of economic development. However, productivity brought about FDI. Their reasoning for this was that Albania’s most productive sectors have attracted the most FDI. An example is fuel extraction, which has increased its share of Albania’s FDI stock from 2% in 2008 to 23% in 2012. The paper does not test for unit roots; therefore, the time-series data used may not be stationary.
Overall, empirical results are ambiguous in Albania and have so far not supported the idea that FDI inflows cause economic growth or development. Instead, most findings suggest that economic growth and development cause increasing inflows of FDI. Later, the results of this study are compared with those of previous works on transition economies reviewed in this section.
2.5. An Overview of Methodologies
The relationship between FDI and economic growth has been researched extensively; however, there has been much difficulty in quantifying that relationship. Microeconomic firm-level studies have been less prevalent because macroeconomic data is easier to attain from secondary sources (Paul and Singh 2017). Studies have used various secondary datasets, which are highly inconsistent because their data collection methods are different. The quality of data from developing and transition economies is also questionable. This means that data for one variable can vary greatly between studies. Furthermore, econometric methods and explanatory variables vary and are often unique to new studies, which can lead to inconsistent results and interpretations (Sapienza 2010).
The use of various methodologies and the heterogeneity of various countries have also made empirical results ambiguous and inconclusive, rendering the potential adverse effects at the microeconomic level difficult to identify. Cross-country and cross-sectional studies that do not account for host country characteristics seem to average the effects of FDI, such that the effects are overestimated for some countries and underestimated for others. Single-country time-series analysis overcomes this limitation; however, it is not popular for investigating transition economies as data is only available from the 1970s onward, and in some cases, that availability is further limited to the 1990s onward. Therefore, there are limited observations. Many transition economies have gone through “shock therapy,” i.e., rapid economic liberalization since the fall of communism, and it is therefore difficult to quantify the direct effect of FDI on economic growth while controlling for the effects of other variables.
Most studies on transition economies have been cross-sectional, and then, there is the lack of research on individual economies. This is perhaps because single-country studies can only offer limited observations. However, since the fall of communism, there has been a high level of heterogeneity between CEE transition economies because structural change has taken place at variable rates and these economies have different social, economic, and political conditions. Therefore, as cross-country studies have produced ambiguous results, single-country studies are required for policymakers to make informed decisions specific to local economic conditions.
Furthermore, studies on Albania have thus far been inconsistent and have focused on either short- or long-term relationships as opposed to both. Few studies have recognized that there could be a bidirectional or endogenous relationship between FDI and economic growth. This has resulted in the use of inappropriate methodologies that distort results. Zhang (2001); Choe (2003); Li and Liu (2005) found a strong endogenous relationship between FDI and economic growth in other cases, such that growth itself can be highly attractive to FDI.
Albania’s trade policies can also be characterized as export-promoting. As trends throughout most transition economies show, when FDI increases, exports increase. This is most likely because trade liberalization simultaneously leads to higher exports and FDI inflows. Therefore, research into the relationships among FDI, trade, and GDP will aid the understanding of the effectiveness of Albania’s open trade policies more suitably than research solely into FDI and GDP.
Therefore, there is a gap in research that can be addressed by testing the relationship between FDI and economic growth methodically using multidisciplinary econometric methods to better understand causal influences (Golitsis et al. 2018). This study begins by testing the time-series data for unit roots and unit roots with breaks to ensure the stationarity of the series used. Furthermore, Granger causality, cointegration, and error correction models need to be incorporated into the study to establish reliable conclusions regarding the short-term and long-term relationships between FDI and economic growth.
In summary, there are research gaps in the following areas: single-country time-series studies on the relationship between FDI and economic growth in Albania; multidisciplinary econometric analysis on FDI and economic growth, with the unit root with a structural break test and vector error correction model (VECM) being scarcely utilized; and the relationships among FDI, trade, and economic growth in transition economies.
3. Methodology
3.1. Data Collection and Transformation
The data were retrieved from the World Bank, World Development Indicators. Data was collected between 1992 and 2016. Although this includes limited observations, there is a lack of reliable data before the 1990s. Following in particular the research of Marr and Siklos (1994); Gross (2004); Layard et al. (2005); Boubtane et al. (2013); AboElsoud (2018), a theoretical framework of the general macroeconomic model is proposed that takes into consideration the interdependence among FDI, Exports as a proxy for Trade, and economic growth. Exports and GDP are measured in constant US dollars. FDI inflows are measured as a percentage of GDP. All variables used in this study are expressed in the natural logarithmic form.
3.2. Empirical Framework
As discussed above, and as Albania continues to transition to a mixed economy, it is important to understand the impact of FDI on economic growth in Albania. Therefore, the main research question is as follows: Is there a relationship between FDI, international trade, and economic growth in Albania? For this purpose, the study uses a general macroeconomic model to investigate the relationship between the aforementioned variables. For an empirical application, the variables can be modelled as a function of each other as follows:
where FDI represents the Foreign Direct Investment inflows measured as a percentage of GDP; Exports represents the proxy for Trade; GDP is the Gross Domestic Product; and the subscripts t (t = 1…T) and k (k = 1…K) indicate, respectively, the time period and the lag length.
FDIt = f (FDIt−k, Exportst−k, GDPt−k)
Exportst = f (Exportst−k, FDIt−k, GDPt−k)
GDPt = f (GDPt−k, FDIt−k, Exportst−k)
The conventional VECM can be written as follows:
where Z is the error correction term (ECT) and is the OLS residuals from the long-run co-integration regression. Consequently, the VECM can be expressed in the following way in Equations (5)–(7):
where is the constant associated with each equation and ECTt−1 is a one-period lagged error correction term. Moreover, K denotes the lag length, while the s and are the coefficients to be estimated; finally, the Us are the disturbance terms, and they are serially uncorrelated. Note that the term error correction relates to the fact that the last-period deviation from the long-run equilibrium influences the short-run dynamics of the target variable. Thus, the coefficient of ECT, , is the speed adjustment because it measures the speed at which the target variable returns to the equilibrium after a change in the explanatory variable.
To assess the stationarity properties of the variables, this study used the Augmented Dickey and Fuller (1979) test. Furthermore, to examine whether the variables are co-integrated, that is, whether there exists a long-run relationship between the variables under discussion, the study applied the Johansen (1988) and Stock and Watson (1988) tests. In addition, the short-run dynamics between the variables under the study were evaluated using the Wald and Granger causality tests to examine the direction of causation among them.
4. Empirical Analysis and Results
This section presents, interprets, and analyzes the results of the five econometric tests in a methodical order.
4.1. Augmented Dickey–Fuller Unit Root Test
If further econometric tests are to be valid and reliable, it is essential that the variables be stationary. Therefore, each variable was tested for a unit root using the Augmented Dickey–Fuller (ADF) test. First, each variable was tested at different levels.
The null hypothesis for every series was as follows: series has a unit root; therefore, it is non-stationary. The alternative hypothesis states that the series does not have a unit root, and therefore, it is stationary. For the null hypothesis to be rejected, the ADF t-statistic must be more negative than the critical value at the 5% significance level.
The null hypothesis at levels cannot be rejected for each variable because as Table 1 shows, the t-statistic is greater than the critical value at the 5% level. Therefore, the series is deemed to have a unit root that is non-stationary.
Since the null hypothesis cannot be rejected for each variable, the variables were differenced to try and achieve stationarity at first difference. As Table 2 shows, at first difference, the ADF t-statistic was more negative than the critical value at the 5% level for each variable. Thus, for each variable, the null hypothesis can be rejected, and the three variables are deemed stationary at first difference. Therefore, they are integrated of order one, I(1).
4.2. Augmented Dickey–Fuller Unit Root Test with Breaks
Next, the variables are tested for unit roots with a structural break to increase the robustness of the data.
Structural breaks are shown in Table 2. At these dates, the ADF t-statistic is more negative than the critical value at the 5% level.
As shown in Table 2, a structural break in exports was identified in 2008, at which point, the ADF t-statistic was more negative than the critical value. That year saw the onset of the global financial crisis, during which world trade declined rapidly. Albania remained competitive during this period because of its depreciating currency but still experienced a reduction in the rate of increase of its exports as is depicted in Figure 2.
GDP demonstrated a structural break in 2011, where Albania’s GDP growth rate decreased. This is perhaps due to the delayed effects of the financial crisis as Greece and Italy, Albania’s main trading partners, experienced deteriorating economic conditions.
FDI inflows showed a structural break in 2002. During the period analyzed, FDI inflows were highly volatile, and it is therefore difficult to identify the significance of this structural break.
4.3. Johansen Cointegration Rank Test
Since all relevant variables are integrated of order one, I(1), the Johansen cointegration test was undertaken to establish whether there is a long-run relationship between each pair of the following: FDI inflows, exports, and GDP. Two cointegration tests are applied: first, the trace rank test, and second, the maximum eigenvalue test.
The first null hypothesis is that there is no cointegration (r = 0). The alternative hypothesis states that there is at least one cointegrating equation (CE). The second null hypothesis states there is at most one CE (r = 1). The alternative hypothesis to this states that there is more than one CE. The null hypothesis cannot be rejected if the trace statistic is lower than the critical value. However, if the trace statistic is higher than the critical value, the null hypothesis can be rejected.
The first null hypothesis in Table 3 states there are no CEs between FDI inflows and exports. The trace rank test and the maximum eigenvalue test show that the trace statistic is higher than the critical value and that the probability is below 0.05. Therefore, the null hypothesis can be rejected, and the alternative hypothesis, which states that there is at least one CE, cannot be rejected.
The second null hypothesis states that there is at the most one CE between exports and FDI. The null hypothesis cannot be rejected in both the trace rank test and the maximum eigenvalue test because the trace statistic is below the critical value and the probability is higher than 0.05. Therefore, there is cointegration between FDI inflows and exports.
The CE between FDI inflows and exports, with FDI inflows as the dependent variable, is expressed as follows:
LFDI INFLOW = 4.78537(LEXPORTS) − 109.47
This suggests that an increase of one unit of exports causes an increase of 4.78537 units of FDI inflows.
As shown in Table 4, the trace rank test and maximum eigenvalue test find that the first null hypothesis, that there is no CE, can be rejected because the trace statistic is greater than the critical value and the probability is lower than 0.05. Therefore, the alternative hypothesis, which states that there is at least one CE, cannot be rejected.
The second null hypothesis, which states that the number of CEs is at the most one (r = 1), cannot be rejected since the trace statistic is lower than the critical value and the probability is greater than 0.05. This suggests that there is long-run cointegration between FDI inflows and GDP growth in Albania.
The CE between FDI inflows and GDP, with FDI inflows as the dependent variable, is expressed as follows:
LFDI INFLOW = 2.69789(LGDP) − 60.22726
This suggests that an increase of one unit of GDP causes an increase of FDI inflows by 2.69789 units.
Table 5 tests for cointegration between exports and GDP. The trace rank test and the maximum eigenvalue test show that the null hypothesis, which states that there is no CE between exports and GDP, can be rejected because the trace statistic is significantly higher than the critical value and the probability is 0. The alternative hypothesis, which states that there is at least one CE, cannot be rejected.
The second null hypothesis, which states that there is at most one CE between exports and GDP cannot be rejected. This is because the trace statistic is below the critical value and the probability is higher than 0.05.
The CE between exports and GDP is expressed as follows:
LGDP = 0.21005(LEXPORTS) + 18.473
Therefore, an increase of one unit in exports is expected to cause an increase in GDP by 0.21005 units.
Overall, the Johansen cointegration tests show there is a long-run relationship between all the examined variables.
4.4. Vector Error Correction Model
The unit root tests with breaks show there are structural breaks that can cause shocks in the long-run relationship (found in the Johansen cointegration analysis) between FDI inflows, exports, and GDP. Next, the VECM is formed and through the error correction term (ECT) the speed of adjustment of the variables to a long-run equilibrium after a shock is estimated. This supports the Johansen cointegration tests in establishing the dynamic aspect of the long-run relationship between the three variables.
The VECM results between FDI inflows and exports are shown in Table 6. For the ECT to be statistically significant it must be negative and the t-statistic must be more significant than the critical value ±1.96.
As shown in Table 6, the ECT of the dependent variable FDI inflows is negative but the t-statistic is less significant than ±1.96. Therefore, the ECT is a statistically insignificant and long-term dependency between FDI inflows and exports cannot be established.
When exports is the dependent variable, the ECT is positive. Therefore, these results find no dynamic long-term dependency between FDI inflow and exports.
Next VECM results between FDI inflows and GDP are shown in Table 7.
Table 7 shows that the t-statistic of the ECT when FDI inflow is the dependent variable is statistically significant because it is more significant than ±1.96. The ECT is −0.48, suggesting that FDI inflows and GDP would take just over 2 years and 1 month to fully recover to a new equilibrium after a shock to the independent variable GDP.
On the other hand, the ECT of the dependent variable GDP is positive and the t-statistic is not statistically significant. Therefore, this does not validify that FDI inflows affect GDP in the long-term.
Table 8 shows the VECM between GDP and exports. The ECT when GDP is the dependent variable is −0.200594. Since the ECT is negative and the t-statistic, −3.3 is more significant than ±1.96, the long-term relationship between GDP and exports is valid. Therefore, after a shock to exports; exports and GDP will recover at 20.06% per year. Therefore, approximately 5 years will elapse before exports and GDP recover to a state of equilibrium.
When the dependent variable is exports, the ECT is −0.792468 and the t-statistic is more significant than the critical value 1.96. Therefore, ECT is statistically significant, which means the long-term relationship between GDP and exports can be confirmed. This suggests that after a shock to GDP, exports and GDP recover at a rate of 79.25% per year. Therefore, GDP and exports will take around 14 and a half months to recover to a state of equilibrium.
4.5. Granger Causality Test
The Johansen cointegration test and VECM provided evidence on the long-term relationship between FDI inflows, exports, and GDP in Albania. The Granger causality tests can further expand on their relationship to give evidence on the short-run causality between the three variables.
As Table 9 shows, the first null hypothesis which states L(FDI inflow) does not granger cause L(Exports), cannot be rejected since the probability is higher than 0.05 and the F-statistic is below the critical value 4.46. Therefore, short-term FDI inflow does not cause exports.
The second null hypothesis which states that L(Exports) does not granger cause L(FDI inflow) can be rejected since the probability is significantly lower than 0.05 and the F-statistic is statistically more significant than the critical value 4.46. Therefore, the alternative hypothesis cannot be rejected, which states L(Exports) do granger cause L(FDI inflow).
As Table 10 shows, the first null hypothesis states that L(GDP) does not granger cause L(FDI Inflows). The first null hypothesis can be rejected since the probability is significantly lower than 0.05 and the F-statistic is higher than the critical value 4.46. This means that in the short-term, GDP does granger-cause FDI inflows.
The second null hypothesis states that L(FDI Inflows) does not granger cause L(GDP). The F-statistic is below the critical value 4.46 and the probability is higher than 0.05 and statistically significant, therefore the null hypothesis cannot be rejected. Therefore, FDI inflows do not Granger cause GDP in the short-term.
Next granger causality was tested for GDP and exports, shown in Table 11.
As Table 11 shows, the first null hypothesis which states L(GDP) does not granger cause L(Exports) can be rejected because the F-statistic is greater than the critical value 4.46 and the probability is significantly lower than 0.05. The alternative hypothesis that L(GDP) does granger cause L(Exports) cannot be rejected.
Secondly, the null hypothesis which states L(Exports) does not granger cause L(GDP), cannot be rejected since the F-statistic is below the critical value and the probability is higher than 0.05.
Therefore, these statistical tests strongly support that there is a unidirectional flow of causality from exports to FDI inflows, GDP to exports, and GDP to FDI inflows. Whereas, no bidirectional causality has been established.
5. Discussion
This study sought to investigate the relationships among FDI, trade, and growth in Albania with a methodical approach that explores the sub-questions that follow.
5.1. Is There a Short-Run and Long-Run Relationship between FDI and Exports?
The Johansen cointegration test found long-term cointegration between FDI and exports, which was highly statistically significant.
The cointegration equation found that exports have a strongly positive effect on FDI inflows. However, the ECT found no statistically significant long-term dependency between these two variables. Nevertheless, the ECT t-statistic is more significant than the critical value at 10%, ±1.78 when FDI inflow is the dependent variable. With this in consideration, the ECT suggests that FDI inflows and exports would recover at 3% per year to a new long-term equilibrium if there were a shock to exports. This suggests that FDI has a weak dependency on exports.
The Granger causality results reveal unidirectional short-term causality from exports to FDI inflows but no short-term causality from FDI inflows to exports. Therefore, all the econometric tests employed in this study find no causality from FDI inflows to exports; however, there is strong support for causality from exports to FDI inflows.
This supports the assertion that Albania’s increasingly open trade policies have been attractive to foreign investors. In contrast, Kutan and Vukšić (2007) found that FDI increased export potential, which, in turn, stimulated economic growth in all 12 countries they investigated. Sun (2001) found that FDI in China has a more significant positive effect on exports in coastal provinces than that in inland provinces because FDI is likely to be export-oriented in coastal regions. Hence, future research is required to determine the effect of FDI on specific sectors and regions to investigate the dynamic relationship between FDI and exports.
5.2. Is There a Short-Run and Long-Run Relationship between FDI and GDP?
The Johansen cointegration test suggests that there is a long-term relationship between FDI inflows and economic growth. Moreover, the ECTs between the variables suggest that the long-term dependency of FDI inflows on GDP is significant but that FDI has no effect on GDP. The Granger causality tests also find that the direction of causality flows from GDP to FDI in the short term. This suggests that MNEs in Albania are predominantly attracted to fast-growing economies with valuable markets as was found in the cross-country study conducted by Choe (2003). Demeti and Rebi (2014) supported this finding, suggesting that MNEs are attracted to locations where there is more economic development.
It is surprising that none of the econometric tests find that FDI causes economic growth because Albania received 60% of its FDI in 2016 in the tertiary sector, where technology transfer is most likely to occur (Keller and Yeaple 2009). On the other hand, the tertiary sector has only recently become the main recipient of FDI in Albania. Consequently, there will be a need for more research in future years to check whether technology spillovers in these sectors will have a positive effect on economic growth.
In this study, FDI stock was not used as the proxy for FDI; hence, as Campos and Kinoshita (2002) suggest, this could have caused the capture of the aggregated effect of FDI on GDP over a long period. The work of Sapienza (2010) supports the above contention, finding that the initial presence of MNEs exerts competitive pressure on host countries’ domestic firms but that in the long term, it stimulates economic growth through spillover effects. On the other hand, Curwin and Mahutga (2014) would argue that the initial period of “shock therapy,” which saw FDI inflows increase rapidly in Albania, had a negative long-term impact on economic growth.
Contrarily, Golitsis et al. (2018) found no causality between FDI and GDP in Albania. This may be because the study did not consider structural breaks, which can lead to the false rejection of a null hypothesis and therefore render results invalid. Nevertheless, the study did find that Albania’s liberalization benefitted the country through the free movement of people to other countries, which resulted in more remittances, and subsequently stimulated economic growth.
5.3. Is There a Short-Run and Long-Run Relationship between Exports and GDP?
The Johansen cointegration test suggests a highly strong long-term relationship between exports and GDP. This is supported by the VECM, which found the ECT for both dependent variables to be statistically significant. Therefore, there is a bidirectional long-term dependency between the two variables, supporting the existence of a dynamic long-term relationship.
The Granger causality test found unidirectional causality from GDP to exports. Exports do not Granger-cause economic growth in the short term. This may suggest that export growth takes time to stimulate broader economic growth.
6. Conclusions
In conclusion, this study established long-term relationships among trade, economic growth, and FDI. The unit root tests for the data series of all three variables established that the time-series are integrated of order one, I(1). The Johansen cointegration tests found that there is a long-term relationship between the variables. Subsequently, the VECM and Granger causality tests found that economic growth is far more effective at stimulating FDI inflows and exports than FDI and exports are at stimulating economic growth.
Theoretically, FDI inflows are expected to stimulate economic growth, but this study did not lend credence to the theory. This may be because the econometric tests used in this study were not effective at identifying positive spillovers of FDI that take place over the long term.
Exports were found to be more effective at promoting economic growth than FDI was because there was a stronger dependency between exports and GDP growth according to the VECM.
6.1. Policy Implications
Overall, the results of this study suggest that exports are a more effective stimulant of economic growth in Albania than FDI in itself. Therefore, policymakers seek to help Albanian firms penetrate export markets. Promoting exports will enable firms to grow and exploit economies of scale. Furthermore, this will create more jobs in the economy, leading to higher income levels.
Furthermore, these results suggest that FDI has no causality on economic growth. Therefore, policymakers need to design intelligent policies to attract export-promoting and technology-based FDI that can stimulate economic growth instead of FDI that simply results in MNEs crowding out domestic firms. This will enable Albania to narrow the technology gap with developed economies and increase the productivity of key sectors, thereby improving its competitive position in global trade.
6.2. Limitations
There were only 25 available observations for GDP and FDI inflows and 21 observations for exports. This was because data from Albania on these variables only cover the period between 1996 and 2016. This limitation is attributed to the Albanian government having only released limited and unreliable data before the fall of communism (Campos and Kinoshita 2002).
6.3. Future Research
This paper examines the macroeconomic effects of FDI on economic growth. Future research on microeconomic firm-level effects would provide more information to policymakers on the spillover effects of MNEs in specific industries. Furthermore, the varying impacts of different modes of FDI need more research. For example, FDI in the form of joint ventures, acquisitions, and greenfield investments may have different spillover effects on the host country.
As previous studies reveal, the impact of FDI on economic growth is determined by the host country’s characteristics and the absorptive capacity of domestic firms. This study does not consider the characteristics of Albania that might have prevented FDI from being effective at stimulating economic growth. Therefore, microeconomic studies at the firm-level may also enable policymakers to identify sectors and types of firms that benefit from FDI. This would allow policymakers to understand the characteristics of firms that enable them to absorb positive FDI spillovers such as knowledge transfers.
Finally, the noneconomic externalities of FDI need to be considered in future research. For example, it should be considered whether MNEs reduce or increase air pollution in Albania and whether corporate social responsibility policies established in many developed countries are being adopted by Albanian firms.
Author Contributions
Conceptualization, S.H.; Formal analysis, M.E.A.; Investigation, Software; D.P. and M.E.A.; Methodology, M.E.A. and S.H.; Validation, S.H., D.P., and M.E.A.; Writing—original draft. All authors have read and agreed to the published version of the manuscript.
Funding
The APC was funded by Harper Adams University and The British University in Egypt.
Conflicts of Interest
The authors declare no conflict of interest. In addition, the funders had no role in the design of the study; in the collection, analyses, or interpretation of data; in the writing of the manuscript, or in the decision to publish the results.
References
- AboElsoud, M. E. 2018. Did USAID promote economic growth prior to the 2011 Egyptian Revolution? Journal of Chinese Economic and Foreign Trade Studies 11: 219–35. [Google Scholar] [CrossRef]
- Acaravci, A., and I. Ozturk. 2012. Foreign direct investment, export and economic growth: Empirical evidence from new EU countries. Romanian Journal of Economic Forecasting 15: 52–67. [Google Scholar]
- Adams, S. 2009. Foreign Direct investment, domestic investment, and economic growth in Sub-Saharan Africa. Journal of Policy Modeling 31: 939–49. [Google Scholar] [CrossRef]
- Aitken, B. J., and A. E. Harrison. 1999. Do Domestic Firms Benefit from Direct Foreign Investment? Evidence from Venezuela. American Economic Review 89: 605–18. [Google Scholar] [CrossRef] [Green Version]
- Alfaro, L., and J. Chauvin. 2016. Foreign direct investment, finance, and economic development. Chapter for the Encyclopedia of International Economics and Global Trade. forthcoming. [Google Scholar]
- Alfaro, L., A. Chanda, S. Kalemli-Ozcan, and S. Sayek. 2004. FDI and economic growth: The role of local financial markets. Journal of International Economics 64: 89–112. [Google Scholar] [CrossRef]
- Balasubramanyam, V., N. M. Salisu, and D. Sapsford. 1996. Foreign Direct Investment and Growth in EP and is Countries. The Economic Journal 106: 92–105. [Google Scholar] [CrossRef]
- Barrios, S., S. Dimelis, H. Louri, and E. Strobl. 2004. Efficiency spillovers from foreign direct investment in the EU periphery: A comparative study of Greece, Ireland, and Spain. Review of World Economics 140: 688–705. [Google Scholar] [CrossRef]
- Bevan, A. A., and S. Estrin. 2004. The determinants of foreign direct investment into European transition economies. Journal of Comparative Economics 32: 775–87. [Google Scholar] [CrossRef]
- Blomström, M., and A. Kokko. 1998. Multinational Corporations and Spillovers. Journal of Economic Surveys 12: 247–77. [Google Scholar] [CrossRef]
- Borensztein, E., J. De Gregorio, and J. W. Lee. 1998. How does foreign direct investment affect economic growth? Journal of International Economics 45: 115–35. [Google Scholar] [CrossRef] [Green Version]
- Boriçi, Y. K., and E. Osmani. 2015. Foreign Direct Investment and Economic Growth in Albania. Economics 3: 27–32. [Google Scholar] [CrossRef] [Green Version]
- Boubtane, E., D. Coulibaly, and C. Rault. 2013. Immigration, unemployment and GDP in the host country: Bootstrap panel Granger causality analysis on OECD countries. Economic Modelling 33: 261–69. [Google Scholar] [CrossRef] [Green Version]
- Breitung, W. 2008. Gaining Advantage from Open Borders: An Active Space Approach to Regional Development. The Professional Geographer 55: 411–12. [Google Scholar] [CrossRef]
- Campos, N. F., and Y. Kinoshita. 2002. Foreign Direct Investment as Technology Transferred: Some Panel Evidence from the Transition Economies. The Manchester School 70: 398–419. [Google Scholar] [CrossRef] [Green Version]
- Castellani, D., and A. Zanfei. 2003. Technology gaps, absorptive capacity and the impact of inward investments on productivity of European firms. Economics of Innovation and New Technology 12: 555–76. [Google Scholar] [CrossRef]
- Choe, J. I. 2003. Do Foreign Direct Investment and Gross Domestic Investment Promote Economic Growth? Review of Development Economics 7: 44–57. [Google Scholar] [CrossRef]
- Curwin, K. D., and M. C. Mahutga. 2014. Foreign Direct Investment and Economic Growth: New Evidence from Post-Socialist Transition Countries. Social Forces 92: 1159–87. [Google Scholar] [CrossRef] [Green Version]
- De Mello, L. R. 1997. Foreign direct investment in developing countries and growth: A selective survey. The Journal of Development Studies 34: 1–34. [Google Scholar] [CrossRef]
- De Mello, L. R. 1999. Foreign Direct Investment-Led Growth: Evidence from Time Series and Panel Data. Oxford Economic Papers 51: 133–51. [Google Scholar] [CrossRef]
- Demeti, A., and E. Rebi. 2014. Foreign direct investments (FDI) and Productivity in Albania. Interdisplinary Journal of Research and Development 1: 7–14. [Google Scholar]
- Dickey, D. A., and W. A. Fuller. 1979. Distribution of the estimators for autoregressive time series with a unit root. Journal of the American Statistical Association 74: 427–31. [Google Scholar]
- Easterly, W., R. King, R. Levine, and S. Rebelo. 1994. Policy, Technology Adoption, and Growth. NBER Working Paper No. 4681. Cambridge: National Bureau of Economic Research. [Google Scholar]
- Elmawazini, K., P. Manga, and S. Saadi. 2008. Multinational Enterprises, Technology Diffusion, and Host Country Absorptive Capacity: A Note. Global Economic Review 37: 379–86. [Google Scholar] [CrossRef]
- Golitsis, P., K. Avdiu, and L. T. Szamosi. 2018. Remittances and FDI Effects on Economic Growth: A VECM and GIRFs for the Case of Albania. Journal of East-West Business 24: 188–211. [Google Scholar] [CrossRef]
- Gross, D. M. 2004. Impact of immigrant workers on a regional labour market. Applied Economics Letters 11: 405–8. [Google Scholar] [CrossRef]
- Hermes, N., and R. Lensink. 2003. Foreign direct investment, financial development and economic growth. The Journal of Development Studies 40: 142–63. [Google Scholar] [CrossRef] [Green Version]
- Hysa, E., and L. Hodo. 2016. Foreign direct investment and economic growth in Albania: A co-integration analysis. International Economics, 234–44. [Google Scholar] [CrossRef]
- Islam, M. A., M. A. Khan, J. Popp, W. Sroka, and J. Oláh. 2020. Financial Development and Foreign Direct Investment—The Moderating Role of Quality Institutions. Sustainability 12: 3556. [Google Scholar] [CrossRef]
- Johansen, S. 1988. Statistical analysis of cointegration vectors. Journal of Economic Dynamics and Control 12: 231–54. [Google Scholar] [CrossRef]
- Keller, W., and S. R. Yeaple. 2009. Multinational Enterprises, International Trade, and Productivity Growth: Firm-Level Evidence from the United States. The Review of Economics and Statistics 91: 821–31. [Google Scholar] [CrossRef] [Green Version]
- Kokko, A. 1994. Technology, market characteristics, and spillovers. Journal of Development Economics 43: 279–93. [Google Scholar] [CrossRef]
- Kutan, A. M., and G. Vukšić. 2007. Foreign Direct Investment and Export Performance: Empirical Evidence. Comparative Economic Studies 49: 430–45. [Google Scholar] [CrossRef]
- Layard, P.R.G., R. Layard, S.J. Nickell, and R. Jackman. 2005. Unemployment: Macroeconomic Performance and the Labour Market. Oxford: Oxford University Press on Demand. [Google Scholar]
- Li, X., and X. Liu. 2005. Foreign Direct Investment and Economic Growth: An Increasingly Endogenous Relationship. World Development 33: 393–407. [Google Scholar] [CrossRef]
- Marr, W. L., and P. L. Siklos. 1994. The link between immigration and unemployment in Canada. Journal of Policy Modeling 16: 1–25. [Google Scholar] [CrossRef]
- Moran, T. H. 2012. Foreign Direct Investment and Development. In The Wiley-Blackwell Encyclopedia of Globalization. Edited by George Ritzer. Hoboken: Wiley-Blackwell. [Google Scholar]
- Paul, J., and G. Singh. 2017. The 45 years of foreign direct investment research: Approaches, advances and analytical areas. The World Economy 40: 2512–27. [Google Scholar] [CrossRef]
- Popescu, G. 2014. FDI and economic growth in Central and Eastern Europe. Sustainability 6: 8149–63. [Google Scholar] [CrossRef] [Green Version]
- Romer, P. M. 1990. Endogenous Technological Change. Journal of Political Economy 98: S71–S102. [Google Scholar] [CrossRef] [Green Version]
- Ruxanda, G., and A. Muraru. 2010. FDI and Economic Growth. Evidence from Simultaneous Equation Models. Romanian Journal of Economic Forecasting 13: 45–58. [Google Scholar]
- Sagafi-Nejad, T., R. W. Moxon, and H. V. Perlmutter. 2017. Controlling International Technology Transfer: Issues, Perspectives, and Policy Implications. Amsterdam: Elsevier. [Google Scholar]
- Sapienza, E. 2010. Foreign Direct Investment and growth in Central, Eastern and Southern Europe. Investigación Económica 69: 99–138. [Google Scholar] [CrossRef]
- Stejskal, J., P. Hajek, and O. Hudec. 2018. Knowledge Spillovers in Regional Innovation Systems. New York: Springer. [Google Scholar]
- Stock, J. H., and M. W. Watson. 1988. Testing for Common Trends. Journal of the American Statistical Association 83: 1097–107. [Google Scholar] [CrossRef]
- Sun, H. 2001. Foreign Direct Investment and Regional Export Performance in China. Journal of Regional Science 41: 317–36. [Google Scholar] [CrossRef]
- Svejnar, J. 2002. Transition Economies: Performance and Challenges. Journal of Economic Perspectives 16: 3–28. [Google Scholar] [CrossRef] [Green Version]
- Vendrell-Herrero, F., E. Gomes, S. Collinson, G. Parry, and O. F. Bustinza. 2018. Selling digital services abroad: How do extrinsic attributes influence foreign consumers’ purchase intentions? International Business Review 27: 173–85. [Google Scholar] [CrossRef]
- Zhang, K. 2001. Does foreign direct investment promote economic growth? evidence from east asia and latin america. Contemporary Economic Policy 19: 175–85. [Google Scholar] [CrossRef]
- Zubović, J., M. Jeločnik, and J. Subić. 2009. Foreign direct investments in transition economies: The case of Serbian financial industry. Economic Sciences Series 61: 10–18. [Google Scholar]
Figure 1.
Albania’s foreign direct investment (FDI) stock as a percentage of gross domestic product (GDP) (Source: World Bank 2017).
Figure 1.
Albania’s foreign direct investment (FDI) stock as a percentage of gross domestic product (GDP) (Source: World Bank 2017).

Figure 2.
Exports of goods and services from Albania, 1996–2016, constant 2010 million US$ (Source: Adapted from World Bank 2017).
Figure 2.
Exports of goods and services from Albania, 1996–2016, constant 2010 million US$ (Source: Adapted from World Bank 2017).


Table 1.
Augmented Dickey–Fuller (ADF) unit root test at levels and first difference.
| Levels | First Difference | ||||||
|---|---|---|---|---|---|---|---|
| Variables | Sample Period | ADF T-Stat | p-Value | Critical Value (5%) | ADF T-Stat | p-Value | Critical Value (5%) |
| L(Exports) | 1996–2016 | −1.2764 | 0.8605 | −3.6908 | −6.4823 | 0.0002 | −3.6736 |
| L(GDP) | 1992–2016 | −0.6467 | 0.9649 | −3.6329 | −4.9092 | 0.0038 | −3.6329 |
| L(FDI Inflow) | 1992–2017 | −1.4185 | 0.5563 | −2.9919 | −4.7306 | 0.0012 | −3.0049 |
(Source: Authors own).
Table 2.
ADF unit root test with single break.
| First Difference | |||||
|---|---|---|---|---|---|
| Variables | Sample Period | ADF T-Stat | p-Value | Critical Value (5%) | Break Date |
| L(Exports) | 1996–2016 | −5.7829 | <0.01 | −4.4436 | 2008 |
| L(GDP) | 1992–2016 | −6.696 | <0.01 | −4.4436 | 2011 |
| L(FDI Inflow) | 1992–2017 | −5.0252 | <0.01 | −4.4436 | 2002 |
(Source: Authors own).
Table 3.
Johansen cointegration test—FDI inflows and exports.
| Unrestricted Cointegration Rank Test (Trace) | |||
| Hypothesized No. of CE(s) | Trace statistic | 0.05 Critical Value | Probability |
| r = 0 | 26.4321 | 12.3209 | 0.0001 |
| r = 1 | 1.5463 | 4.1299 | 0.2507 |
| Unrestricted Cointegration Rank Test (Maximum Eigenvalue) | |||
| Hypothesized No. of CE(s) | Max-Eigen Statistic | 0.05 Critical Value | Probability |
| r = 0 | 24.8858 | 11.2248 | 0.0001 |
| r = 1 | 1.5463 | 4.1299 | 0.2507 |
Adjusted period sample: 1998–2016. CE = Cointegrating equation. r = Number of relations (Source: Authors own).
Table 4.
Johansen cointegration test—FDI inflows and GDP.
| Unrestricted Cointegration Rank Test (Trace) | |||
| Hypothesized No. of CE(s) | Trace statistic | 0.05 Critical Value | Probability |
| r = 0 | 12.8436 | 12.3209 | 0.0408 |
| r = 1 | 1.146 | 4.1299 | 0.3313 |
| Unrestricted Cointegration Rank Test (Maximum Eigenvalue) | |||
| Hypothesized No. of CE(s) | Max-Eigen Statistic | 0.05 Critical Value | Probability |
| r = 0 | 11.6976 | 11.2248 | 0.0413 |
| r = 1 | 1.146 | 4.1299 | 0.3313 |
Adjusted period sample: 1994–2016. CE = Cointegrating equation. r = Number of relations (Source: Authors own).
Table 5.
Johansen cointegration test—exports and GDP.
| Unrestricted Cointegration Rank Test (Trace) | |||
| Hypothesized No. of CE(s) | Trace statistic | 0.05 Critical Value | Probability |
| r = 0 | 45.23127 | 12.32090 | 0.0000 |
| r = 1 | 3.120254 | 4.129906 | 0.0916 |
| Unrestricted Cointegration Rank Test (Maximum Eigenvalue) | |||
| Hypothesized No. of CE(s) | Max-Eigen Statistic | 0.05 Critical Value | Probability |
| r = 0 | 42.11102 | 11.22480 | 0.0000 |
| r = 1 | 3.120254 | 4.129906 | 0.0916 |
Adjusted period sample: 1998–2016. CE = Cointegrating equation. r = Number of relations (Source: Authors own).
Table 6.
Vector error correction model—First difference FDI inflow and exports.
| Error Correction: | D(LFDIINFLOW) | D(LEXPORTS) |
|---|---|---|
| ECT (−1) | −0.031237 | 0.019994 |
| T-statistic | [−1.94146] | [6.49011] |
| D(LFDIINFLOW(−1)) | −0.116464 | −0.010439 |
| T-statistic | [−0.51940] | [−0.24314] |
| D(LFDIINFLOW(−2)) | −0.22474 | −0.016198 |
| T-statistic | [−1.29450] | [−0.48730] |
| D(LEXPORTS(−1)) | 2.384876 | −0.168394 |
| T-statistic | [3.00622] | [−1.10862] |
| D(LEXPORTS(−2)) | 0.862026 | −0.468792 |
| T-statistic | [1.61744] | [−4.59398] |
| C | −0.317678 | 0.216039 |
| T-statistic | [−2.47729] | [8.79878] |
Adjusted period sample: 1999–2016. t-statistics in [ ] (Source: Authors own).
Table 7.
Vector error correction model—First difference FDI inflow and GDP.
| Error Correction: | D(LFDI Inflow) | D(LGDP) |
|---|---|---|
| ECT (−1) | −0.475815 | 0.038185 |
| T-statistic | [−3.32281] | [1.49281] |
| D(LFDIINFLOW(−1)) | −0.106981 | −0.004522 |
| T-statistic | [−0.67237] | [−0.15909] |
| D(LFDIINFLOW(−2)) | −0.291034 | −0.016891 |
| T-statistic | [−1.88035] | [−0.61095] |
| D(LGDP(−1)) | 2.399205 | 0.019553 |
| T-statistic | [1.88908] | [0.08619] |
| D(LGDP(−2)) | 3.579093 | −0.360219 |
| T-statistic | [2.61896] | [−1.47559] |
| C | −0.232009 | 0.066143 |
| T-statistic | [−2.08289] | [3.32422] |
Adjusted period sample: 1995–2016. t-statistics in [ ] (Source: Authors own).
Table 8.
Vector error correction model—First difference GDP and exports.
| Error Correction: | D(LGDP) | D(LEXPORTS) |
|---|---|---|
| ECT (−1) | −0.200594 | −0.792468 |
| T-statistic | [−3.30393] | [−4.53126] |
| D(LGDP(−1)) | 0.071275 | 1.914700 |
| T-statistic | [0.27801] | [2.59269] |
| D(LGDP(−2)) | −0.208276 | 0.065707 |
| T-statistic | [−1.21635] | [0.13322] |
| D(LEXPORTS(−1)) | −0.008884 | −0.431141 |
| T-statistic | [−0.17007] | [−2.86535] |
| D(LEXPORTS(−2)) | 0.004382 | −0.548133 |
| T-statistic | [0.08607] | [−3.73770] |
| C | 0.053561 | 0.160855 |
| T-statistic | [4.46124] | [4.65123] |
Adjusted period sample: 1999–2016. t-statistics in [ ] (Source: Authors own).
Table 9.
Granger causality test—FDI inflows and exports.
| Null Hypothesis: | Observations | F-Statistic | Probability |
|---|---|---|---|
| L(FDI Inflow) does not Granger Cause L(Exports) | 19 | 1.29507 | 0.3048 |
| L(Exports) does not Granger Cause L(FDI Inflow) | 19 | 10.4963 | 0.0016 |
(Source: Authors own).
Table 10.
Granger causality: GDP and FDI inflow.
| Null Hypothesis: | Observations | F-Statistic | Probability |
|---|---|---|---|
| L(GDP) does not Granger Cause L(FDI Inflow) | 23 | 8.27645 | 0.0028 |
| L(FDI inflow) does not Granger Cause L(GDP) | 23 | 0.14520 | 0.8659 |
(Source: Authors own).
Table 11.
Granger causality test—GDP and exports.
| Null Hypothesis: | Observations | F-Statistic | Probability |
|---|---|---|---|
| L(GDP) does not Granger Cause L(Exports) | 19 | 7.99213 | 0.0048 |
| L(Exports) does not Granger Cause L(GDP) | 19 | 0.10181 | 0.9039 |
(Source: Authors own).
Publisher’s Note: MDPI stays neutral with regard to jurisdictional claims in published maps and institutional affiliations. |
© 2021 by the authors. Licensee MDPI, Basel, Switzerland. This article is an open access article distributed under the terms and conditions of the Creative Commons Attribution (CC BY) license (http://creativecommons.org/licenses/by/4.0/).
Share and Cite
MDPI and ACS Style
Hobbs, S.; Paparas, D.; E. AboElsoud, M. Does Foreign Direct Investment and Trade Promote Economic Growth? Evidence from Albania. Economies 2021, 9, 1. https://0-doi-org.brum.beds.ac.uk/10.3390/economies9010001
AMA Style
Hobbs S, Paparas D, E. AboElsoud M. Does Foreign Direct Investment and Trade Promote Economic Growth? Evidence from Albania. Economies. 2021; 9(1):1. https://0-doi-org.brum.beds.ac.uk/10.3390/economies9010001
Chicago/Turabian StyleHobbs, Sam, Dimitrios Paparas, and Mostafa E. AboElsoud. 2021. "Does Foreign Direct Investment and Trade Promote Economic Growth? Evidence from Albania" Economies 9, no. 1: 1. https://0-doi-org.brum.beds.ac.uk/10.3390/economies9010001
Note that from the first issue of 2016, this journal uses article numbers instead of page numbers. See further details here.