1. Introduction and Background
Travel and tourism are important parts of the economy for many countries, and the exchange rate has a considerable impact on cross-border travel. This type of tourism is sensitive to changes in exchange rates, prices, and revenues
Stabler et al. (
2009). Many researchers have focused on the impacts of variations in currencies on overnight stays at hotels
Corgel (
2003), but few have explored how these rate fluctuations influence foreign travelers to campsites.
Camping tourism has traditionally been associated with Europe, Australia, and North America, but there is rising interest in Asia
Lee (
2020). There also seems to be increased attention toward campsites in Europe and North America
Ram and Hall (
2020). Camping provides flexibility and can easily be combined with other activities, such as fishing and mountain climbing, allowing families to closely interact with nature. Several authors have called for more analysis on camping tourists
Rogerson and Rogerson (
2020). Therefore, this article aimed to provide a little more insight into this sector.
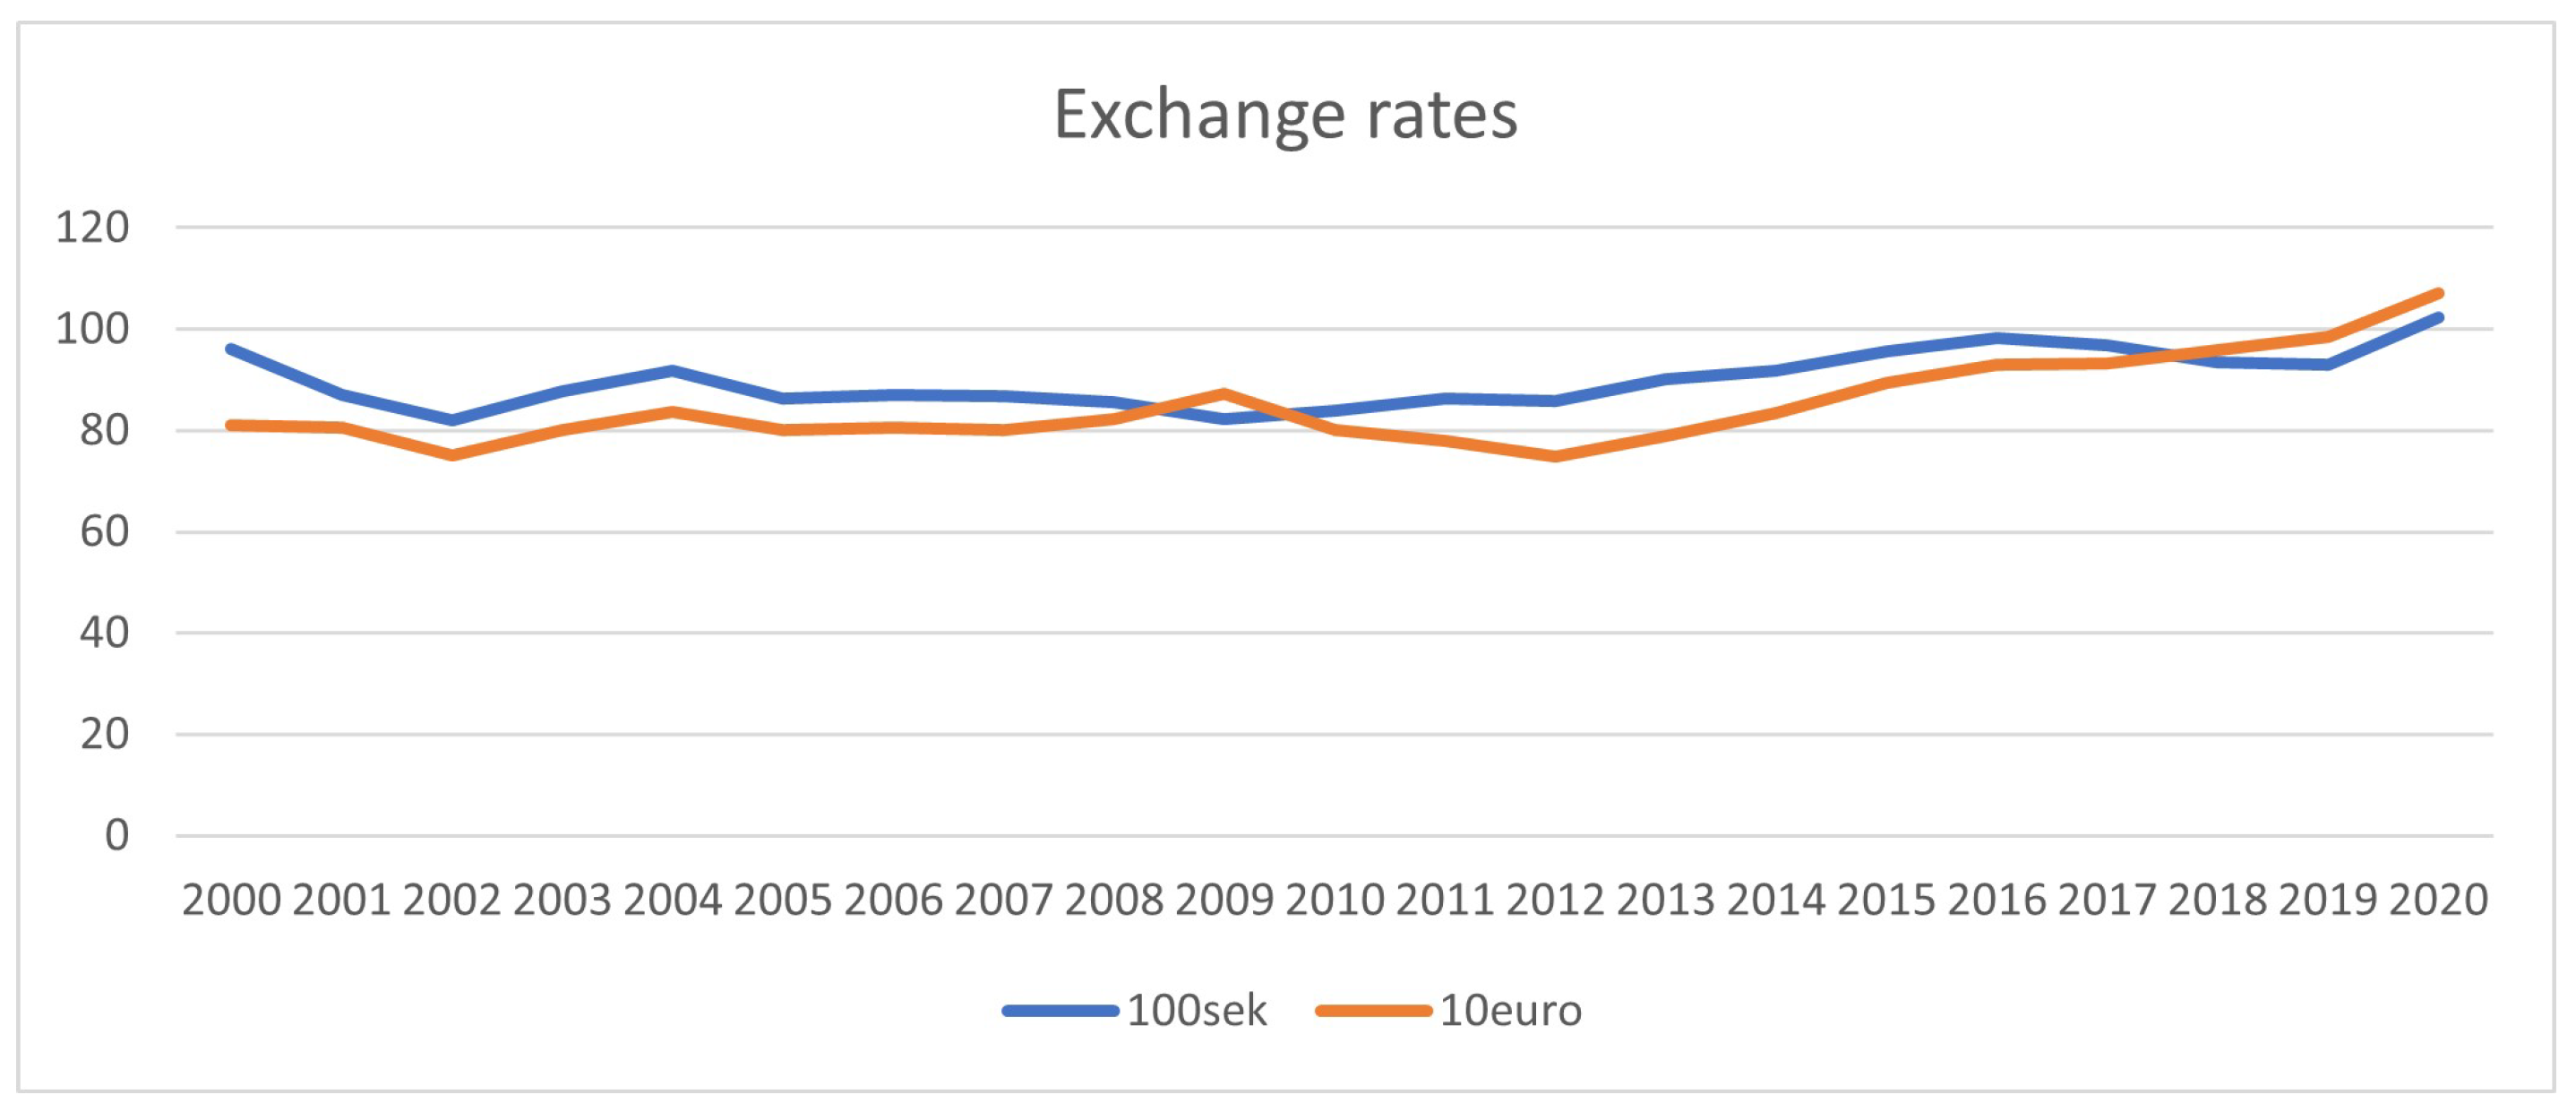
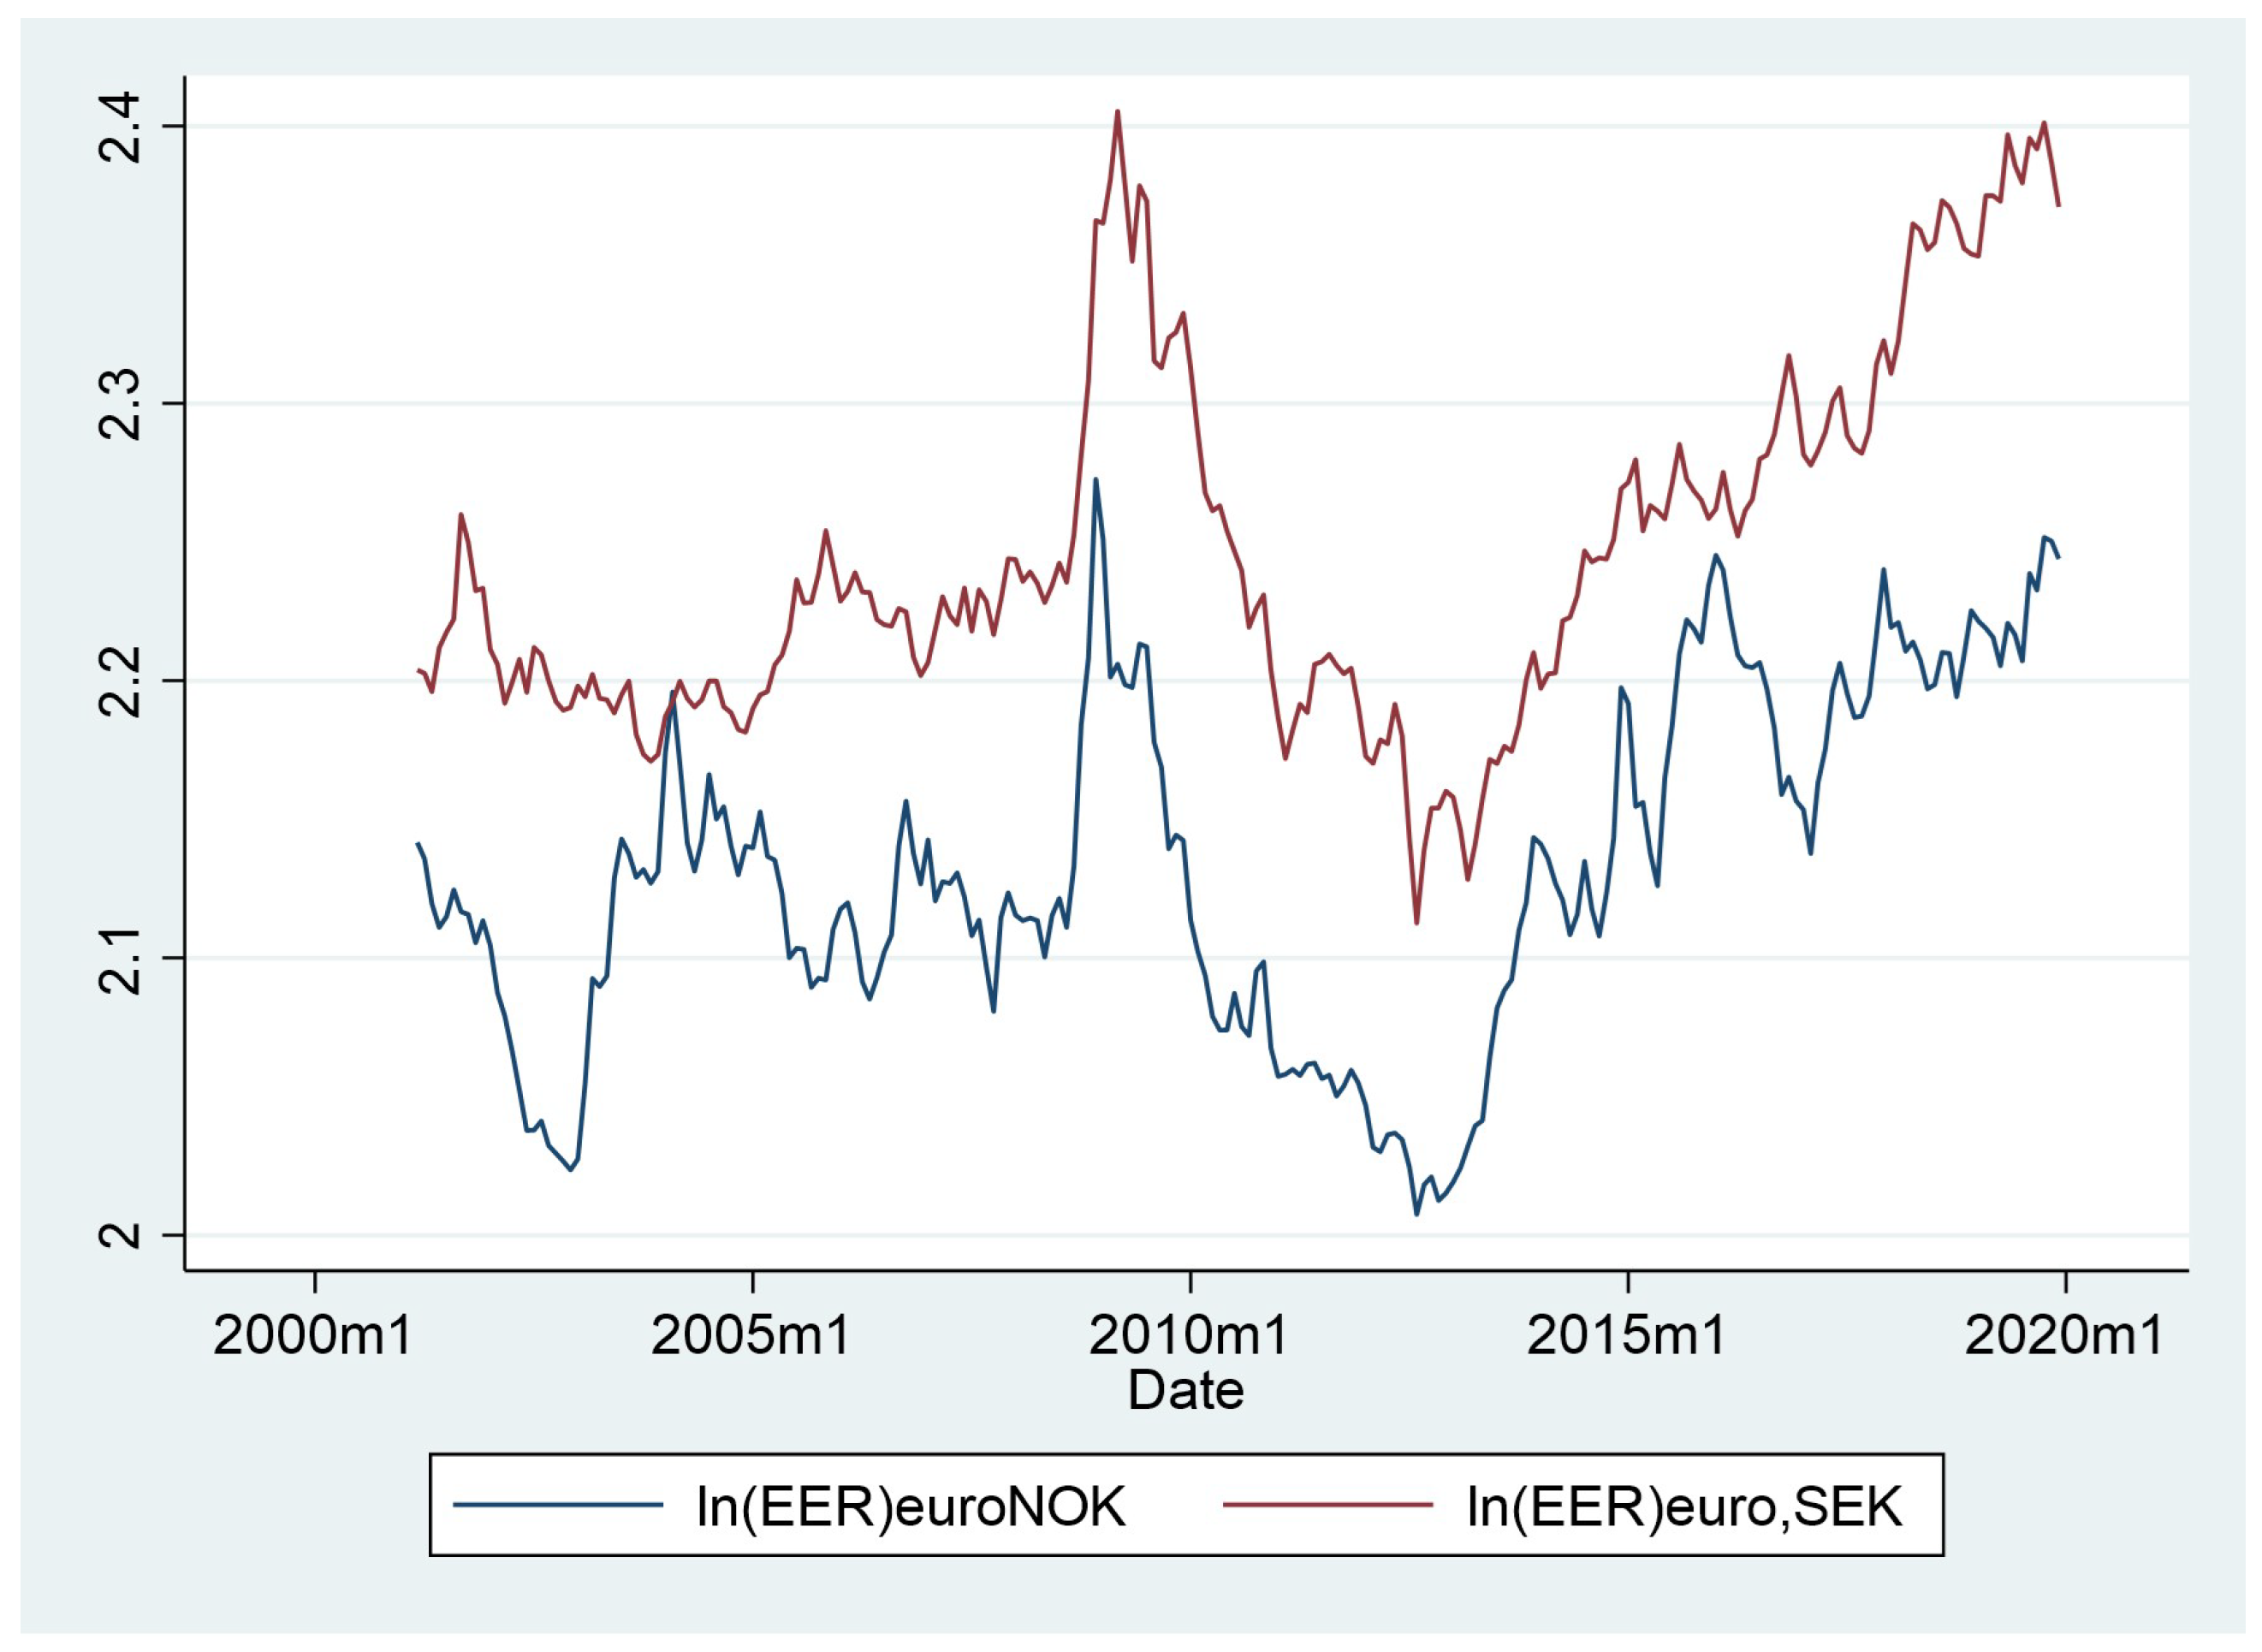
The purpose of this paper was to further investigate this topic by using data from Norway. Knowledge about these patterns is useful for tourism industry planning in Norway. With a small open economy that has its own floating exchange rate regime, there has been substantial instability in the rate, especially in the last 10 years due to changes in the price of oil, which is a major driver of the Norwegian economy (see
Figure 1). Since 2014, the Norwegian krone has significantly weakened compared to, for example, the euro and Swedish krone.
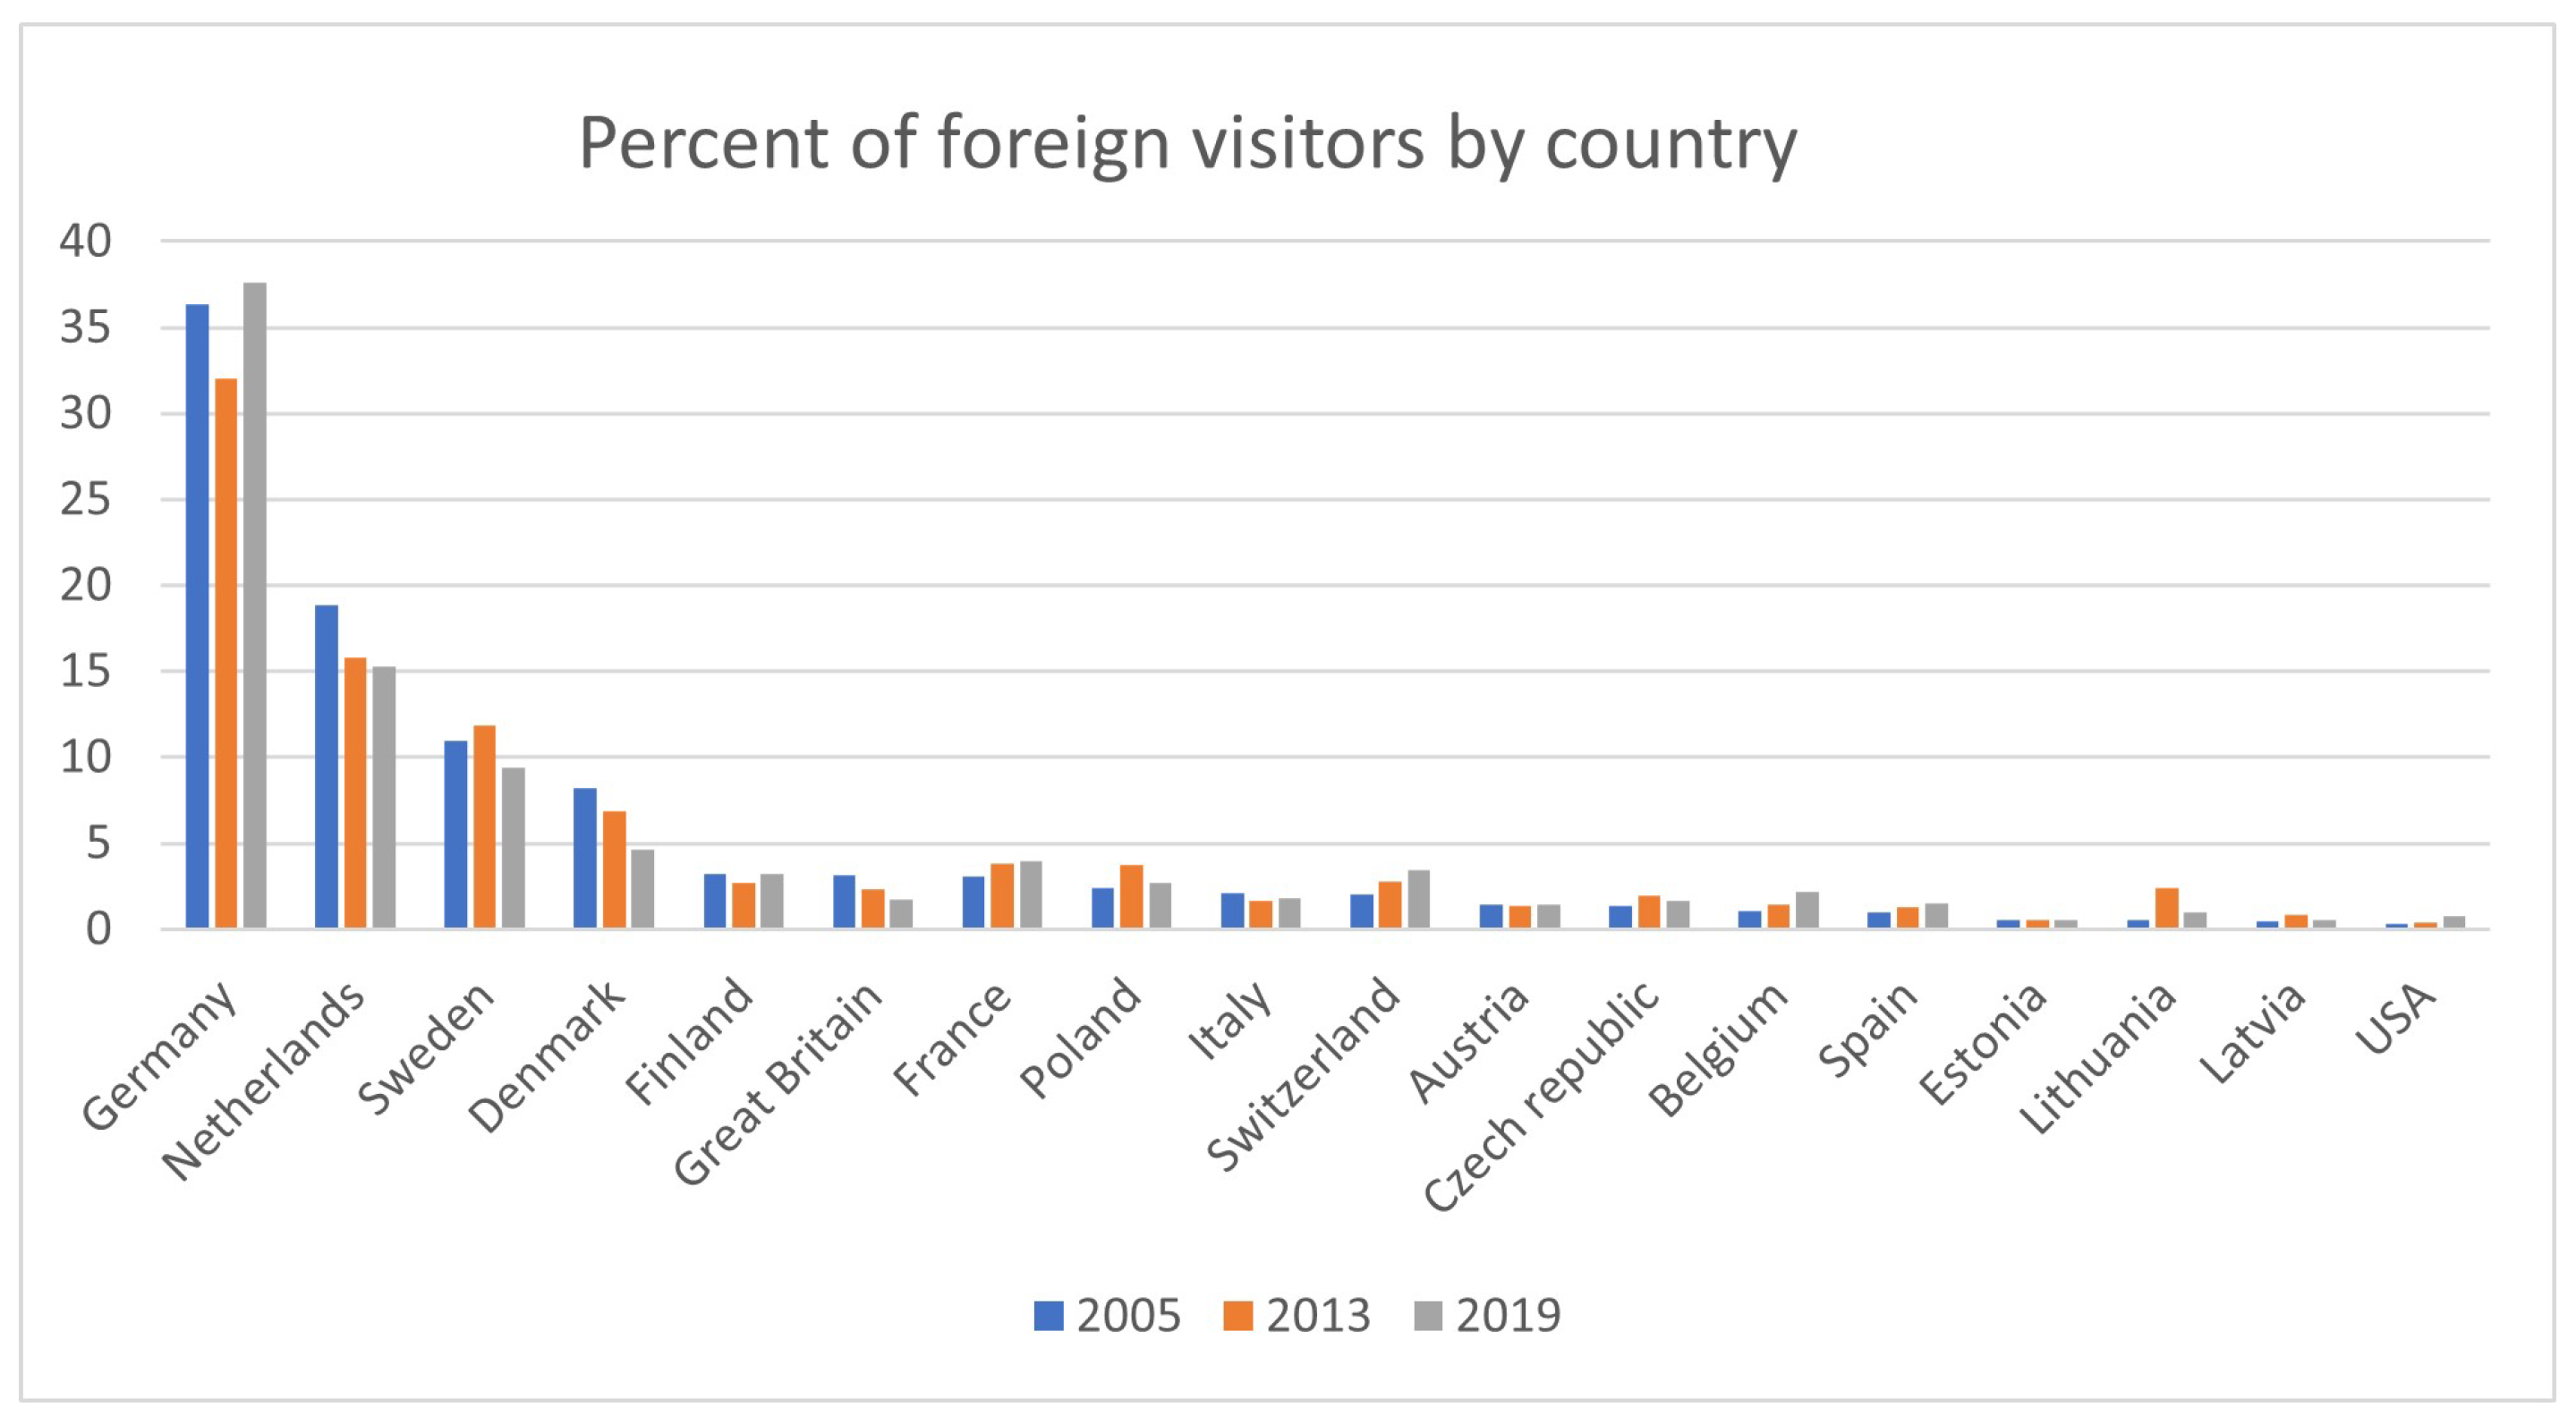
Although overnight stays at campsites are dominated by domestic demand (over 70 percent), foreigners make up an important customer group. Foreign visitors have longer holidays and significantly higher 24 h consumption than domestic visitors
Innovation Norway (
2019). Visitors are mainly from Germany, the Netherlands, Sweden, and Denmark (see
Figure 2). In this report, we limited the analysis to German and Swedish tourists.
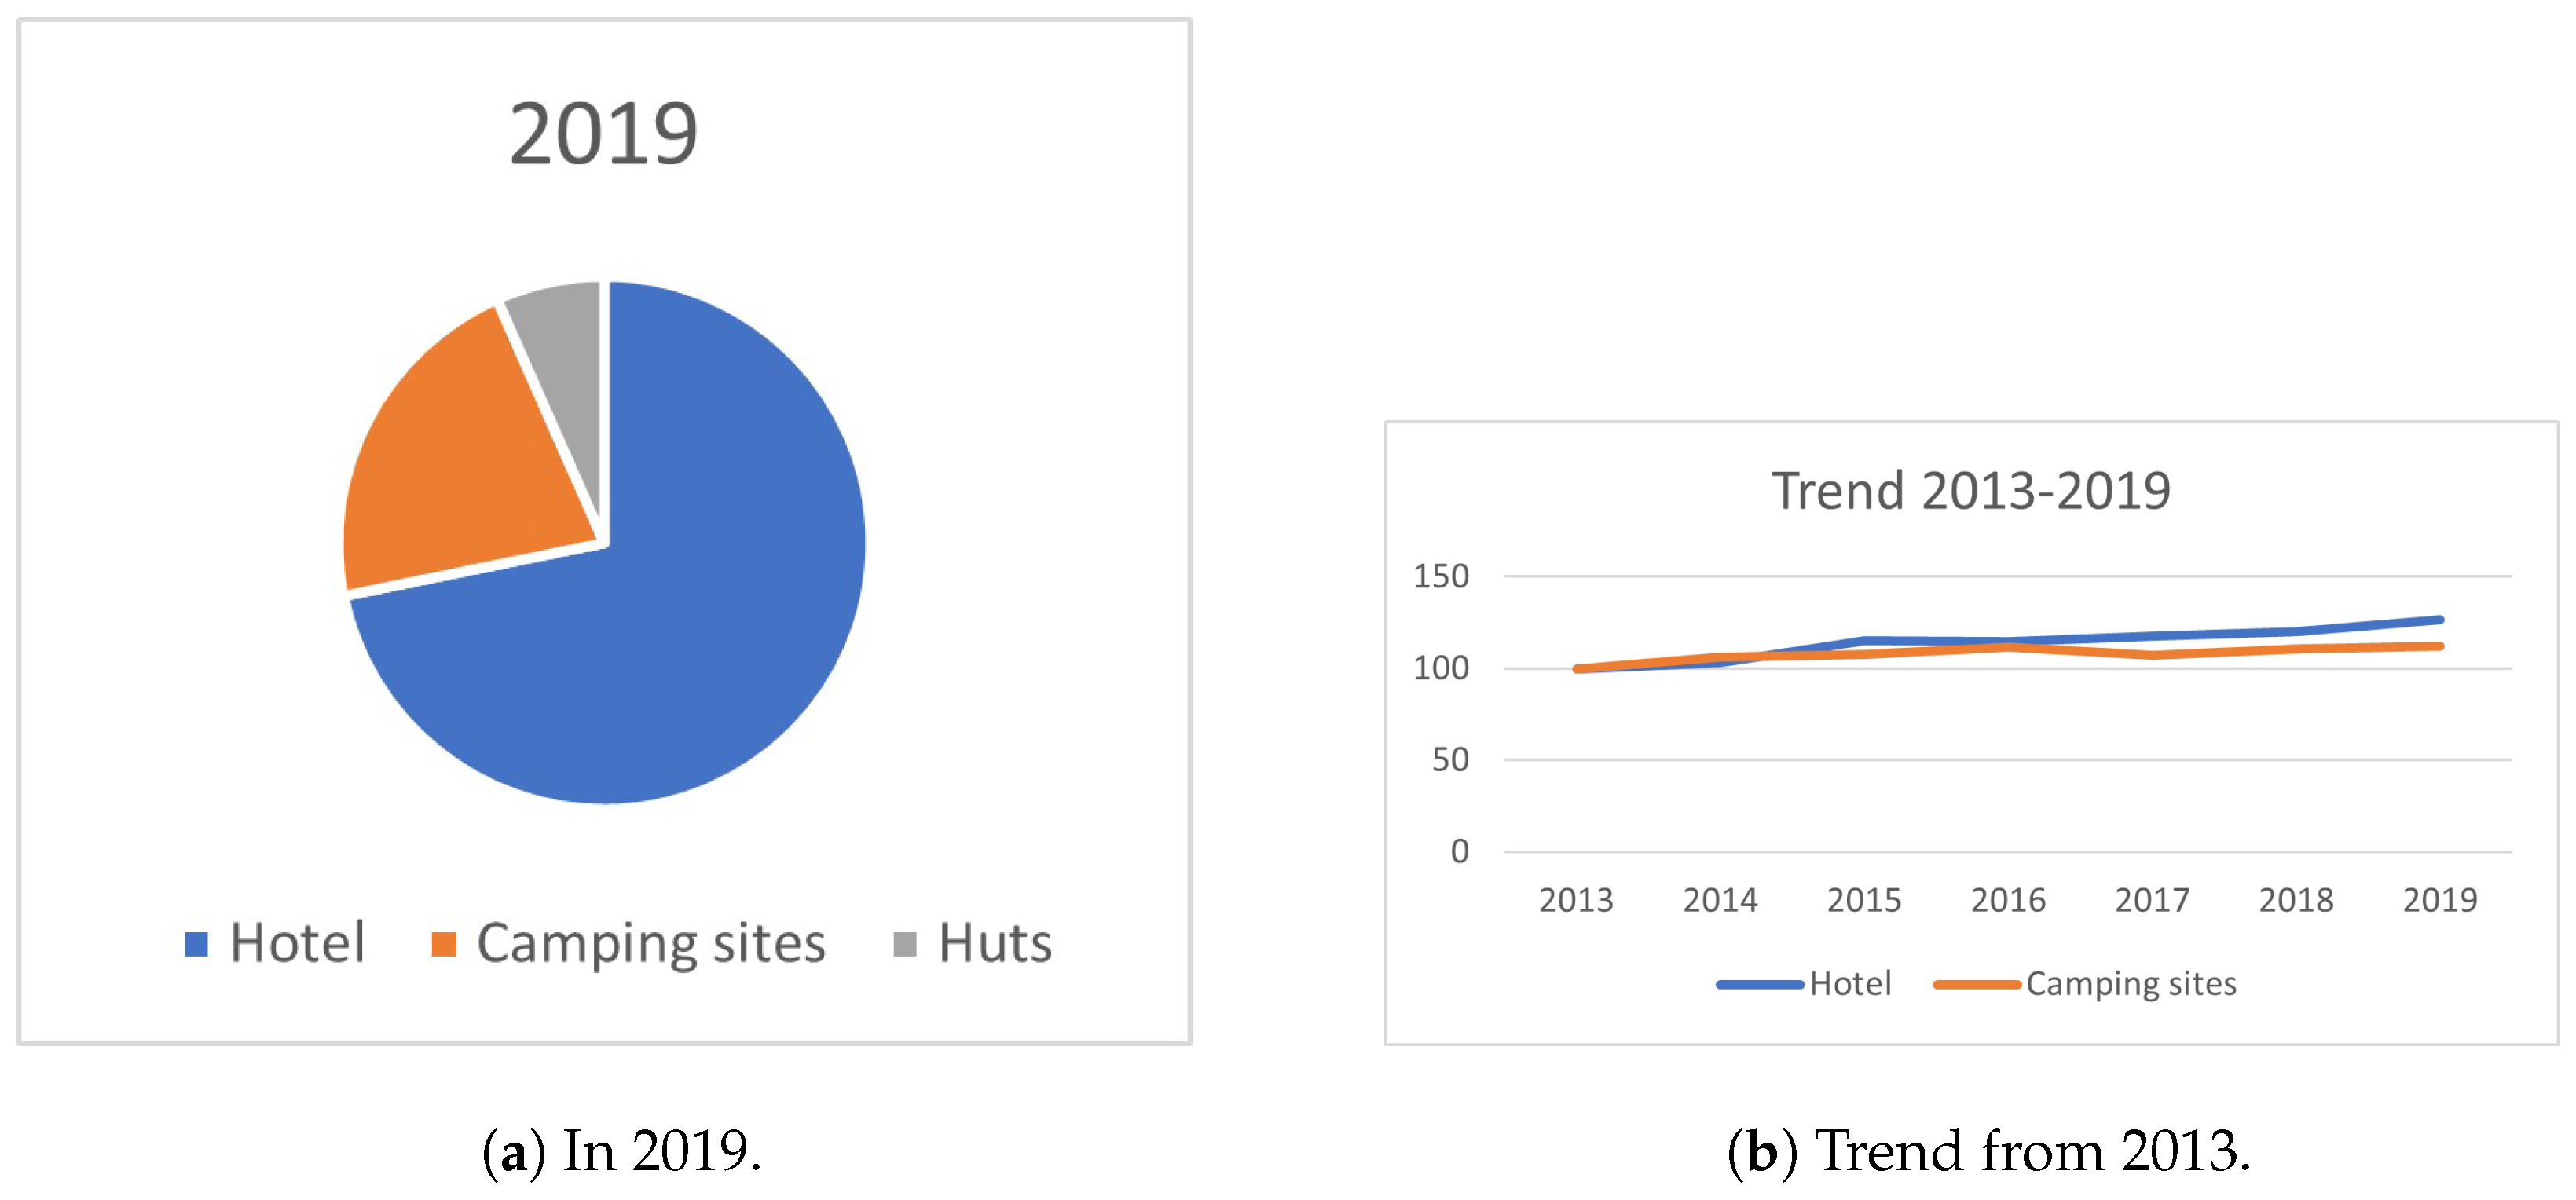
Compared to hotels, campsites make up a small proportion of total accommodations (see
Figure 3), and even foreign tourists frequently combine camping with stays in hotels. The proportion of people staying in campsites has decreased since 2013.
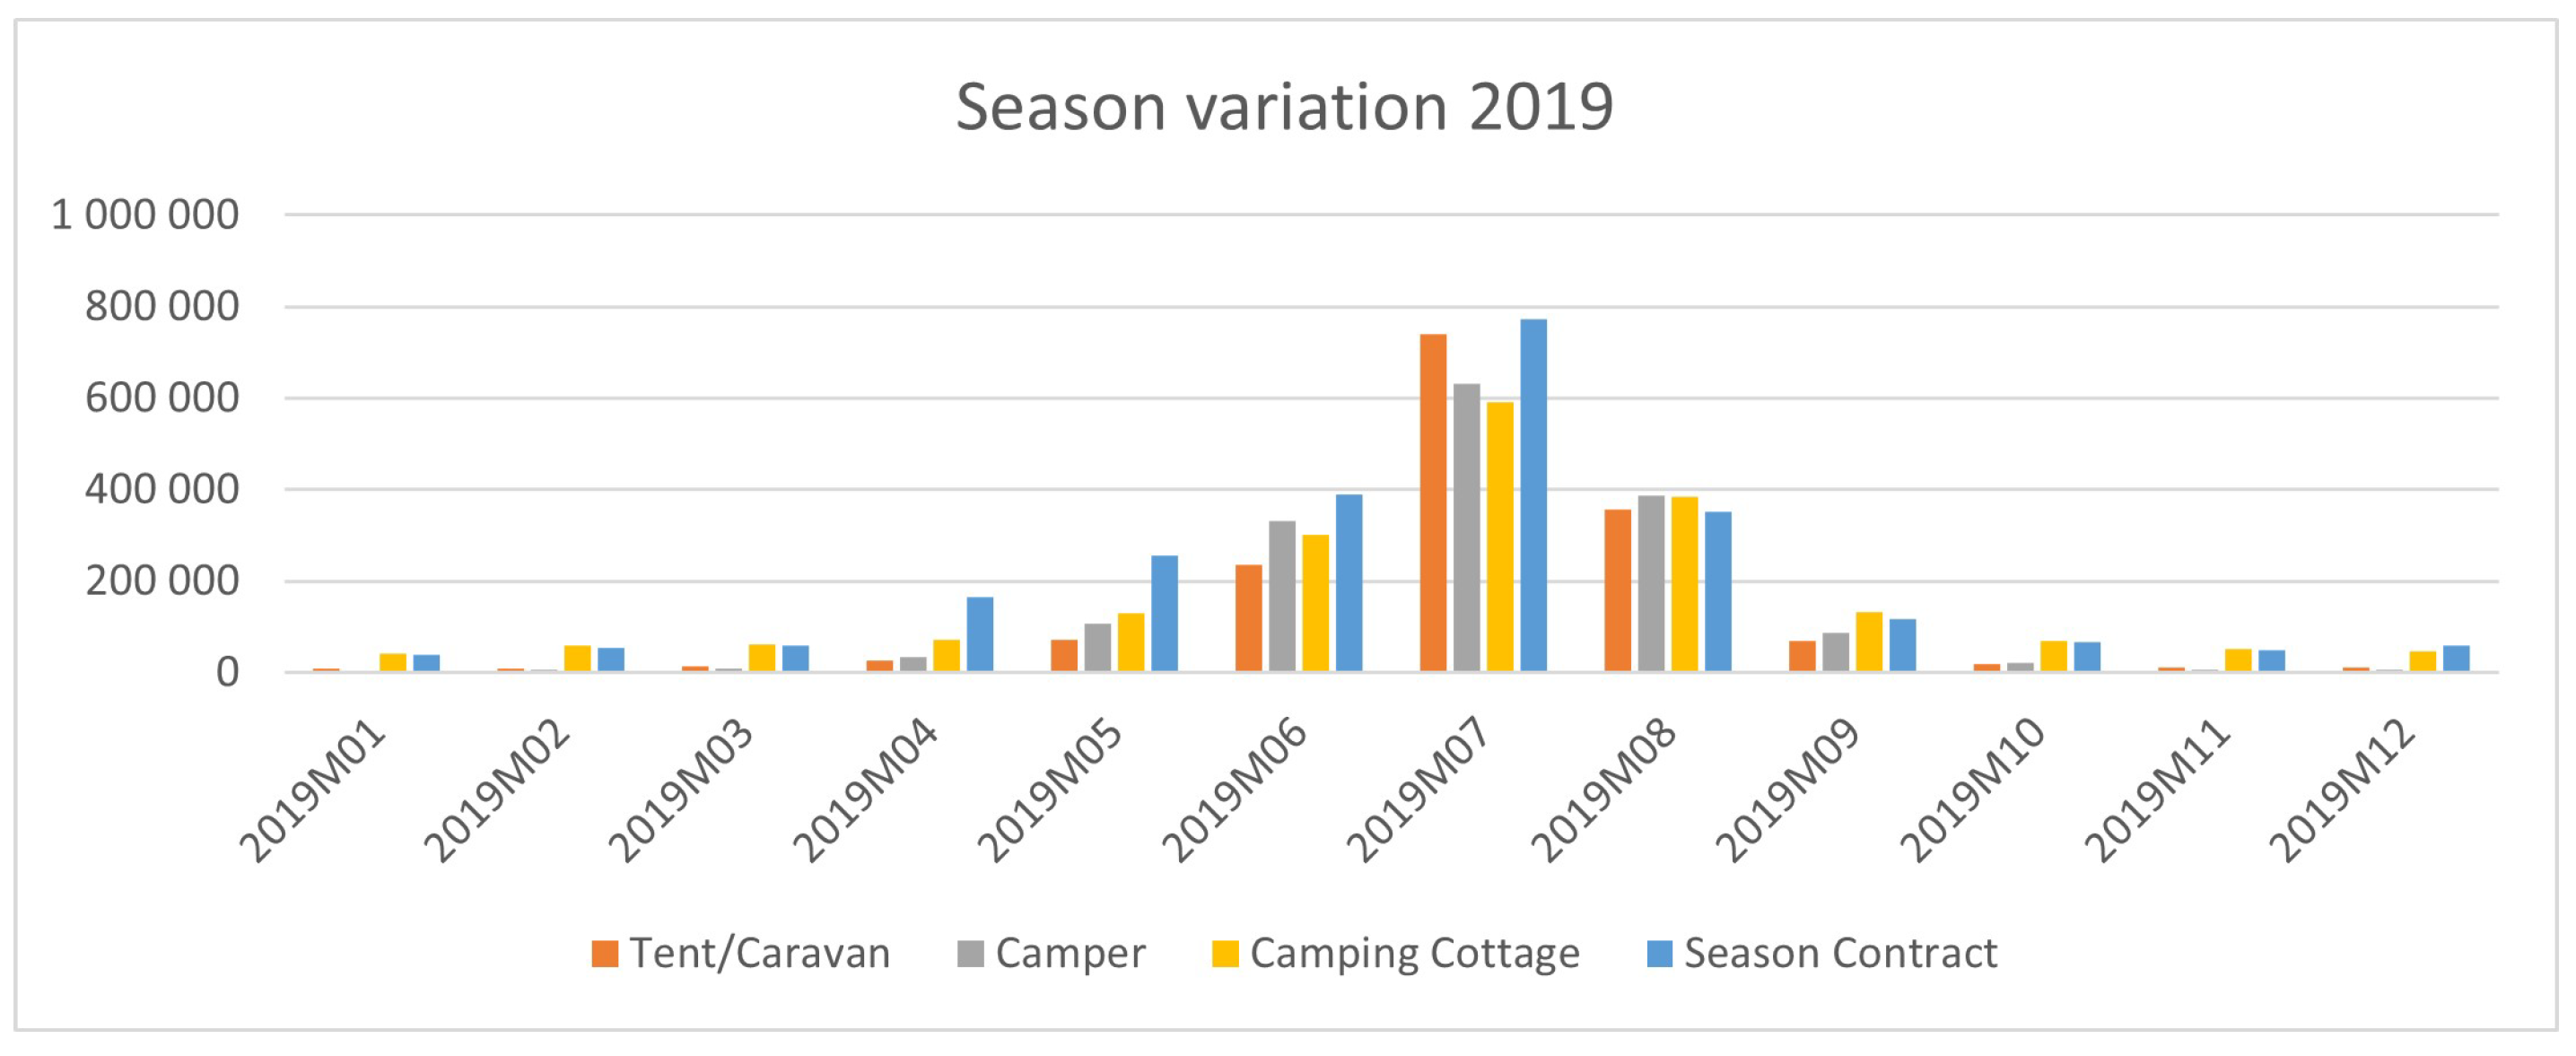
The use of campsites in Norway is highly seasonal, with most people visiting in the summer months (see
Figure 4).
Income of the origin country;
Relative price of the destination;
Relative price of competitor destinations;
Exchange rates between origin and destination;
Other variables (transport costs, special events, attraction of destination, etc.).
In this paper, the focus was on the first four variables. According to standard economic theory, higher income leads to increased demand. A relatively high price in the visiting country or higher exchange rate makes it less attractive to travelers. If there is no such issue in competing destinations, a substitution effect may occur. However, there might also be complementarity since many tourists visit several countries at the same time. The aim of this article was to estimate these effects for German and Swedish visitors who stay at Norwegian campsites.
We estimated possible relationships by applying logarithmic regression and using publicly available time series data. It was of interest to see how changes in the exchange rate influenced the inflow of tourists given the option of alternative destinations. Swedish visitors would consider not only the relationship between the effective exchange rate between Norway and Sweden, but also the value relative to other countries.
Foreign tourists visiting Norway must contend with high prices of services and goods compared with most other countries
Dybedal et al. (
2003). However, this effect has diminished over the last several years due to the depreciation of the currency and its substantial short-term fluctuation. The question is: What impact has this had on the foreign demand for trips to Norwegian camps? Since visitors calculate the costs measured in their own currency, changes in rates will have a direct impact on their budgets.
The decision to travel is made before one goes on holiday
Stabler et al. (
2009). In the analysis of the tourist market, one must take this into account. Therefore, it is more accurate to use the exchange rate at the time of the decision and not at the time of travel. There is much discussion in the literature about the length of this time lag. An examination of bookings at Norwegian hotels showed that the average difference between booking and arrival was about four months.
2. Literature Review
2.1. International Tourism and Income
Previous research suggested that income, prices, and the currency rate have a considerable effect on tourist inflow, but there is significant variation in the degree of influence between variables. Many factors can explain this. According to
Peng et al. (
2015), there is a large spread in the income elasticity depending on the destination, country of origin, season, and type of holiday. Income in the origin country seems to be a dominant variable in explaining the level of international tourism.
Sanchez-Rivero and Pulido-Fernández (
2020) suggested that the average income elasticity of visitors crossing international borders is substantially higher than 1.0 (their estimate was just over 2.0). If this is the case, an increase of one percent will cause the demand for tourist travel to rise far beyond one percent. Economic theory refers to this as a luxury good. There may be wide gaps for the same destination depending on the country of origin, as well as large differences within the same country of origin depending on the destination. Due to a lower income level, income elasticity tends to be higher for visitors from countries with low GDP per capita compared to countries with high GDP per capita. There is limited holiday time, and the choice of destination can be sensitive to changes in some important variables.
Crouch (
1996) reported an income elasticity of 1.5 for international tourism. Recent research reports suggest that income elasticity is between 1.0 and 2.0, but with significant variations
Kumar and Kumar (
2020);
Ongan et al. (
2017);
Sanchez-Rivero and Pulido-Fernández (
2020); however,
Jensen (
1998) pointed out that the income elasticity of foreign visitors is considerably higher than that of domestic tourist visitors.
2.2. International Tourism and Prices Inclusive of Exchange Rates
The pricing mechanism applies to international tourism. If it becomes more expensive to visit a country, then fewer will travel there. Previous surveys reported a large gap in this effect, depending on the case studied
Peng et al. (
2015).
Peng et al. (
2015) found an overall average price elasticity of −1.3
Peng et al. (
2015), while
Kumar and Kumar (
2020) suggested a significantly lower value (around −0.8).
The exchange rate might be a key factor in the demand for tourism.
Garín-Muñoza and Montero-Martín (
2007) estimated the exchange rate elasticity (of a stronger domestic currency) for international travelers to the Belearic Islands to be −0.76 for the same year and −1.65 for a one-year lag. A limitation of this research was the use of annual data. Hence, they did not capture fluctuations during the year.
Other researchers have reported that a one percent depreciation of the national currency increased the foreign tourist inflow by six percent in Turkey (
Agiomirgianakis et al. 2014,
2015) and five percent in Iceland
Rannversdóttir and Jóhannsdóttir (
2019). There is a wide range of currency elasticities depending on the country of origin and the destination.
In a study of Norwegian hotels,
Aalen et al. (
2019) estimated the exchange rate elasticity to be around −1.0. In the study of
Xie and Tveterås (
2020), the elasticity was as high as −6.5 for Chinese tourists and only −0.4 for Japanese tourists. For German visitors, the estimate was −1.5. Due to the depreciation of the Norwegian currency, Chinese travelers perceive prices to be attractive compared to competing places, and this has resulted in a sharp increase in visitors. However, there is no corresponding effect for Japanese visitors. Although the differences were not as large,
Ongan et al. (
2017) also reported significant differences depending on the country of origin of European tourists who visited the United States.
Vojtko et al. (
2018) reported that the foreign tourist response to a one percent appreciation of the national currency varied between 0.22 and 3.26 percent in the Czech Republic and Croatia. Many visitors respond to a higher national currency value by decreasing the lengths of their stay and using less expensive accommodation
Fleischer and Rivlin (
2009). This effect is more prevalent in high-cost countries.
Steller (
2017) reported an exchange rate elasticity (of a stronger foreign currency) of 0.74 with a lag of 3–5 months for foreigners visiting Switzerland.
2.3. Neighboring Countries
Neighboring countries might compete for the same visitors, or there might be complementarity.
Kadir and Abd Karim (
2009) reported complementarity among Malaysia, Thailand, and the Philippines for British and American tourist flow. Tourists tend to visit all three countries on the same trip, similar to a travel package.
Patsouratis et al. (
2005) investigated tourism competition among Mediterranean countries. Greece, Portugal, and Spain offer quite similar products (beaches, sun, sea, etc.), and thus, they are competing tourist destinations. Greece and Spain are major competitors for British visitors. Increased prices in Spain will increase the demand for visiting Greece. Since it is more expensive to stay in Spain, many travelers will replace Spain with Greece.
Añaña et al. (
2018) identified significant competition between destinations, where the price level is just one of many factors that influence the choices that travelers make.
2.4. The Demand for Campsites
The international literature includes many articles on camping tourism
Ram and Hall (
2020);
Rogerson and Rogerson (
2020); however, few researchers have specifically explored the demand elasticity (income and price) for overnight stays at campsites. There are some studies on the demand for recreation
Rosenberger and Stanley (
2010). Although it is connected, it is not the same as overnight stays at campsites.
Substitution occurs among different kinds of accommodations. Some countries have experienced reduced camping frequencies over the last decade
Marin-Pantelescu (
2015). Many customers whose income increases prefer a higher standard of accommodation and might replace campsites with huts and hotels. Therefore, the income elasticity of campsites might be lower than that of hotels. Researchers such as
Barnes (
1996) and
Crawford (
2007) reported an inelastic income elasticity
Barnes (
1996);
Crawford (
2007). Higher income has a marginal impact on the demand. Due to the substitution effect,
Brox and Kumar (
1997) suggested a negative income elasticity. The demand for a commodity that is regarded as inferior will fall when income increases. On the other hand, campsites can improve their standards to retain more guests and make these locations more attractive by improving quality and comfort. For this purpose, one needs to invest in infrastructure
Grzinic et al. (
2010). Overnight stays at camping sites are sensitive to price changes.
Beaman et al. (
1991) reported a price elasticity of around −1.0 for staying at campsites.
3. Hypothesis
Based on economic theory and previous research, we postulated the following hypotheses:
Hypothesis 1 (H1). A decrease in the rate of the Norwegian currency leads to more foreign camping tourists in Norway;
Hypothesis 2 (H2). The exchange rate of the euro is related to the inflow of Swedish camping tourists in Norway;
Hypothesis 3 (H3). The exchange rate of the Swedish currency is connected to German camping tourists in Norway;
Hypothesis 4 (H4). There is a connection between income level in the origin country and overnight stays at campsites in Norway.
The analysis was based on visitors from Sweden and Germany. A fall in the rate of the Norwegian exchange rate means that Norwegians have to pay more for the euro and Swedish krone. This makes it less expensive for Swedes and Germans to visit Norway. Our assumption (H1) was that this leads to greater tourist inflow to campsites in Norway. We assumed that Norway competes with neighboring countries to attract tourists and that German tourists often decide to head north, but are unsure whether to holiday in Norway or Sweden. If it is less expensive in Sweden due to the fluctuation of the exchange rates, more Germans may prefer to stay in Sweden instead of Norway (H3). A fall in the euro means that it will be less expensive for Swedes to stay in neighboring countries such as Finland and Denmark (the Danish currency is connected to the euro) instead of Norway (H2). On the other hand, a stronger Swedish currency can lead to an increase in Swedes traveling abroad. Therefore, one must account for the possibility of complementarity.
It is not clear how an increase in income affects demand for overnight stays at campsites (H4), and the research results are mixed. Some researchers suggested that demand is unaffected by income
Crawford (
2007), and others proposed that income elasticity is negative (inferior commodity)
Brox and Kumar (
1997). It is also possible that it is a common good with an income elasticity equal to 1.0 or greater for visiting tourists. Several researchers have pointed out that the income elasticity of foreign tourism is high (see
Agiomirgianakis et al. (
2014)). This may also apply to camping tourists.
4. Methodology
4.1. Data
The data on overnight stays at campsites were provided by Statistics Norway (SSB). In the dataset from SSB, it was possible to analyze countries of origin and visits by month and year. The Norwegian central bank (Norges Bank) provides an ongoing overview of exchange rates, and we took advantage of this information in our analysis. Figures for the consumer price index (CPI) and gross domestic product (GDP) were from data published by the World Bank. The sample period was from 2000 to 2019. In this study, the focus was on only two visiting countries, Sweden and Germany. Sweden is a neighbor of Norway, and the country has its own currency (SEK). Germany is the most important visiting country (see
Figure 2).
4.2. The Models
Based on the analysis of
Stabler et al. (
2009), the assumption was that the use of campsites in Norway (V) depends on the exchange rate, GDP, and season.
Some researchers have analyzed the effect of changes in the exchange rate by using effective exchange rates, which refers to nominal values adjusted for differences in inflation rates among countries
Lee et al. (
1996). Especially in the long run, it is more accurate to take into account changes in the consumer price index in different countries
Stabler et al. (
2009);
Syriopoulos (
1996). In this study, the effective exchange rate (EER) was used:
The logarithmic transformation of
is:
where CPI is the consumer price index, ER is the nominal exchange rate,
i denotes country
i,
j denotes country
j, and
is the nominal exchange rate for country
j relative to country
i.
The effective exchange for the country of origin is the consumption price of the origin country divided by the consumption price at the destination, and this price level is multiplied by the exchange rate between the destination country and country of origin. This can be written as the rate between the consumption price at the origin and destination countries multiplied by the exchange rate between origin and destination countries. Tourist inflow is a dynamic process. To capture the dynamic structure of the dependent variable, it is quite common to use autoregressive distributed lag models (ADLs) with lagged dependent and explanatory variables, as in
Song et al. (
2003);
Brooks (
2019). In this study, there was a lag of one and two months for overnight stays.
For hotels, German tourists book their visits more than 150 days in advance, while Swedes book their stays less than 100 days before their arrival in Norway
Innovation Norway (
2019). This effect is at least as likely to apply to overnight stays at campsites. Similar to
Aalen et al. (
2019), this study used an average of 4–6 months as the time lag before entry for the value of the exchange rate. In line with the international literature
Sanchez-Rivero and Pulido-Fernández (
2020), the chosen model is presented in logarithmic form:
is the overnight stay in Norway by visitors from country i ( 1: Sweden, 2: Germany) in month t. is gross domestic product for country i in month t (GDP is interpolated linearly from a yearly to a monthly basis). is the effective exchange rate between the country of origin and Norway. is the effective exchange rate between the country of origin and an alternative destination (country). k is a dummy variable for month number k, where January was the reference group in this regression. Due to a change in registration in 2013, the data for 2013 were not comparable to the data for the previous year. This was addressed by using the dummy variable Year 2013. In Equation (5), t is the month of arrival (from 2000 to 2019).
We further assumed that the exchange rate in Sweden can influence the tourist inflow from Germany and vice versa. Therefore, the variable was included in the model.
The model for Sweden and Germany can be formulated based on Equation (5). The model for Sweden (Country 1) is:
and the model for Germany (Country 2) is:
The ADL models were estimated using ordinary least squares (OLS), which leads to consistent estimators under classical OLS assumptions. A move from a static to dynamic model will often result in the removal of residual autocorrelation. To account for autocorrelation, our model is presented with lagged dependent variables for two periods. If there is still autocorrelation in the residuals of the model after including lags, then the OLS estimators will not be consistent
Brooks (
2019). We tested for autocorrelation by using the Breusch–Godfrey test
Brooks (
2019).
We further tested for heteroscedasticity using the Breusch–Pagan test
Wooldridge (
2020). In the presence of heteroscedasticity, the standard errors may be wrong, and hence, any inference made could be misleading. We therefore used heteroscedasticity-consistent robust standard errors in the case of significant heteroscedasticity.
We checked for multicollinearity using bivariate correlations and variance inflation factor (VIF) indices. If VIF indices are above 10, then we often conclude that multicollinearity is a “problem” for the estimated regression coefficients. However, a VIF above 10 does not mean that the standard errors of the estimated regression coefficients are too large. Therefore, the size of the VIF is of limited use
Wooldridge (
2020).
5. Findings
Table 1 shows all the results. The lagged dependent variable of the demand for overnight stays at campsites was significant for both Sweden and Germany for lag
and lag
. There was no significant autocorrelation for the presented model for Germany or Sweden, with
p-values from the Breusch–Godfrey test equal to 0.087 and 0.979, respectively. The Breusch–Pagan test revealed significant heteroscedasticity for Germany and Sweden, with
p-values of 0.0025 and 0.000, respectively, and robust estimation was applied.
For the model of Germany, the independent variable
was included, but the variable
was excluded. These two variables were relatively strongly correlated in our data (r = 0.79 with
p-value = 0.0000), and with both variables included in the ADL model, neither was significant, presumably due to multicollinearity.
Figure 5 illustrates the strong relationship between these two variables over time. The omission of the variable
due to multicollinearity is also explained in Note 2 in
Table 1.
Moreover, most of the monthly dummy variables were significantly positive, but the effect for Germany was stronger than that for Sweden.
Using ln-linear demand models, the estimated coefficients showed the elasticities. The exchange rate elasticity for the inflow of German visitors was statistically significant with a value of 0.82. If the Norwegian exchange rate depreciates by one percent, German tourists will increase by 0.82 percent. For Sweden, the exchange rate elasticity was not significant. Nevertheless, the result confirmed Hypothesis 1 (H1). A one percent stronger Swedish currency compared to the euro was significantly connected to 0.52 percent more visitors from Sweden (H2 was confirmed). Due to multicollinearity, we were not able to test Hypothesis 3 (H3).
The income elasticity for German visitors was around zero and not significant. For Sweden, the income elasticity was significant with a value of 0.57. If the income increases by one percent in Sweden, the growth of Swedish travelers visiting Norwegian campsites is 0.57 percent. This confirmed Hypothesis 4 (H4).
6. Discussion
6.1. Campsites and Income
The results were largely consistent with previous research. This confirmed the assumption that the demand for overnight stays at campsites has a low-income elasticity, unlike other parts of the tourism industry. This seems to be the situation in many countries. In an analysis of the tourism industry between 2000 and 2015,
Guzman-Parra et al. (
2015) observed that there was a significant increase in hotel and rural accommodation, while the number of overnight stays at campsites was stable during this period. This was in accordance with the tendency in Norway (see
Figure 3). The regression model showed no correlation between the increase in income in Germany over the past two decades and the use of campsites. Coefficient B was close to zero and was not significant. One interpretation is that the demand for Norwegian campsites among German visitors is independent of the income for this period. For Swedish visitors, on the other hand, the link between income and the use of Norwegian campsites was significant, but the coefficient was small (under 0.6). This means that an increase in income of ten percent will increase the demand for overnight stays at campsites by less than six percent. The demand was inelastic. The reason for the low-income elasticity was presumably that higher incomes lead to more tourists wanting greater comfort than campsites can offer. Campsites are being replaced by more luxurious accommodation options (see
Brox and Kumar (
1997)).
To counteract the loss of customers, many Norwegian campsites are investing in resources to increase the comfort level (more cabins, leisure facilities, sanitary conditions) to attract more campers. This is in accordance with the observation of
Grzinic et al. (
2010). This effect may help explain why the income elasticity was not negative. A negative income elasticity has been reported in the United States
Rice et al. (
2019) and may also apply in Norway. Camping is still mostly low-budget tourism. Therefore, an increase in income in wealthy countries will have little impact on demand. In Australia and New Zealand, there has for example been a substantial increase in the use of caravans and campers, which can offer greater comfort
Collins et al. (
2018).
6.2. Campsites and Exchange Rate
If a country depreciates the value of its own currency, it becomes less expensive and more attractive to visit. The size of this effect depends on many factors, including the extent of the substitution effect. If the choice is between holidaying in two countries that offer almost the same service, the effect of a slight change in the exchange rate may be considerable. If a tourist is seeking sun and beautiful beaches and is unsure whether to travel to Portugal or Spain, a slight change in the relative prices can have a major impact
Patsouratis et al. (
2005). In other situations, there are few equal options, in which case, the effect of the exchange rate will be small. Such factors explain why there is a wide gap in the estimation of the exchange rate elasticity.
Although the Norwegian currency has depreciated considerably over the past 10 years, foreigners are still experiencing Norway as an expensive country to visit
Jacobsen et al. (
2018). The price elasticity of a change in the real exchange rate provides important information about the impact of changes in relative prices. According to our analysis, for German camping visitors, this exchange rate elasticity effect was 0.8. A weaker Norwegian currency leads to more German overnight days at Norwegian campsites (Hypothesis H1). The effect was significant, but the price elasticity was under 1.0. Compared to many other international studies, the influence was rather small. Many German tourists may prefer to experience the midnight sun and see mountains and fjords, often combined with boat trips and fishing, independent of the currency rate
Chen and Chen (
2016).
Due to multicollinearity, we excluded the value of the Swedish currency in the model for Germany (see Note (2),
Table 1) However, our analysis of the data suggested that a change in the Swedish krone had little impact on German camping tourists in Norway. One possible explanation is that the change in the Swedish exchange rate in the examined period was too small for German visitors to factor it into their decisions (see
Figure 1). Therefore, it might explain why this analysis cannot prove that a change in the Swedish currency in relation to the Norwegian currency has any significant effect on German visitors. In addition, Germans may find that Norway and Sweden have different offers for camping tourists. This limits the substitution effect. On the other hand, a change in the Swedish krone relative to the euro will have an impact on the number of Swedish visitors to Norwegian campsites. The results showed that a weakening of the Swedish currency compared to the euro (
Figure 1) resulted in fewer Swedish visitors (Hypothesis H2) (a strengthening of the Swedish currency against the euro will then have the opposite effect). One possible reason is that Swedes focus on the value of their national exchange rate relative to the euro. If the Swedish currency weakens, fewer Swedes choose to go camping abroad and are more likely to arrange a domestic holiday. The literature indicates that there is often complementarity between different countries. Swedish camping tourism abroad can be combined with visiting neighboring countries (Denmark, Finland, and so on). This may be another factor that explains the significant positive link (
) between Swedish currency (relative to the euro) and Swedes’ use of Norwegian campsites.
6.3. Other Factors and Campsites
The main reason for using the two periods of lagged dependent variables was to avoid autocorrelation. This factor was statistically significant. One interpretation is stability in the demand; consumers are returning
Jacobsen et al. (
2018), and a reputation has been developed for ensuring the attraction of new visitors. This is supported by active marketing. The use of campsites in Norway is highly seasonal (see
Figure 4). Therefore, as expected, we observed a significant impact on dummy goods for various months.
7. Limitations
This analysis was for a limited time frame and for only two countries. It would be beneficial to include other countries that are important for Norwegian camping tourism, such as the Netherlands and Denmark. It is reasonable to assume that the impact observed for Germans will be largely the same for Dutch tourists. Danes represent a different segment since they visit Norway in winter (skiing). In addition, the analysis was based on public data.
There are many other factors that can affect the demand for Norwegian campsites that were not captured in the model (different types of accommodation at the campsite, standard changes, and so on). For example, most campsites sell different types of accommodation such as cabins or apartments with different standards and prices, tent pitches, and separate pitches for motorhomes with the possibility of connecting to electricity. It is also possible to enter into long-term contracts that run for several years. The opportunities available for outdoor activities also vary from campsite to campsite.
The weather can also have an impact on people’s choice of holiday, and with improved meteorological models and flexibility in the employment relationship, the holiday can be planned so that the probability of “good weather” is greater than in the past. This can be a topic for followup research, although there may be problems related to data collection.
8. Contribution and Conclusions
Demand elasticities are helpful tools for tourist industry planning. Because there are significant fluctuations in the exchange rate, it is useful to understand the impact of this variable on tourist demand. This study was based on two countries that are important for the Norwegian tourist industry, namely Sweden and Germany. How income and currency changes affect camping tourism from Sweden and Germany to Norway has never been studied before.
Using available data, we calculated the currency and revenue elasticity of the inflows of camping tourists from these two countries. The analysis revealed that income had an impact on demand, but the effect was small. This was consistent with previous studies that reported that the demand for campsites was quite inelastic. This research suggested that a weaker Norwegian exchange rate stimulated demand for Norwegian campsites, but with a currency elasticity below 1.0. Furthermore, the result showed that a stronger Swedish currency relative to the euro had a positive influence on overnight stays at Norwegian campsites. The explanation was presumably that it led to more Swedes holidaying abroad and that there was complementarity between neighboring countries and Sweden.
Little research has been performed on camping tourism in Norway. Thus, little is known about what influences this type of tourism. When there is limited knowledge, there is a greater risk that the wrong investment decisions will be made. This may lead to the waste of the society’s resources. Our contribution expands the knowledge of what influences camping tourism and provides decision-makers with a better decision basis.


