
Assessment of the Financial Autonomy of Rural Municipalities


1
Faculty of Bioeconomy Development, Vytautas Magnus University, K. Donelaičio str. 58, LT-44248 Kaunas, Lithuania
2
Faculty of Informatics, Vytautas Magnus University, K. Donelaičio str. 58, LT-44248 Kaunas, Lithuania
*
Author to whom correspondence should be addressed.
Economies 2021, 9(3), 105; https://0-doi-org.brum.beds.ac.uk/10.3390/economies9030105
Submission received: 19 April 2021
/
Revised: 6 July 2021
/
Accepted: 7 July 2021
/
Published: 16 July 2021
(This article belongs to the Special Issue Economic Factors of the Development of Agricultural Markets and Rural Areas)
Abstract
:The present study demonstrates the possibilities for assessment of the financial autonomy of rural municipalities using the TOPSIS method. The study aimed to design and empirically verify the model for assessment of the financial autonomy of rural municipalities. As a result of the empirical study, an integrated system for assessment of the financial autonomy of rural municipalities was designed. The applicability of the TOPSIS method is demonstrated by the assessment of the financial autonomy of rural municipalities performed for two regions of Lithuania in the period 2009–2019. The empirical study showed that medium-low level of financial autonomy was characteristic of all the rural municipalities in the selected regions. On one hand, the findings suggested the presence of “convenient dependence” of the rural municipalities on the centralised allocation. On the other hand, they signalled the lack of the incentives for the rural municipalities to make use of the capacities and create sustainable, stable economic and social prospects.
1. Introduction
In the European Union member countries, regional and local objectives are implemented by the local government units (LGU), i.e., municipalities. Pursuant to the European Charter of Local Self-Government (1985), the municipalities have the right and ability to independently handle and manage a substantial share of public affairs by fully assuming their own responsibility and following the interests of the local residents. Financial autonomy of LGUs influences multifunctional development of the rural areas, which is one of the goals of the EU’s Common Agricultural Policy (CAP) (Głowicka-Wołoszyn and Satoła 2018).
The importance of autonomy assessment of LGUs is generally is indisputable if viewed from the financial perspective. Financial autonomy is the prerequisite of existence of a local government and the key factor of stable local development. Sustainable financial resources are the foundation of social and economic development in rural areas in particular (Satoła et al. 2019; Łuczak et al. 2018b). Hence, assessment of the level of financial autonomy of rural municipalities has recently become an increasingly important research topic from the economic and socioeconomic perspective. Financial autonomy (FA) is also the basic category assessed in the analysis of financial stability of LGUs (Satoła et al. 2019).
FA of LGUs is closely related to the economic, fiscal policy, fiscal decentralization, and regional development theories. This suggests the multidimensional character of the phenomenon described by a number of indicators. Assessment of revenue indicators of FA is important in FA assessment of rural municipalities, as the revenue indicators demonstrate different aspects of the FA level. The set of indicators used for the analysis of the same phenomenon of FA of rural municipalities differs from researcher to researcher (such as index of subnational autonomy (Shah 1994), composite indicator of fiscal autonomy (Beer-Tóth 2009); indicator of financial self-sufficiency (Kozera et al. 2017); self-financing index, fiscal autonomy index (Głowicka-Wołoszyn and Satoła 2018); fiscal wealth indicator (Satoła et al. 2019). As a result, different research studies often generate contradictory or, in certain cases, even incomparable findings. There is the lack of a single summarizing integrated indicator which would objectively show FA of the rural municipalities analyzed. Moreover, many discussions have emerged in relation to satisfaction of the needs of the rural areas, promotion of their local economic and social development, the amount of financial resources that should be allocated to the municipalities, and the methods of improvement of their FA level.
Viability of the multi-attribute assessment methods, which fall under the group of multi-criteria decision-making methods, has been particularly emphasized in the scientific literature as these methods enable integrated assessment of complex values. Due their versatility, the multi-attribute assessment methods may be employed when dealing with different areas, and are relevant in FA assessment of rural municipalities. The most appropriate method was chosen for analysis of the problematics of FA assessment of rural municipalities in view of the specifics and solution of the problem (namely, the theoretical principles of FA assessment and the assessment method for FA level of rural municipalities). The selection of the method was performed by describing the possible multi-criteria, multi-attribute decision making methods. TOPSIS (Technique for Order Preference by Similarity to Ideal Solution) is one of the multi-attribute methods appropriate for FA assessment as a multidimensional phenomenon. The scientific literature analysis has shown that this method is mostly used in the studies (Vavrek and Pukala 2019; Satoła et al. 2019; Głowicka-Wołoszyn and Satoła 2018; Kozera et al. 2017; Kozera and Głowicka-Wołoszyn 2016) involving FA assessment of rural municipalities. It should be noted that new indicators describing financial autonomy were added to the empirical study conducted by the authors of the present article. Unlike other empirical studies, linear normalization of rural municipalities revenue indicators was performed. The rural municipalities of two regions of Lithuania were first classified according to the constructed synthetic index of financial autonomy. In general, the TOPSIS method has enabled comprehensive and integrated FA assessment of the rural municipalities by using a single integrated, summarizing indicator.
This paper is structured as follows: Section 2 provides a literature review revealing the complexity of assessment of the financial autonomy phenomenon. It explores the relations between the phenomenon of financial autonomy of LGUs and the economic theories and evaluates the applicability of the multi-criteria assessment methods to assessment of the financial autonomy of rural municipalities. Section 3 describes the designed model for assessment of the financial autonomy of rural municipalities. Section 4 presents the research findings by demonstrating its applicability to assessment of the financial autonomy of rural municipalities in two regions of Lithuania. Section 5 provides the conclusions.
2. Literature Review
2.1. Relation between the Phenomenon of Financial Autonomy of LGUs and Economic Theories, and Complexity of the Assessment
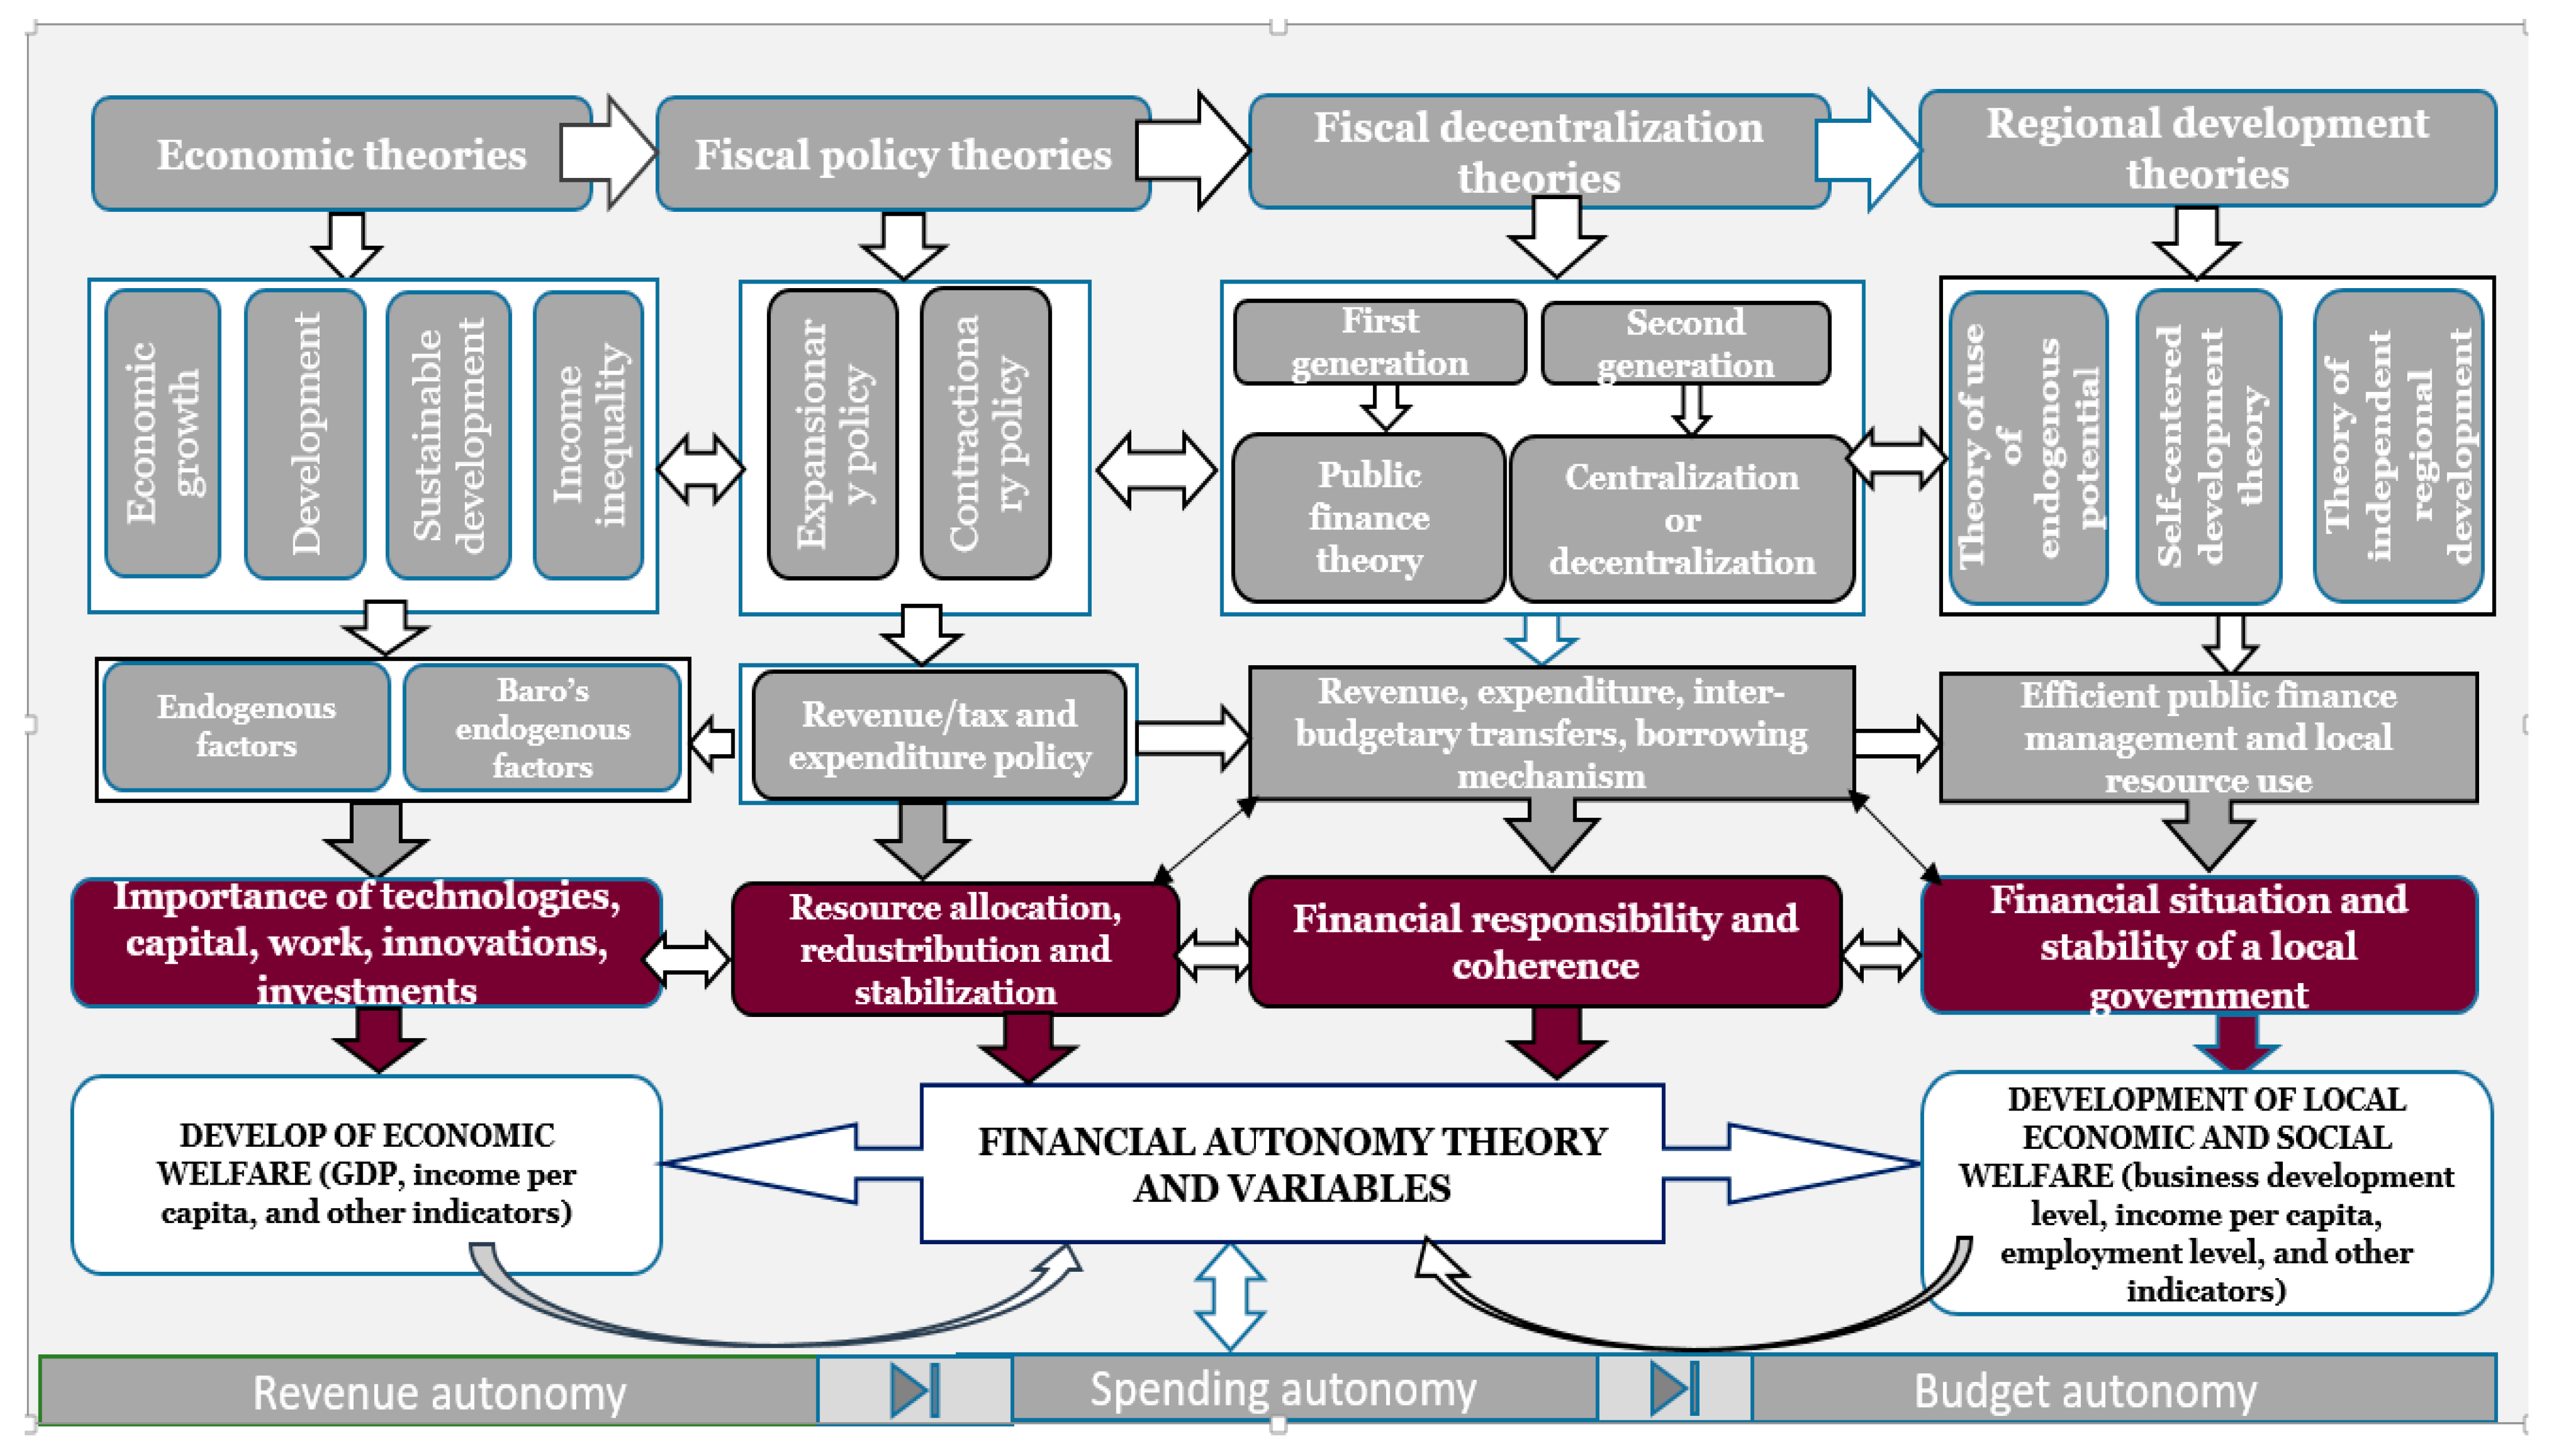
Financial autonomy (FA) is the term operated when referring to the complex, multidimensional economic phenomenon based on the economic, fiscal policy, fiscal decentralisation, and regional development theories, and is related to financial resource allocation, redistribution, and stabilisation. Several categories of economic theories could be recognized in the research studies on FA, such as theories on economic growth, sustainable development, inequality, incentive, limiting, centralisation, decentralisation, and regional development theories (see Figure 1). Hence, the theories and the categories thereof demonstrate the multidimensional character of FA of LGUs and the complexity of its assessment.
The economic theories related to growth and development enable the researchers studying the FA phenomenon to identify the endogenous factors that are important for improvement of the FA of LGUs. The researchers (Satoła et al. 2019; Standar and Kozera 2019; Głowicka-Wołoszyn and Satoła 2018; Łuczak et al. 2018b; Rudytė et al. 2018; Kozera et al. 2017; Scutariu and Scutariu 2015; Jemna et al. 2013) have not only listed a large number of the factors determining the FA of LGUs, but have also presented different classifications of these factors. Hence, an analysis of the FA factors with particular emphasis on the FA levels of the LGUs is also an important research topic from the economic and social perspective (Standar and Kozera 2019).
The scientific literature analysis has demonstrated that the FA of LGUs depends on the revenues received/earned and rational expenditure management. This is the essence of the (incentive and limiting) fiscal policy theories related to the key measures. The latter include tax revenue received by the state in the form of taxes from natural persons and companies, and the state expenditure that, if properly allocated, enhances the domestic economy. According to Salm (2014), the features of a rational local tax system are based on the decentralization theory. While every tax is required to follow rational criteria, such as economic efficiency and ease and cost of administration, local taxes shall also meet a few additional criteria, such as fiscal autonomy and balance of interest, which specifically apply to the local level.
In FA assssment of LGUs, the majority of researchers usually focus on the revenue autonomy, giving less attention to the expenditure autonomy. The researchers (Satoła et al. 2019) have emphasised that identification of the sources of revenue, which could be deemed as the FA drivers, presents a considerable challenge. Financial autonomy and the issue of revenue generation are one of the key issues related to local governments worldwide. According to Hajilou et al. (2018), municipalities become unsustainable due to the absence of a comprehensive approach towards implementation of the autonomy policy, sources of revenue of the financial sector, municipalities, and macroeconomic system in the area of changes and interventions. Hence, along with FA, financial sustainability is becoming one of the most widely used terms and is associated with John Hicks’ notion of maximum income. This means that assessment of revenue autonomy, where the researchers (Satoła et al. 2019; Standar and Kozera 2019; Głowicka-Wołoszyn and Satoła 2018) place the strongest emphasis on the level of own revenues, plays a significant role where the FA of LGUs is addressed. Nonetheless, the FA of LGUs does not necessarily imply that implementation of local public tasks would only be limited to the duty of autonomous funding. Following the fiscal policy principles, with the own (tax and non-tax) revenue being inadequate, the central government allocates funds on the basis of grants in order to assure implementation of public tasks. Nevertheless, where public funds account for a substantial share of budget revenue of the municipality, there are considerable limitations of the freedom of use of the financial resources (Oulasvirta and Turala 2009). Hence, the local government becomes highly dependent on the funding from the state budget, considerably affecting the FA of LGUs.
As evidence suggest, transfers induce municipalities to underutilize their own tax bases (Shah 1994). This raises the issue of “convenient dependence” of municipalities on the centralized allocation in the long run. The researchers (Satoła et al. 2019; Hajilou et al. 2018; Jakovljevic et al. 2019; Jakovljevic 2013) have therefore made attempts to validate the need for a sustainable LGUs funding system. The rationale behind this kind of system is that the financial resources received by LGUs correspond to the expenditure incurred by them in implementation of their tasks. This depends on the optimum degree and scope of fiscal decentralisation reflecting rational management of public funds. Shah (1994) argues that the decentralization of responsibilities and the rationalization of intergovernmental transfers should be supported by strengthening local institutional capabilities.
In the scientific literature, financial autonomy is often mentioned in the context of research of financial decentralisation (Beer-Tóth 2009). The theories of fiscal decentralisation identify the interacting elements which link the components of fiscal autonomy, namely, revenue, expenditure, and budget autonomy of LGUs, to each other. Hence, the FA research have been contributing significantly to the theory and practice of fiscal decentralisation in the recent decades and are becoming the focus of the researchers, supranational organisations, policy makers, and economists. This is supported by the results of the studies conducted by the majority of the researchers analyzed (Satoła et al. 2019; Vavrek and Pukala 2019; Głowicka-Wołoszyn and Satoła 2018; Ladner and Keuffer 2018; Kozera et al. 2017; Kozera and Głowicka-Wołoszyn 2016; Psycharis et al. 2016; Cigu 2014; Jemna et al. 2013; Beer-Tóth 2009), demonstrating the importance of FA of LGUs as an individual, remarkable, and complex phenomenon.
The phenomenon of FA of LGUs and the determining factors are closely related to the theories of regional growth and development. From the perspective of the local governance processes, the theories of use of the regional endogenous (internal) potential are highly important, as they define the internal factors that determine the FA level of LGUs (Standar and Kozera 2019). If viewed from the perspective of the economic theories of self-oriented and independent regional development, LGUs would be expected to be more autonomous and make use of their internal potential. It has been found in the series of studies that the character of the Lithuanian fiscal policy is determined by political limitations. This situation suggests that the fiscal policy measures employed in Lithuania are not yet sufficiently directed at formation and assurance of sustainability of public finance. This obviously has an impact on the autonomy of a local government as well as development of its inner financial potential (Skauronė et al. 2020). Hence, empirical studies are needed in order to explore the financial situation and capacities of LGUs.
A lack of an integrated approach towards the analysis or assessment of the differences between the Lithuanian municipalities and, in particular, rural municipalities in terms of financial autonomy has been observed. In the international research domain, researchers (Satoła et al. 2019; Standar and Kozera 2019; Głowicka-Wołoszyn and Satoła 2018) generally agree that there is the lack of assessment of the differences between LGUs of a specific country in terms of FA. They have stressed the need for such research as well as for innovation in development of public finance theories.
Hence, the background analysis has shown a diversity of the contexts of FA studies suggesting the multidimensional nature of the phenomenon (revenue, spending, budget autonomy) by assessing the allocation, redistribution and stabilization functions, and emphasizing the value of FA and sustainability. Analysis of the previous empirical studies has revealed that the researchers employ different number of indicators for FA assessment (see Table 1). This reveals the complexity of assessment of this economic phenomenon.
It has been generally suggested in the scientific literature that the complexity and multidimensional character of the phenomenon analyzed determine the choice in favor of multi-criteria methods for FA assessment of rural municipalities.
2.2. Analysis of the Multi-Criteria Methods and Selection of the Most Appropriate Method for FA Assessment of Rural Municipalities
The scientific literature analysis has shown that the FA level of LGUs is usually assessed using the Multiple Objective Decision Making (MODM) methods classified as the multi-criteria decision making methods. The scientific literature analysis has revealed that the multi-criteria methods are applicable to both exact and social sciences universally. These methods have been observed to be widely used for assessment of the economic phenomena in Lithuania.
The FA phenomenon is multidimensional; therefore, multiple objective methods are used, as they help analyse the alternatives that belong to the infinite set of solutions. In view of the specifics of the implications pertaining to the empirical study, first, comparison of the multi-criteria decision analysis methods was performed and enabled the authors of the paper to identify the most appropriate FA assessment method (see Table 2).
Based on the comparison analysis of the multi-criteria methods, TOPSIS (Technique for Order Preference by Similarity to Ideal Solution) method, which showed the most favorable assessment result, was selected for the design of the methodology for empirical study of FA assessment of rural municipalities. According to Łuczak et al. (2018a), this method is referred to as the benchmark method in the international practice.
The TOPSIS method is based on Hellwig’s idea of construction of a synthetic property. It enables synthetic assessment of a phenomenon with multiple properties (Hwang and Yoon 1981).
The rationale behind the choice of TOPSIS methods is generally based on the fact that this method:
- is the most widely and frequently (30%) applied for assessment of the majority of phenomena, activities, compared to other methods (AHP—20%; VIKOR—6.67%, ELECTRE—16.67%; other methods—10%) (Aruldoss et al. 2013);
- is applicable to dealing with economic, financial issues in international practice;
- has been employed in the most recent empirical studies assessing FA of LGUs and, in particular, rural municipalities (Vavrek and Pukala 2019; Satoła et al. 2019; Standar and Kozera 2019; Łuczak et al. 2018a; Łuczak et al. 2018b; Głowicka-Wołoszyn and Satoła 2018; Kozera et al. 2017; Kozera and Głowicka-Wołoszyn 2016).
3. Methodology
The process of design of the FA assessment model for rural municipalities started with problem definition, substantiation of the research period, definition of the data, limitations, and sampling.
Problem and research period. The problem under the investigation was defined in the form of the following question: How could the FA level of rural municipalities be assessed? FA assessment of rural municipalities is important as it leads to solutions of development of economy and social welfare of rural municipalities, sustainable allocation, redistribution and growth of financial resources. It also pinpoints the need for new scientific insights into this economic phenomenon in the areas of the economic, fiscal policy, decentralisation, and regional growth theories.
The studies dedicated to FA assessment of rural municipalities tend to apply the longest assessment period possible. The reason behind this is that the econometric research methods used for assessment of data for a longer period tend to generate more accurate research results.
Data and limitations. Any research starts with data collection, gathering and systematisation. FA assessment of rural municipalities required using statistical data for calculation of the revenue and expenditure autonomy indicators. The limitations affecting appropriateness, validity, and correctness of the indicator calculation and determining database selection and data normalisation decisions were identified in the study.
Sample selection. The analysis of scientific and regulatory sources suggested clear absence of a definition of “rural municipalities”. Scientists and researchers (Kriaučiūnas 2018; Horlings and Marsden 2014; Normann and Vasström 2012; Žukovskis et al. 2013; Ward and Brown 2009; Atkočiūnienė 2008; Vidickienė and Melnikienė 2008) mostly analyse the definitions of “rural areas”, “rural regions”, “countryside”, and “rural communities”. Lithuania does not have any officially recognized classification of regions into rural and urban. The criteria for identification of rural regions remains under the theoretical scrutiny not only in Lithuania, but also worldwide (Copus and Macleod 2006; Mueller et al. 2004; Kostov and Lingard 2004). The scientific literature analysis has shown that the issue of delineation of urban and rural areas is generally a fairly complex scientific issue.
Hence, the design process for the model of FA assessment of rural municipalities followed the methodology proposed by the Organisation For Economic Co-operation and Development. The methodology employs three-fold classification of municipalities as rural, semi-rural, or urban. Quantitative boundaries were proposed for definition of rural municipalities under the methodology, where:
- the municipalities with more than 50% of the population living in the rural type residential areas were considered to be rural municipalities;
- the municipalities with 15 to 50% of the population living in the rural residential areas were attributed to semi-rural municipalities.
Based on the above criteria of the quantitative boundaries, the group of rural municipalities could be formed in order to reflect the set of alternatives A = (A1, A2, A3, ... Ai....Am).
Model design stages. The assessment model based on the multi-criteria TOPSIS method was designed for FA assessment of rural municipalities. The following model design stages could be identified:
Stage 1. Selection and calculation of the partial indicators describing FA of rural municipalities.
Stage 2. Assessment of FA level of rural municipalities and formation of the synthetic indicator/index.
Process of stage 1.
Step 1. The model design process primarily involved identification of the revenue autonomy indicators defining the FA of rural municipalities, the revenue autonomy being one of the distinctive properties of FA of a rural municipality. Hence, the set of revenue autonomy indicators was formed: R = (r1, r2, r3, …, rn). The revenue indicators assessing FA of rural municipalities were selected according to the following criteria:
- The indicators had been used by more than one author in their studies (Vavrek and Pukala 2019; Satoła et al. 2019; Standar and Kozera 2019; Łuczak et al. 2018a; Łuczak et al. 2018b; Głowicka-Wołoszyn and Satoła 2018; Kozera et al. 2017; Kozera and Głowicka-Wołoszyn 2016).
- Statistical data collected and published periodically were available for calculation of the indicators.
Step 2. Direction, i.e., minimization or maximization, was determined for each indicator.
Step 3. The sets of n indicator values of rural municipalities, each containing m elements, were created in Excel database (all the calculations were performed using this tool) in accordance with the registration year of the revenue indicator values for the FA of the rural municipalities (2009–2019). Decision matrices were formed using the data sets (Simanavičienė 2011):
Step 4. The objective significance of the indicators was then determined using the entropy method. The entropy method is applicable in the cases where maximization is required for all the indicators of the decision matrix. In case the decision matrix contained the indicators that required minimization, they were rearranged using the following formula (Simanavičienė 2011):
Values of the indicators that required maximization remained unchanged:
The rearranged decision matrix was formed in the following way:
Step 5. It should be noted that assessment of multi-criteria phenomena using the TOPSIS method employ the indicators that have different units. Hence, prior to any calculations (alternative ranking procedure), the data must be transformed to align the dimensions of the variables. Linear, non-linear, and vector transformations may be used for normalization of the indicators. The possibilities for normalization are very diverse, and the rules of six formulas can be applied (Simanavičienė 2016).
The set of revenue indicators defining the FA of rural municipalities included highly asymmetric or outlying properties caused by differences in the units used. Consequently, the decision matrix was normalized (to make sure that all of its elements were dimensionless values) by applying two methods. For the revenue indicators determined under the objective significance principles, normalization was performed using the linear normalization formula (Simanavičienė 2011; Ginevičius and Podvezko 2008):
The researchers (Simanavičienė 2011, 2016; Ginevičius and Podvezko 2008; Podvezko 2008) often propose applying vector normalization using the following formula:
The normalization method generally depends on the circumstances of the research and possibilities for minimization or maximization of the indicators. Hence, linear normalization was performed primarily in order to empirically verify the applicability of the FA assessment model to rural municipalities. The task was then solved by vector normalization after the research results had been obtained and assessed. Afterwards, comparison of the empirical study results was performed.
Following the normalization, the matrix of normalized values of the revenue indicators was develope (Simanavičienė 2011):
Step 6. Entropy level Ej of each revenue indicator was determined using the following formula (Simanavičienė 2011):
The value of entropy varied within the interval ; hence, 0 the variation level of j-the indicator was determined by calculating the revenue indicators:
The study did not employ any subjective (expert’s) assessment of the indicators, and the decision was made to consider all the FA indicators of rural municipalities as equally important. Hence, objective significance of the revenue indicators was determined using the following formula (Simanavičienė 2011):
where: —the values of objective significance of indicators.
The calculated values of objective significance of the revenue enabled the authors to determine the significance and importance of the indicator in the empirical study. Researchers usually suggest eliminating the indicators that are insignificant for the research upon consideration of significance of the respective indicator.
It should be noted that, where individual FA indicators are analyzed, only single-dimension profile research for the type analyzed may be performed and may cause difficulties in formulation of general conclusions (Głowicka-Wołoszyn and Satoła 2018). Hence, during the second stage of the model design, a synthetic indicator/index for FA assessment of rural municipalities was developed using the partial indicators by applying the TOPSIS method (Hwang and Yoon 1981).
Process of stage 2.
Step 1. Distance of each rural municipality to the positive and negative ideal decision was calculated. Under the TOPSIS method, the coordinates of the positive, i.e., ideally best (A+), and negative (A−) ideal points helped determine closeness of each rural municipality to the development model (A+) and opposite negative model (A−).
Positive, ideally best, and negative ideal points were calculated (see Formulas (12) and (13)).
Positive, ideally best point was calculated using the formula (Hwang and Yoon 1981; Simanavičienė 2011):
where: j—set of indices of the indicators with higher values as a more preferable option; j’—set of indices of the indicators with lower values as a more preferable option. Negative ideal variant was determined using the following formula (Simanavičienė 2011):
Step 2. Following the calculation of the positive, ideally best, and negative ideal variant, it became possible to determine the closeness of each rural municipality to the positive ideal solution of development () and negative ideal solution () in the n-dimensional Euclidean space under the formula (Hwang and Yoon 1981; Simanavičienė 2011):
Step 3. The final step of the TOPSIS method (Hwang and Yoon 1981) involved determination of the value of synthetic indicator/index of FA of each rural municipality. The index was mathematically expressed by the formula (Hwang and Yoon 1981; Ginevičius and Podvezko 2008; Simanavičienė 2011):
where: Ki—value of the i-ths alternative generated by assessment under the TOPSIS method, with the highest Ki value corresponding to the best alternative.
—total closeness of the i-ths alternative to the ideally best variant;
—total closeness of the i-ths alternative to the ideally worst variant.
Step 4. The determined synthetic indicator/index values were rearranged in a linear manner and became the basis for grouping of the municipalities into typological classes by the FA level (Satoła et al. 2019; Łuczak et al. 2018b). The typological classes/clusters of rural municipalities were determined in view of the mean indicator value ( and standard deviation (S) (see Table 3).
In general, the following components could be identified in the methodology for design of the FA assessment model for rural municipalities:
- problem formulation (definition of the problem, gathering of database and information);
- problem solving consisting of the steps comprising the first stage (decision making, formulation of the task) and second stage (task solution using the TOPSIS method) of the model design process;
- decision making in relation to the problem (interpretation of the results generated and formulation of the general conclusions).
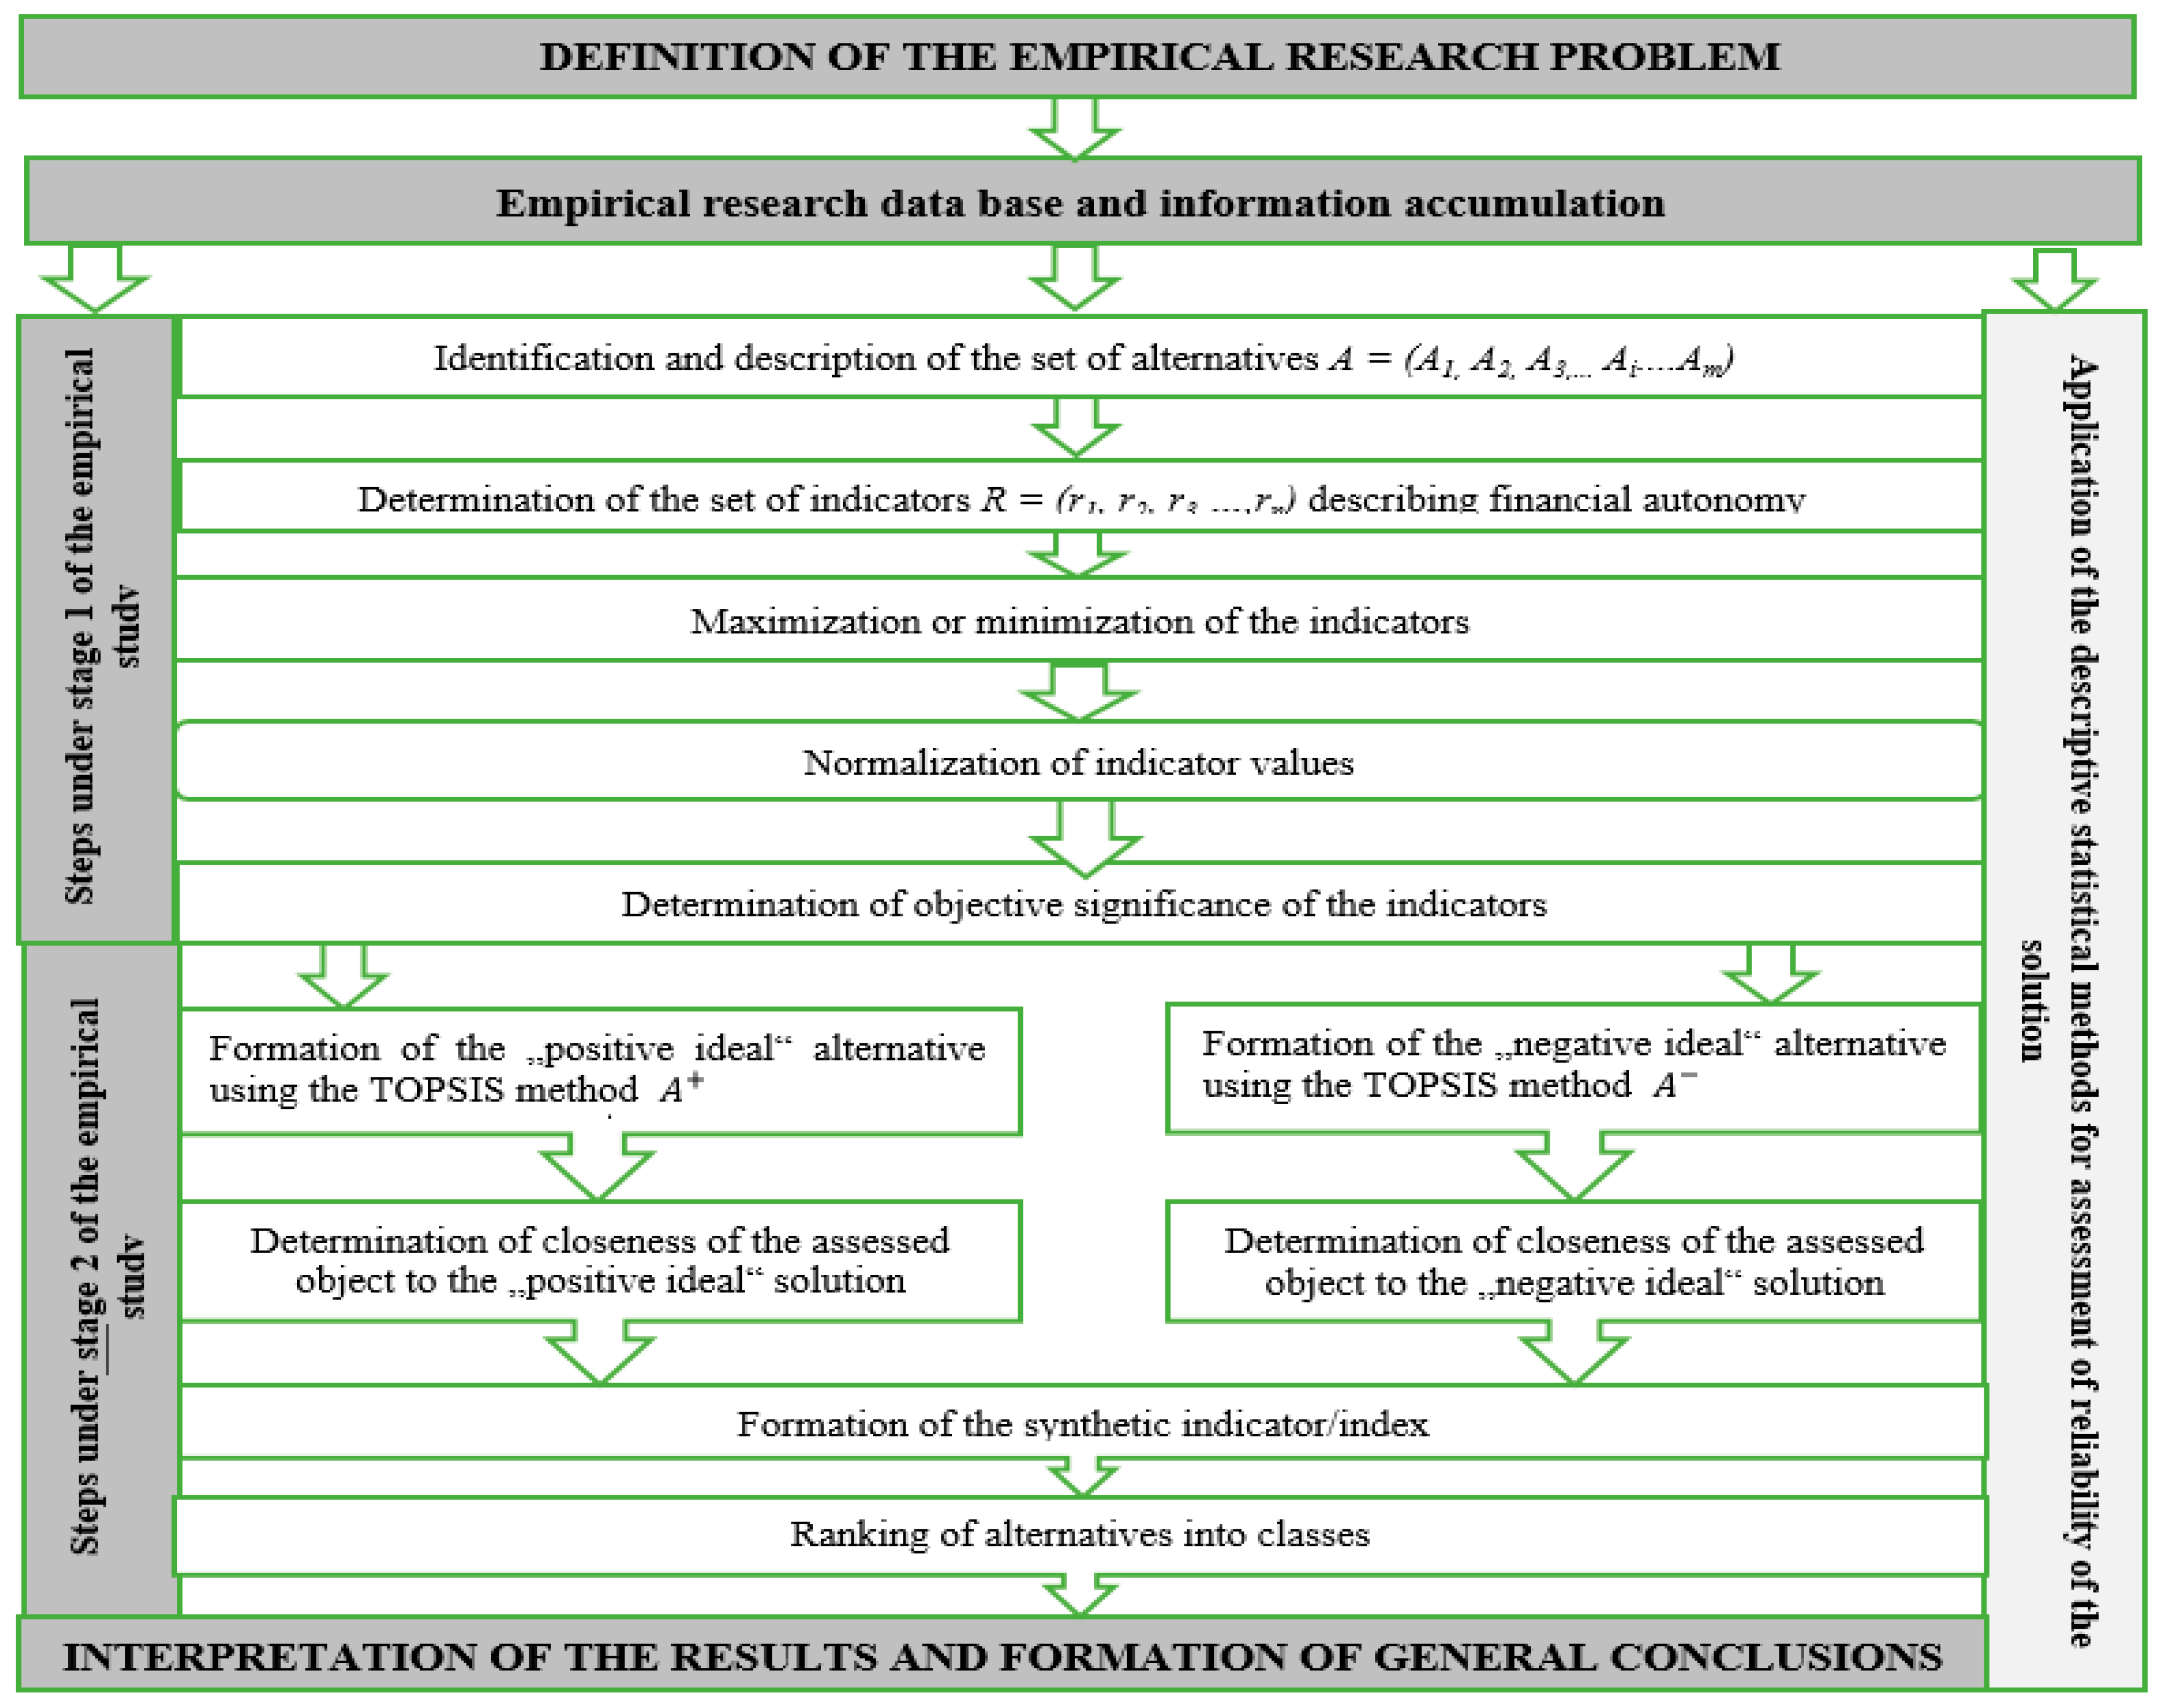
Depending on the specifics of the research problem and possibilities for application of the multi-criteria TOPSIS method, the model for FA assessment of rural municipalities could be summarized schematically (see Figure 2).
The decomposition of the model into main components does not necessarily imply that the problem indicators will not be revised or the problem solution part will not be revisited after definition of the problem and the related variables (indicators) or before the decision making part. Analysis of the problem could actually be repeated multiple times using an expanded the set of alternatives, including new variables, revising the research stages and limitations, verifying the reliability of application of the methods of descriptive statistics, until the most appropriate solution is reached.
Application of the designed model was demonstrated further in the present research by performing the FA assessment of rural municipalities in the regions of Lithuania.
4. Results and Discussion
Upon Lithuania’s accession to the EU, particular focus was placed on rural areas and rural municipalities, representatation of their interests, and their financial autonomy. The issues of rural areas have been emphasized in the EU’s and national documents, the ideas expressed and assessments made by policy makers and economists. This particularly relates to the issue of low financial autonomy thereof. This topic is noticeably becoming increasingly relevant on the national level, as rural municipalities account for the two thirds of Lithuania’s territory and 60% of all the municipalities.
During the empirical study, a group of 36 rural municipalities was formed from Lithuania’s 60 municipalities. However, in the present pilot study, the rural municipalities of Panevėžys and Kaunas were chosen to assess their FA levels. The set of possible alternatives consisted of 5 rural municipalities of Panevėžys region (Biržai—A1, Kupiškis—A2, Panevėžys—A3, Pasvalys—A4, Rokiškis—A5 district municipalities) and 4 Kaunas region municipalities (Kaišiadorys—A6, Kaunas—A7, Prienai—A8, Raseiniai—A9 district municipalities). The resulting set of alternatives: A = (A1, A2, A3, A4, A5, A6, A7, A8, A9).
The choice of rural municipalities of the specific regions was prompted by certain economic and social changes that were challenging for the majority of Lithuania’s regions. Nonetheless, distinctive changes were observed in the chosen regions in relation to their demographic and socioeconomic potential, and even greater differences between individual municipalities were noticed.
Over the preceding eleven years, the population of Panevėžys region had decreased by almost 25%, while the birth rate had decreased by 22% (Department of Statistics of the Republic of Lithuania 2020). This was one of the greatest drops among Lithuania’s counties. The demographic changes affected the supply of labour force in the region, posed risks to the economic development of the region, impaired region’s attractiveness to foreign investments and, at the same time, financial development of the rural municipalities. In Panevėžys region, rural municipalities comprised the major part of the territory (5 of 6).
The modern character of Kaunas region was provided by the advanced economic development that assured high quality of life and rapid modernisation of the countryside with particular focus on the harmony between the human and the environment. This guaranteed sustainable development of the region (The Regional Development Department under the Ministry of the Interior of the Republic of Lithuania 2020). For example, over the preceding 11 years, population increase by 11.7% and an increase in business concentration, which was considerably lower in other rural municipalities, were observed in the rural municipality of Kaunas district [the Department of Statistics of the Republic of Lithuania].
The present research involved the data analysis and assessment covering the 11-year period, i.e., 2009 to 2019. The period specified is associated with the recently growing interest in not only local economic growth and regional development, but also improvement of the FA of municipalities. Extension of the period would be considered following the assessment of the results of the pilot study.
The FA of the alternatives chosen in the empirical study was defined from the perspective of revenue autonomy; hence, nine revenue indicators were primarily selected on the basis of specific criteria (see Table 4). In relation to maximization and minimization of the revenue indicators, it was assumed that, in the case considered, indicator R8—state financial intervention indicator, indicator R9—transfers per capita, EUR had a minimizing character (a dampening effect on the FA), and all other indicators had a maximizing character (a driving effect on the FA). The lowest value of the minimizing indicator was its best value. The set of indicators was formed: R = (r1, r2, r3, r4, r5, r6, r7, r8, r9).
The study involved identification of the limitations affecting appropriateness, validity, and correctness of the indicator calculation, and determining the decisions on database selection.
1. Pre-2014 data are presented in the former national currency litas, while post-2014 data—in euros. The data reflect the municipal tax and non-tax revenues and grants. The data are published in the statistical databases of the Ministry of Finance of the Republic of Lithuania (2020) and State Tax Inspectorate under the Ministry of Finance of the Republic of Lithuania (2020) (hereinafter—the STI). Due to the difference in the currency, the data were recalculated to be presented using a single currency. This enabled further comparative analysis of the indicators. Nevertheless, certain calculation inaccuracies could have appeared as a result of the recalculation.
2. The databases (reports) by the Ministry of Finance of the Republic of Lithuania (2020) contained predicted rather than actual municipal tax and revenue data, which also could have led to certain calculation inaccuracies. This could have also influenced objective assessment of the FA of the municipalities;
3. The predicted and actual municipal revenue data are provided in the reports available in the archive databases of the STI. Nevertheless, the greatest challenge is presented by the presentation of the data on the personal income tax (hereinafter—the PIT). The latter is determined by the procedure of PIT allocation to municipalities governed by the Law on the Approval of Financial Indicators of the State Budget and Municipal Budgets. Pursuant to the procedure:
3.1. before 2017, the municipal budget revenues from PIT consisted of the transfers of tax instalments from the STI and grants from the state budget;
3.2. from 2017, the municipal budget revenues from PIT consisted of the transfers of tax instalments from the STI in accordance with the tax allocation share (%) established by the law, including the grants from the state budget and excluding the amounts transferred into the state budget.
Considering the above limitation determining the level of accessibility, validity and objectivity of the empirical research data, it was decided to use the statistical data available in the databases of the Department of Statistics of the Republic of Lithuania (2020). Actual data of the municipal revenues (taxes) were presented in the databases of the Department of Statistics of the Republic of Lithuania and corresponded to the data presented in the reports on implementation of the municipal budget. Moreover, the data for all the years of the research period were accurately recalculated/expressed in euros, and the PIT included all the final transfers from the STI.
Descriptive characteristics of statistics revealed the tendencies of financial autonomy in rural municipalities of two regions of Lithuania during the analyzed 11-year period from 2009 to 2019 (see Table 5 and Table 6).
The change of PIT per capita differed by 2.67 times (Panevėžys region) and 2.57 (Kaunas region) between the municipalities. This suggests that allocation of the PIT could have been different for each rural municipality and did not encourage the less affluent municipalities to undertake the measures to increase it. This may have been due to the fact that competition for the tax is a slow acting instrument.
The share of own revenue per capita showed that the difference between the less affluent and affluent municipalities was 2.9-fold (Panevėžys region) and 2.8-fold (Kaunas region). On the other hand, high value of the indicator (EUR 754.66) was registered in only one rural municipality of Panevėžys region, while the median of own revenue per capita was EUR 360 (in rural municipalities of Panevėžys region) and EUR 365 (in rural municipalities of Kaunas region).
The share of own revenue in the total revenue (1st degree financial autonomy indicator, %) had an upward trend, increasing by 46 percentage points on average in the rural municipalities of Panevezys region and by 52 percentage points in the rural municipalities of Kaunas region.
The results support the importance of the transfers into the revenue structure of rural municipalities and, at the same time, high dependence of the local governments on the state budget, signalling unfavorable conditions for the development initiatives, multifunctional growth, or progress in local self-regulation.
Hence, the research results have revealed that the redistribution function of the fiscal policy in Lithuania was defective and did not promote financial autonomy and economic well-being of municipalities in the analysis period. This was due to the fact that support was granted to the weaker municipalities, and they received larger amounts of the redistributed PIT. If not for the redistributed PIT, the municipalities making active efforts to attract investors and help create jobs would have retained more funds.
To group the rural municipalities of the selected regions into classes by FA level, the multi-criteria decision-making task was solved using the TOPSIS method.
The sets of values of each indicator, each containing 11 elements, were formed in the Excel database according to the years of the respective values of the revenue indicators (2009–2019). Eleven solution matrices were formed on the basis of the data for each selected alternative, i.e., the respective rural municipality. The revenue indicators were expressed in different units, i.e., either euros or %, and were primarily subjected to normalization. As a result, the indicator values became dimensionless. Given that the revenue indicators had been determined under the objective significance principles, normalization of the indicators was performed on the basis of the linear method. Values of the normalized indicators were further used in the subsequent FA assessment of the rural municipalities.
Objective significance of the revenue indicators was determined using the entropy approach involving assessment of the level of variation and weight of each indicator (see Table 7).
Assessment of the revenue indicators for the FA of rural municipalities of Panevėžys and Kaunas regions revealed the fluctuation in their variation level. Fluctuating and changing variation level of the FA indicators of individual rural municipalities was observed in Panevėžys and Kaunas regions in the assessment period.
Upon calculation of the objective significance values of the revenue indicators of rural municipalities in the regions analyzed, the indicators with the greatest weights were identified: non-tax revenues per capita, EUR. (r7), PIT per capita, EUR (r1), own revenues per capita, EUR (r4), indicator of the level of own revenues, % (r5), and fiscal wealth index or tax revenues per capita, EUR (r2). The result showed that the indicators of the rural municipalities became more significant in terms of their variation in the assessment period. However, insignificant variation was also observed for certain indicators. The indicators of the first-degree FA or the share of own revenues in the total revenues, % (r6) became particularly distinctive for all the rural municipalities analyzed. Hence, it could be concluded that the share of own revenues in the overall revenue structure of the municipalities varied insignificantly, which also supported the minor changes in the FA levels of the municipalities. It could therefore be claimed that the FA of the rural municipalities analyzed remained medium low.
The weights of significance of the FA indicators of the rural municipalities in Panevėžys and Kaunas regions (see Table 8) were used further for the calculations of stage II of the empirical study using the TOPSIS method. The values of synthetic indicator/index of the FA of rural municipalities in the assessment period are presented in Table 8.
The results of assessment of the FA level of rural municipalities using the TOPSIS method suggested relative closeness of the “best” rural municipalities in Panevėžys and Kaunas regions to the “ideally worst” variant, which remained constant over the years. For example, the first alternative—Biržai district rural municipality of Panevėžys region—maintained the first position in terms of the closeness to the “negatively ideal” variant in the assessment period 2009–2019. The same result was observed for Kaunas district rural municipality of Kaunas region, which also maintained the first position in the period 2009–2019. However, the relative closeness of all other rural municipalities to the “ideally worst” variant fluctuated over the years (see Figure 3).
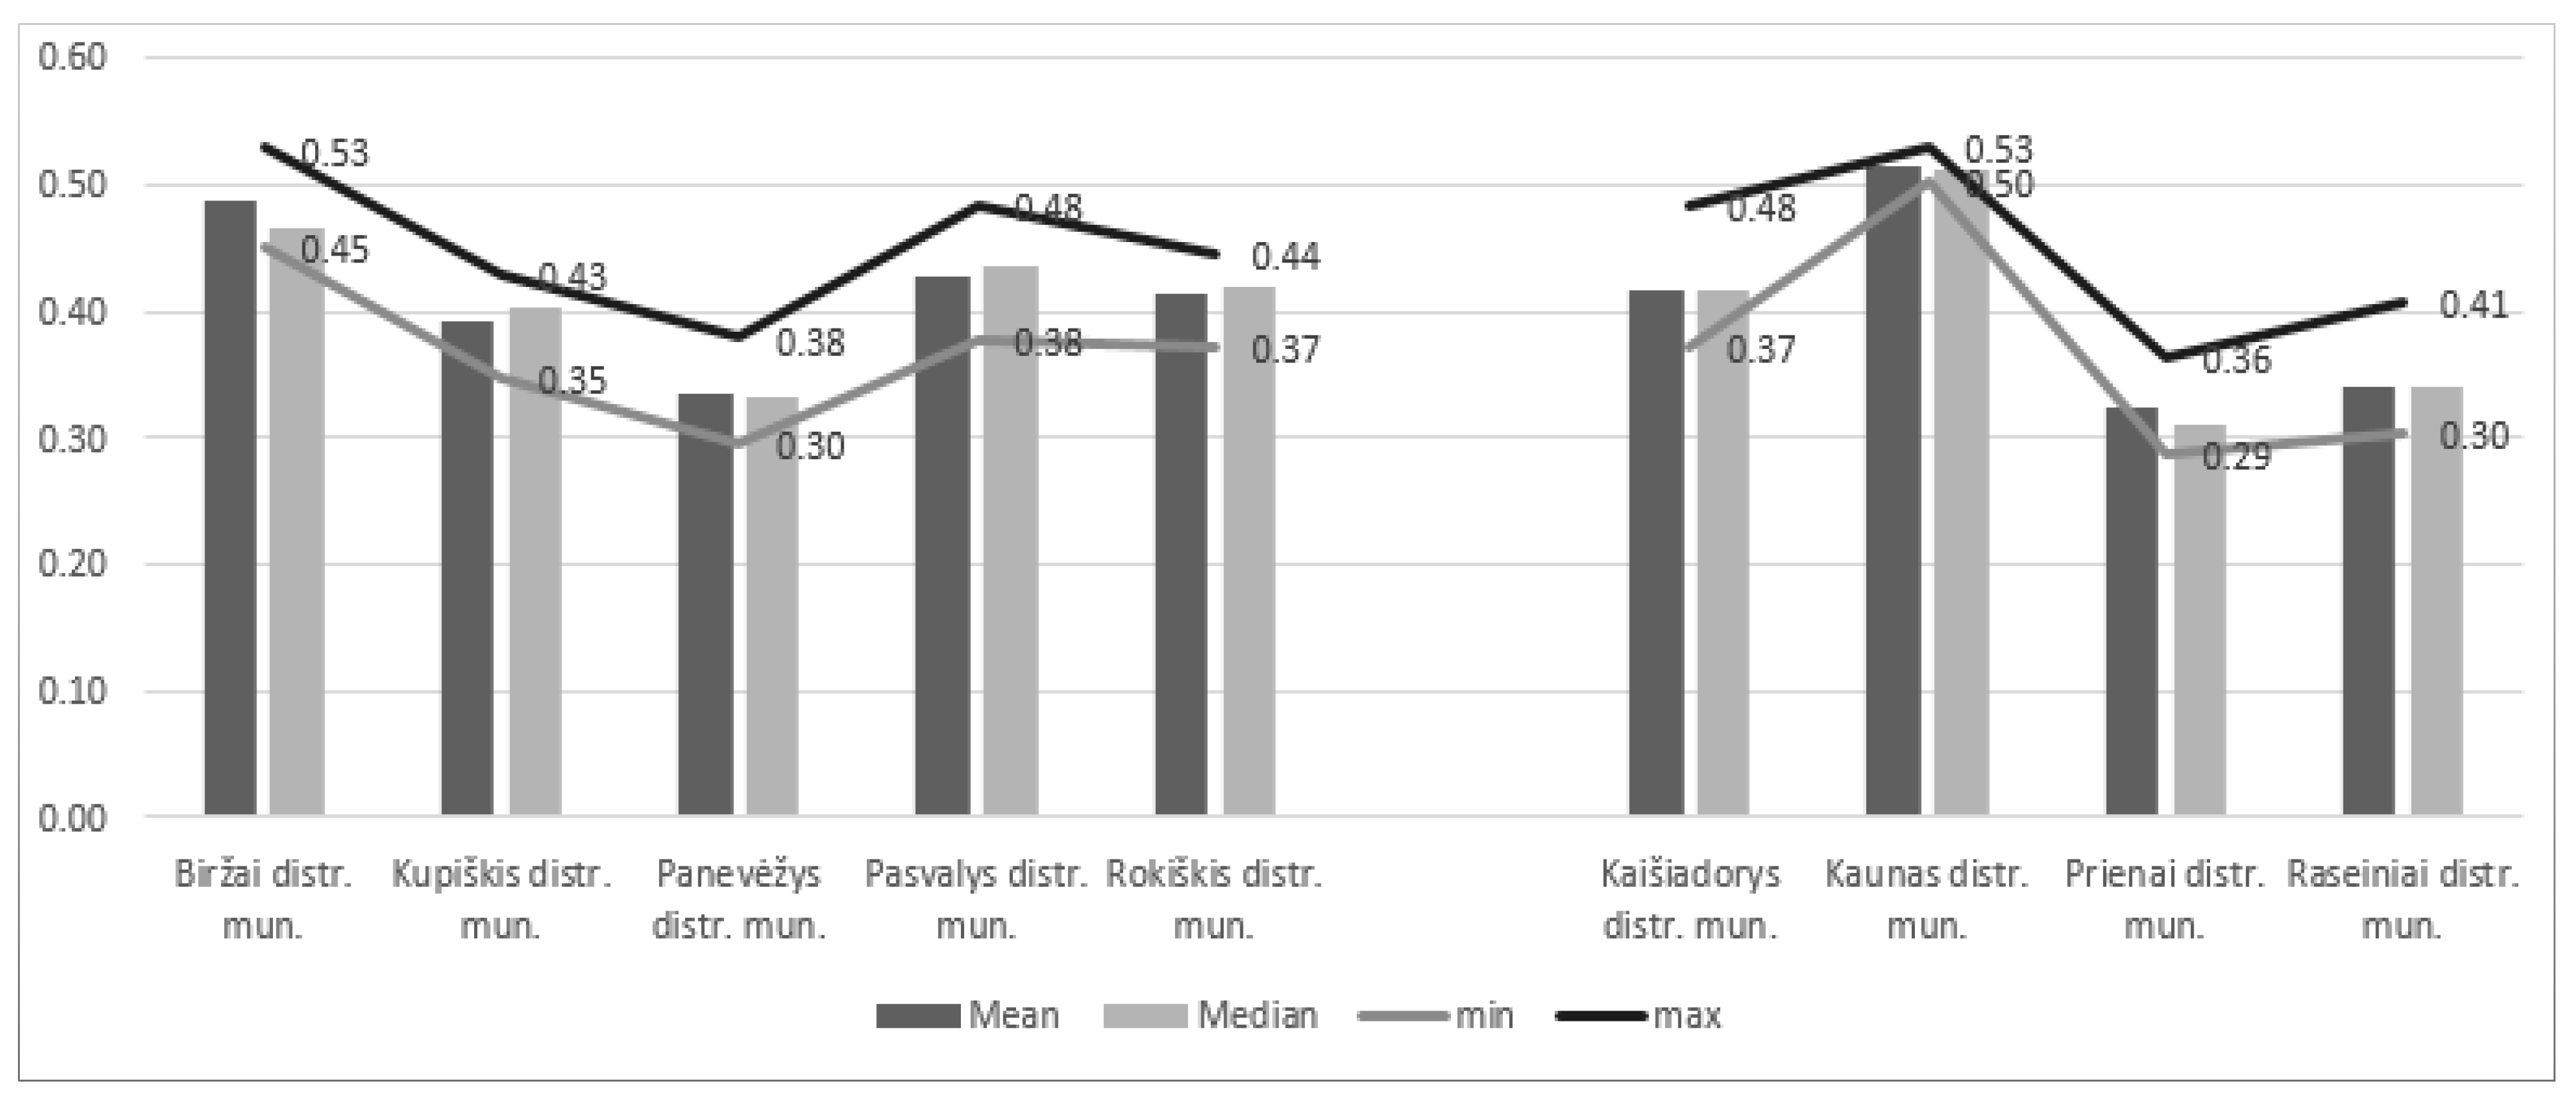
The figure shows the change of the priority of the rural municipalities over the years. However, Table 8 and Figure 3 do not suggest which of the alternatives, i.e., rural municipalities, was the top alternative in terms of the FA level. To obtain a measurable result, the mean, median, minimum and maximum rationality values of the FA level of rural municipalities were calculated (see Figure 4).
The priority order of the alternatives, i.e., rural municipalities, by mean values of the FA level was formed: A7 > A1 > A4 > A6 > A5 > A2 > A9 > A3 > A8.
The last step in the empirical study involved grouping of the rural municipalities of the selected regions into typological classes by the mean values of the synthetic indicators/indices of their FA levels. The results calculated using the TOPSIS method and the descriptive statistics methods of the mean and standard deviation were used as the basis for identification of the 4 types of the FA levels of rural municipalities in the selected regions. 4 typological classes of rural municipalities were identified in accordance with the FA levels (high, medium high, medium low, and low) based on Table 3. The rural municipalities of the selected Panevėžys and Kaunas regions fell into the typological class of medium low level by their FA level (see Table 9).
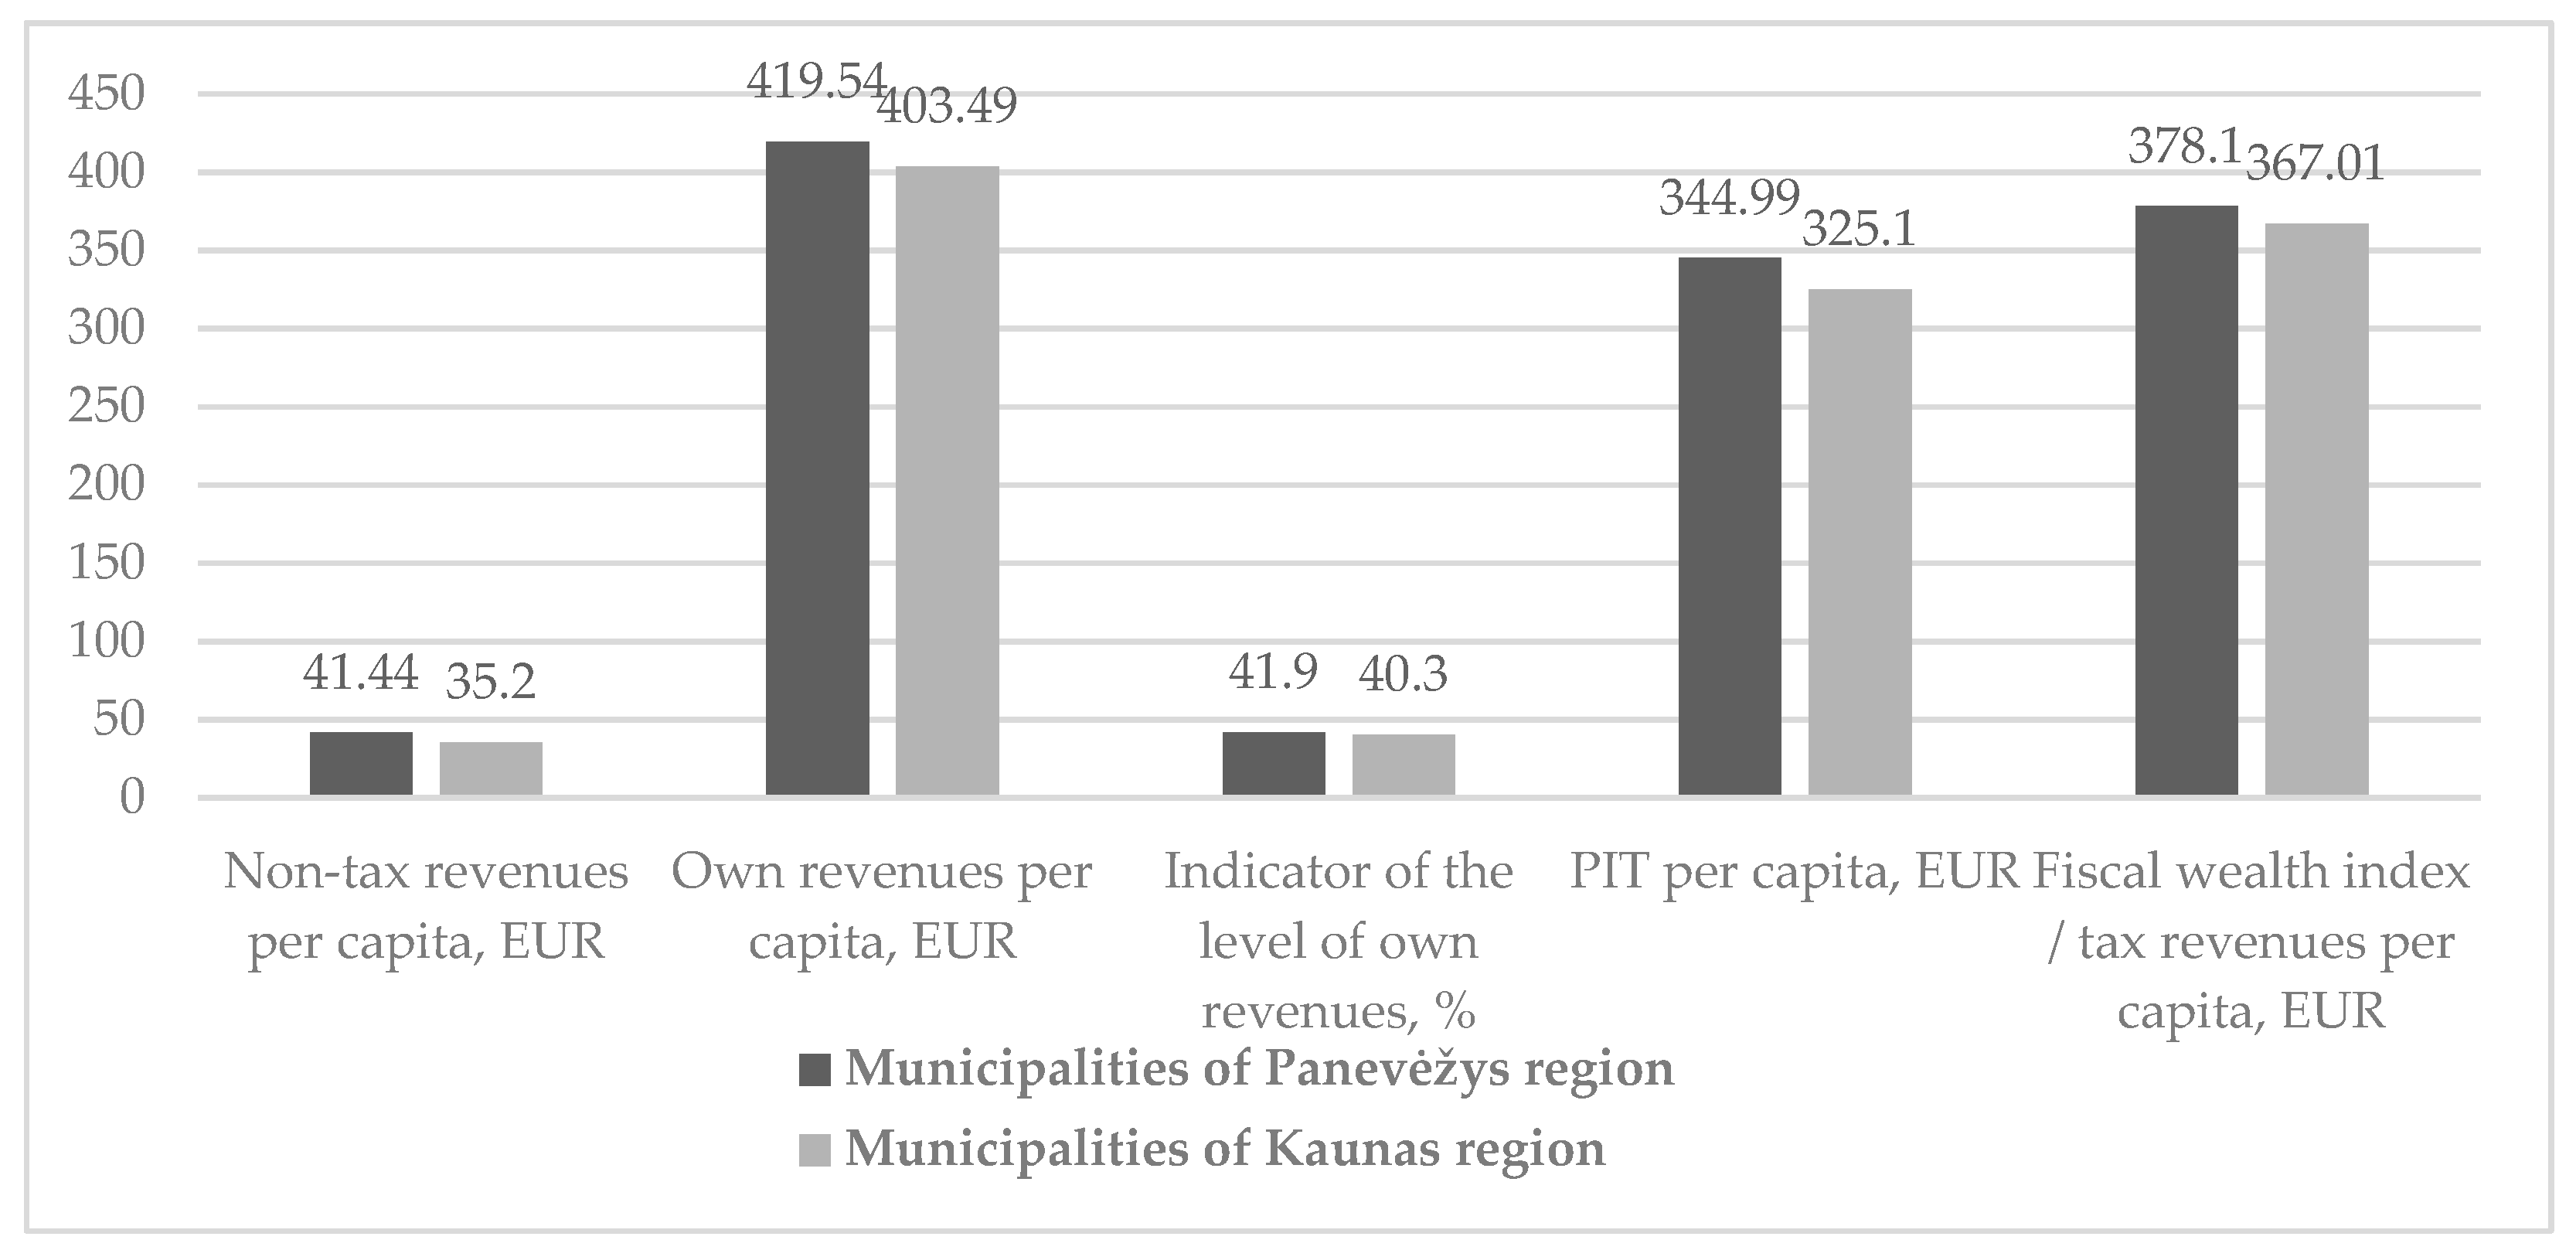
Following the multi-criteria assessment of the FA of rural municipalities using the TOPSIS method, the mean values of financial indicators were then calculated and compared within the identified classes by regions. The article presents the indicators of the rural municipalities of the analyze regions which varied the most significantly in the assessment period (see Figure 5). Comparison of the indicators describing the financial autonomy of rural municipalities of the two selected regions and their mean values showed that the situation of the financial condition of rural municipalities in Panevėžys region was better than that of the rural municipalities in Kaunas region.
The research results have demonstrated the homogeneity of the rural municipalities in relation to the FA level. On one hand, the empirical research results have pinpointed the issue of “convenient dependence” of the rural municipalities in the analyzed regions on the centralised allocation. On the other hand, the lack of the incentives for them to make use of the capacities and create sustainable, stable economic and social prospects has become evident. In individual rural municipalities, the State intervention ratio (%) of public intervention varied greatly. In the rural municipalities of Panevėžys region, transfers from the state budget (grants) accounted from 36% to 62%, and in Kaunas region—from 36% to 60% in the total income of the respective municipalities. The PIT as the main revenue of municipalities was also redistributed. The PIT accounted for 40.6% of the total income in the rural municipalities of Panevėžys region, and for 41.8% in the rural municipalities of Kaunas region (see Table 7 and Table 8). The data show high dependence of the municipalities on centralized financial management, which is regulated by legal acts enabling municipalities to refrain from being financially active and autonomy.
The changing legal base causes an increase only in the number of the state and allocated functions that continue to be under the influence of the state-level authorities, and the autonomous competence of the municipalities is not expanded. It should be noted that Lithuanian legal acts do not establish a definition of the concept of “own revenues”. Therefore, the questions arise as to which tax and non-tax revenues are the ownership of the municipality, and how the indicators of own revenues should be assessed. Even one of the key sources of municipal revenues, the PIT, collected within the municipalities, is subject to centralized redistribution. The municipalities have limited capacity to collect local taxes: the revenues from the local taxes make just up to 10% of the total municipal revenues. On one hand, this obviously shows the reluctance of the Lithuanian state authorities to abandon their influence in certain activity areas and increase the financial autonomy of the municipalities. On the other hand, the municipalities supported by the central government eventually become passive and make little use of own resources and potential in terms of improvement of own financial autonomy. This, therefore, raises the issue of municipalities’ “convenient dependence” on centralized allocation. The conducted empirical study of financial autonomy assessment of the rural municipalities also showed the medium low level of financial autonomy. Hence, there is currently the need in the country to analyze the financial autonomy of the municipalities, assess the situation, and explore the possibilities for improvement.
It could be claimed that the model used in the present empirical study is reliable in various aspects. FA assessment of rural municipality using the multi-criteria TOPSIS method enabled the authors to design a single summarizing indicator of financial autonomy of rural municipalities, assess the FA level of rural municipalities of the selected regions, and form the typological classes. It should be noted that limitations of the empirical research data, methods of verification and assessment of the FA indicators, sensitivity of the TOPSIS method towards the normalization rules applied may considerably affect the objectivity of the assessment.
5. Conclusions
Financial autonomy of local government units is the term employed when referring to the complex, multidimensional economic phenomenon based on the economic, fiscal policy, fiscal decentralisation, and regional development theories. It is related to responsible and sustainable financial resource allocation, redistribution, and stabilisation. Hence, assessment of the phenomenon involves complex aspects that cannot be measured directly. In view of the above, the multi-criteria TOPSIS method was selected and enabled the authors to assess the financial autonomy of rural municipalities by presenting a single summarizing indicator and to determine the respective levels of financial autonomy. The complex, integrated assessment model applied to assessment of financial autonomy of rural municipalities of the two regions was designed during the empirical study.
The conducted empirical study and data analysis have not provided compregensive exploration of financial autonomy of rural municipalities from the perspective of socioeconomic development. Nevertheless, they established the basis for further analysis of the scope, factors, and conditions of the phenomenon. For deeper and more comprehensive assessment and comparison, it is necessary to not only assess the level of financial autonomy of all the remaining rural municipalities of Lithuania, but also to analyse their socioeconomic factors and effect on the regional development. Hence, the empirical study should be resumed by extending the methodology with the view towards determination of the socioeconomic factors and effect thereof on development of the municipalities and financial sustainability (stage 3 of the empirical study).
The novelty of the research findings is demonstrated by the designed multi-criteria assessment model for assessment of financial autonomy of the rural municipalities using a single indicator. The study is also significant in that the assessment of the financial autonomy was performed for the rural municipalities as the local government units, as it was not subject to an integrated analysis on the national level. The model is relevant in addressing of the scientific and practical goals. It also enables the practitioners and theorists to assess and rationalize the financial autonomy of LGUs by gaining a better understanding of the whole, providing reasonable suggestions on increasing of the financial autonomy of LGUs. The presented model is also relevant for modeling of the scenario of the links between financial autonomy and the impact of socioeconomic factors on the development of municipalities and financial sustainability development indicators.
The results of the empirical study have revealed that the analyzed municipalities of the selected regions were characterised by the medium low level of financial autonomy. The finding has shown that the municipalities were very homogeneous, and their financial state and possibilities to implement own tasks still depended on the national budget allocations.
Author Contributions
Conceptualization, A.M. and L.S.; methodology, L.S.; software, R.K.; validation, A.M., L.S. and R.K.; formal analysis, R.K.; investigation, L.S.; resources, L.S.; data curation, L.S.; writing—original draft preparation, A.M.; writing—review and editing, L.S.; visualization, L.S.; supervision, A.M.; project administration, A.M.; funding acquisition, A.M. All authors have read and agreed to the published version of the manuscript.
Funding
This research received no external funding.
Data Availability Statement
No new data were created or analised in this study.
Acknowledgments
The authors thank three anonymous reviewers for helpful comments and suggestions.
Conflicts of Interest
The authors declare no conflict of interest.
References
- Aruldoss, Martin, T. Miranda Lakshmi, and V. Prasanna Venkatesan. 2013. A survey on multi criteria decision making methods and its applications. American Journal of Information Systems 1: 31–43. [Google Scholar]
- Atkočiūnienė, Vilma. 2008. Kaimo vietovės pokyčių valdymas pagal principą “iš apačios į viršų”. Ekonomika ir Vadyba: Aktualijos ir Perspektyvos 2: 50–62. (In Lithuanian). [Google Scholar]
- Beer-Tóth, Krisztina. 2009. Local Financial Autonomy in Theory and Practice. Doctoral dissertation, Université de Fribourg, Fribourg, Switzerland. [Google Scholar]
- Cigu, Elena. 2014. An aproach of local financial autonomy and implication over sustainable development in the knowledge society. Journal of Public Administration, Finance and Law 6: 44–53. [Google Scholar]
- Copus, Andrew, and Marsaili Macleod. 2006. Taking a fresh look at peripherality. In Marginality in the Twenty-first Century: Theory and Recent Trends. Edited by Gareth Jones and Walter Leimgruber. Ashgate: Aldershot. [Google Scholar]
- European Charter of Local Self-Government. 1985. Available online: https://rm.coe.int/168007a088 (accessed on 28 December 2020).
- Ginevičius, Romualdas, and Valentinas Podvezko. 2008. Daugiakriterinio vertinimo būdų suderinamumas. Business: Theory and Practice 9: 73. (In Lithuanian). [Google Scholar]
- Głowicka-Wołoszyn, Romana, and Łukasz Satoła. 2018. Financial self-sufficiency of rural communes in Poland. International Scientific Days, 1493–95. [Google Scholar]
- Hajilou, Mahran, Mohammad Mirehei, Sohrab Amirian, and Mehdi Pilehvar. 2018. Financial Sustainability of Municipalities and Local Governments in Small-Sized Cities; a Case of Shabestar Municipality. Lex Localis 16: 77–106. [Google Scholar] [CrossRef]
- Horlings, Lummina G., and Terry K. Marsden. 2014. Exploring the ‘New Rural Paradigm’ in Europe: Eco-economic strategies as a counterforce to the global competitiveness agenda. European Urban and Regional Studies 21: 4–20. [Google Scholar] [CrossRef]
- Hwang, Ching Lai, and Kwangsun Yoon. 1981. Methods for multiple attribute decision making. In Multiple Attribute Decision Making. Berlin/Heidelberg: Springer, pp. 58–191. [Google Scholar]
- Jakovljevic, Mihajlo, Melitta Jakab, Ulf Gerdtham, David McDaid, Seiritsu Ogura, Elena Varavikova, Joav Merrick, Roza Adany, Albert Okunade, and Thomas E. Getzen. 2019. Comparative financing analysis and political economy of noncommunicable diseases. Journal of Medical Economics 22: 722–27. [Google Scholar] [CrossRef]
- Jakovljevic, Mihajlo B. 2013. Resource allocation strategies in Southeastern European health policy. The European Journal of Health Economics 14: 153–59. [Google Scholar] [CrossRef] [Green Version]
- Jemna, Danut Vasile, Mihaela Onofrei, and C. I. G. U. Elena. 2013. Demographic and Socio-Economic Determinants of Local Financial Autonomy in Romania. Transylvanian Review of Administrative Sciences 9: 46–65. [Google Scholar]
- Kostov, Philip, and John Lingard. 2004. Integrated rural development-do we need a new approach? Paper presented by the 73 rd Seminar of the European Association of Agricultural Economists, Ancona, Italy, 28–30 June; Available online: http://clok.uclan.ac.uk/1418/1/0409006.pdf (accessed on 30 August 2020).
- Kozera, Agnieszka, Aleksandra Łuczak, and Feliks Wysocki. 2017. The Application of Classical and Positional TOPSIS Methods to Assessment Financial Self-sufficiency Levels in Local Government Units. In Data Science. Cham: Spinger, pp. 273–84. [Google Scholar]
- Kozera, Agnieszka, and Romana Głowicka-Wołoszyn. 2016. Spatial autocorrelation in assessment of financial self-sufficiency of communes of Wielkopolska province. Statistics in Transition New Series 17: 525–40. [Google Scholar]
- Kriaučiūnas, Edikas. 2018. Lietuvos kaimiškų teritorijų apgyvenimas: erdvinės transformacijos ir gyventojų gerovė. Geografijos Metrastis 51: 3–24. (In Lithuanian). [Google Scholar]
- Ladner, Andreas, and Nicolas Keuffer. 2018. Creating an index of local autonomy–theoretical, conceptual, and empirical issues. Regional & Federal Studies, 1–26. [Google Scholar] [CrossRef]
- Lietuvos Respublikos Finansų Ministerija [Ministry of Finance of the Republic of Lithuania]. 2020. Available online: http://finmin.lrv.lt/ (accessed on 28 December 2020). (In Lithuanian).
- Lietuvos Respublikos Statistikos Departamentas [Department of Statistics of the Republic of Lithuania]. 2020. Available online: https://osp.stat.gov.lt/statistiniu-rodikliu-analize#/ (accessed on 28 December 2020). (In Lithuanian)
- Lietuvos Respublikos Regioninės Plėtros Departamentas Prie Vidaus Reikalų Ministerijos [The Regional Development Department under the Ministry of the Interior of the Republic of Lithuania]. 2020. Available online: http://www.lietuvosregionai.lt/lt/8/kauno-apskritis-167;51.html (accessed on 15 November 2020). (In Lithuanian).
- Lietuvos Respublikos Valstybinė Mokesčių Inspekcija Prie Finansų Ministerijos [State Tax Inspectorate under the Ministry of Finance of the Republic of Lithuania]. 2020. Available online: https://www.vmi.lt/evmi/biudzeto-pajamos (accessed on 28 December 2020). (In Lithuanian).
- Łuczak, Aleksandra, Malgorzata Just, and Agnieszka Kozera. 2018a. Application of the positional POT-TOPSIS method to the assessment of financial self-sufficiency of local administrative units. Paper presented by the 10th Economics and Finance Conference, Rome, Italy, 10–13 September 2018; Edited by Cermakova Klara, Mozayeni Simin and Hromada Eduard. pp. 601–12. [Google Scholar] [CrossRef] [Green Version]
- Łuczak, Aleksandra, Agnieszka Kozera, and Silvia Bacci. 2018b. The application of taxonomic methods and ordered logit model in the assessment of financial self-sufficiency of local administrative units. Paper presented by the Economic Science for Rural Development Conference Proceedings (No. 49), Jelgava, Latvia, 9–11 May. [Google Scholar]
- Mueller, Keith J., Rebecca Slifkin, Michael D. Shambaugh-Miller, and Randy K. Randolph. 2004. Definition of rural in the context of MMA Access Standards for Prescription Drug Plans. RUPRI Center for Rural Health Policy Analysis. Available online: www. rupri. org/healthpolicy. (accessed on 6 July 2021).
- Normann, Roger Henning, and Mikaela Vasström. 2012. Municipalities as governance network actors in rural communities. European Planning Studies 20: 941–60. [Google Scholar] [CrossRef]
- Oulasvirta, Lasse, and Maciej Turala. 2009. Financial autonomy and consistency of central government policy towards local governments. International Review of Administrative Sciences 75: 311–32. [Google Scholar] [CrossRef]
- Podvezko, Valentinas. 2008. Sudėtingų dydžių kompleksinis vertinimas. Verslas: Teorija ir Praktika 9: 160–68. (In Lithuanian). [Google Scholar] [CrossRef]
- Psycharis, Yannis, Maria Zoi, and Stavroula Iliopoulou. 2016. Decentralization and local government fiscal autonomy: evidence from the Greek municipalities. Environment and Planning C: Government and Policy 34: 262–80. [Google Scholar] [CrossRef]
- Rudytė, Dalia, Dovilė Ruplienė, Lina Garšvienė, Roberta Bajorūnienė, and Solveiga Skunčikienė. 2018. Savivaldybių Fiskalinio Konkurencingumo Vertinimas Ekonominio Augimo Kontekste. Mokslo Studija. Available online: http://gs.elaba.lt/object/elaba:27762649/ (accessed on 30 August 2020). (In Lithuanian).
- Salm, Marco. 2014. Property Taxes in BRICS: Comparison and a First Draft for Performance Measurement. Available online: https://dopus.uni-speyer.de/frontdoor/deliver/index/docId/617/file/DP-079.pdf (accessed on 14 June 2021).
- Satoła, Łukasz, Aldona Standar, and Agnieszka Kozera. 2019. Financial Autonomy of Local Government Units: Evidence from Polish Rural Municipalities. Lex Localis-Journal of Local Self-Government 17: 321–42. [Google Scholar] [CrossRef]
- Shah, Anwar. 1994. The Reform of Intergovernmental Fiscal Relations in Developing and Emerging Market Economies. Washington: The World Bank, Available online: http://citeseerx.ist.psu.edu/viewdoc/download?doi=10.1.1.469.275&rep=rep1&type=pdf (accessed on 16 June 2021).
- Scutariu, Adrina Liviu, and Petronela Scutariu. 2015. The link between financial autonomy and local development. The case of Romania. Procedia Economics and Finance 32: 542–49. [Google Scholar] [CrossRef] [Green Version]
- Simanavičienė, Rūta. 2016. The sensitivity of method TOPSIS with respect to the normalization rules. Lietuvos Matematikos Rinkinys 57: 71–76. [Google Scholar]
- Simanavičienė, Rūta. 2011. Kiekybinių Daugiatikslių Sprendimo Priėmimo Metodų Jautrumo Analizė. Doctoral dissertation, Vilnius Gediminas Technical University, Vilnius, Lithuania. (In Lithuanian). [Google Scholar]
- Skauronė, Laima, Astrida Miceikienė, and Ričardas Krikštolaitis. 2020. The Impact of Fiscal Policy Measures on the Financial Autonomy of Rural Municipalities: Case of Lithuania. Paper presented by the Entrenova-Enterprise Research Innovation Conference (Online), Janičić, Radmila, 22 September; vol. 6, pp. 157–72. [Google Scholar]
- Slavinskaitė, Neringa. 2017. Šalies fiskalinės decentralizacijos vertinimas. Doctoral dissertation, Vilnius Gediminas Technical University, Vilnius, Lithuania. (In Lithuanian). [Google Scholar]
- Standar, Aldona, and Agnieszka Kozera. 2019. The Role of Local Finance in Overcoming Socioeconomic Inequalities in Polish Rural Areas. Sustainability 11: 5848. [Google Scholar] [CrossRef] [Green Version]
- Vavrek, Roman, and Ryszard Pukala. 2019. Topsis Technique in Self-Government–Case Study of Košice Region. MATEC Web of Conferences 297: 08001, EDP Sciences. [Google Scholar] [CrossRef]
- Vidickienė, Dalia, and Rasa Melnikienė. 2008. Lietuvos kaimiškųjų regionų kaip gyvenamosios vietos patrauklumo vertinimas. Žemės Ūkio Mokslai 15: 51–59. (In Lithuanian). [Google Scholar]
- Ward, Neil, and David. L. Brown. 2009. Placing the rural in regional development. Regional Studies 43: 1237–44. [Google Scholar] [CrossRef] [Green Version]
- Zavadskas, Edmundas Kazimieras, Zenonas Turskis, and Simona Kildienė. 2014. State of art surveys of overviews on MCDM/MADM methods. Technological and Economic Development of Economy 20: 165–79. [Google Scholar] [CrossRef] [Green Version]
- Žukovskis, Jan, Daiva Urmonienė, and Rasa Jodenytė. 2013. Savivaldos institucijų įtaka kaimo raidai, taikant institucinės priklausomybės modelį. Kaimo Raidos Kryptys Žinių Visuomenėje: Mokslo Darbai, 84–94. Available online: https://www.vdu.lt/cris/handle/20.500.12259/86761 (accessed on 6 July 2021). (In Lithuanian).
Figure 1.
Relation between the phenomenon of financial autonomy and economic theories. Source: made by the authors.
Figure 1.
Relation between the phenomenon of financial autonomy and economic theories. Source: made by the authors.

Figure 2.
Model for FA assessment of rural municipalities. Source: made by the authors.

Figure 3.
Variation of the priority of rural municipalities by the indicator of the level of financial autonomy, 2009–2019. Source: made by the authors.
Figure 3.
Variation of the priority of rural municipalities by the indicator of the level of financial autonomy, 2009–2019. Source: made by the authors.

Figure 4.
Assessment of the FA level of rural municipalities. Source: made by the authors.

Figure 5.
Indicators of FA of the rural municipalities which varied the most significantly, 2009–2019. Mean values of the FA indicators of the rural municipalities which varied the most significantly.
Figure 5.
Indicators of FA of the rural municipalities which varied the most significantly, 2009–2019. Mean values of the FA indicators of the rural municipalities which varied the most significantly.


Table 1.
Number of indicators used for FA level assessment of rural municipalities in the studies.
| Authors, Year | Satoła, Standar, Kozera, 2019 | Standar, Kozera, 2019 | Glowicka-Woloszyn, Satola, 2018 | Luczak, Kozera, Bacci, 2018 | Kozera, Łuczak, Wysocki, 2017 | A.L. Scutariu, P. Scutariu, 2015 | Jemna, Onofre, Cigu, 2013 |
|---|---|---|---|---|---|---|---|
| Number of indicators, units | 7 | 7 | 11 | 8 | 9 | 2 | 5 |
Table 2.
Comparison of the multi-criteria, multi-attribute quantitative methods.
| Attributes | Multi-Criteria, Multi-Attribute Quantitative Methods | |||||||
|---|---|---|---|---|---|---|---|---|
| AHP | Fuzzy | ELECTRE | TOPSIS | PROMETHE | SAW | VIKOR | COPRAS | |
| International practice for addressing economic objectives | Not applicable | Applicable | Applicable | Applicable | Not applicable | Applicable | Applicable | Applicable |
| Measurement dimensions for different criteria | Available | Available | Not available | Available | Available | Available | Not available | Not available |
| Complexity of the method | Average | Average | Very complex | Complex | Complex | Simple | Complex | Simple |
| Objective structure | Hierarchic | Linear | Linear | Linear Non-linea Vector | Linear Non-linear | Linear | Linear | Linear |
| Assessment of qualitative criteria | Available | Available | Available | Available | - | Available | Available | Available |
| Assessment of quantitative criteria | Not available | Not available | Available | Available | Available | Available | Available | Available |
| Method for identification of the best alternative | T. Saaty method | Alternatives priority | Dominant relationship | Closeness to the ideal solution | Alternatives priority | Weighted | Closeness to the ideal solution | Proportionate |
| Labour costs | Average | Average | High | High | High | Low | High | Low |
Source: made by the authors according to (Slavinskaitė 2017; Aruldoss et al. 2013; Ginevičius and Podvezko 2008; Hwang and Yoon 1981; Simanavičienė 2011; Zavadskas et al. 2014).
Table 3.
Classification of rural municipalities into classes/clusters by financial autonomy level.
| Class/Cluster | Financial Autonomy Level | Mathematical Value |
|---|---|---|
| Class I/cluster | High | + S (16) |
| Class II/cluster | Medium high | Ki+ S (17) |
| Class III/cluster | Medium low | Ki < M (18) |
| Class IV/cluster | Low level | Ki S (19) |
Source: made by the authors according to (Satoła et al. 2019).
Table 4.
Revenue indicators for financial autonomy measurement of rural municipalities and description of the indicators.
Table 4.
Revenue indicators for financial autonomy measurement of rural municipalities and description of the indicators.
| Indicator, Unit of Measure | Indicator Designation | Indicator Calculation Methodology | Direction of the Indicator Value |
|---|---|---|---|
| PIT per capita, EUR | r1 | PIT transferred into the municipal budget/population of the municipality | Maximizing |
| Fiscal wealth index or tax revenues per capita, EUR | r2 | Tax revenue/population of the municipality | Maximizing |
| PIT (%) in the total municipality revenues | r3 | PIT transferred into the municipal budget/total municipal revenues × 100% | Maximizing |
| Own revenues per capita, EUR | r4 | Own municipal revenues/population of the municipality | Maximizing |
| Share of own revenues in total revenues (%) | r5 | Own municipal revenues/population of the municipality × 100% | Maximizing |
| Index of financial autonomy, 1st degree/share of own revenues in total revenues, (%) | r6 | Own municipal revenues/total municipal revenues × 100% | Maximizing |
| Non-tax revenues per capita, EUR | r7 | Municipal non-tax revenues/population of the municipality | Maximizing |
| Share of grants in the total municipal revenues or State intervention ratio (%). | r8 | Transfers from the state budget (grants)/total municipal revenues × 100% | Minimizing |
| Transfers per capita, EUR | r9 | Transfers from the state budget (grants)/population of the municipality | Minimizing |
Source: made by the authors.
Table 5.
Descriptive statistics of indicators describing the level of financial autonomy in rural municipalities of Panevėžys region, 2009–2019.
Table 5.
Descriptive statistics of indicators describing the level of financial autonomy in rural municipalities of Panevėžys region, 2009–2019.
| Indicator | Mean | Median | Standard Deviation | Min | Max |
|---|---|---|---|---|---|
| PIT per capita, Eur | 344.99 | 294.71 | 121.02 | 221.04 | 591.69 |
| Fiscal wealth index or tax revenue per capita, Eur | 378.10 | 327.18 | 129.43 | 236.38 | 651.05 |
| PIT (%) in the municipality revenues | 40.64 | 40.85 | 6.28 | 30.33 | 54.65 |
| Own revenues per capita, Eur | 419.55 | 359.64 | 149.04 | 257.35 | 754.66 |
| Share of own revenues in total revenues (%) | 41.95 | 35.96 | 14.90 | 25.73 | 75.47 |
| Index of financial autonomy, 1st degree/share of own revenues in total revenues, (%) | 49.30 | 49.40 | 6.96 | 38.30 | 63.76 |
| Non-tax revenues per capita, Eur | 41.44 | 33.17 | 22.14 | 13.06 | 108.73 |
| Share of grants in the total municipal revenues or State intervention ratio, (%) | 50.71 | 50.60 | 6.96 | 36.14 | 61.70 |
| Transfer per capita, Eur | 412.74 | 403.15 | 64.69 | 273.24 | 625.05 |
Source: own calculations based on Department of Statistics of the Republic of Lithuania (2020).
Table 6.
Descriptive statistics of indicators describing the level of financial autonomy in rural municipalities of the Kaunas region, 2009–2019.
Table 6.
Descriptive statistics of indicators describing the level of financial autonomy in rural municipalities of the Kaunas region, 2009–2019.
| Indicator | Mean | Median | Standard Deviation | Min | Max |
|---|---|---|---|---|---|
| PIT per capita, Eur | 325.11 | 290.94 | 107.71 | 207.52 | 535.13 |
| Fiscal wealth index or tax revenue per capita, Eur | 367.01 | 331.27 | 110.42 | 227.26 | 595.80 |
| PIT (%) in the municipality revenues | 41.84 | 41.82 | 6.68 | 31.47 | 55.99 |
| Own revenues per capita, Eur | 403.50 | 365.43 | 128.99 | 244.80 | 685.65 |
| Share of own revenues in total revenues (%) | 40.35 | 36.54 | 12.90 | 24.48 | 68.57 |
| Index of financial autonomy, 1st degree/share of own revenues in total revenues, (%) | 51.87 | 51.92 | 6.47 | 40.19 | 63.95 |
| Non-tax revenues per capita, Eur | 35.91 | 27.20 | 22.07 | 14.90 | 121.07 |
| Share of grants in the total municipal revenues or State intervention ratio, (%) | 48.13 | 48.02 | 6.47 | 36.05 | 59.81 |
| Transfer per capita, Eur | 366.83 | 377.97 | 88.02 | 214.93 | 615.95 |
Source: own calculations based on Department of Statistics of the Republic of Lithuania (2020).
Table 7.
Level of variation and weight of the revenue indicators of the financial autonomy of rural municipalities, 2009–2019.
Table 7.
Level of variation and weight of the revenue indicators of the financial autonomy of rural municipalities, 2009–2019.
| Indicator Alternative | r1 | r2 | r3 | r4 | r5 | r6 | r7 | r8 | r9 |
|---|---|---|---|---|---|---|---|---|---|
| Indicator variation level (dj) | |||||||||
| Rural municipalities of Panevėžys region | |||||||||
| A1 | 0.0246 | 0.0241 | 0.0037 | 0.0243 | 0.0243 | 0.0034 | 0.0292 | 0.0038 | 0.0022 |
| A2 | 0.0248 | 0.0210 | 0.0041 | 0.0227 | 0.0227 | 0.0033 | 0.0457 | 0.0024 | 0.0042 |
| A3 | 0.0209 | 0.0198 | 0.0043 | 0.0216 | 0.0216 | 0.0043 | 0.0626 | 0.0055 | 0.0014 |
| A4 | 0.0244 | 0.0238 | 0.0042 | 0.0252 | 0.0252 | 0.0041 | 0.0389 | 0.0038 | 0.0017 |
| A5 | 0.0243 | 0.0241 | 0.0033 | 0.0258 | 0.0258 | 0.0037 | 0.0430 | 0.0038 | 0.0022 |
| Rural municipalities of Kaunas region | |||||||||
| A6 | 0.0209 | 0.0129 | 0.0040 | 0.0135 | 0.0135 | 0.0012 | 0.0270 | 0.0016 | 0.0039 |
| A7 | 0.0220 | 0.0211 | 0.0023 | 0.0207 | 0.0207 | 0.0021 | 0.0165 | 0.0035 | 0.0064 |
| A8 | 0.0217 | 0.0180 | 0.0026 | 0.0230 | 0.0230 | 0.0029 | 0.0809 | 0.0026 | 0.0022 |
| A9 | 0.0213 | 0.0182 | 0.0027 | 0.0210 | 0.0210 | 0.0024 | 0.0612 | 0.0019 | 0.0022 |
| Weight of objective significance of the indicator (qj) | |||||||||
| Rural municipalities of Panevėžys region | |||||||||
| A1 | 0.1761 | 0.1729 | 0.0268 | 0.1740 | 0.1740 | 0.0241 | 0.2095 | 0.0270 | 0.0155 |
| A2 | 0.1643 | 0.1393 | 0.0271 | 0.1506 | 0.1506 | 0.0217 | 0.3026 | 0.0160 | 0.0278 |
| A3 | 0.1290 | 0.1224 | 0.0266 | 0.1334 | 0.1334 | 0.0263 | 0.3865 | 0.0338 | 0.0084 |
| A4 | 0.1615 | 0.1570 | 0.0279 | 0.1663 | 0.1663 | 0.0273 | 0.2572 | 0.0253 | 0.0112 |
| A5 | 0.1555 | 0.1545 | 0.0214 | 0.1654 | 0.1654 | 0.0238 | 0.2754 | 0.0241 | 0.0143 |
| Rural municipalities of Kaunas region | |||||||||
| A6 | 0.2123 | 0.1314 | 0.0409 | 0.1369 | 0.1369 | 0.0118 | 0.2744 | 0.0158 | 0.0396 |
Table 8.
Synthetic indicators of the FA level of rural municipalities, 2009–2019.
| Alternatives | Panevėžys Region | Kaunas Region | |||||||
|---|---|---|---|---|---|---|---|---|---|
| Year | A1 | A2 | A3 | A4 | A5 | A6 | A7 | A8 | A9 |
| 2009 | 0.4507 | 0.4062 | 0.3785 | 0.4842 | 0.4442 | 0.3951 | 0.5026 | 0.3641 | 0.407 |
| 2010 | 0.4610 | 0.4125 | 0.3279 | 0.4586 | 0.4371 | 0.3723 | 0.5181 | 0.3260 | 0.333 |
| 2011 | 0.4655 | 0.4016 | 0.3133 | 0.4223 | 0.3975 | 0.3776 | 0.5270 | 0.3358 | 0.324 |
| 2012 | 0.5068 | 0.4277 | 0.3642 | 0.4360 | 0.4285 | 0.4820 | 0.5297 | 0.3623 | 0.351 |
| 2013 | 0.4594 | 0.3588 | 0.3277 | 0.3765 | 0.4055 | 0.4669 | 0.5212 | 0.3566 | 0.359 |
| 2014 | 0.5095 | 0.3818 | 0.3331 | 0.4130 | 0.4250 | 0.4309 | 0.5130 | 0.3045 | 0.339 |
| 2015 | 0.5282 | 0.4199 | 0.3367 | 0.4347 | 0.4367 | 0.4176 | 0.5183 | 0.3098 | 0.349 |
| 2016 | 0.5240 | 0.3965 | 0.3404 | 0.4343 | 0.3913 | 0.4312 | 0.5071 | 0.3101 | 0.345 |
| 2017 | 0.5254 | 0.4023 | 0.3486 | 0.4477 | 0.4179 | 0.4420 | 0.5113 | 0.3104 | 0.338 |
| 2018 | 0.4649 | 0.3466 | 0.3016 | 0.4052 | 0.3933 | 0.3956 | 0.5064 | 0.2920 | 0.304 |
| 2019 | 0.4596 | 0.3547 | 0.2959 | 0.3891 | 0.3705 | 0.3821 | 0.5051 | 0.2884 | 0.302 |
Source: own calculations.
Table 9.
Classification of the rural municipalities by the financial autonomy level *.
| Financial Autonomy Level | Boundaries of the Synthetic Indicator | Distribution of the Municipalities of Panevėžys Region | Distribution of the Municipalities of Kaunas Region |
|---|---|---|---|
| I (high) | [0.719; 1.00) | ||
| II (medium high) | [0.508; 0.719) | ||
| III (medium low) | [0.297; 0.508) | Biržai distr. mun., Pasvalys distr. mun., Rokiškis distr. mun.; Kupiškis distr. mun.; Panevėžys distr. mun. | Kaišiadorys distr. mun.; Kaunas distr. mun.; Prienai distr. mun.; Raseiniai distr. mun. |
| IV (low) | [0.00; 0.297) |
* Values of the FA level of rural municipalities are presented as the respective mean values of the last 3 years (2017–2019). Source: made by the authors.
Publisher’s Note: MDPI stays neutral with regard to jurisdictional claims in published maps and institutional affiliations. |
© 2021 by the authors. Licensee MDPI, Basel, Switzerland. This article is an open access article distributed under the terms and conditions of the Creative Commons Attribution (CC BY) license (https://creativecommons.org/licenses/by/4.0/).
Share and Cite
MDPI and ACS Style
Miceikienė, A.; Skauronė, L.; Krikštolaitis, R. Assessment of the Financial Autonomy of Rural Municipalities. Economies 2021, 9, 105. https://0-doi-org.brum.beds.ac.uk/10.3390/economies9030105
AMA Style
Miceikienė A, Skauronė L, Krikštolaitis R. Assessment of the Financial Autonomy of Rural Municipalities. Economies. 2021; 9(3):105. https://0-doi-org.brum.beds.ac.uk/10.3390/economies9030105
Chicago/Turabian StyleMiceikienė, Astrida, Laima Skauronė, and Ričardas Krikštolaitis. 2021. "Assessment of the Financial Autonomy of Rural Municipalities" Economies 9, no. 3: 105. https://0-doi-org.brum.beds.ac.uk/10.3390/economies9030105
Note that from the first issue of 2016, this journal uses article numbers instead of page numbers. See further details here.