How Concept Maps with and without a List of Concepts Differ: The Case of Statistics


Institute of Education, National Research University Higher School of Economics, 101000 Moscow, Russia
Educ. Sci. 2020, 10(4), 91; https://0-doi-org.brum.beds.ac.uk/10.3390/educsci10040091
Submission received: 4 February 2020
/
Revised: 7 March 2020
/
Accepted: 25 March 2020
/
Published: 30 March 2020
(This article belongs to the Special Issue Networks Applied in Science Education Research)
Abstract
:Concept mapping is a popular tool for knowledge structure assessment. In recent years, both the amount of research about concept maps and their measurement ability have grown. It has been shown that concept maps with different types of tasks, for instance, links between concepts given or selected by a respondent, provide information about the different aspects of students’ knowledge structure. This study explores features of concept mapping with and without a list of concepts. At first, eleven masters students constructed concept maps with a topic on statistical data analysis and, after three weeks, repeated the task with the same topic and a predefined list of concepts. Both types of concept maps were evaluated using traditional scoring indicators and indicators from the network analysis. All indicators were tested for significant differences, and then the content of these maps was analysed. Results show that the list of concepts forced respondents to construct more connective maps, which is related to a more developed knowledge structure. Moreover, it is easier for them, when including even abstract concepts, to define their role in the domain. However, respondents use concepts and group them in different ways depending on the instruction. It seems that respondents feel a “list stress”, which leads to differences in the content. These findings demonstrate the possibilities of using different concept mapping tasks for learning and assessment.
1. Introduction
Knowledge structure development is an important result of learning and education. The meaningful learning theory states that students more efficiently embed new concepts to existing knowledge structures [1]. Novak expanded upon the idea of meaningful learning, but faced the issue of knowledge structure measurement [2]. For the effective implementation of new information, it is crucial to measure how previous concepts are organised. To overcome this issue, Novak and his colleagues developed the concept maps method [3].
A concept map (CM) is a graphic representation of the relationship between concepts and processes related to a particular subject area. The CM consists of nodes (concepts) and their relationships, or edges. Research shows that concept mapping is an effective teaching strategy [4,5,6] as well as a useful assessment tool [7,8,9].
CM assessment differs in task, format, and scoring method [8]. CM tasks can vary by degrees of directedness [10,11]. There are two main types of tasks for constructing CM: the concepts may be predefined for respondents (CMs with a list of concepts) or respondents may have only the topic and retrieve concepts from their memory (CMs without a list of concepts).
The issue is that possible differences may exist between the maps constructed with these two approaches and their interpretation. Previous studies focused on differences in CMs with forced vs. retrieved links, or labels of links, when the concepts were specified beforehand [12,13]. These studies show that different mapping tasks provide information about the different aspects of students’ knowledge structure. Even manipulation with “How” and “What” in a focus question can lead to different results [14].
However, what has not previously been investigated is the difference between CMs with a list of concepts and a topic and with just a topic (with and without the list of concepts). However, in the wide range of concept mapping tasks, these two are more commonly used [15]. In this paper we explore differences between concept mapping with and without a list of concepts using data from master students who drew CMs on the topic of data analysis. The aim of the study is in line with previous research—“to increase our understanding of how different mapping techniques affect the representation” [11]. Statistics and data analysis are often used in concept mapping studies (e.g., [16,17,18]) because they have terminological agreement and strong theories with abstract and more technical concepts.
1.1. Concept Maps as a Knowledge Structure Assessment Tool
The knowledge structure reflects previous experiences and, in turn, modulates learning. The importance of structuring knowledge was noticed by Piaget and Vygotsky. Piaget claimed that changes in the conceptual structure are the necessary result of such processes as assimilation and accommodation [19]. New information is assimilated by the existing structure to the extent that the structure itself is able to assimilate. Vygotsky stated the difference between the evolution of everyday and scientific concepts: the first one develops from the specific meaning of objects in relation to their abstract meaning, and vice versa for the second [20,21,22]. Scientific concepts are often poorly rooted in real life routine and we should firstly build the structure from very abstract phenomena, and then refer observed objects and relationships to this structure. Later, pedagogical theories such as constructivism suggested that an understanding of information implies that new information must be somehow related to existing knowledge, and the number of links between previously studied and new information reflects the degree of understanding [1].
In response to the development of such views, methods for assessing the structure of knowledge began to develop. Traditional methods, such as standardised tests, were unable to evaluate shifts in knowledge structure, and Novak and colleagues, through clinical interviews, developed a method based on graphical representation—concept mapping [23]. CM differs from other assessment tools (such as tests, problem sorting, verbal messages, diagnostic interviews, etc.) because it allows the structure and connections between all concepts to be seen and comes directly from the respondent [24]. Concept mapping is a valid, reliable and the most informative method for knowledge structure assessment [25,26,27].
For educational purposes, CMs could be constructed by a teacher as a model for students and by students in groups or individually. For students, the teacher controls the format of the concept mapping task. CM tasks can vary by degrees of directedness—the extent to which the concepts, linking phrases and the whole structure are provided to students [9,10,11,15]. The most undirected task with only a topic or focus question is very popular [15] and is considered more valid than others because students should generate a meaningful representation of their knowledge due to high cognitive demand [12]. The next common task is providing a list of concepts in addition to the topic [15]. However, there is a lack of objective information about differences between results of using various concept mapping tasks. Although some research has focused on differences in CMs with forced vs. retrieved links or labels of links when the concepts were specified beforehand [12,13], with forms of predefined structure and formulation of focus questions [14], the CMs with and without a list of concepts have not been considered, and existing evaluation approaches are inconsistent.
In using CM as an assessment method, it is important to choose an evaluation approach. Generally, there are two approaches: qualitative (holistic) and quantitative [7,9,10,28]. The holistic approach is based on general experts’ judgment about structure quality, its hierarchisation and form (e.g., [29,30,31]). The quantitative approach seeks to overcome experts’ subjectivity and formulate their judgments into objective indicators. The traditional indicators include the number of concepts, links between them, and the concept–link ratio as a measure of connectivity [29,32]. Sometimes traditional scoring includes the proposition accuracy score and rubrics, which are also based on experts’ ratings (e.g., [12,33,34]). Following the increase in computing power, researchers also use computational theories to evaluate CMs, such as graph and network theories (e.g., [35,36,37,38,39,40]). In general, traditional indicators are based on counting various elements of a CM or simple functions of these elements, while computational theories are focused on a more complex evaluation of the whole structure and how information is distributed within the structure.
1.2. Knowledge Structure in Statistics Domain
A lot of knowledge structure studies use statistics as a domain (e.g., [16,18,33,41]). Firstly, statistics has strong terminological agreement. There are a lot of debates about the specific methods of application (e.g., factor analysis for binary or categorical data [42,43,44,45]), but not about names and meanings of methods or phenomena. The definition can vary in across different textbooks, but the core features of, for example, normal distribution, remain the same.
The second reason is strict theoretical underpinning. The descriptive and inferential statistics derived from probability theory go back more than three centuries. Like any developed theory that has grown into practice, statistics have very abstract (e.g., probability), more concrete (e.g., p-value) and specific technical concepts (e.g., null hypothesis, t-test) with established relationships between them. It is easy to relate this to a model of declarative (conceptual, abstract, theoretical) and procedural (technical, specific, task-oriented) knowledge [46,47]. This model is often used to show the difference in novices and experts’ knowledge structures: it has been demonstrated that novices tend to use more procedural knowledge in their representations [39,47,48,49].
The third point is the issues with teaching and learning statistics: faulty reasoning [50], “maths-phobia”, statistics anxiety and negative attitude towards statistics [51], and the focus on mathematical grounds and calculations [51,52].
At the same time, researchers note the deficiency in approaches for assessing statistical reasoning and information structuring [41,51,52,53]. Therefore, methods such as concept mapping will be very informative in teaching statistics research and in providing revealing findings by using the well described domain of statistics.
The research question of the current study is: how do CMs with and without a list of concepts differ in terms of structure characteristics and core and technical concepts using? To address this question, the following research hypotheses are stated:
Hypothesis 1 (H1):
the values of the structural indicators are the same for both instruction types.
Hypothesis 2 (H2):
students use more technical concepts in instruction without a list.
Hypothesis 3 (H3):
students use and group core concepts irrespective of the type of instruction.
In this study, we examine structure and content features of CMs with and without a list of concepts. With this aim, CMs of the same students were analysed using quantitative and qualitative approaches. The quantitative approach was based on indicators from traditional scoring and network theory to evaluate structural features. The qualitative approach was conducted for content analysis and was based on concept type and community detection.
2. Materials and Methods
2.1. Data Collecting
The study involved eleven masters students. All of them took an annual course on basic methods of data analysis (introductory statistics) and worked with statistical packages during the course. None of the students had a job or any professional experience in data analysis. None of the participants had any experience with conceptual maps. The study took place in two stages. In the first stage, 2 months after the course finished, participants received written instructions to construct a CM on the topic “Statistical Data Analysis”, without any additional information (CM without a list of concepts) (Appendix A). In the second stage, 3 weeks after the first stage, the participants received the same instructions, but they were also asked to use a list with 25 concepts (CM with a list of concepts) (Appendix A). Students could add no more than two concepts to the list themselves. At both stages, students constructed CMs individually on a sheet of paper using a pen. Then, students’ maps were translated to English and transformed into an edge list.
The list of concepts was constructed based on the course curriculum and previous research about core statistical concepts [39,54,55]. The following nine concepts were considered fundamental in the study: significance, sample, population, distribution, hypothesis, data, analysis, method, and the research question. To test H3, one fundamental concept (significance) was excluded to see whether students would add it to the list. The list included both technical concepts (e.g., specific methods) (eight out of 25, 32%) to reflect the procedural knowledge and more abstract concepts to reflect the declarative knowledge.
2.2. Analysis Strategy
The direction of each connection between concepts was not considered and undirected networks were used. Also, labels of links were ignored.
For the quantitative part of analysis (H1), traditional and network indicators of CMs without and with a list of concepts were compared using t-test. Traditional indicators were chosen in line with [39] and included number of concepts and propositions, their ratios (less than 1 is more connected structure), number and percent of concepts with 1 and 3 or more degrees. Since there is no enough information about network indicators’ differentiating ability, diameter (average length of the shortest paths between each two nodes) and the share of diameter (length of diameter divided by the number of concepts) were used as a measure of structure connectivity based on the theory.
For the qualitative part, one common map from respondents’ maps for each condition (without and with the list of concepts) was constructed to reduce individual differences and reflect general trends. Each concept was manually coded as technical (procedural knowledge – specific methods, software or type of results) or other (more abstract) to test the H2. The number of edges between two concepts extracted from different maps was used as a weight. Then the weighted closeness centrality was counted for each concept to test the H2 and H3. The closeness centrality shows how central a given concept is, relative to the whole network. Finally, communities using the Girvan–Newman algorithm based on edges betweenness were detected to find out groups of concepts and also test the H3 [56]. All computations were done in R software using “igraph” and “visnetwork” packages.
3. Results
The quantitative results show that the size of CMs did not change significantly depending on instruction type: the numbers of concepts and propositions were the same (Table 1). The increase in the number of propositions was higher, but insignificant. However, the concepts–proposition ratio decreased significantly for CMs without the list: for this type of instruction, structures were more connected. The number and the percentage of concepts with one degree was less for CMs with the list. However, the same indicators for concepts with three or more degrees did not change. In other words, the rise in connectivity was due to concepts having a middle level of inclusion in the structure (having propositions with just two other concepts). The diameter was larger for CMs with the list, although the share in diameter across a CM did not change significantly. Taking all of the above into consideration, the first hypothesis of no difference was not supported in this study.
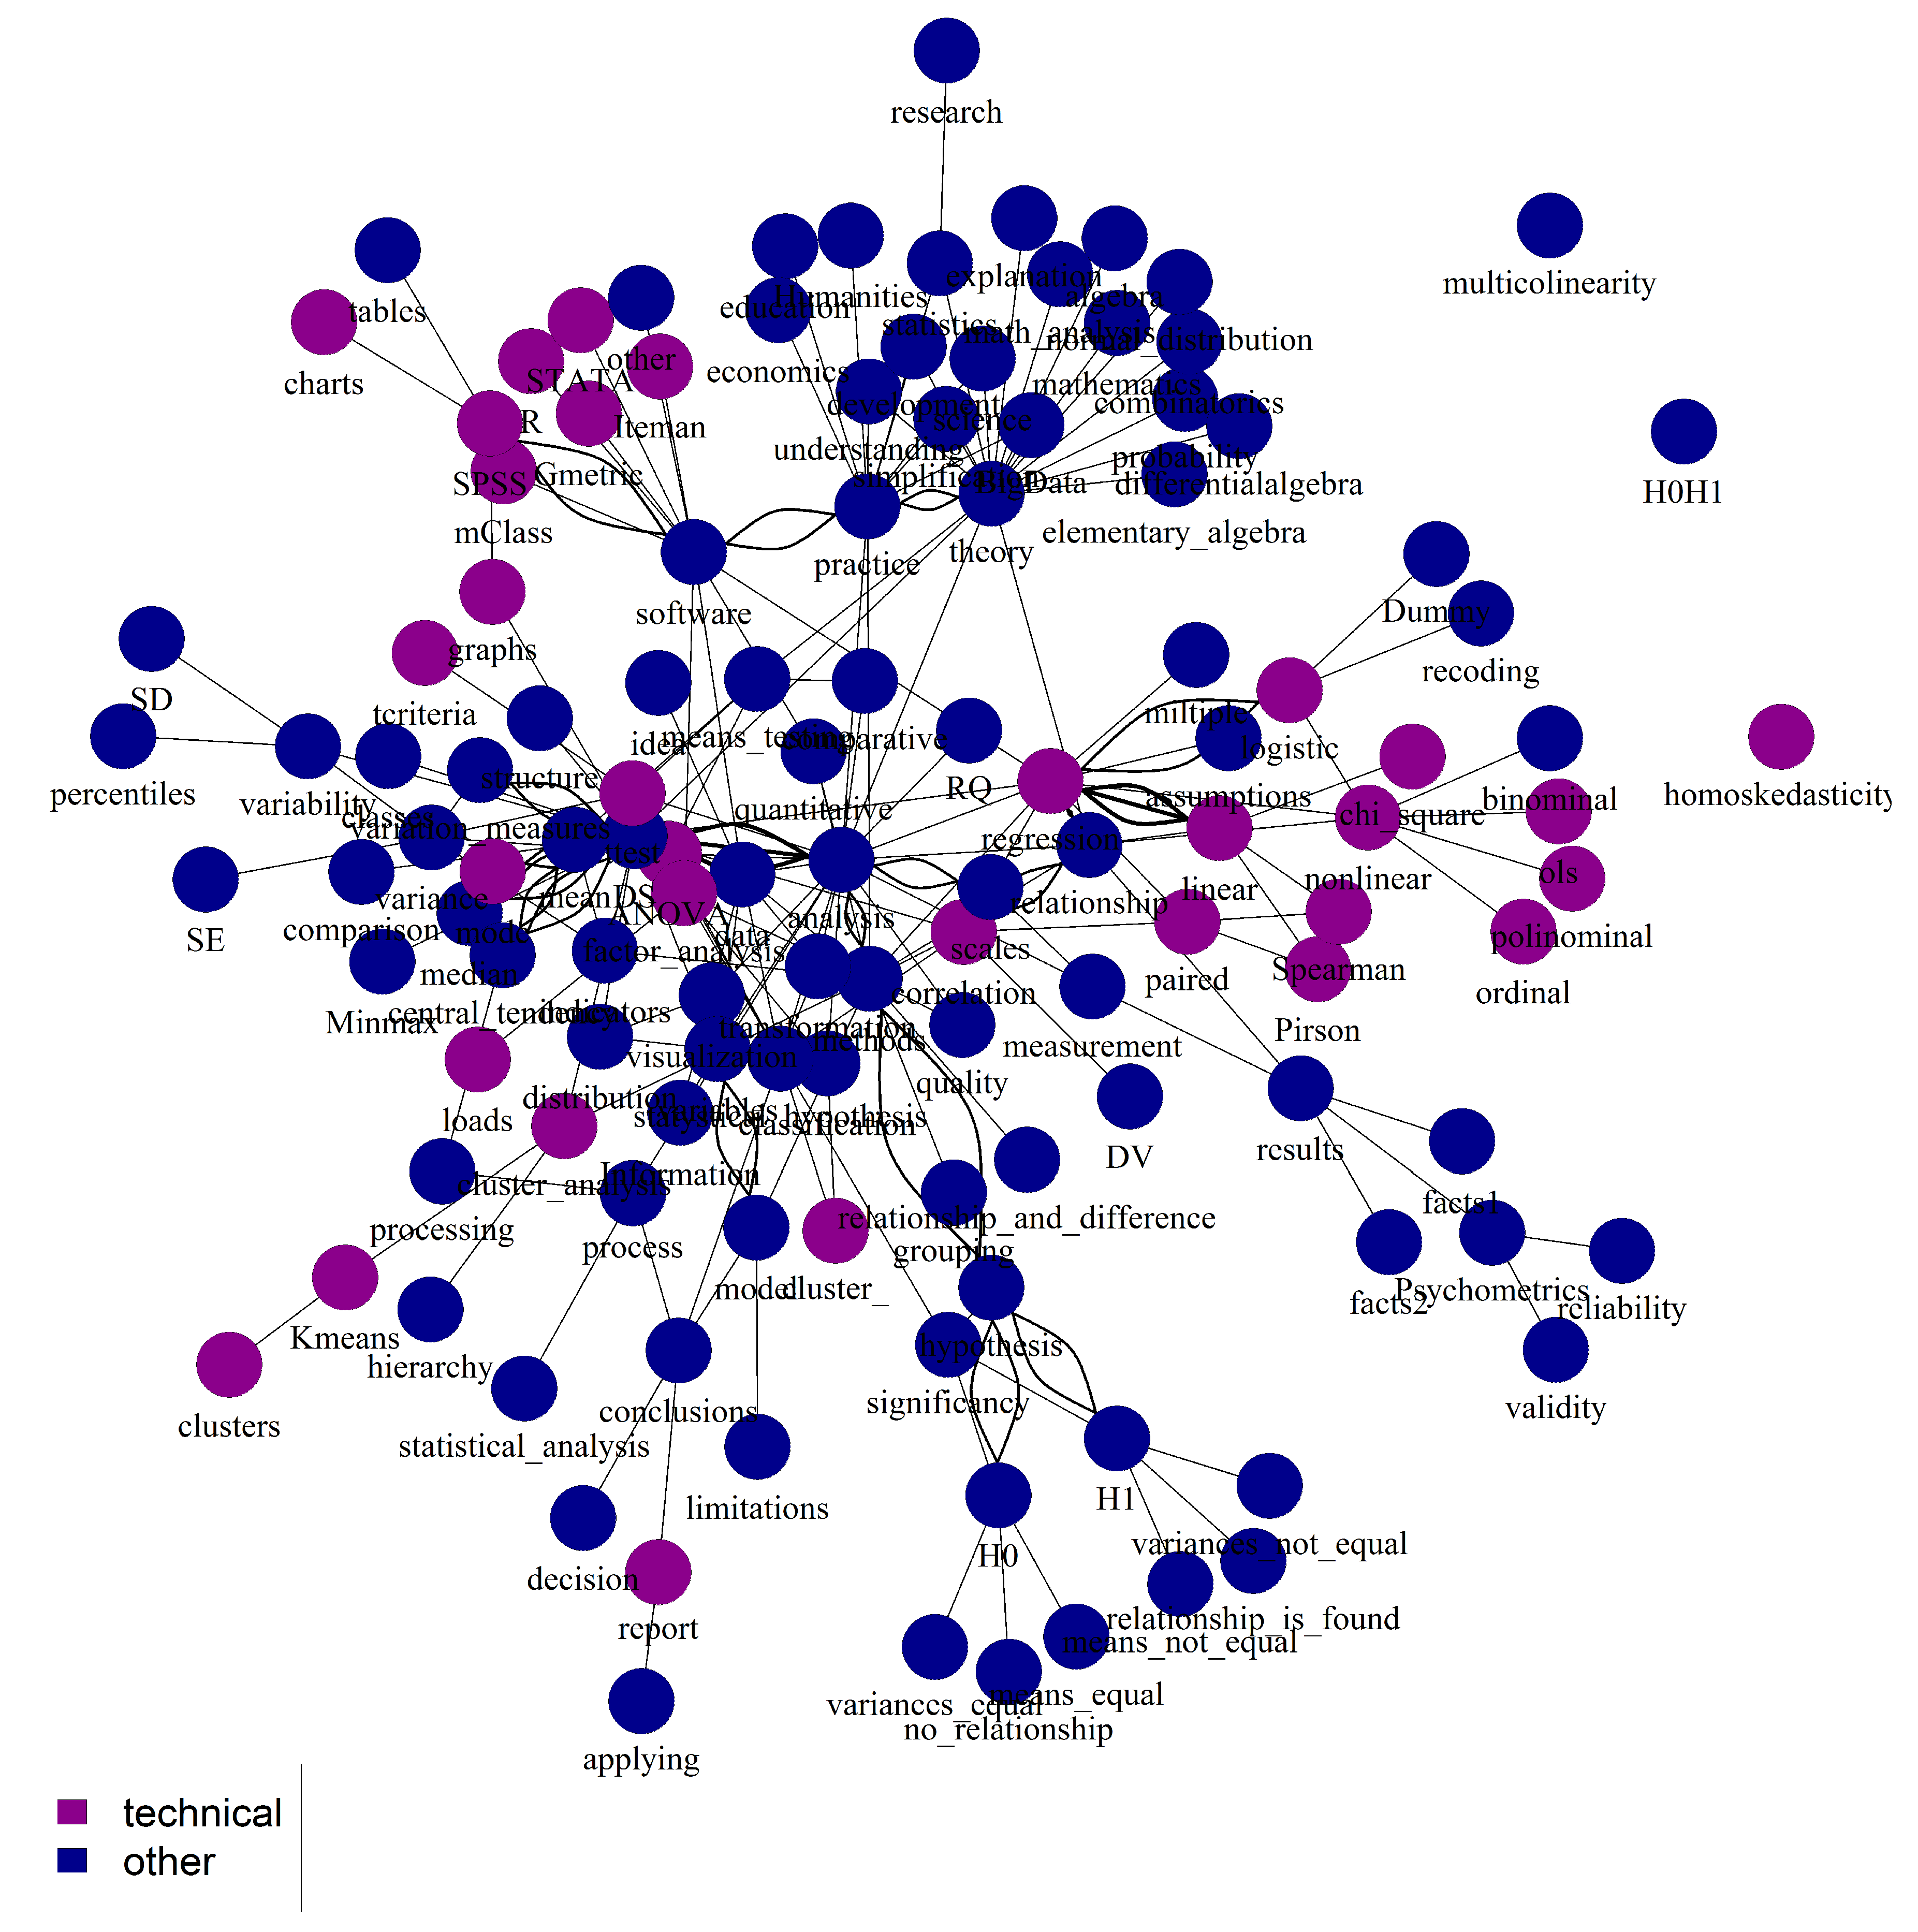
Regarding the content, 25.4% of the 126 unique concepts were technical if the instruction did not include the list of concepts (Figure 1). Two of nine core concepts were not used: “sample” and “population”. The highest closeness values were obtained for three topics. The first was abstract statistics and its three core concepts: “data”, “statistical analysis”, “methods”, “practice”, “descriptive statistics” and “results”. The second consisted of terms which are not related to statistics and data analysis directly: “classification”, “development” and “simplifying”. The last and smallest topic that obtained high closeness values was technical statistics: “recoding”, and “tables”, which obtained the highest closeness value within the structure.
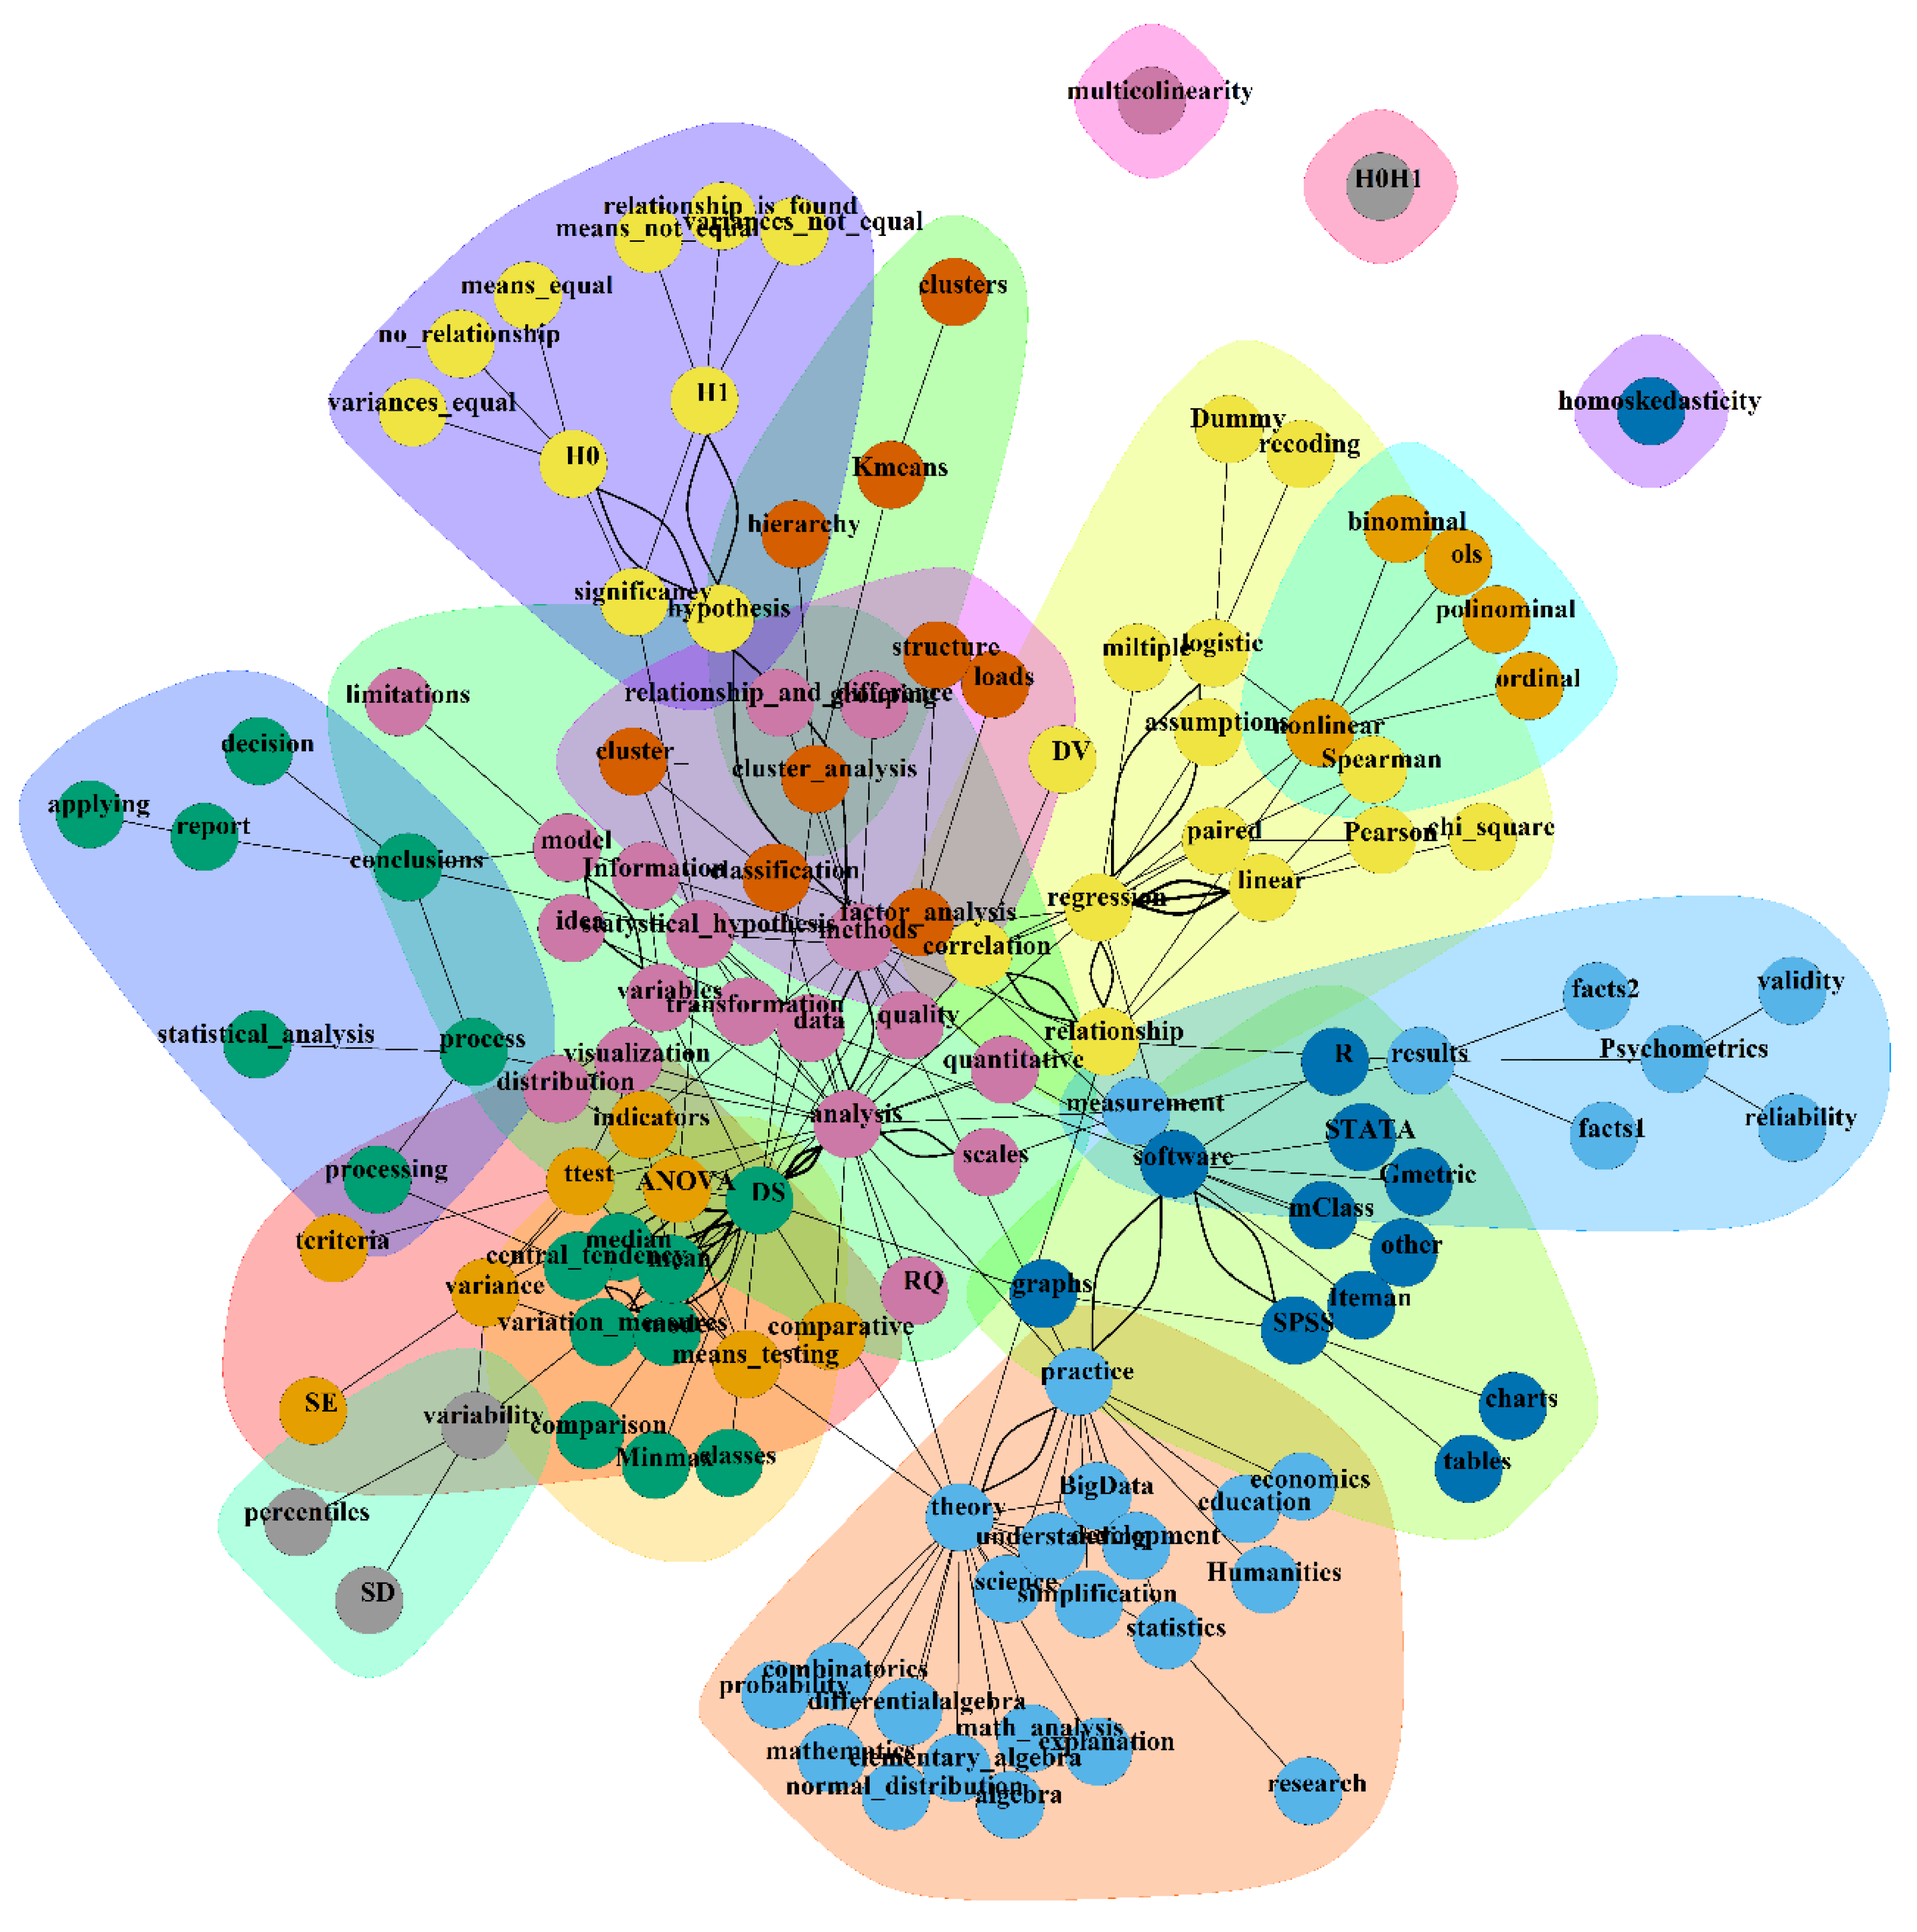
Sixteen clusters were found in the network (Figure 2). The biggest one includes 21 concepts, such as “big data”, “humanities”, “science”, “education”, “algebra”, “theory”, etc. This cluster was characterised as very common knowledge, representing the foundations of statistics. The next cluster consisted of 18 concepts (“research question”, “analysis”, “data”, “method”, “variables” etc.) and described basic definitions in data analysis and some core concepts. The third cluster (14 concepts) reflected the technical side of data analysis: “dependent variable”, “recoding”, “linear”, “Pearson”, “assumption”, etc. It is also important to note clusters consisting of hypothesis testing (“H0”, “H1”, “significance”, “hypothesis”) and “regression” cluster (“nonlinear”, “OLS”, “binominal”).
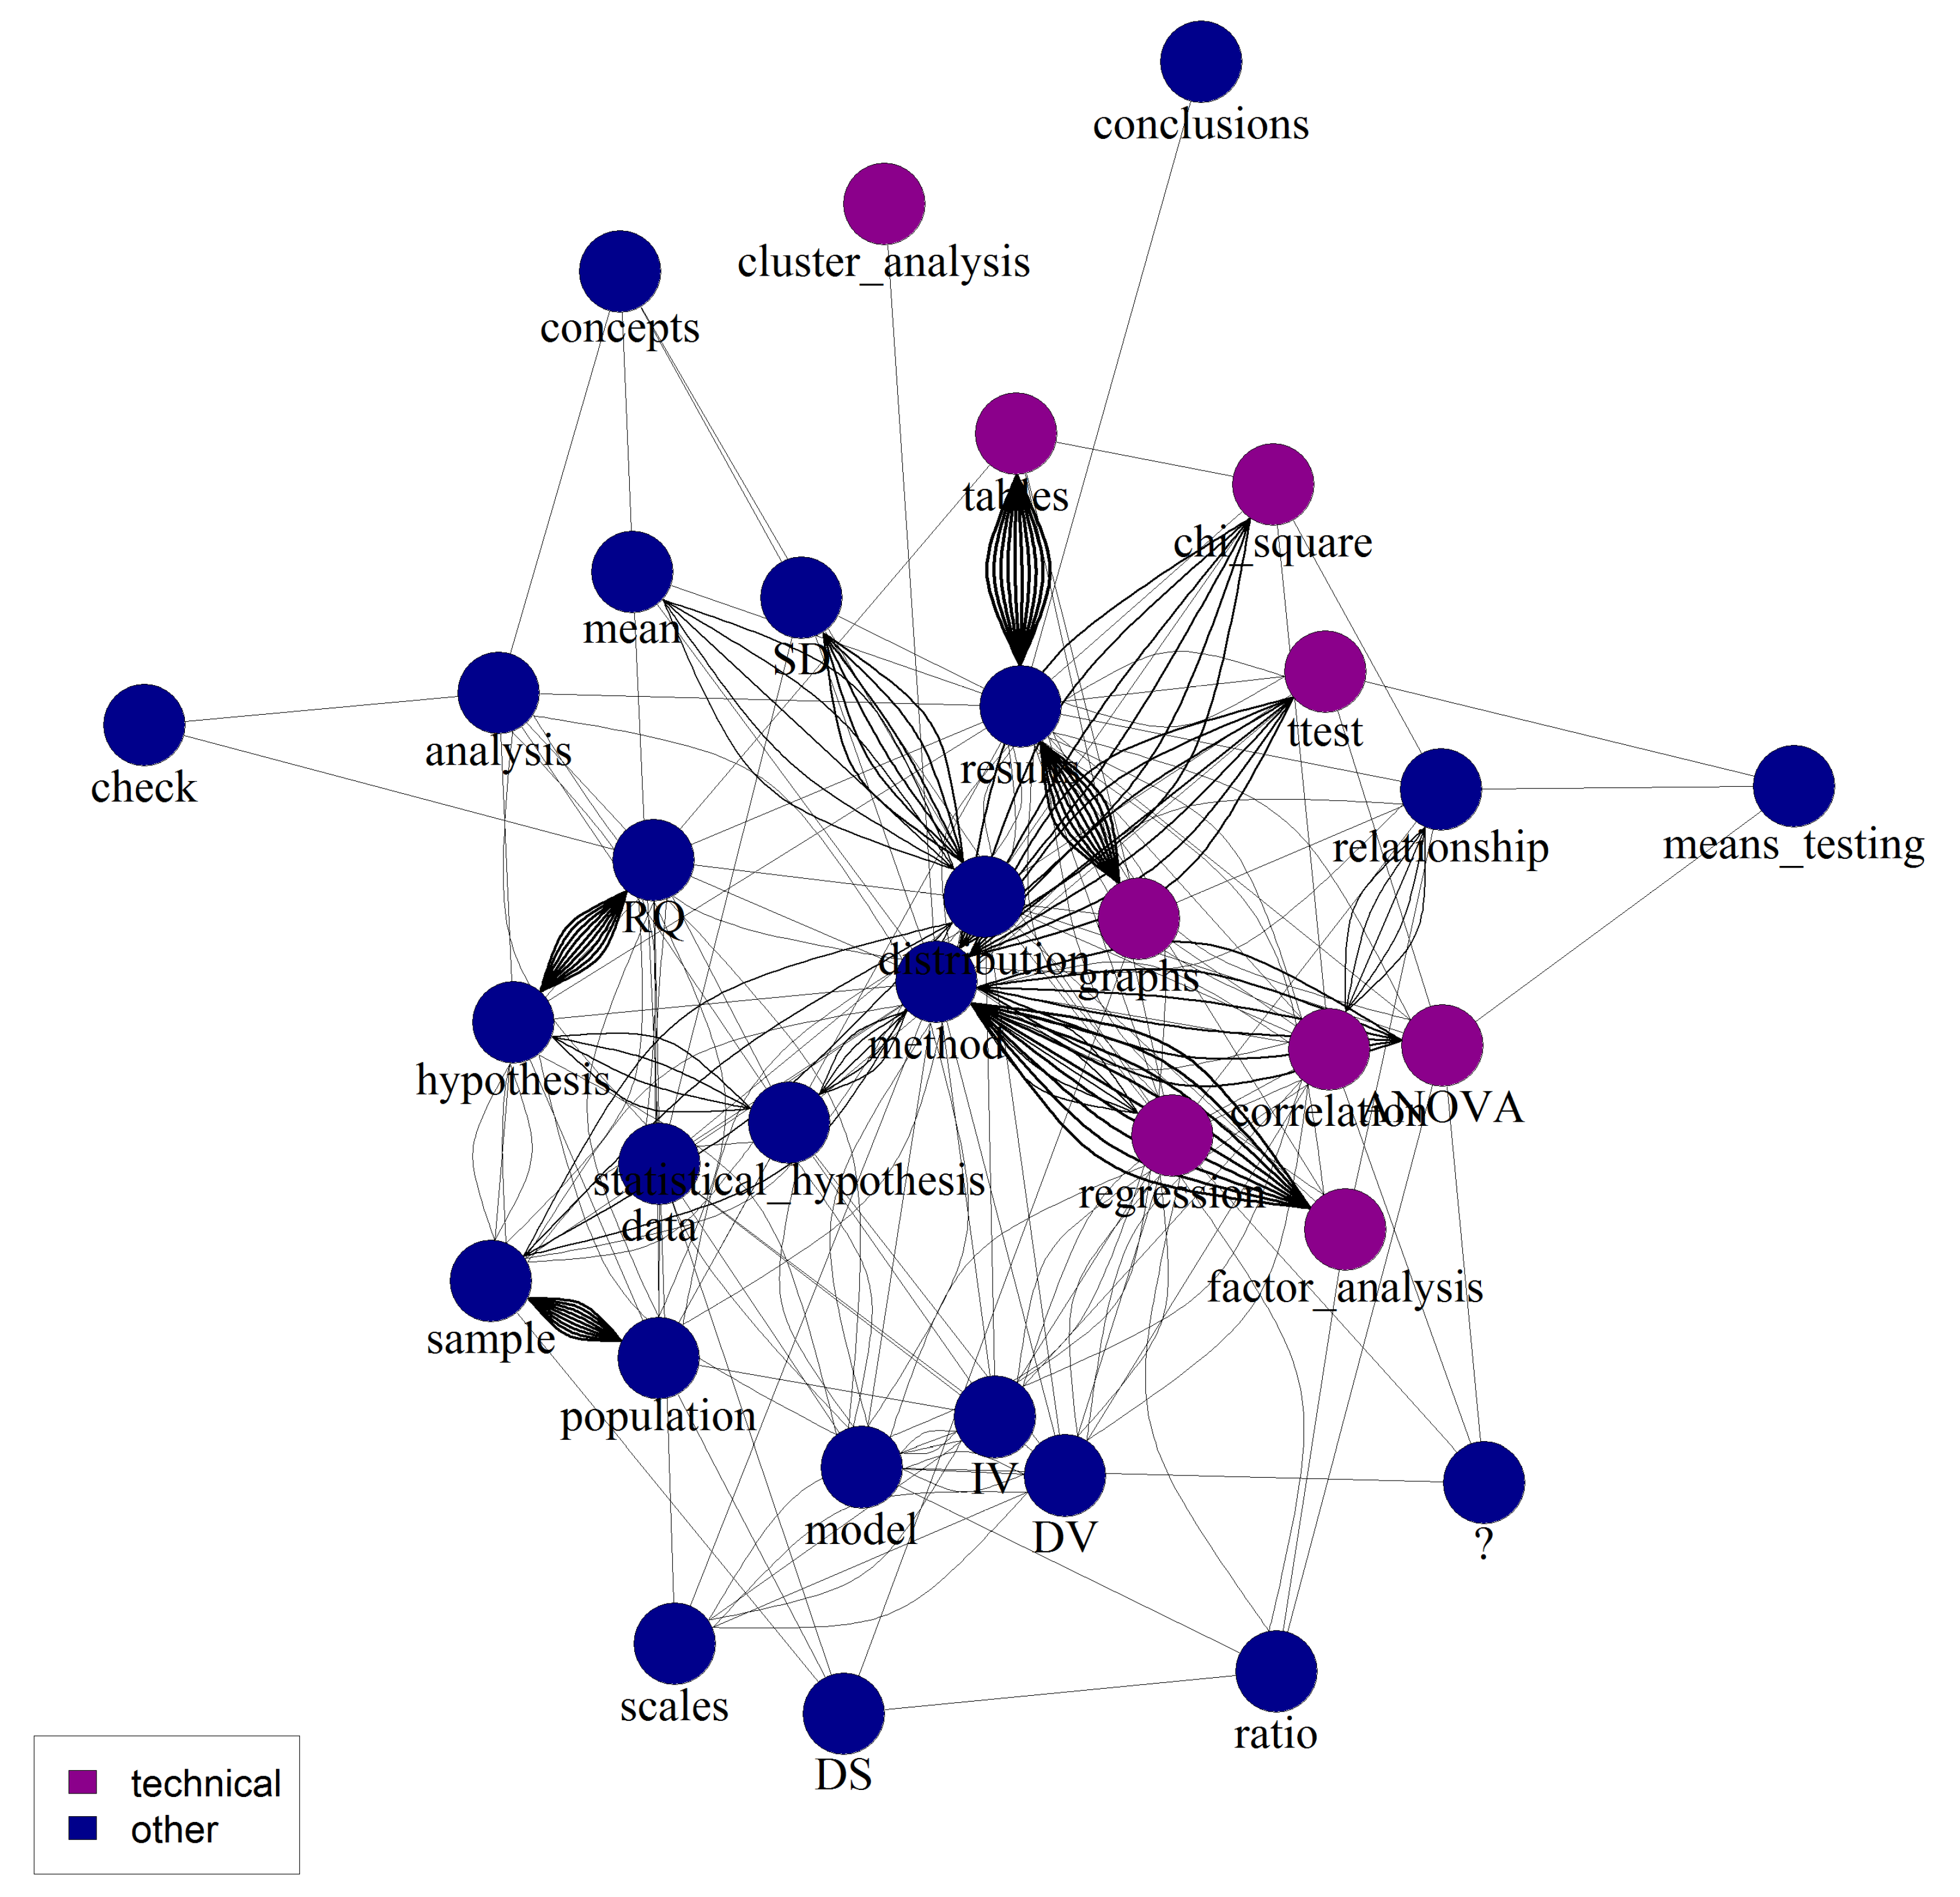
It was observed than when the list of concepts was provided, students tended to build relationships between fundamental statistical concepts (Figure 3). While the percentage of technical concepts was the same—26% of 34 unique concepts (t(148) = 0.12, p = 0.9)—the core concepts (“distribution”, ”data”, ”method” and ”research question”) obtained the highest closeness values, respectively. Students used all core concepts except the one that was not in the list. The concept “statistical significance” was not found: none of the students who emphasised this concept without the list used it when they had the list. At the same time, students added technical concepts (”cluster analysis”, ”ratio”, ”check”), method families (”descriptive statistics”, ”relationship”, ”testing of means”) and abstract concepts (”conclusions”, ”concepts”). Thus, the second research hypothesis was rejected, but the third was confirmed.
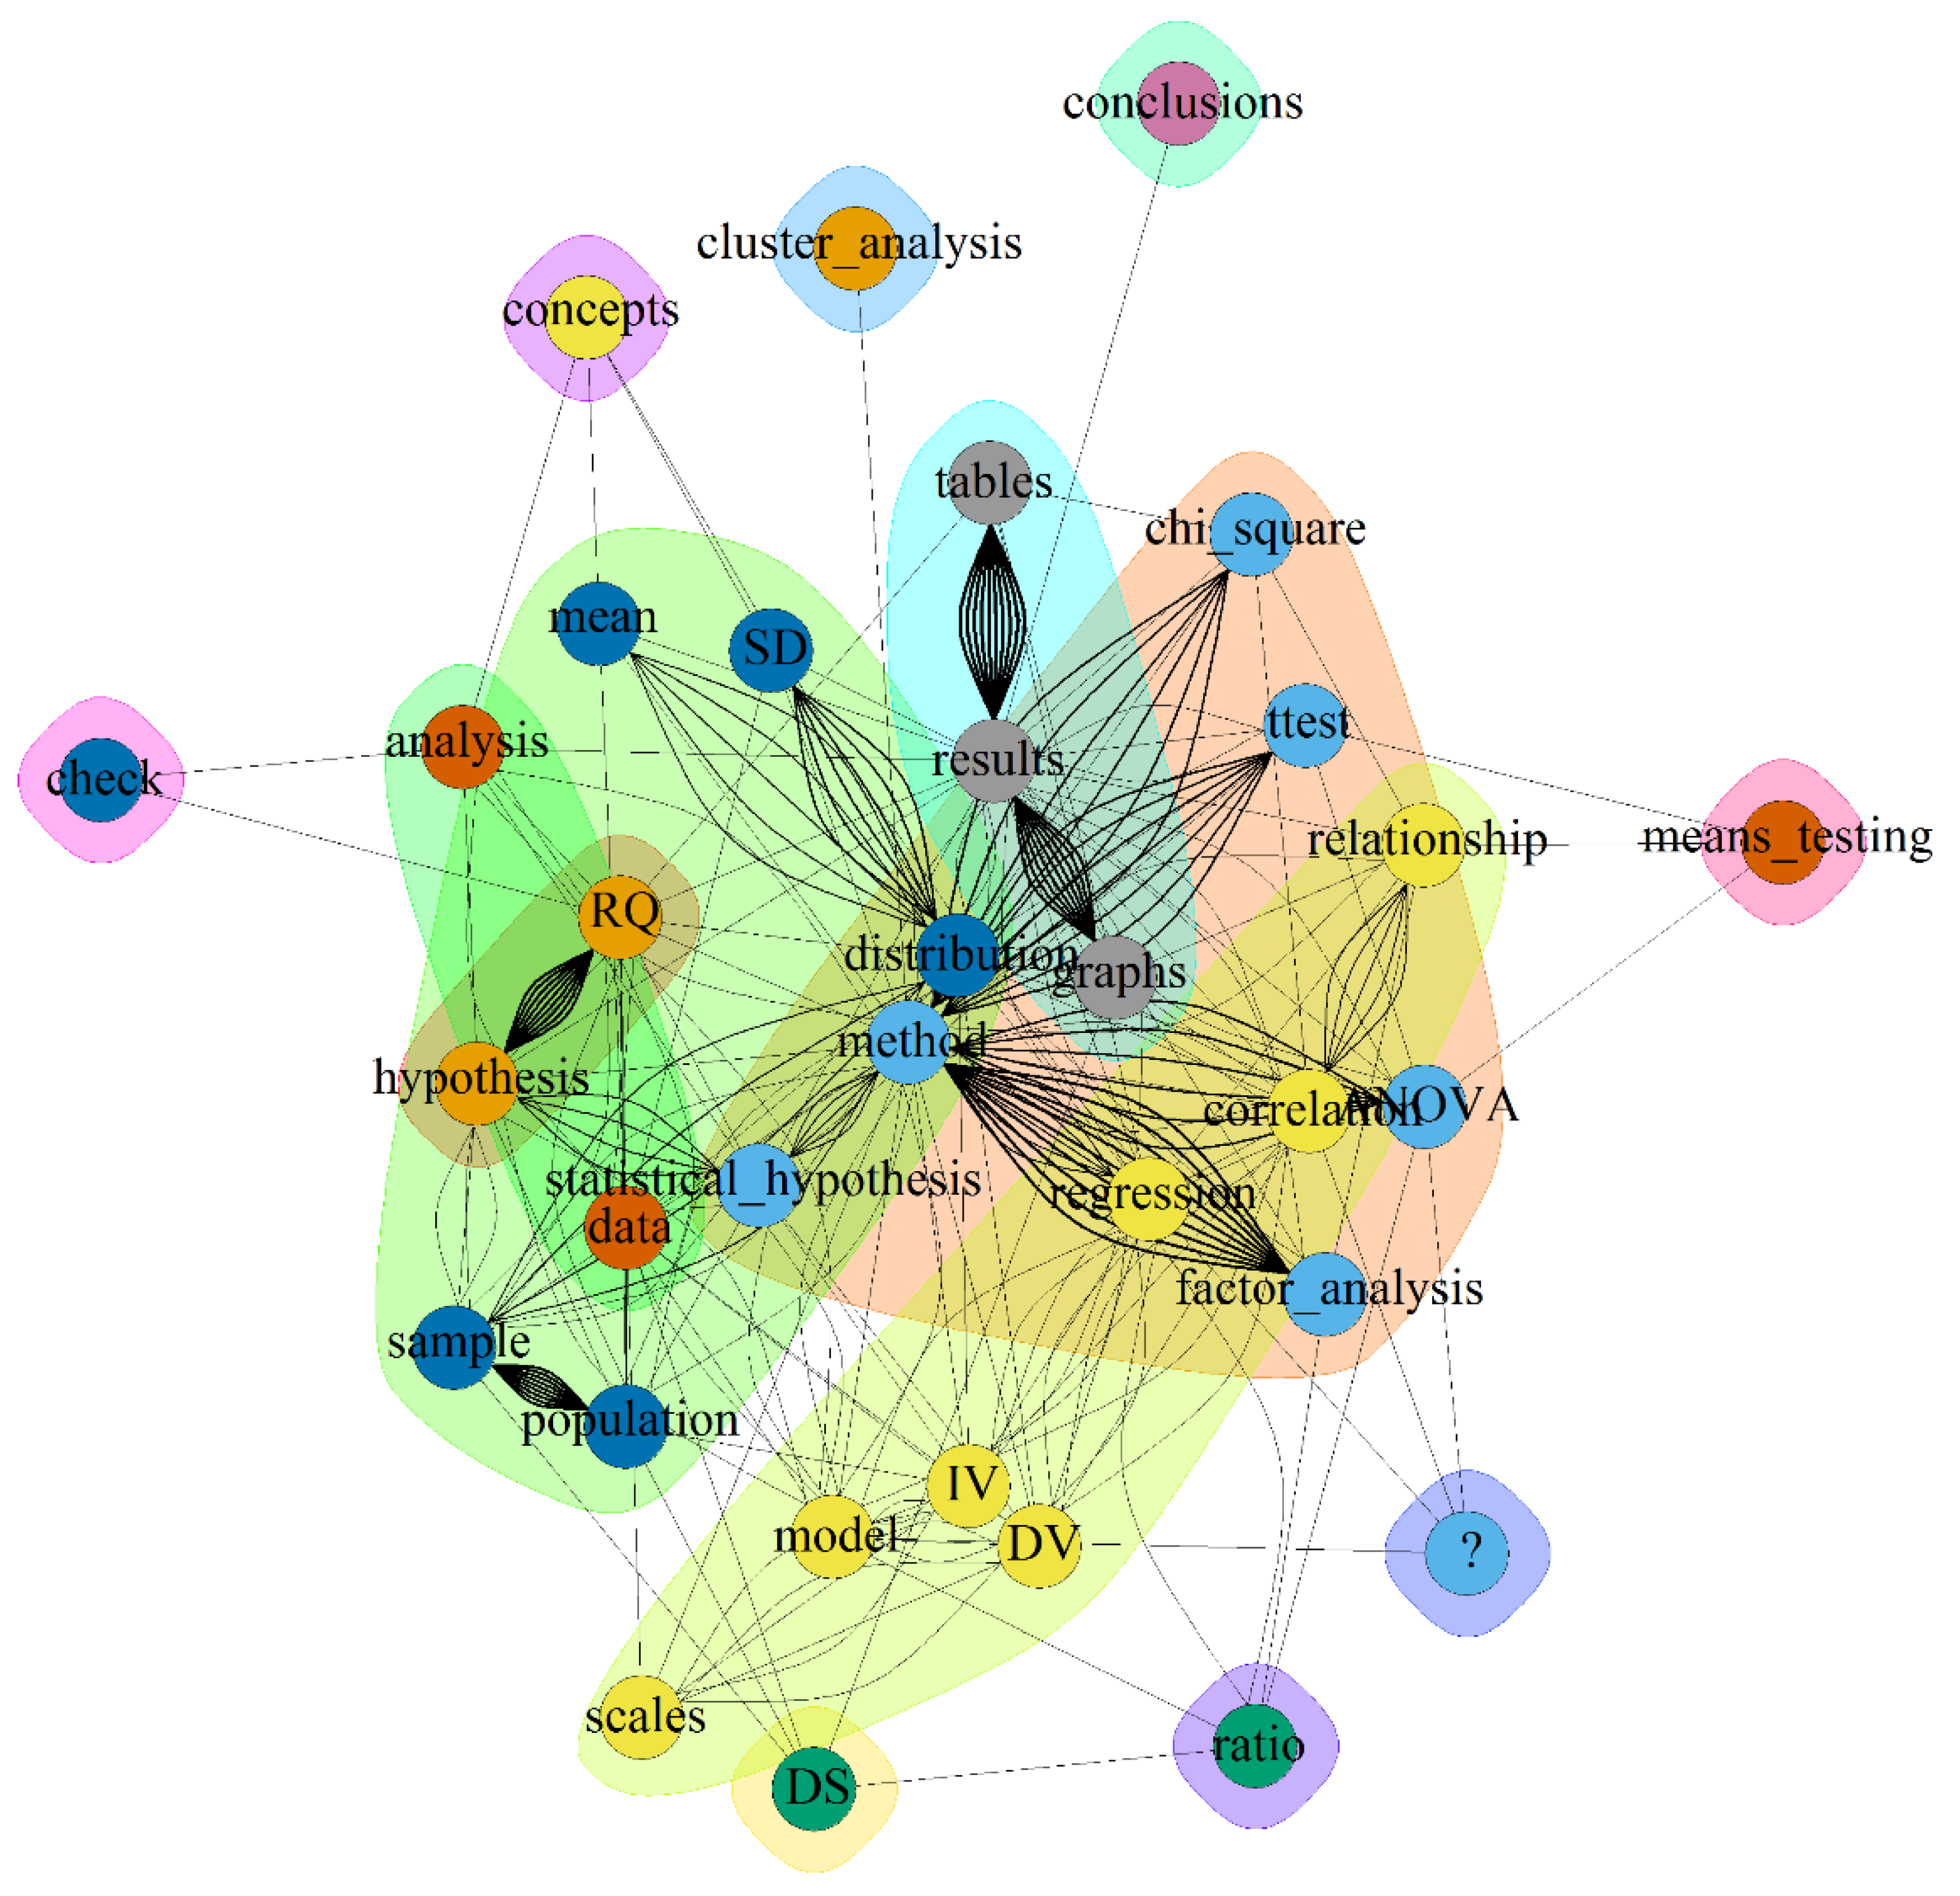
The number of clusters was high for such a low concept number (14) (Figure 4). In other words, the structure was more fragmented, although these fragments were much more connected. The biggest clusters were devoted to specific methods: seven concepts about relationships—“dependent” and “independent” variables, “correlation”, “model”, “regression”, “relationship” and “scales”; six concepts about hypothesis testing—“method”, “ANOVA”, “t-test”, “statistical hypothesis”, “factor analysis”, “chi-square”. Fundamental concepts were almost unrelated to each other.
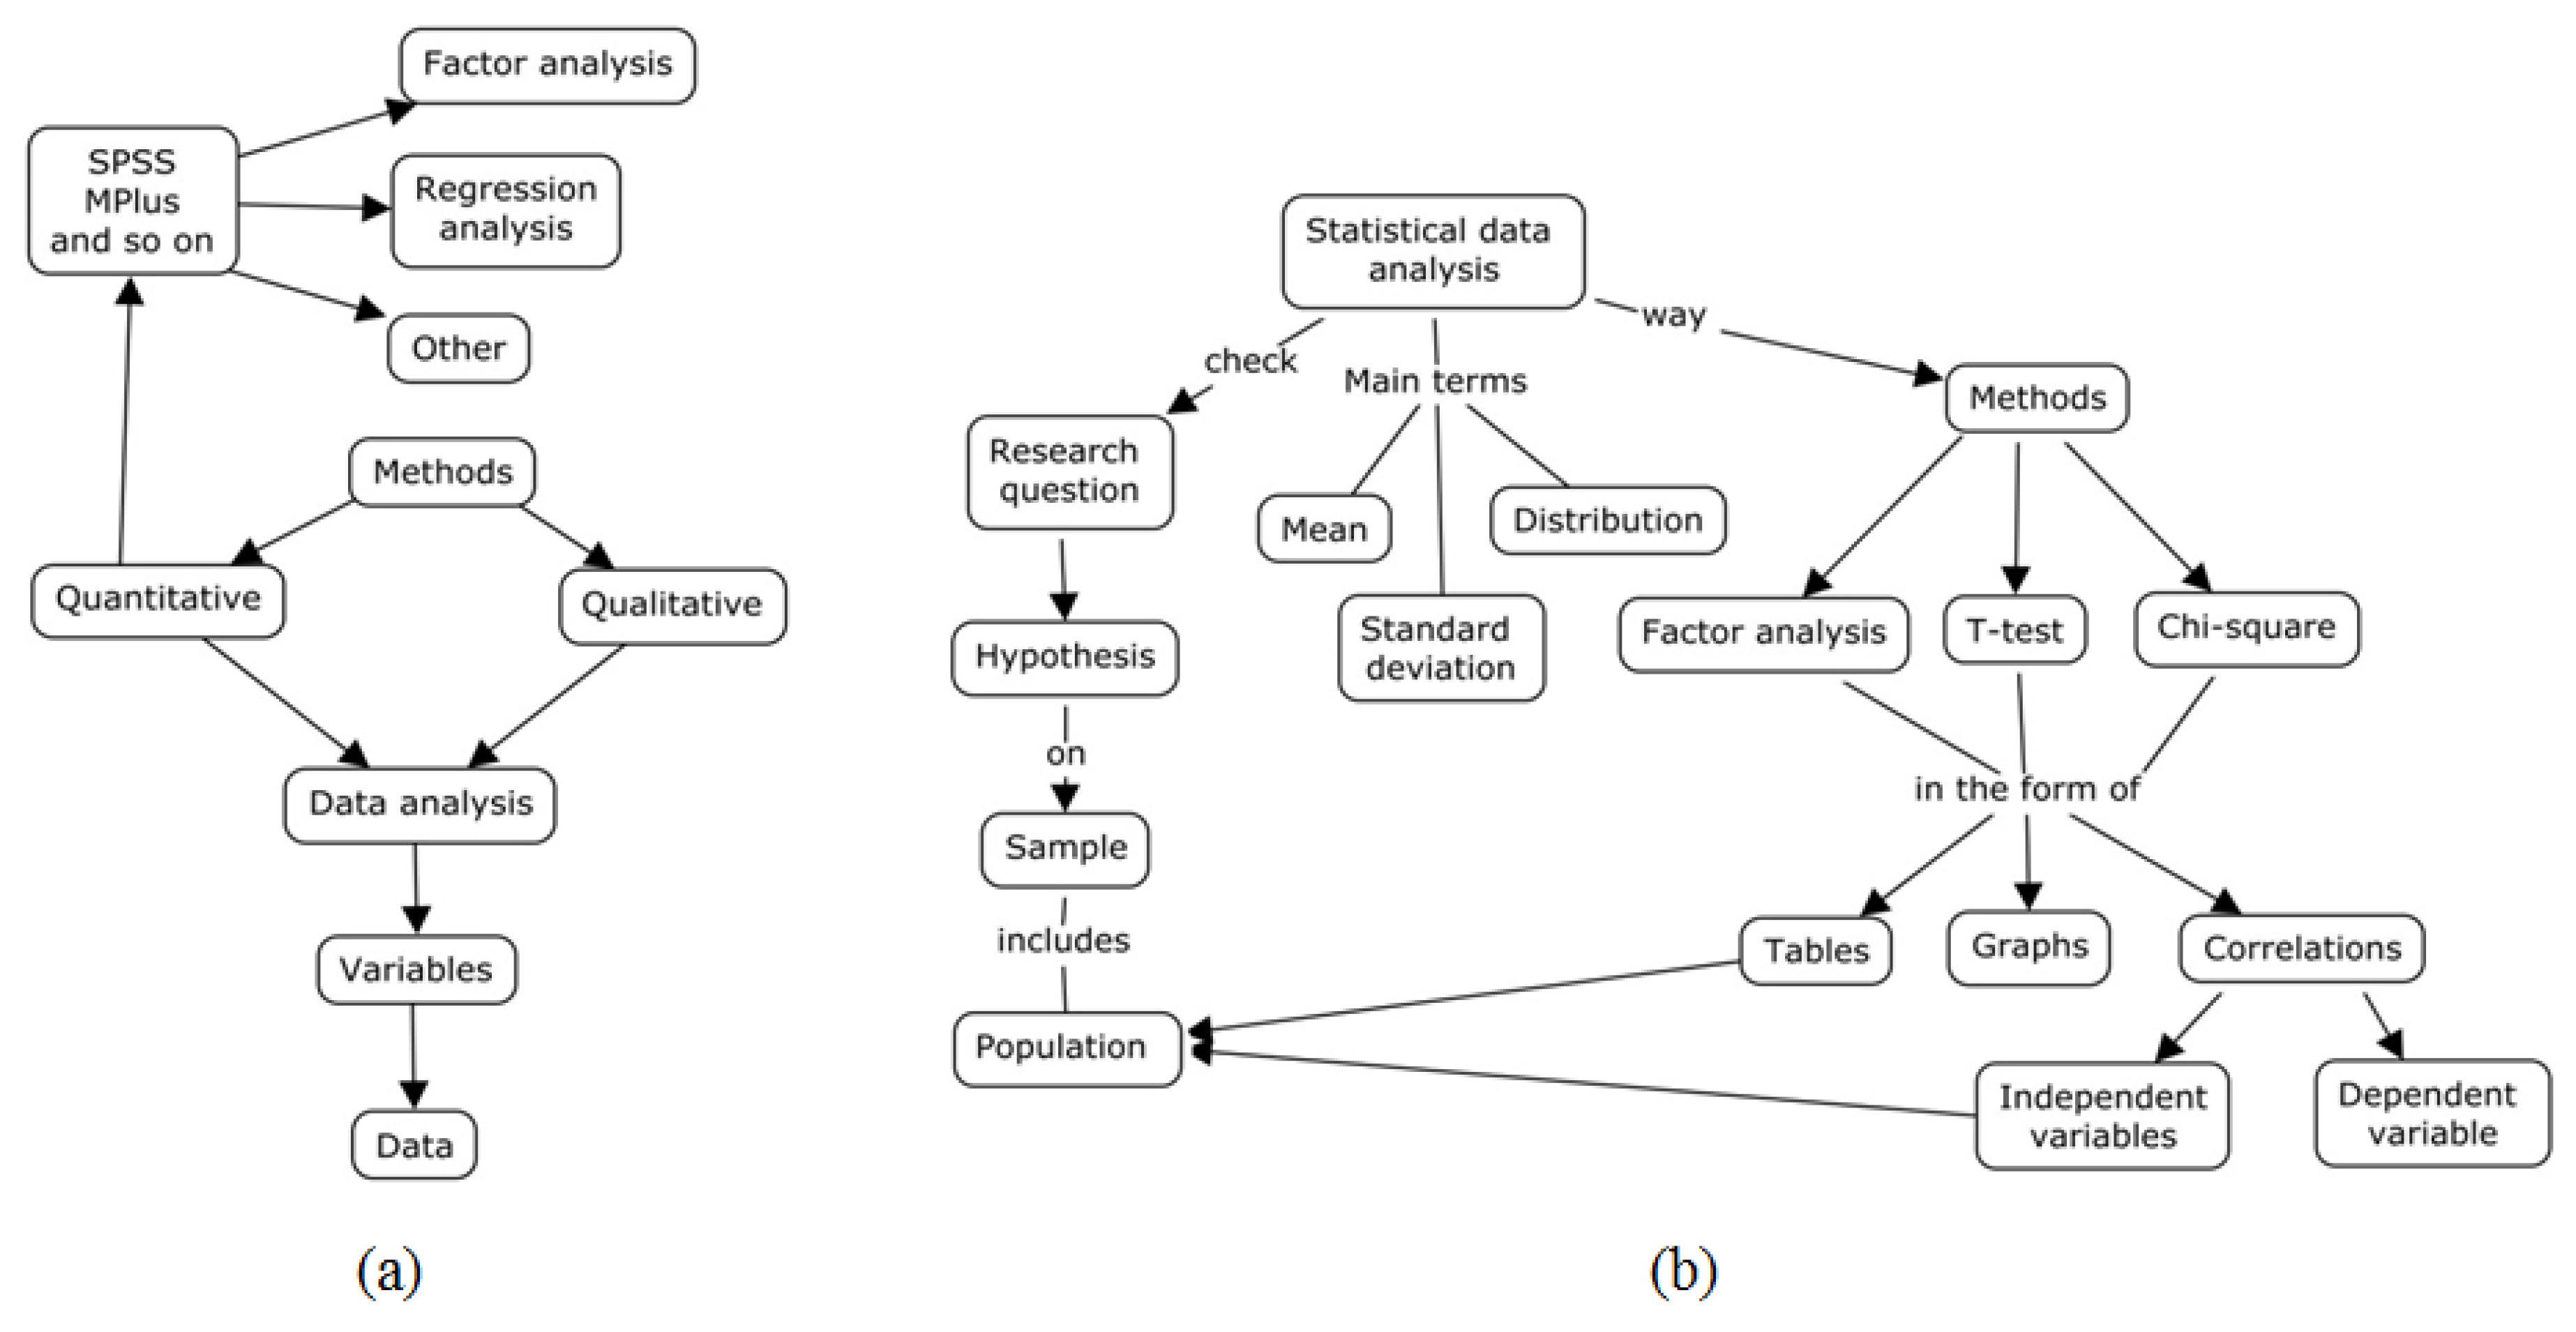
Figure 5 shows a typical example of content differences between CMs without and with the list of concepts. While the first one had a very simple structure and mostly consisted of technical concepts, the second one had a few more crosslinks (e.g., between “Tables” and “Population”) and included more abstract concepts, such as “Research question” and “Hypothesis”.
4. Discussion
In past decades, the knowledge structure assessment has received wide attention in education, psychology, and even statistical research. There has been a great number of studies about CMs as a tool for the knowledge structure assessment and issues with their evaluation. Here, an analysis of two types of concept mapping tasks is provided (with and without a predefined list of concepts). This study contributes to both concept mapping and knowledge structure.
Three hypotheses were stated. The first one assumed no differences in the structure indices of CMs with and without the list of concepts. The results showed that the connectivity of structure was higher for CMs with forced concepts. This is a characteristic of more developed structures [39,57]. The rise of the connectivity was due to the decrease in the number of concepts with only one connection, while the number of concepts with three or more connections remained stable. It means that it was simpler for the respondents to include concepts in the structure, but they still could not see the links between all concepts. The fact that, even in such a small sample, significant differences were found indicates the importance of these differences.
The most valuable findings relate to the content of the maps are derived from the qualitative part of the research. The second hypothesis investigated how students used technical concepts. Previous research shows that using technical concepts (procedural knowledge) is related to less-developed structures and is a characteristic of novices [39,57,58]. This study demonstrated that these concepts were used in the same way regardless of the instruction type, although the fundamental concepts obtained the highest centrality values if respondents used the list. The same groups of technical concepts (regression or hypothesis testing) appeared in both, with and without the list. However, this tendency was not shown for more abstract concepts. It is important to note that respondents did not use very abstract concepts (such as “science”) if they had a list and tended to add middle-level concepts about data analysis. This finding is supported by the literature and could be interpreted as an advantage of using CMs with a list for standardised assessment [8,14].
The third hypothesis was concerned with students’ ability to think critically about concepts and their place within the structure. To test this, one of the core concepts was not included in the list and it was expected that students would still use it. Without the list, students tended to use fundamental and technical concepts in the same way, and kept in mind both. They did not use all core concepts, but they did use quite a few. Using the list, they could miss important concepts, even if they used them before. It is possible that providing a list makes students doubt their views, which is helpful in case of a strictly defined structure or when using CM as a comprehension exercise, but useless and even harmful in cases of incorrect lists and a lack of feedback [15,49].
Overall, it seems that using the list of concepts stimulates students to evaluate each concept and its role in the whole structure more carefully in order to include them in the structure. At the same time, they pay less attention to concepts outside of the list. It is argued that providing the list of concepts does not necessarily lead to a more developed structure [15]. In this study, structure characteristics changed only in terms of middle-level connections and improved, but “list stress” leads to differences in the content.
It is important to note that using CMs from the same students allows the control of respondents’ ability to draw and represent knowledge in general. Both stages of the study were conducted in a short period after the end of the basic course, which also allowed the control of other factors, such as the natural growth of expertise. This small sample, on the one hand, provides an opportunity for rich, qualitative analysis, and, on the other, restricts the use of quantitative methods. This part of the research may be considered as a rather preliminary pilot study. Despite this, some effect sizes were big enough to be detected.
Despite some limitations, the present study provides a better understanding of how students organise their knowledge and possibilities for concept mapping for knowledge structure evaluation. Taken together, these findings could bring insights for further research of CMs. The investigation of CM content is a very promising area of research and methodology is developing in this direction [49]. The network theory provides a well-established approach for measuring structural aspects, such as connectivity, which allows us to consider CMs as standardised objective measurement instruments. Moreover, these results may also help educators who use CMs in their professional practices. In this field, further research could be dedicated to using different types of CM tasks for various purposes, e.g., formative and summative assessment.
Funding
The article was prepared within the framework of the HSE University Basic Research Program and funded by the Russian Academic Excellence Project ‘5-100’
Conflicts of Interest
The author declares no conflict of interest.
Appendix A
Instruction 1 – without the list of concepts
Thank you for participating in the study!
Please read carefully the instructions for concept map construction.
Construct a conceptual map on the topic “Statistical Data Analysis”. You can use any terms and concepts and combine them as you see fit. Do not try to cover all topics related to statistics, but reflect the key, in your opinion, elements necessary for understanding what a statistical analysis of data is, what it consists of and how it is implemented. Use a blank sheet and pen or pencil.
Please label each link between the concepts.
Instruction 2 – with the list of concepts
Thank you for participating in the study!
Please read carefully the instructions for concept map construction.
Construct a conceptual map on the topic “Statistical Data Analysis” using the list of concepts below. You can use any number of concepts from the list and combine them as you see fit. You can add no more than 2 concepts that are not included in the list. For each concept, you can change the number (singular to plural), if required. Use a blank sheet and pen or pencil.
Please label each link between the concepts.
LIST OF CONCEPTS
In italics: technical concepts highlighted in the Appendix A that, but did were not provide given to respondents.
|
|
|
|
|
|
|
|
|
|
|
|
|
|
|
|
|
|
|
|
|
|
|
|
|
References
- Ausubel, D.P.; Novak, J.D.; Hanesian, H. Educational Psychology: A Cognitive View; Holt, Rinehart and Winston: New York, NY, USA, 1978; ISBN 978-0-03-089951-5. [Google Scholar]
- Novak, J.D.; Gowin, B. Learning How to Learn; reprinted; Cambridge Univ. Press: Cambridge, UK, 1999; ISBN 978-0-521-31926-3. [Google Scholar]
- Novak, J.D. Concept mapping: A useful tool for science education. J. Res. Sci. Teach. 1990, 27, 937–949. [Google Scholar] [CrossRef]
- Nesbit, J.C.; Adesope, O.O. Learning with concept and knowledge maps: A meta-analysis. Rev. Educ. Res. 2006, 76, 413–448. [Google Scholar] [CrossRef] [Green Version]
- Hattie, J. Visible Learning: A Synthesis of over 800 Meta-Analyses Relating to Achievement; Reprinted; Routledge: London, UK, 2010; ISBN 978-0-415-47618-8. [Google Scholar]
- Schroeder, N.L.; Nesbit, J.C.; Anguiano, C.J.; Adesope, O.O. Studying and Constructing Concept Maps: A Meta-Analysis. Educ. Psychol. Rev. 2018, 30, 431–455. [Google Scholar] [CrossRef] [Green Version]
- Strautmane, M. Concept map-based knowledge assessment tasks and their scoring criteria: An overview. In Proceedings of the Fifth International Conference on Concept Mapping, Valletta, Malta, 17–20 September 2012. [Google Scholar]
- Ruiz-Primo, M.A.; Shavelson, R.J. Problems and issues in the use of concept maps in science assessment. J. Res. Sci. Teach. 1996, 33, 569–600. [Google Scholar] [CrossRef]
- Watson, M.K.; Pelkey, J.; Noyes, C.R.; Rodgers, M.O. Assessing Conceptual Knowledge Using Three Concept Map Scoring Methods. J. Eng. Educ. 2016, 105, 118–146. [Google Scholar] [CrossRef]
- Ruiz-Primo, M.A. Examining concept maps as an assessment tool. In Proceedings of the First International Conference on Concept Mapping, Pamplona, Spain, 14–17 September 2004; Volume 1, pp. 555–562. [Google Scholar]
- Anohina-Naumeca, A. Determining the Set of Concept Map Based Tasks for Computerized Knowledge Self-Assessment. Procedia Soc. Behav. Sci. 2012, 69, 143–152. [Google Scholar] [CrossRef] [Green Version]
- Ruiz-Primo, M.A.; Schultz, S.E.; Li, M.; Shavelson, R.J. Comparison of the reliability and validity of scores from two concept-mapping techniques. J. Res. Sci. Teach. 2001, 38, 260–278. [Google Scholar] [CrossRef]
- Yin, Y.; Vanides, J.; Ruiz-Primo, M.A.; Ayala, C.C.; Shavelson, R.J. Comparison of two concept-mapping techniques: Implications for scoring, interpretation, and use. J. Res. Sci. Teach. 2005, 42, 166–184. [Google Scholar] [CrossRef] [Green Version]
- Derbentseva, N.; Safayeni, F.; Cañas, A.J. Concept maps: Experiments on dynamic thinking. J. Res. Sci. Teach. 2007, 44, 448–465. [Google Scholar] [CrossRef]
- Cañas, A.J.; Novak, J.D.; Reiska, P. Freedom vs. Restriction of Content and Structure during Concept Mapping-possibilities and Limitations for Construction and Assessment. In Proceedings of the Fifth International Conference on Concept Mapping, Valletta, Malta, 17–20 September 2012. [Google Scholar]
- Doorn, D.J.; O’Brien, M. Assessing the Gains from Concept Mapping in Introductory Statistics. Int. J. Scholarsh. Teach. Learn. 2007, 1, n2. [Google Scholar] [CrossRef]
- Lavigne, N.C.; Salkind, S.J.; Yan, J. Exploring college students’ mental representations of inferential statistics. J. Math. Behav. 2008, 27, 11–32. [Google Scholar] [CrossRef]
- Witmer, J.A. Concept maps in introductory statistics. Teach. Stat. 2016, 38, 4–7. [Google Scholar] [CrossRef]
- Piaget, J. Part I: Cognitive development in children: Piaget development and learning. J. Res. Sci. Teach. 1964, 2, 176–186. [Google Scholar] [CrossRef]
- Vygotsky, L. Myshlenie I Rech; Natsional’noe obrazovanie: Moscow, Russia, 1982; Volume 2. [Google Scholar]
- Howe, A.C. Development of science concepts within a Vygotskian framework. Sci. Educ. 1996, 80, 35–51. [Google Scholar] [CrossRef]
- Hedges, H. Vygotsky’s phases of everyday concept development and the notion of children’s “working theories”. Learn. Cult. Soc. Interact. 2012, 1, 143–152. [Google Scholar] [CrossRef]
- Novak, J.D. Meaningful learning: The essential factor for conceptual change in limited or inappropriate propositional hierarchies leading to empowerment of learners. Sci. Educ. 2002, 86, 548–571. [Google Scholar] [CrossRef] [Green Version]
- Mcclure, J.R.; Sonak, B.; Suen, H.K. Concept map assessment of classroom learning: Reliability, validity, and logistical practicality. J. Res. Sci. Teach. 1999, 36, 475–492. [Google Scholar] [CrossRef] [Green Version]
- Wallace, J.D.; Mintzes, J.J. The concept map as a research tool: Exploring conceptual change in biology. J. Res. Sci. Teach. 1990, 27, 1033–1052. [Google Scholar] [CrossRef]
- Stoddart, T.; Abrams, R.; Gasper, E.; Canaday, D. Concept maps as assessment in science inquiry learning—A report of methodology. Int. J. Sci. Educ. 2000, 22, 1221–1246. [Google Scholar] [CrossRef]
- Buitrago, M.; Chiappe, A. Representation of knowledge in digital educational environments: A systematic review of literature. Aust. J. Educ. Technol. 2019, 35, 35. [Google Scholar] [CrossRef]
- Richmond, S.S.; Defranco, J.F.; Jablokow, K. A set of guidelines for the consistent assessment of concept maps. Int. J. Eng. Educ. 2014, 30, 1072–1082. [Google Scholar]
- Hay, D.; Wells, H.; Kinchin, I. Quantitative and qualitative measures of student learning at university level. High. Educ. 2008, 56, 221–239. [Google Scholar] [CrossRef] [Green Version]
- Jablokow, K.W.; DeFranco, J.F.; Richmond, S.S.; Piovoso, M.J.; Bilén, S.G. Cognitive Style and Concept Mapping Performance: Cognitive Style and Concept Mapping Performance. J. Eng. Educ. 2015, 104, 303–325. [Google Scholar] [CrossRef]
- Kinchin, I.M.; Hay, D.B.; Adams, A. How a qualitative approach to concept map analysis can be used to aid learning by illustrating patterns of conceptual development. Educ. Res. 2000, 42, 43–57. [Google Scholar] [CrossRef]
- Anohina, A.; Grundspenkis, J. Scoring concept maps: An overview. In Proceedings of the International Conference on Computer Systems and Technologies and Workshop for PhD Students in Computing—CompSysTech ’09; ACM Press: Ruse, Bulgaria, 2009; p. 1. [Google Scholar]
- Roberts, L. Using concept maps to measure statistical understanding. Int. J. Math. Educ. Sci. Technol. 1999, 30, 707–717. [Google Scholar] [CrossRef]
- Marzetta, K.; Mason, H.; Wee, B. ‘Sometimes They Are Fun and Sometimes They Are Not’: Concept Mapping with English Language Acquisition (ELA) and Gifted/Talented (GT) Elementary Students Learning Science and Sustainability. Educ. Sci. 2018, 8, 13. [Google Scholar] [CrossRef] [Green Version]
- Frerichs, L.; Young, T.L.; Dave, G.; Stith, D.; Corbie-Smith, G.; Hassmiller Lich, K. Mind maps and network analysis to evaluate conceptualization of complex issues: A case example evaluating systems science workshops for childhood obesity prevention. Eval. Program Plan. 2018, 68, 135–147. [Google Scholar] [CrossRef]
- Ifenthaler, D.; Masduki, I.; Seel, N.M. The mystery of cognitive structure and how we can detect it. Instr. Sci. 2011, 39, 41–61. [Google Scholar] [CrossRef]
- Koponen, I.T.; Nousiainen, M. Concept networks in learning: Finding key concepts in learners’ representations of the interlinked structure of scientific knowledge. J. Complex Netw. 2014, 2, 187–202. [Google Scholar] [CrossRef]
- Siew, C.S.Q. Using network science to analyze concept maps of psychology undergraduates. Appl. Cogn. Psychol. 2018, 33, 662–668. [Google Scholar] [CrossRef]
- Tyumeneva, Y.; Kapuza, A.; Vergeles, K. Distinctive Ability of Concept Maps for Assessing Levels of Competence. Pilot study. Vopr. Obraz. Educ. Stud. Mosc. 2017, 4, 150–170. [Google Scholar] [CrossRef]
- Zouaq, A.; Gasevic, D.; Hatala, M. Ontologizing concept maps using graph theory. In Proceedings of the 2011 ACM Symposium on Applied Computing—SAC ’11; ACM Press: TaiChung, Taiwan, 2011; p. 1687. [Google Scholar]
- Lavigne, N.C. Mutually Informative Measures of Knowledge: Concept Maps Plus Problem Sorts in Statistics. Educ. Assess. 2005, 10, 39–71. [Google Scholar] [CrossRef]
- Reise, S.P.; Widaman, K.F.; Pugh, R.H. Confirmatory factor analysis and item response theory: Two approaches for exploring measurement invariance. Psychol. Bull. 1993, 114, 552. [Google Scholar] [CrossRef] [PubMed]
- Hagiuda, N.; Shigemasu, K. Some remarks on the application of factor analysis to ordered categorical data. Shinrigaku Kenkyu 1996, 67, 1–8. [Google Scholar] [CrossRef] [Green Version]
- Henson, R.K.; Roberts, J.K. Use of Exploratory Factor Analysis in Published Research: Common Errors and Some Comment on Improved Practice. Educ. Psychol. Meas. 2006, 66, 393–416. [Google Scholar] [CrossRef] [Green Version]
- Mansolf, M.; Reise, S.P. Case Diagnostics for Factor Analysis of Ordered Categorical Data with Applications to Person-Fit Measurement. Struct. Equ. Model. 2018, 25, 86–100. [Google Scholar] [CrossRef]
- Cauley, K.M. Studying Knowledge Acquisition: Distinctions among Procedural, Conceptual and Logical Knowledge. In Proceedings of the 67th Annual Meeting of the American Educational Research Association, San Francisco, CA, USA, 16–20 April 1986. [Google Scholar]
- Rittle-Johnson, B.; Schneider, M. Developing Conceptual and Procedural Knowledge of Mathematics. In The Oxford Handbook of Numerical Cognition; Oxford University Press: Oxford, UK, 2015. [Google Scholar]
- Sloutsky, V.S.; Yarlas, A.S. Problem Representation in Experts and Novices: Part 2. Underlying Processing Mechanisms. In Proceedings of the 22nd Annual Conference of the Cognitive Science Society, Philadelphia, PA, USA, 13–15 August 2000; pp. 475–480. [Google Scholar]
- Kinchin, I.M.; Möllits, A.; Reiska, P. Uncovering Types of Knowledge in Concept Maps. Educ. Sci. 2019, 9, 131. [Google Scholar] [CrossRef] [Green Version]
- Zieffler, A.; Garfield, J.; Alt, S.; Dupuis, D.; Holleque, K.; Chang, B. What Does Research Suggest About the Teaching and Learning of Introductory Statistics at the College Level? A Review of the Literature. J. Stat. Educ. 2008, 16. [Google Scholar] [CrossRef]
- Tishkovskaya, S.; Lancaster, G.A. Statistical Education in the 21 st Century: A Review of Challenges, Teaching Innovations and Strategies for Reform. J. Stat. Educ. 2012, 20. [Google Scholar] [CrossRef]
- Rumsey, D.J. Statistical Literacy as a Goal for Introductory Statistics Courses. J. Stat. Educ. 2002, 10, 10. [Google Scholar] [CrossRef]
- Garfield, J. The Challenge of Developing Statistical Reasoning. J. Stat. Educ. 2002, 10, 10. [Google Scholar] [CrossRef]
- Landrum, R.E. Core Terms in Undergraduate Statistics. Teach. Psychol. 2005, 32, 249–251. [Google Scholar]
- McKenzie, J.D. Conveying the Core Concepts. In Proceedings of the ASA Proceedings of the Joint Statistical Meeting; American Statistical Association: Alexandria, VA, USA, 2004; pp. 2755–2757. [Google Scholar]
- Newman, M.E.J.; Girvan, M. Finding and evaluating community structure in networks. Phys. Rev. E 2004, 69, 026113. [Google Scholar] [CrossRef] [PubMed] [Green Version]
- Chi, M.T.H.; Feltovich, P.J.; Glaser, R. Categorization and Representation of Physics Problems by Experts and Novices*. Cogn. Sci. 1981, 5, 121–152. [Google Scholar] [CrossRef] [Green Version]
- Lachner, A.; Nückles, M. Bothered by abstractness or engaged by cohesion? Experts’ explanations enhance novices’ deep-learning. J. Exp. Psychol. Appl. 2015, 21, 101–115. [Google Scholar] [CrossRef] [PubMed]
Figure 1.
CM constructed on all CMs without the list of concepts. https://akapuza.github.io/Figure_1.CMs_without_a_list.html
Figure 1.
CM constructed on all CMs without the list of concepts. https://akapuza.github.io/Figure_1.CMs_without_a_list.html

Figure 2.
Clusters for CM extracted from all CMs without the list of concepts.

Figure 3.
CM constructed on all CMs with the list of concepts. https://akapuza.github.io/Figure_3.CMs_with_a_list.html.
Figure 3.
CM constructed on all CMs with the list of concepts. https://akapuza.github.io/Figure_3.CMs_with_a_list.html.

Figure 4.
Clusters for CM extracted from all CMs with the list of concepts.

Figure 5.
An example of maps without (a) and with (b) a list of concepts which were drawn by one respondent.
Figure 5.
An example of maps without (a) and with (b) a list of concepts which were drawn by one respondent.


Table 1.
Means and t-test results for concept map (CM) instruction without and with a list of concepts, as well as the experimental conclusions that can be drawn.
Table 1.
Means and t-test results for concept map (CM) instruction without and with a list of concepts, as well as the experimental conclusions that can be drawn.
| Without the List | With the List | t-Statistic | One-Tailed t-Test (df = 10) | |||
|---|---|---|---|---|---|---|
| Mean | SD | Mean | SD | |||
| Number of concepts | 19.55 | 7.74 | 21.18 | 3.57 | 0.60 | p = 0.28 |
| Number of propositions | 19.64 | 7.68 | 23.73 | 4.76 | 1.31 | p = 0.11 |
| Concepts–proposition ratio | 1.00 | 0.11 | 0.90 | 0.10 | 2.8 | p < 0.01 |
| Number of concepts with one degree | 10.91 | 5.74 | 7.91 | 3.45 | 1.81 | p < 0.05 |
| % of concepts with one degree | 53.60 | 14.29 | 37.58 | 17.10 | 3.18 | p < 0.01 |
| Number of concepts with three or more degrees | 4.73 | 2.45 | 4.64 | 2.69 | 0.07 | p = 0.47 |
| % of concepts with three or more degrees | 24.01 | 6.96 | 21.25 | 10.17 | 0.67 | p = 0.26 |
| Diameter | 5.73 | 1.79 | 7.73 | 2.24 | 2.8 | p < 0.01 |
| Share of diameter | 0.32 | 0.12 | 0.38 | 0.15 | 1.05 | p = 0.16 |
© 2020 by the author. Licensee MDPI, Basel, Switzerland. This article is an open access article distributed under the terms and conditions of the Creative Commons Attribution (CC BY) license (http://creativecommons.org/licenses/by/4.0/).
Share and Cite
MDPI and ACS Style
Kapuza, A. How Concept Maps with and without a List of Concepts Differ: The Case of Statistics. Educ. Sci. 2020, 10, 91. https://0-doi-org.brum.beds.ac.uk/10.3390/educsci10040091
AMA Style
Kapuza A. How Concept Maps with and without a List of Concepts Differ: The Case of Statistics. Education Sciences. 2020; 10(4):91. https://0-doi-org.brum.beds.ac.uk/10.3390/educsci10040091
Chicago/Turabian StyleKapuza, Anastasia. 2020. "How Concept Maps with and without a List of Concepts Differ: The Case of Statistics" Education Sciences 10, no. 4: 91. https://0-doi-org.brum.beds.ac.uk/10.3390/educsci10040091
Note that from the first issue of 2016, this journal uses article numbers instead of page numbers. See further details here.