
Validation of Rubric Evaluation for Programming Education


Department of Computer Science and Engineering, Waseda University, Tokyo 169-8555, Japan
*
Authors to whom correspondence should be addressed.
Educ. Sci. 2021, 11(10), 656; https://0-doi-org.brum.beds.ac.uk/10.3390/educsci11100656
Submission received: 15 September 2021
/
Revised: 8 October 2021
/
Accepted: 15 October 2021
/
Published: 19 October 2021
(This article belongs to the Special Issue The Digitalized K-12 Classroom in the Age of AI, Analytics and IoT)
Abstract
:In evaluating the learning achievement of programming-thinking skills, the method of using a rubric that describes evaluation items and evaluation stages is widely employed. However, few studies have evaluated the reliability, validity, and consistency of the rubrics themselves. In this study, we introduced a statistical method for evaluating the characteristics of rubrics using the goal question metric (GQM) method. Furthermore, we proposed a method for measuring four evaluation results and characteristics obtained from rubrics developed using this statistical method. Moreover, we showed and confirmed the consistency and validity of the statistical method using the GQM method of the resulting developed rubrics. We show how to verify the consistency and validity of the rubric using the GQM method.
1. Introduction
Systematic evaluation of the learning achievement of programming-thinking skills for young people is important in programming education. Multiple evaluation criteria have been considered as methods for evaluating programming-thinking skills. Among them, rubrics have been proposed as a method for evaluating the learning achievement of programming-thinking skills [1,2,3,4].
A rubric is a method for evaluating learning achievement that enables a step-by-step evaluation by setting evaluation criteria and evaluation items. Using rubrics, the evaluator can objectively and consistently evaluate.
Rubrics exist for several assessment targets and functions depending on the class format and content. There are rubrics for simple multiple-choice tests in classes, rubrics for free programming tasks created by students, and rubrics that automate the evaluation itself. However, few studies have considered the characteristics of these rubrics themselves and have evaluated and discussed them. It is difficult to improve the rubrics, consider the generality of the evaluation, and determine whether the rubrics can be used in various situations without considering the characteristics of these rubrics. Therefore, we examined the characteristics of a rubric to evaluate achievements in programming education and developed a statistical method to quantitatively evaluate it. Furthermore, we evaluated and analyzed rubrics and the results of the evaluation of programming education in those rubrics.
The research questions (RQs) based on this objective are listed below:
- RQ1: How do we identify statistical methods to assess the properties of rubrics?
- RQ2: How can rubrics be evaluated and analyzed to identify improvements?
- RQ3: By evaluating and analyzing the rubrics, can we confirm the generality of the evaluation?
Two contributions emerge from solving this research question. First, a system of evaluation and analysis of the rubrics themselves can be constructed, thereby facilitating improvement. Second, clarifying the characteristics of rubrics facilitates the creation of new rubrics with evaluation generality.
Section 1 provides an overview of the study and RQ. The remainder of this study is arranged as follows: Section 2 presents the background of the study. Section 3 presents how to evaluate the properties of the rubric. Section 4 describes the experiment and evaluation method. Section 5 presents a discussion of this study. Section 6 discusses related research. Section 7 presents a summary of this study and future works.
2. Backgrounds
2.1. Definition and Required Properties of Rubrics
This section defines the rubric. First, a rubric is a useful measure for assessing student achievement by describing and defining aims and achievement levels [1].
Rubrics exist for several assessment targets and require assessment functions depending on the class format and content. There are rubrics for simple multiple-choice tests in class, free programming assignments created by students, and automating the evaluation itself. With increase in various functions, the most important function of rubrics is evaluation; however, few studies have considered and evaluated the characteristics of the evaluation that rubrics perform. Therefore, we will evaluate the characteristics required of rubrics.
There are two required characteristics of rubrics. First, reliability to correctly evaluate the programming thinking ability as per the learning objectives regardless of the evaluation target. It is necessary to evaluate the learning achievement of programming-thinking skills for each evaluation item by following the evaluation items and stages [1] as per the evaluation purpose. Second, the consistency of the evaluation using rubrics. Using a rubric, there should be no difference and consistency in the evaluation regardless of the evaluator or evaluation target [2]. These properties produced the quality characteristics of rubrics and our statistical evaluation method.
2.2. Evaluating the Reliability of Rubrics
Kaiser–Meyer–Olkin (KMO) is used to demonstrate the validity of rubric assessments [2,5,6]. It helps in identifying factors of the rubric evaluation. Therefore, we employed it in this study.
Several studies on assessing the internal consistency of rubrics in programming and other topics exist [2,3]. Nathalia et al. confirmed the CodeMaster rubric using 88,812 app inventor projects [2]. Chen, et al. [3] used the rubric to evaluate code reading and assessed consistency. Cronbach’s alpha coefficient [7] was used to validate the rubrics in these studies. The studies of the rubric evaluation in several other fields have used Cronbach’s alpha coefficient [8,9]. Therefore, Cronbach’s alpha coefficient is a useful tool for assessing the reliability of rubrics and was employed in this study.
Section 3 describes the details of the KMO and Cronbach’s alpha coefficient.
2.3. About the Rubric to Be Evaluated
We proposed a rubric for evaluating the learning achievement of programming-thinking skills for young people from elementary to high school [4]. Here, we used an extended version of the proposed rubric. The evaluation perspectives of the rubric we created are divided in three major categories: programming-thinking skills (i.e., logical thinking about conditions, branches, and arrays), programming technical skills (i.e., such as coding and defining requirements), and computer use and social involvement. The reasons for these three categories are as follows. First, we divided the items related to programming in two categories. This is because we believe that skills related to thinking such as logical thinking about conditions, branches, and arrays, and technical skills, such as coding and defining requirements, are two different things. We added a section on how to use computers. Because this study evaluates programming-thinking skills, the “programming-thinking skills” item is the target. Table 1 shows the examples of the evaluation items for programming-thinking skills. They include ““Sequence,” “Branch,” “Repetition,” “Variable,” “Array,” “Function,” “Recursion,” “Sort,” “Subdivision of the problem,” “Analysis of events,” “Extraction operation,” “Construction of the operation,” “functionalization,” “Generalization,” “Abstraction,” “inference,” “Logical algebra,” “operator,” and “Understanding of the program.” There are 19 items, which are set by referring to indicators such as CSTA K-12 computer science standards [10,11].
All items on the rubric used for validation are listed in the appendix (Appendix A, Appendix B and Appendix C).
3. Characteristic Evaluation Framework for Rubrics
3.1. Rubric Characterization Methods
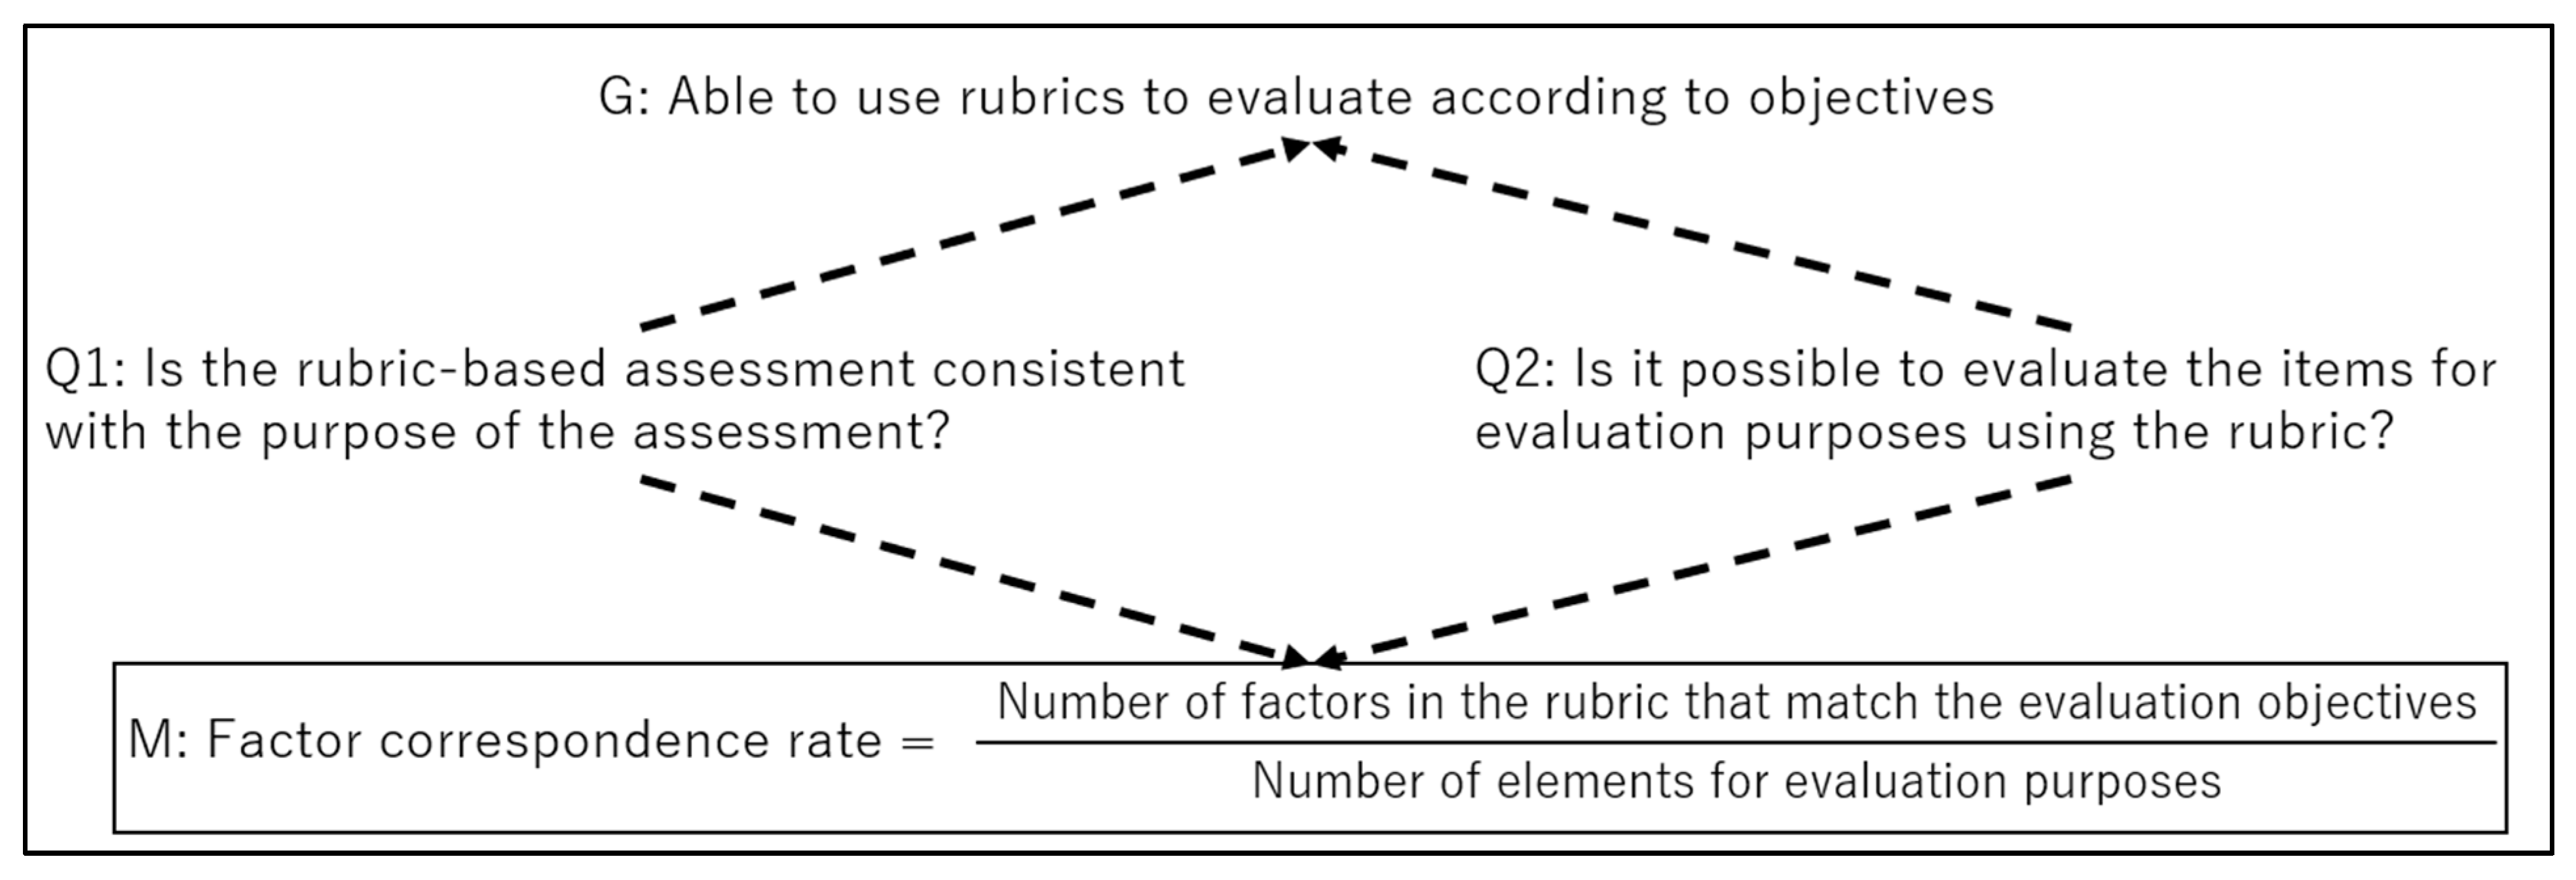
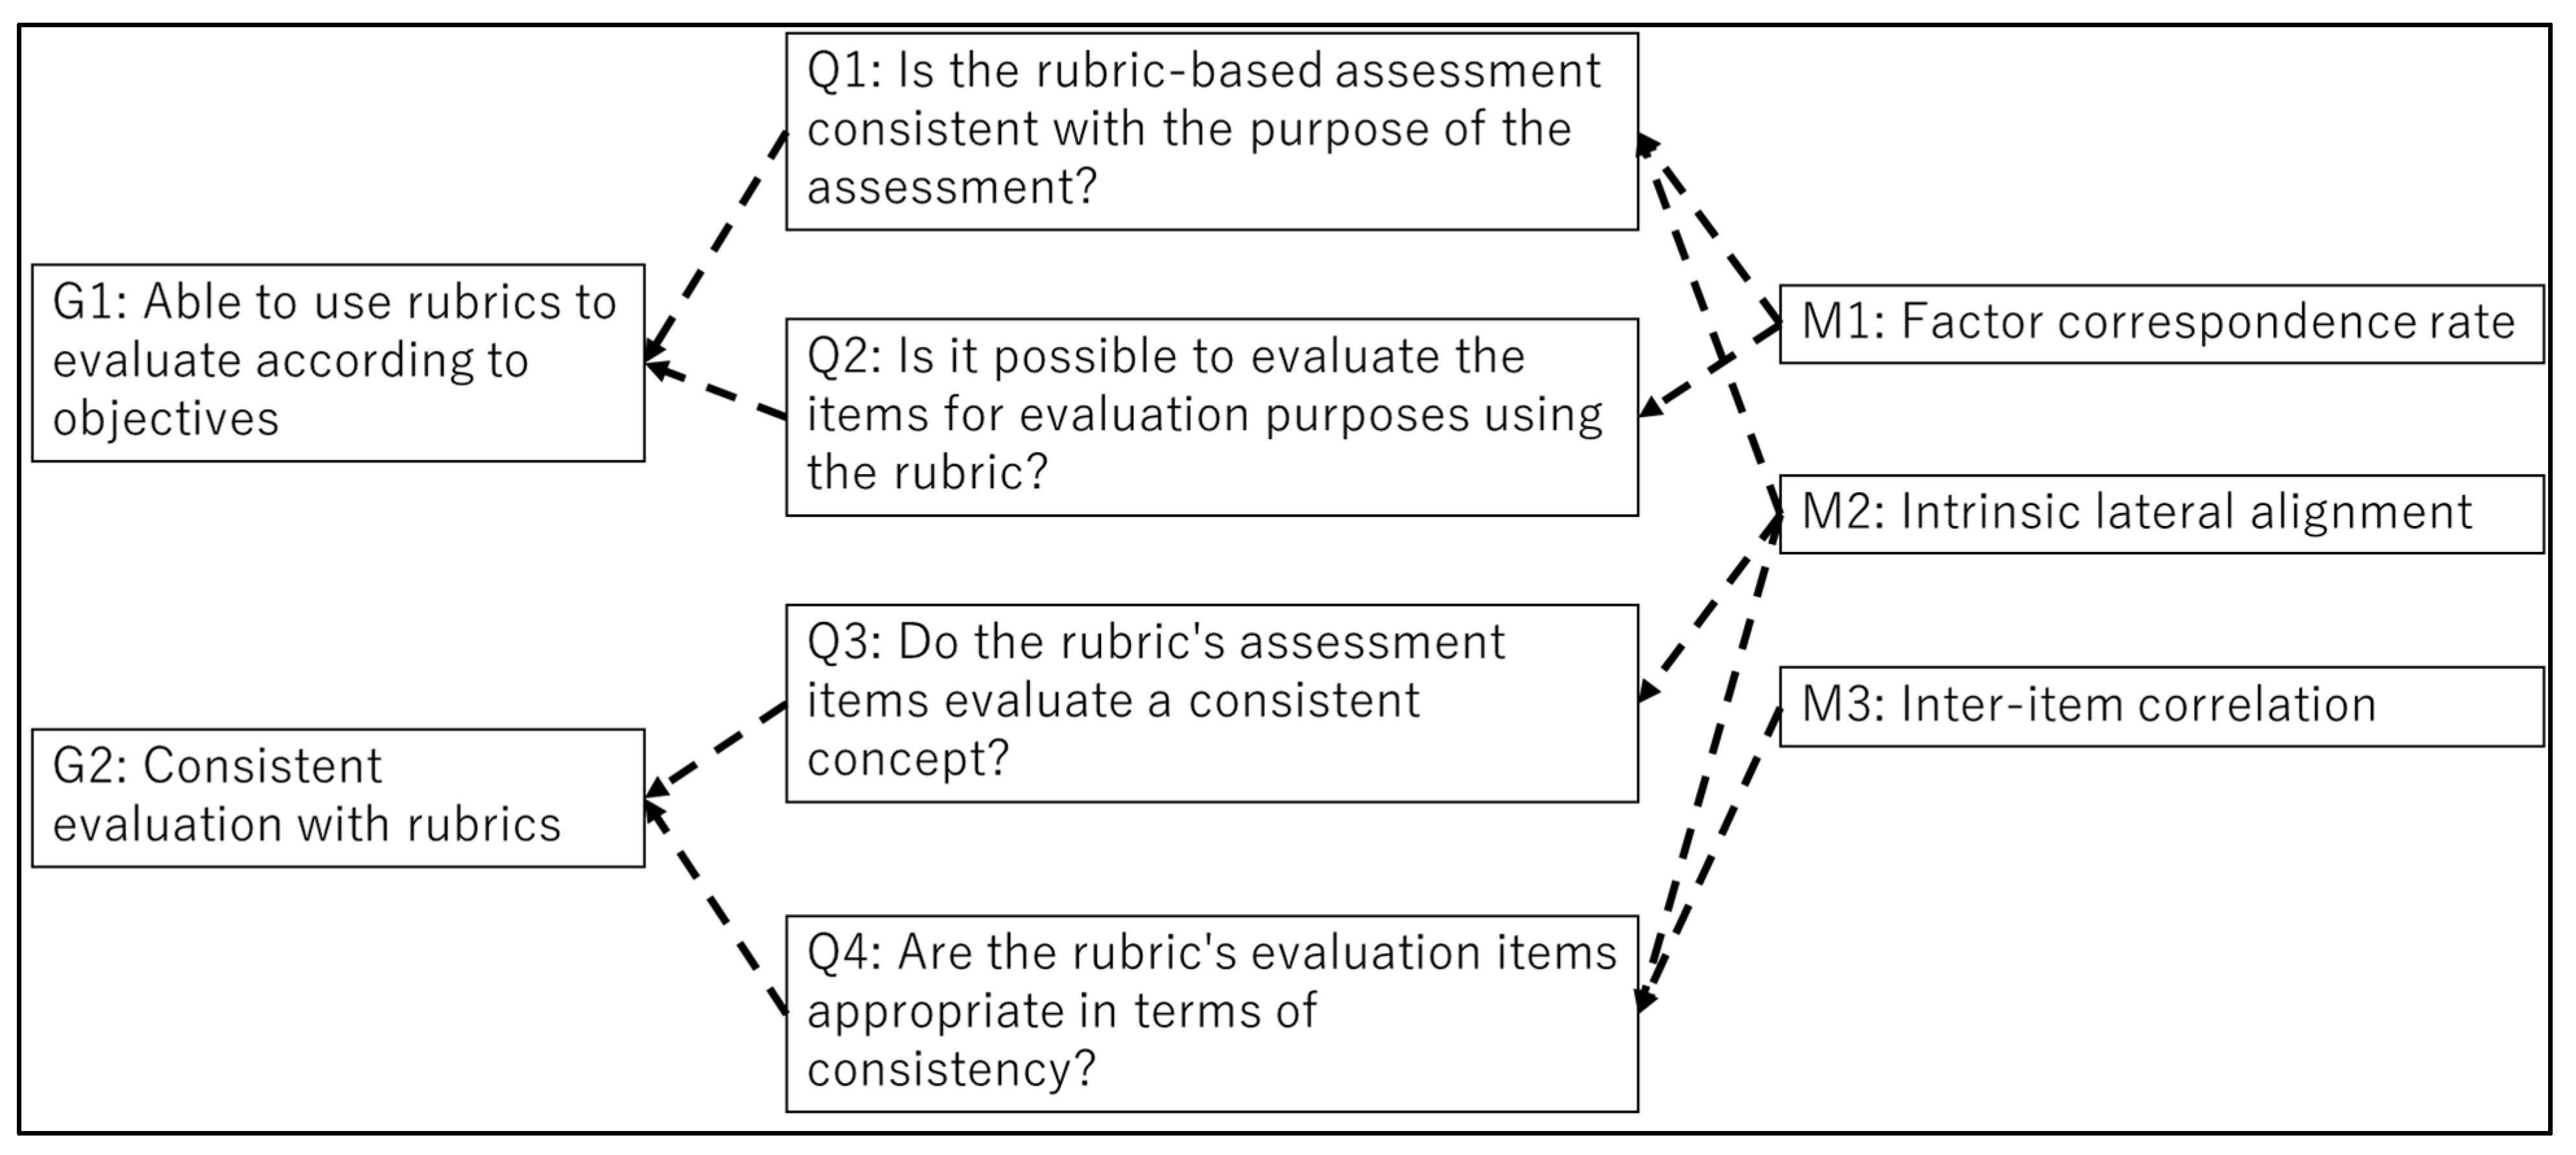
The GQM method [12,13] was used to define a statistical method to quantitatively evaluate the required properties of a rubric. We applied this method because the GQM method leads to a quantitative statistical method for evaluating the desired properties; an example of the definition of a statistical evaluation method for the characteristics of a rubric is shown in Figure 1, and an overall view of the statistical method as applied and defined by the GQM method is shown in Figure 2. From Figure 2, the important aspects of the reliability of the evaluation of the rubric are set as questions to determine whether the evaluation results tally with the evaluation objectives. Furthermore, the evaluation results are summarized in a statistical method that is easy to understand.
3.2. Factor Response Rate
The factor response rate is defined as a statistical method for determining whether the rubric-based evaluation tallies with the evaluation objectives. First, we measure the factors in the rubric items. By conducting factor analysis, we can measure the factors underlying the rubric items. To examine the validity of the factor analysis, we applied the KMO sampling adequacy criterion defined by the following Equation (1).
The KMO value is a value between 0 and 1 that measures the adequacy of sampling. A KMO value closer to 1 is suitable for factor analysis, whereas a value <0.5 is not suitable for factor analysis [14]; if the KMO value obtained is suitable for factor analysis, parallel analysis is conducted to determine the number of factors [14]. Here, random numbers with the same sample size as the data are generated, the eigenvalues of the correlation matrix are estimated, and the factor is determined as the one before the eigenvalue of the random number becomes larger. Factor analysis is performed with respect to the determined number of factors. For each factor, the loadings of each item can be observed. By identifying the items with the highest loadings for each factor, the factors that are the basis of the evaluation in the rubric are identified. Finally, by calculating the percentage of factors identified that match the evaluation objective, we determine whether the evaluation agrees with the evaluation objective.
3.3. Integration Within
Internal consistency is defined as a statistical method to determine whether items in a rubric are consistent throughout. It indicates whether each item in a scale measures the same construct [2]. Cronbach’s alpha coefficient, defined by the following Equation (2), is used as a confidence coefficient for internal consistency to evaluate these results.
m: number of items in the question, σi: variance of each question item, σx: variance of the total of each question item.
The alpha coefficient takes values between 0 and 1, and the closer it is to 1, the more consistent the results are. Generally, a value of 0.7–0.9 is considered internally consistent [15]. From this statistical method, we can determine that the evaluation in the rubric is consistent.
3.4. Inter-Item Correlation
An inter-item correlation is defined as a statistical method for determining whether each item in the rubric agrees with the other. It allows us to measure the correlation between each item and the whole. We calculate the alpha coefficient for each deleted and compare it with the overall alpha coefficient. If the alpha coefficient of the deleted item is greater than the overall alpha coefficient, the item is considered to be interfering with the consistency of the rubric as a whole. This statistical method is used to determine the consistency of the rubric evaluation.
4. Experiment and Evaluation
4.1. Rubrics and Data to Be Covered
We evaluated the characteristics of the rubric using results from evaluating the learning achievement using the rubric for three classes such as “math,” “science,” and “information,” are shown in Table 3. All classes were taken by different students. Moreover, Schools A and B were conducted as standard elementary school classes. School C was offered as an elective class to students who wanted to take it. To evaluate the learning achievement, we used the results of the quiz on programming thinking skills shown in Section 2.2, which the students who took the classes shown in Table 3 answered at the end of the class, in a manner that corresponded to the rubric.
4.2. Class Details
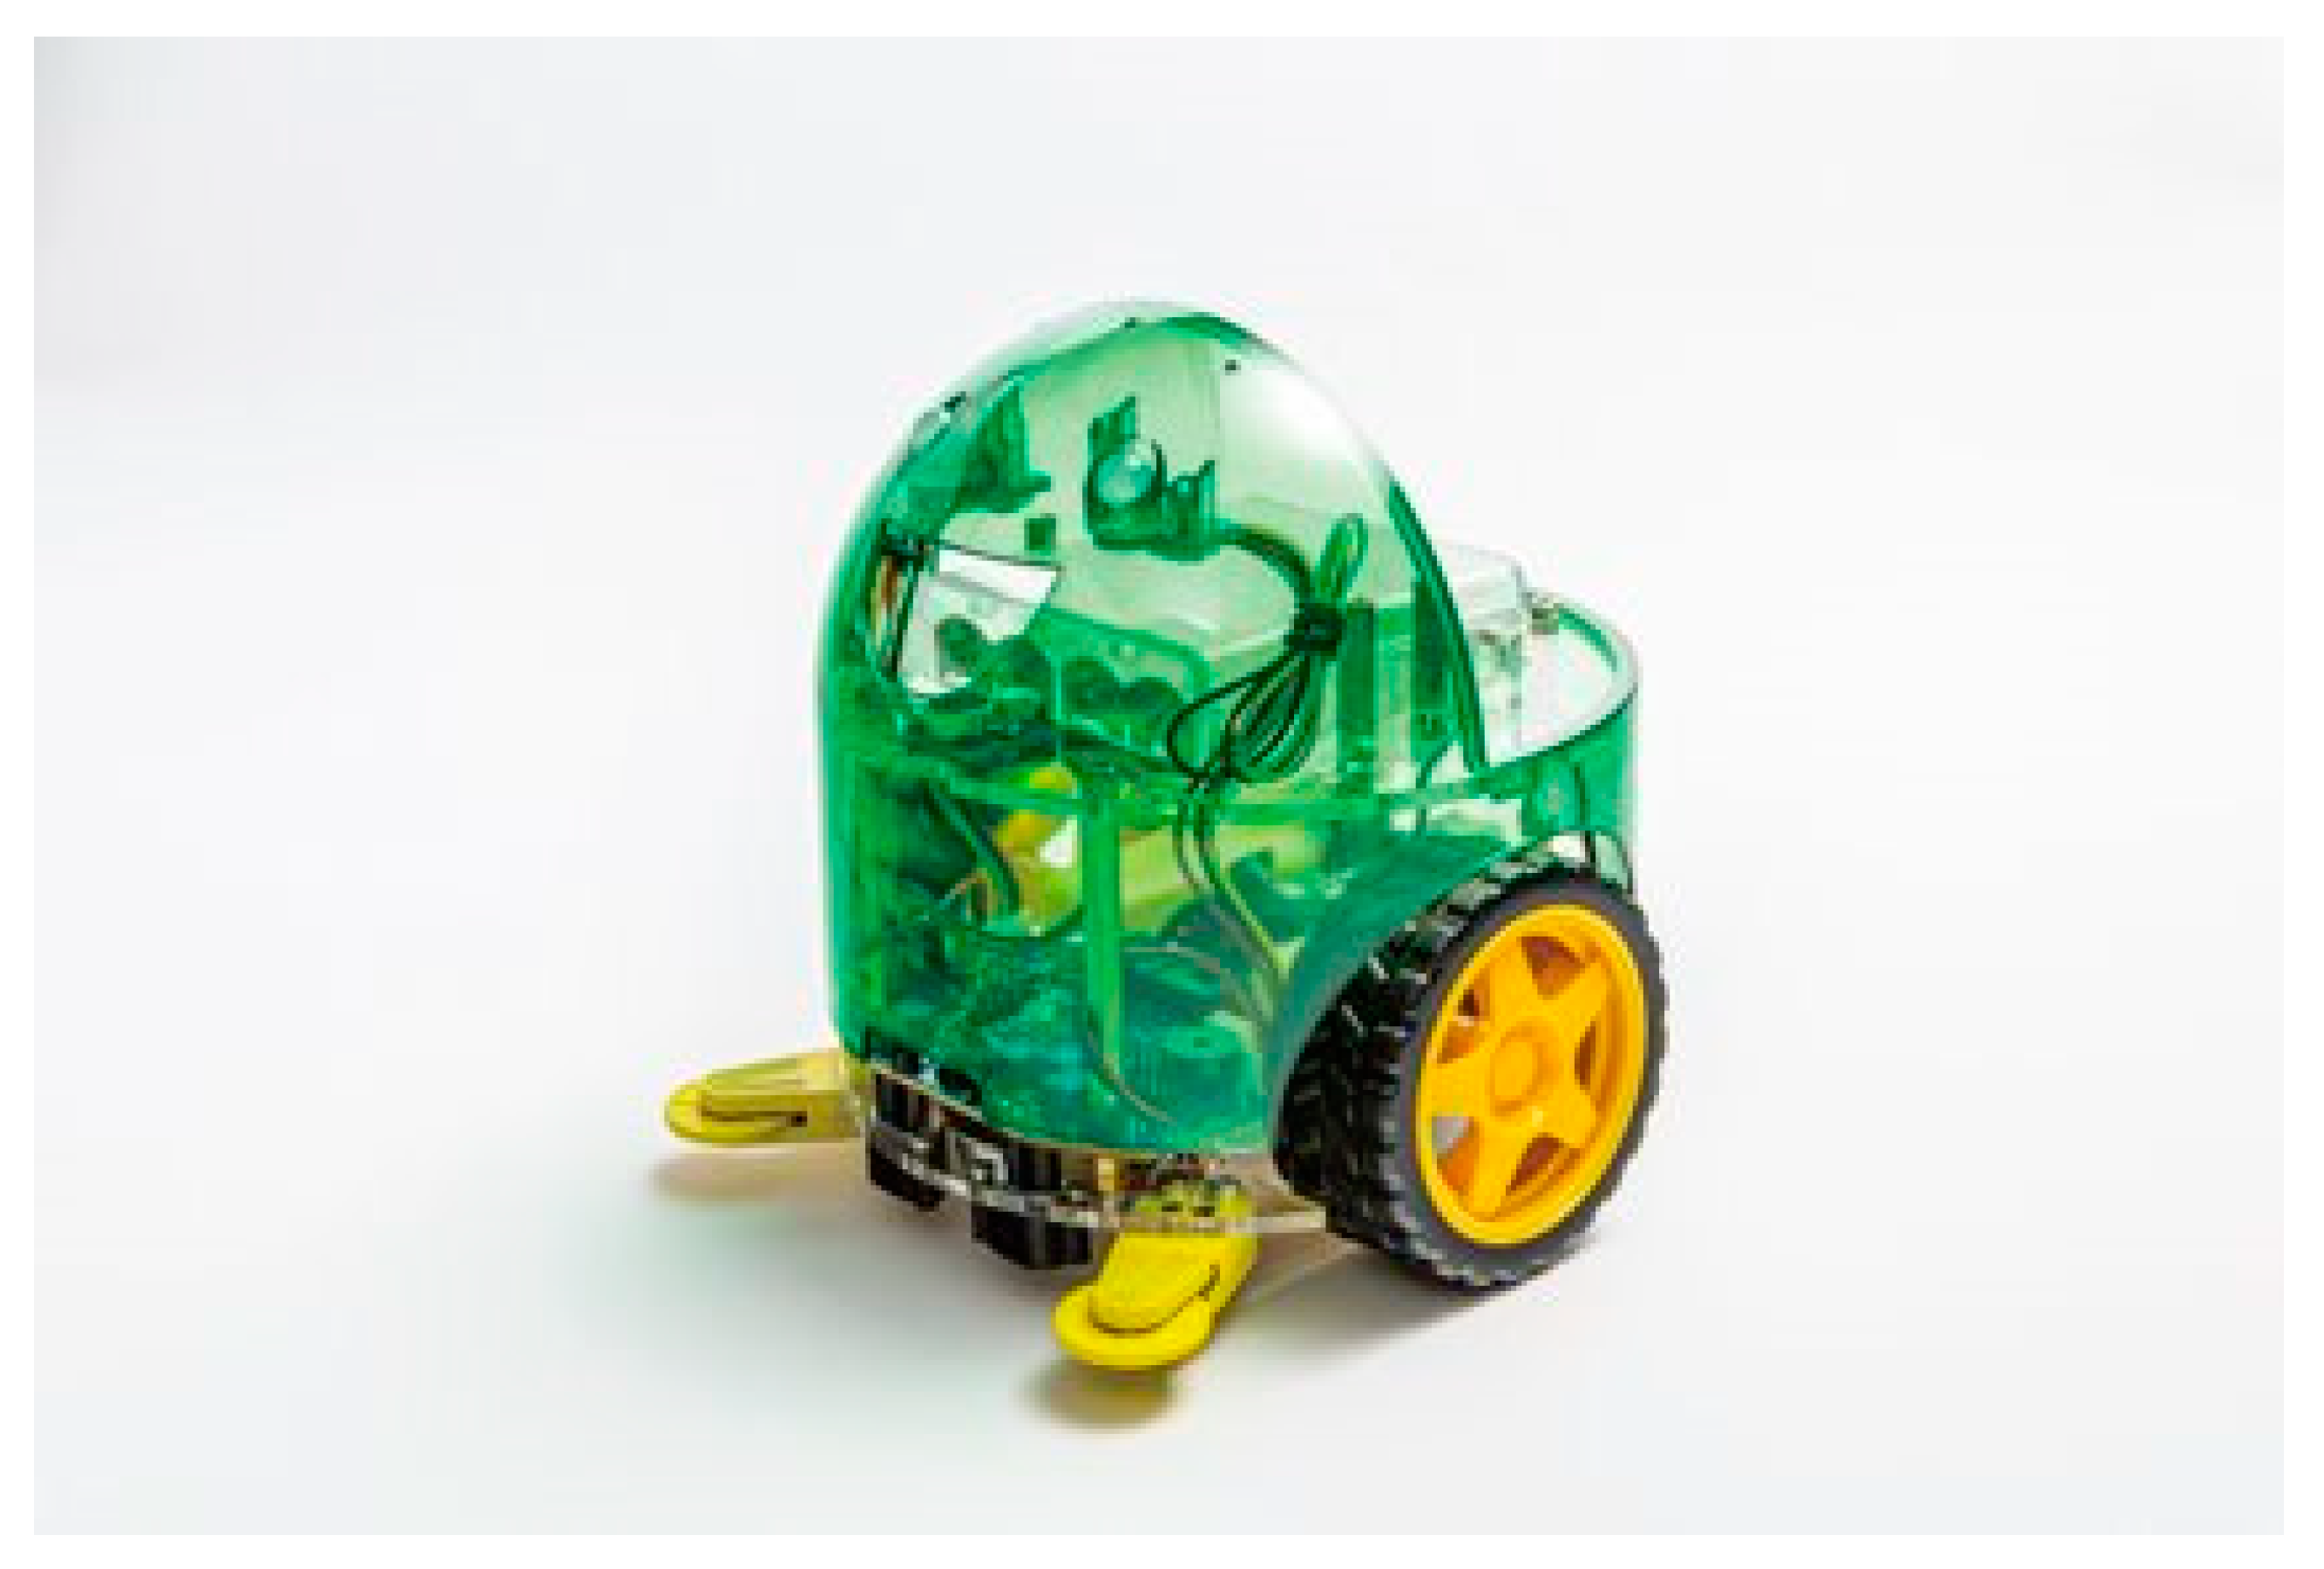
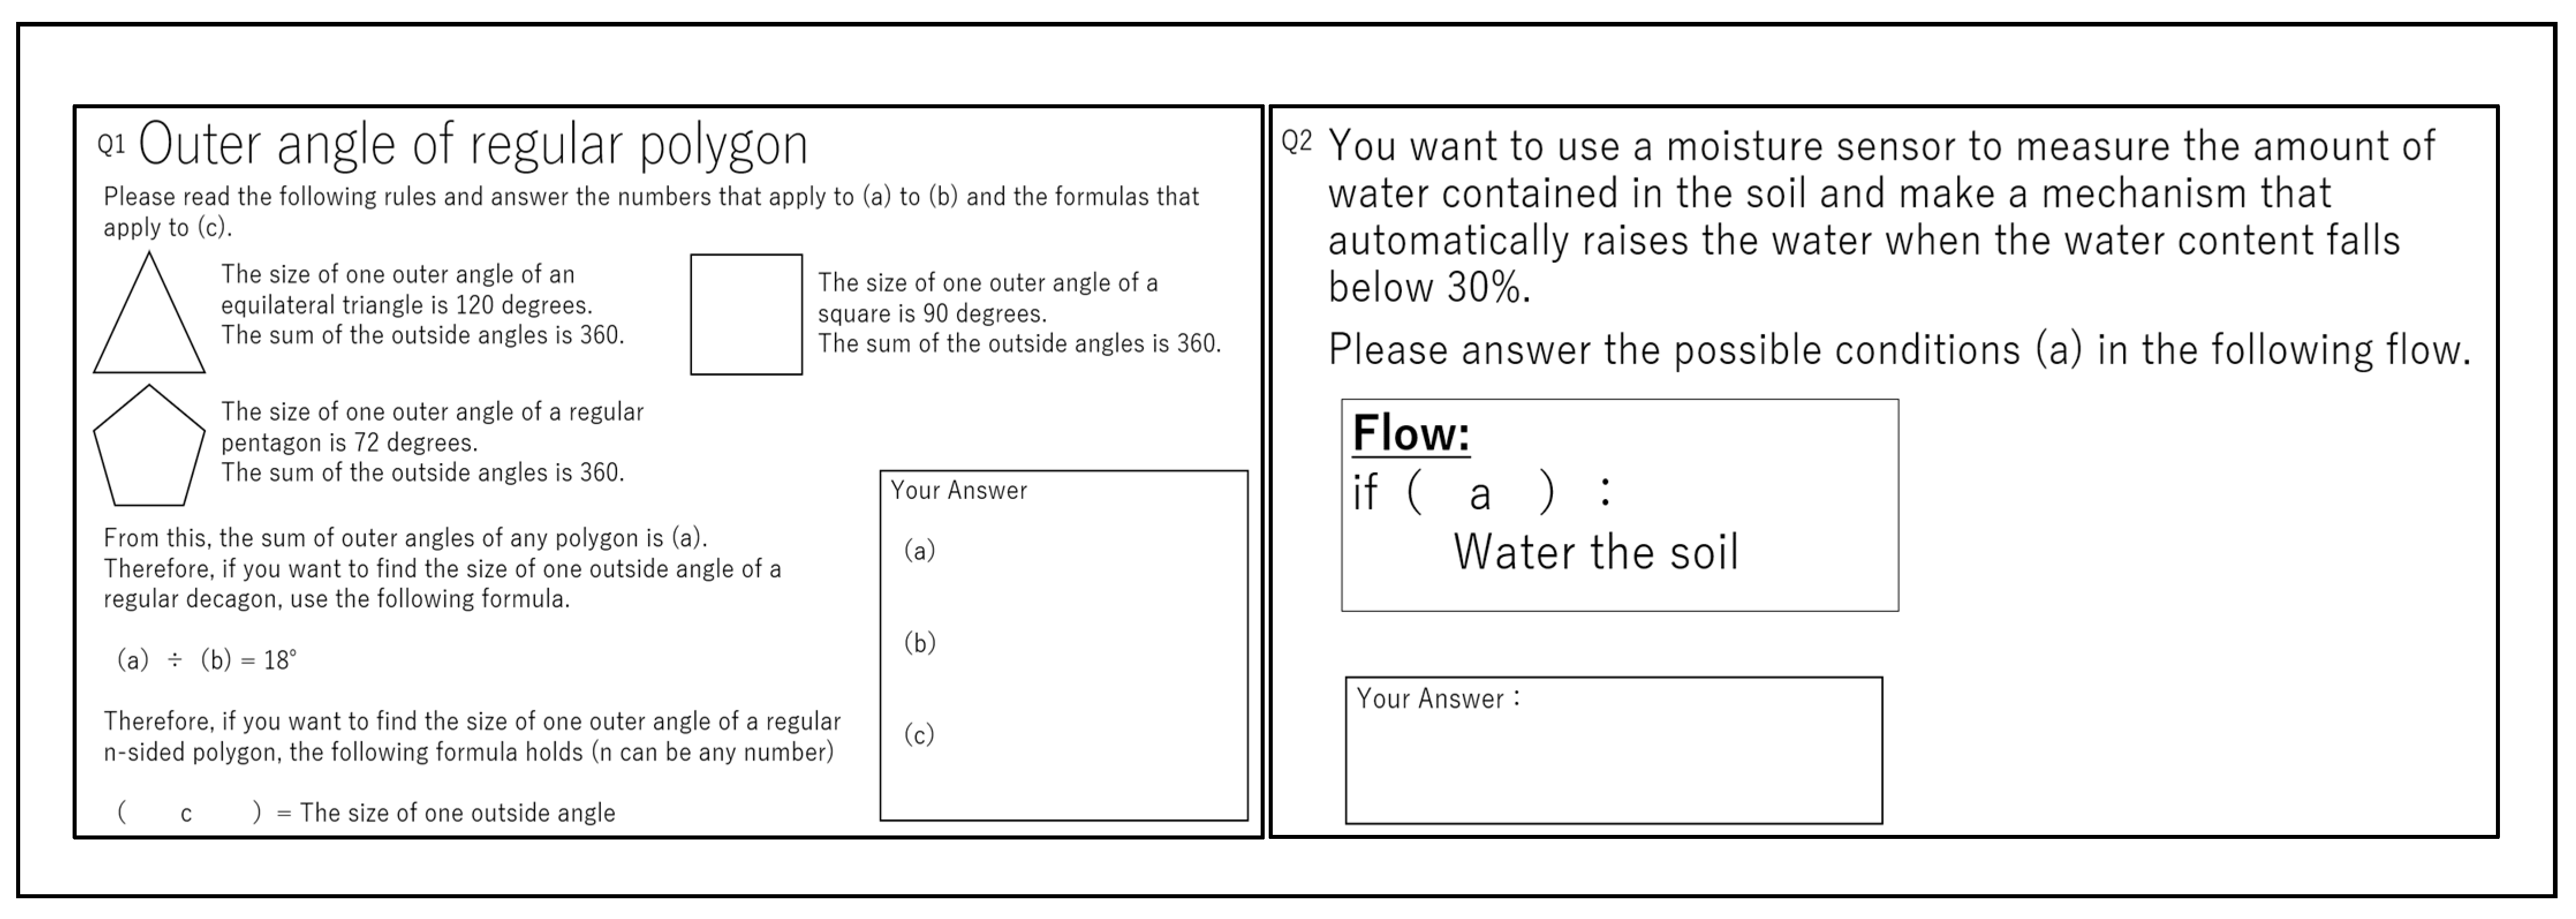
Schools A and B applied Avalon technology’s “Ugokashite-miyo (Figure 3),” a programming education material for Japanese elementary schools, to the fifth-grade math course “Properties of regular polygons” and the sixth-grade science course “Properties and functions of electricity around us.” Before and after these classes, a quiz on programming-thinking corresponding to the rubric was used. The programming quiz was a different quiz, although similar questions were obtained in schools A and B. Thirteen questions were given to school A. As a breakdown of School A’s questions, Q1 is one question, Q2 is three questions (Q2-1~Q2-3), Q3 is four questions (Q3-1~Q3-4), Q4 is two questions (Q4-1~Q4-2), Q5 is one question and Q6 is two questions (Q6-1~Q6-2). Furthermore, nine questions were given to school B. As a breakdown of School B’s questions, Q1 is one question, Q2 is three questions (Q2-1~Q2-3), Q3 is two questions (Q3-1~Q3-2), Q4 is one question, Q5 is one question, and Q6 is two questions (Q6-1~Q6-2). The correspondences with the rubrics and examples of the quizzes are shown in Table 4 and Table 5 and Figure 4.
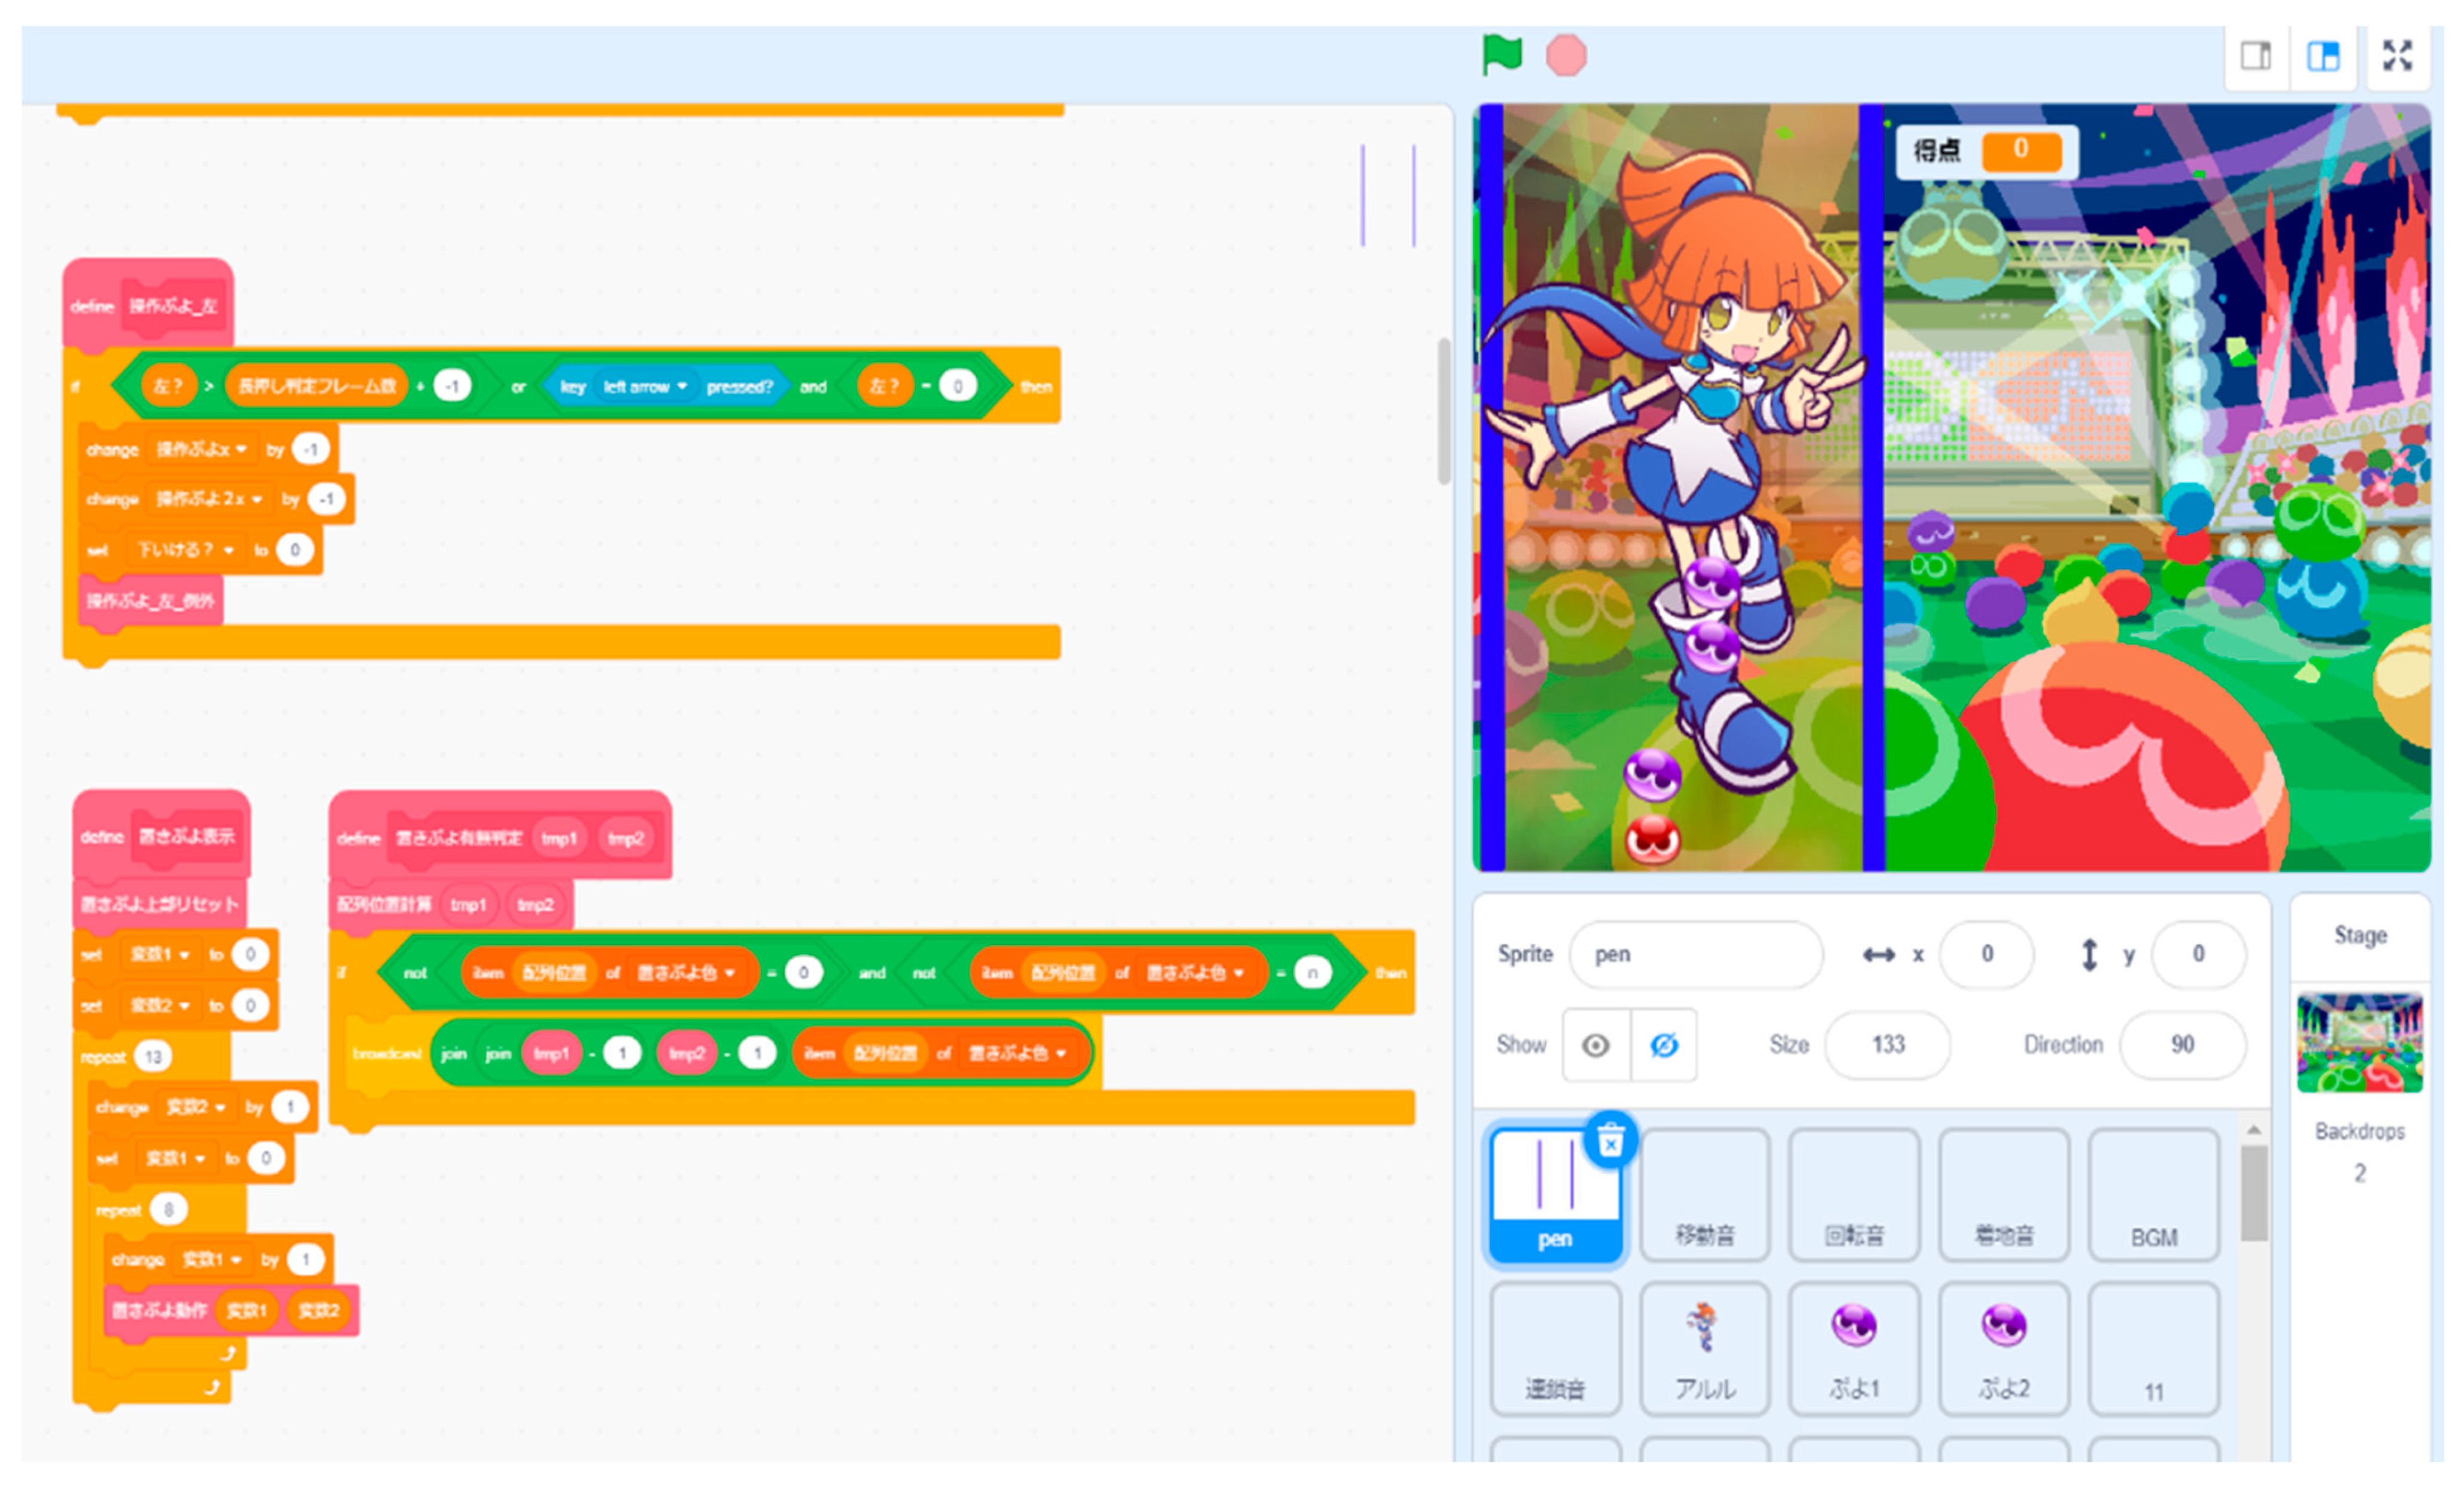
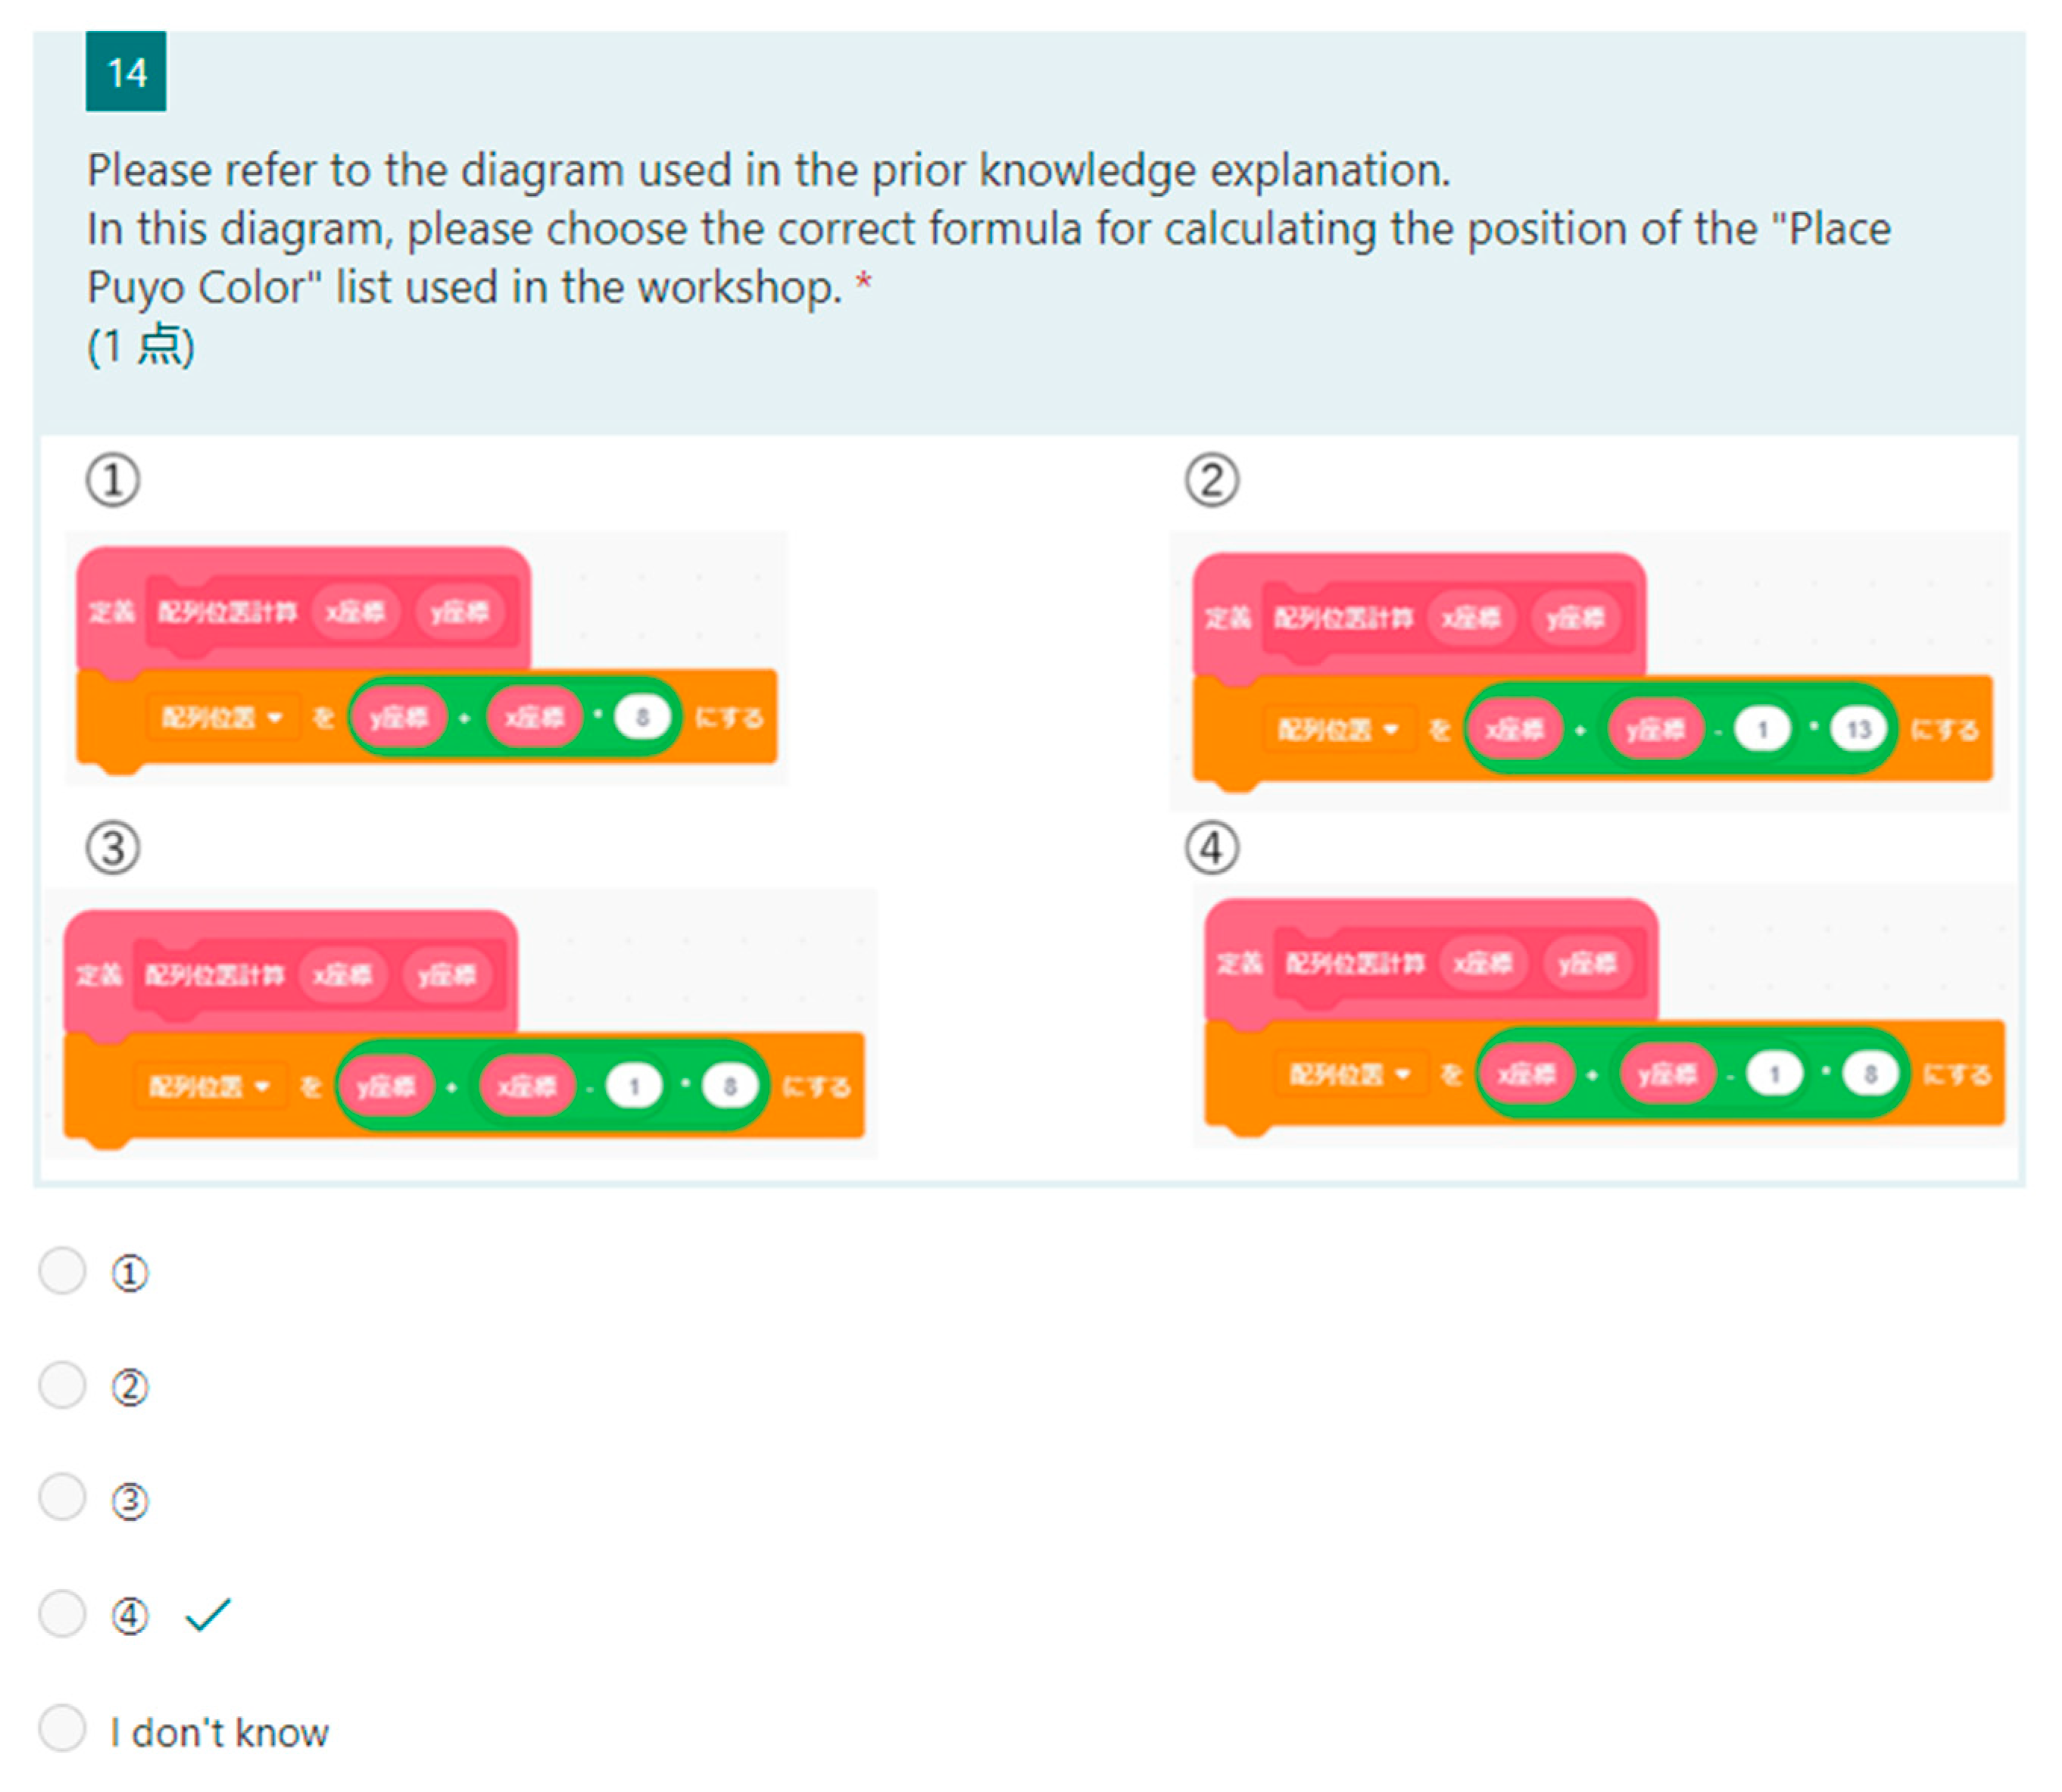
In school C, we used the results of the programming-thinking quiz corresponding to the rubric for a class based on the game design of “Puyo Puyo” using scratch (Figure 5) to foster programming-thinking skills for elementary and junior high school students. The correspondence with the rubric and examples of the quiz are shown in Table 6 and Figure 6.
Furthermore, the mapping of these quizzes to the learning aims of the rubric was manually performed by two researchers, including the author. The numbers in each table indicate the stage of the rubric when the quiz was correctly answered.
4.3. Application Results of Evaluation Framework
4.3.1. Factor Loadings in Evaluation Results
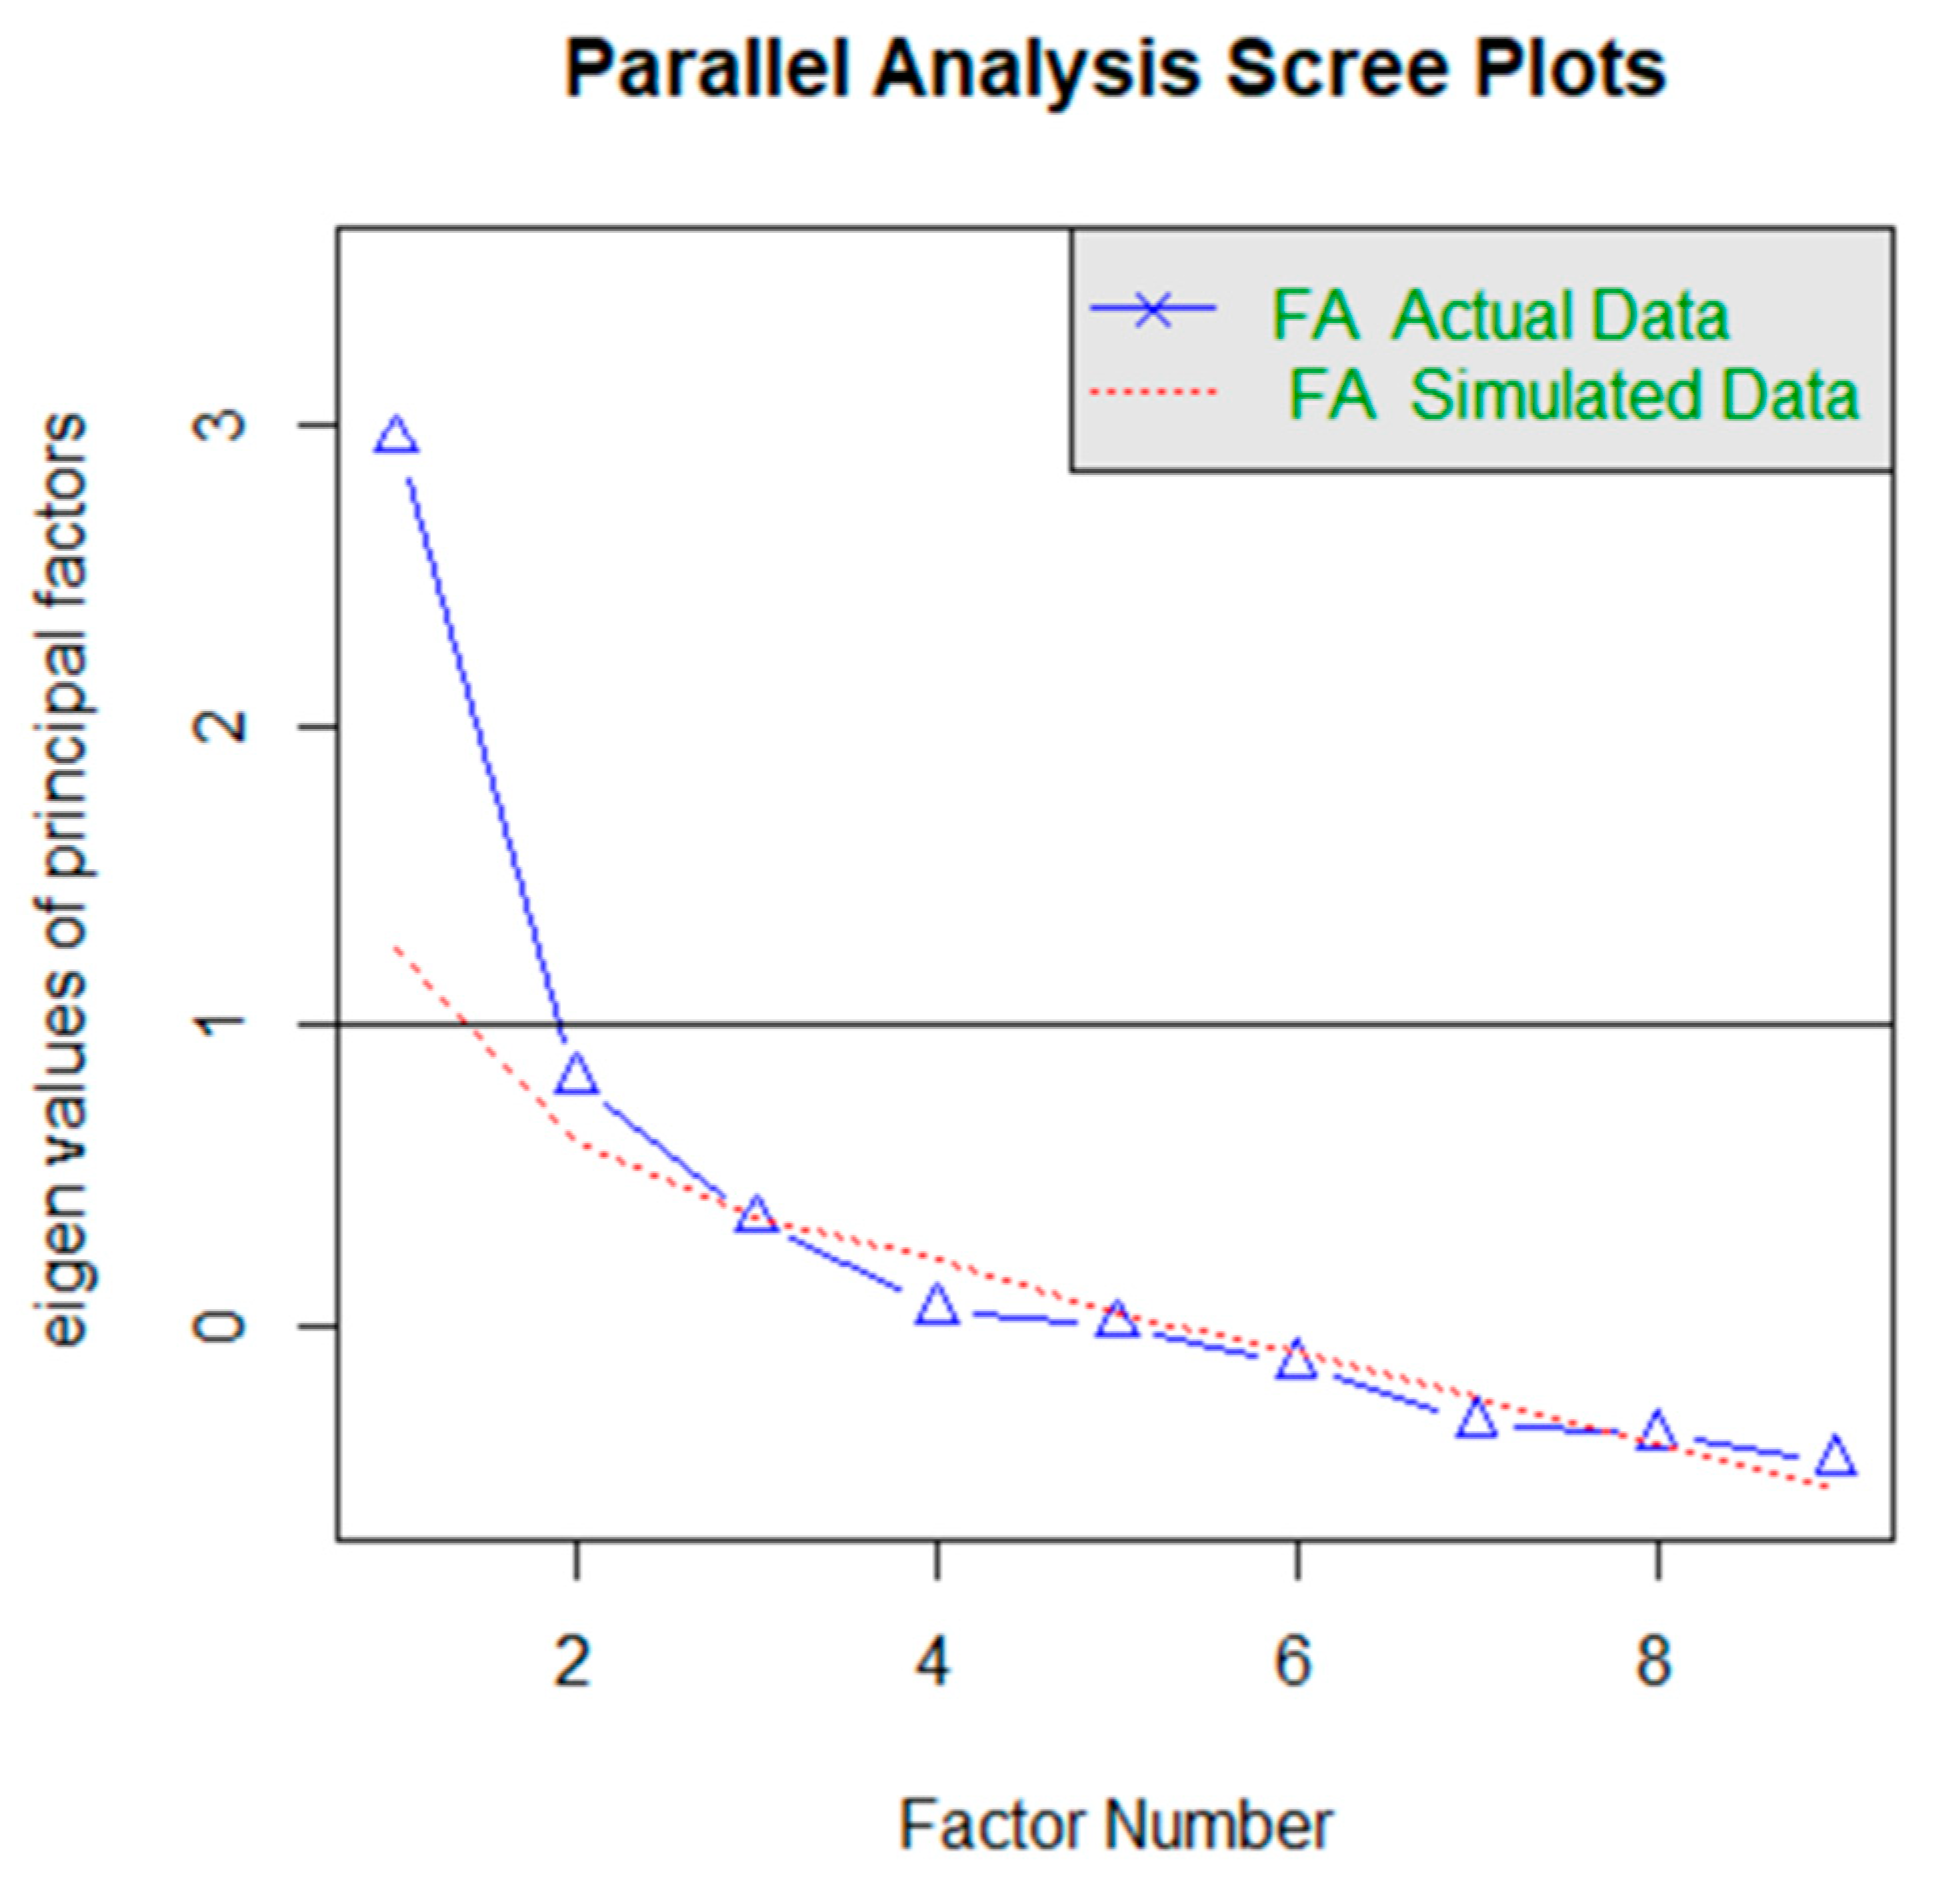
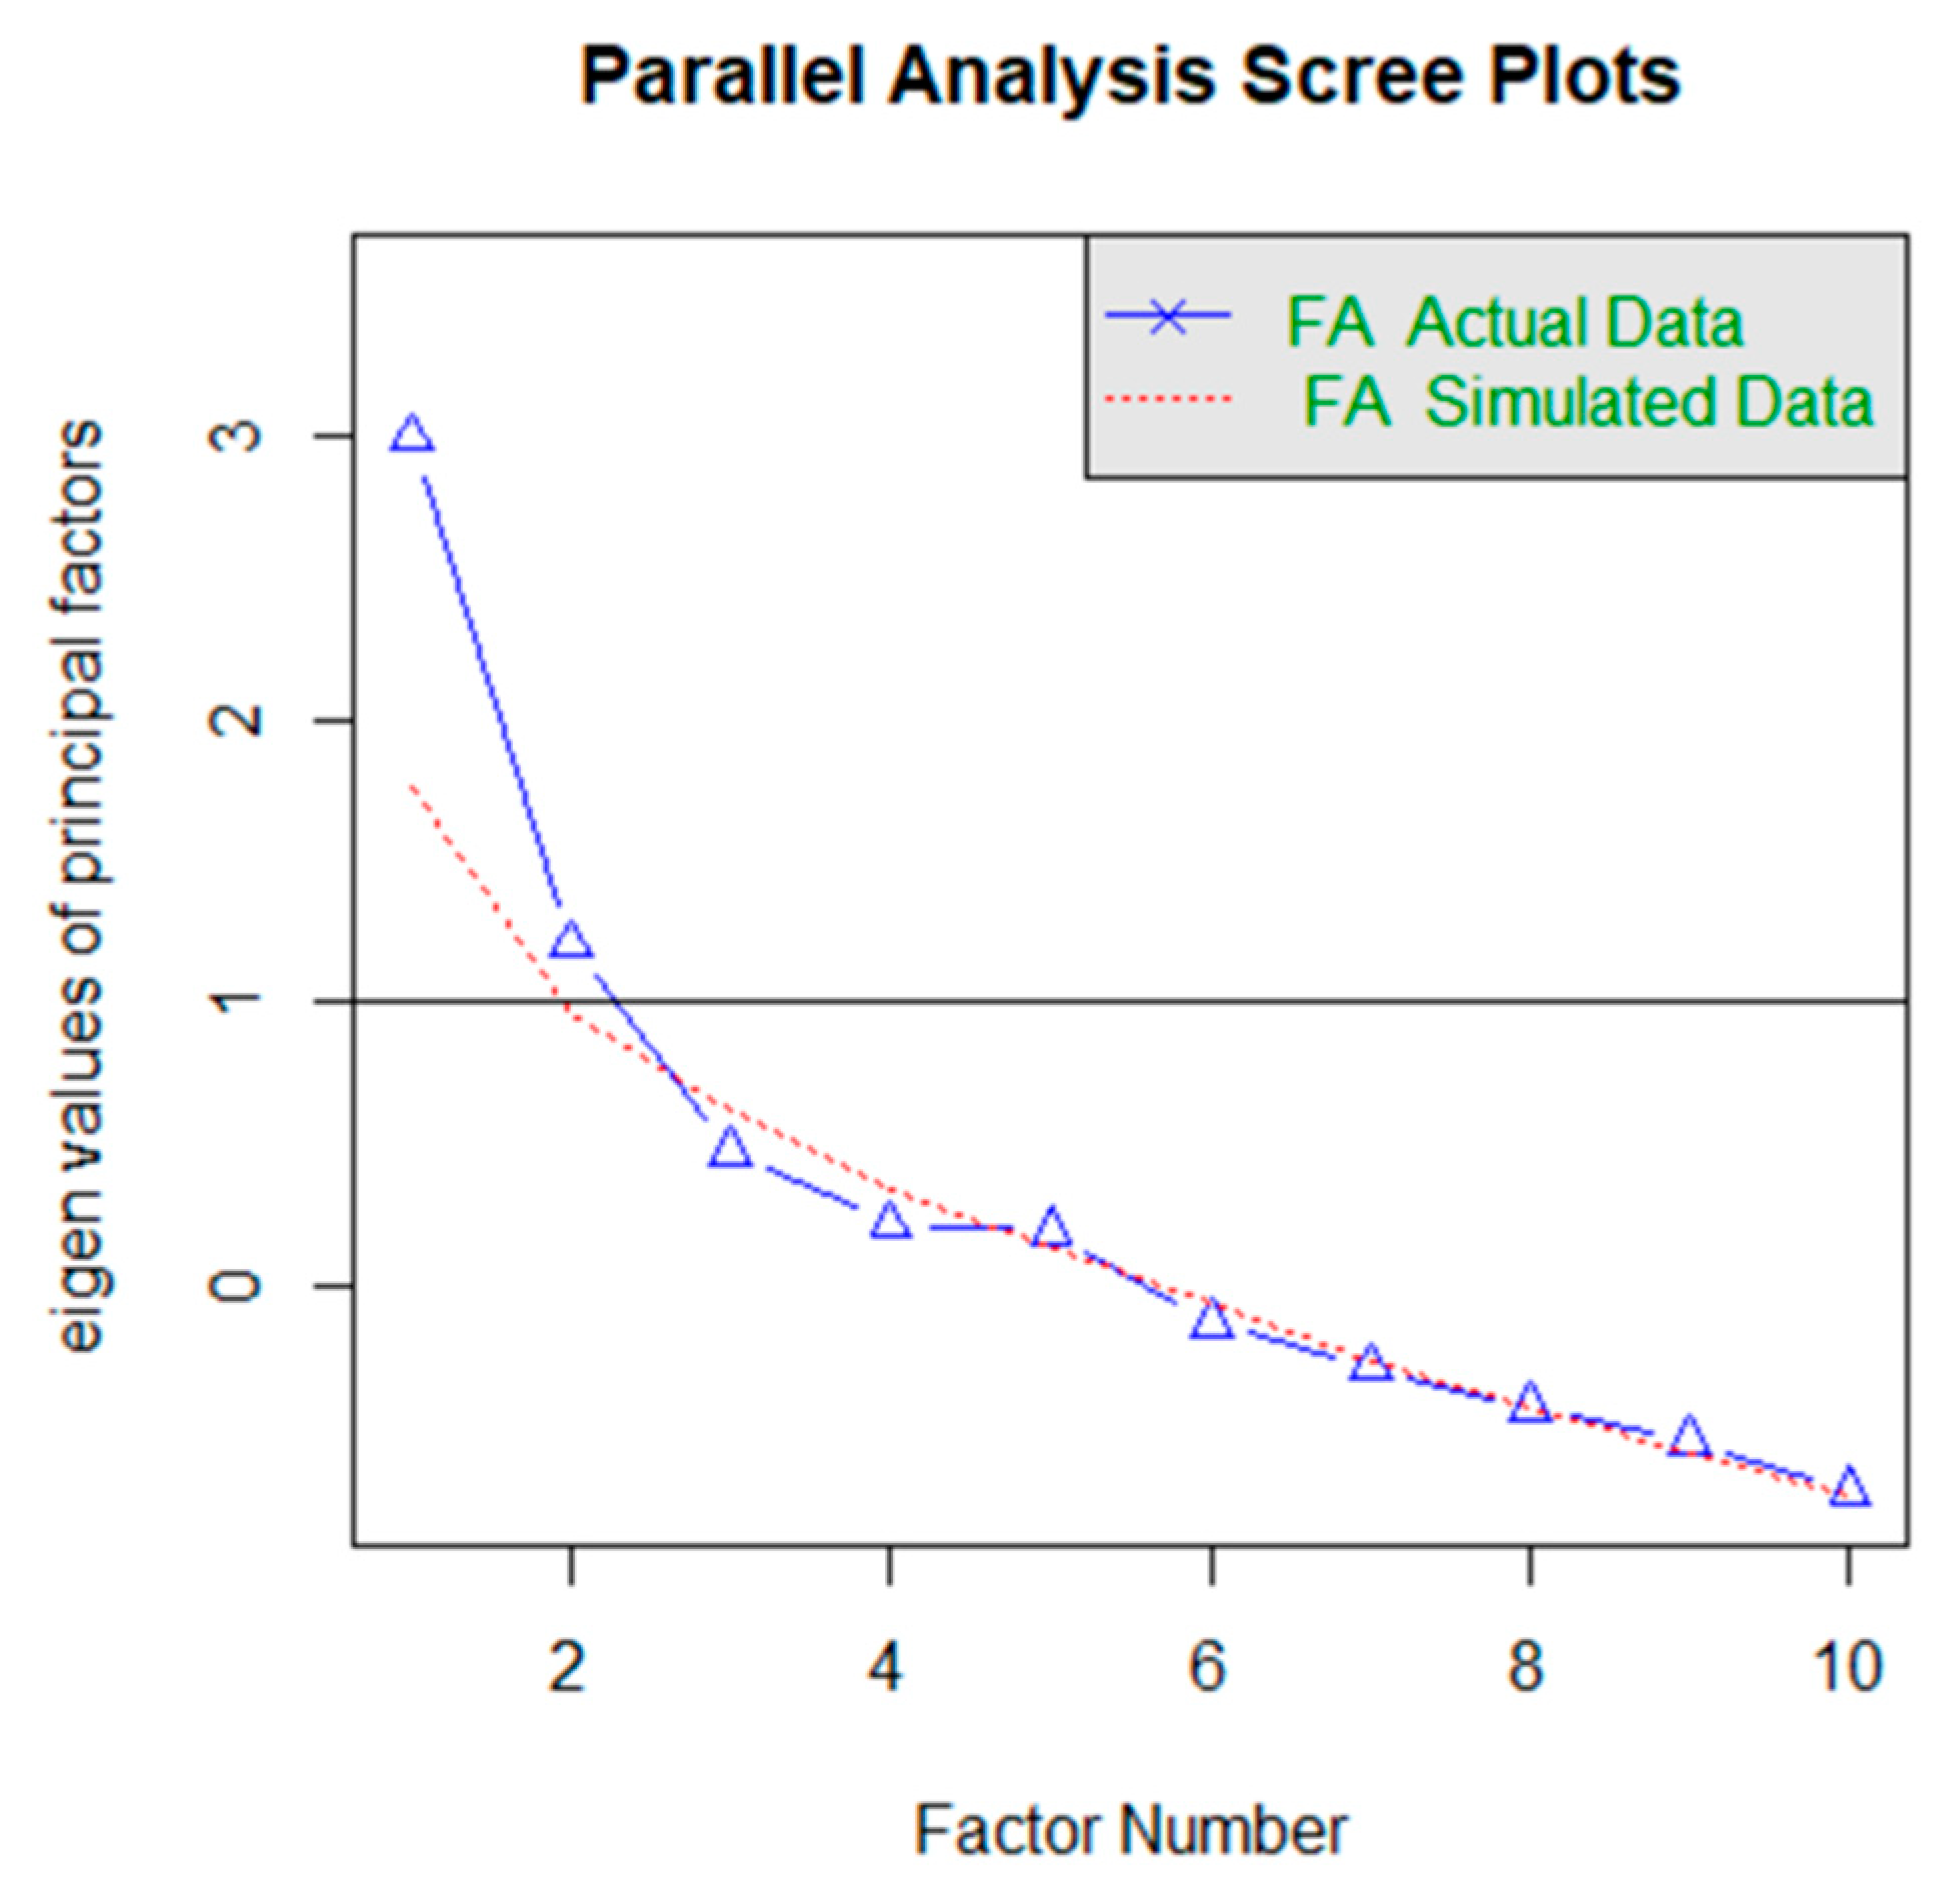
To factorize the evaluation results of each class, KMO values were calculated. They indicate the appropriateness of applying factor analysis. The KMO values for the evaluation results of each class are shown in Table 7. From the respective KMO values, we applied factor analysis to the results of schools A, B, and C. Moreover, they underwent parallel analysis to determine the number of factors. The decay of eigenvalues for each evaluation result is shown in Figure 7, Figure 8 and Figure 9.
Parallel analysis determines eigenvalues, compares eigenvalues calculated from random data that are the same size as the data being analyzed, and adopts eigenvalues up even those larger than the random data [9]. From the eigenvalue decay in each evaluation result, the number of factors in schools A, B, and C are 3, 2, and 2, respectively. From these factor numbers, we estimated the factor loadings of each school using the Oblimin rotation method [16]. The factor loadings for each evaluation result are shown in Table 8, Table 9 and Table 10.
4.3.2. Internal Consistency in Each Evaluation Result
The alpha coefficients of Cronbach’s in the evaluation results of each class were calculated. We calculated the alpha coefficients when each item of each quiz was deleted. The results are shown in Table 11.
5. Discussion
5.1. Answers to RQs
5.1.1. RQ1: How Do We Identify Statistical Methods to Evaluate Rubric Properties?
The GQM method [7,8], a framework of goal-oriented thinking, was adopted to identify statistical methods for quantitatively evaluating the characteristics of rubrics because it identifies statistical methods without losing sight of the goal of evaluating the required characteristics of rubrics.
Related research has demonstrated that the required characteristics include: “d-oes the rubric’s evaluation meet the evaluation objectives?” By determining the factor correspondence rate, we quantify the correspondence between the concepts that can be evaluated in the rubric and those we want to evaluate, and we determine whether the evaluation in the rubric agrees with the evaluation purpose. Using Cronbach’s alpha coefficients, we can judge whether the evaluation in the rubric can evaluate programming-thinking skills consistently throughout the rubric. Calculating inter-item correlations finds the items that disrupt the consistency of each item with respect to the rubric as a whole and determines the consistency of the rubric’s assessment of the items.
5.1.2. RQ2: How Can Rubrics Be Evaluated and Analyzed to Identify Improvements?
This section discusses the answer to RQ2. Results show that KMO values for the evaluation results of schools A and B were 0.519 and 0.709, respectively, which are appropriate for factor analysis. From the factor analysis and the evaluation results of school A (3-factor structure), Q3-1/3-2/3-3/Q3-4 showed high factor loadings for factor 1, Q4-1/4-2 showed high factor loadings for factor 2, and Q2-1/Q2-2/Q6-1 showed high factor loadings for factor 3. The rubric items that were associated with questions that showed high factor loadings for factor 1 were problem subdivision/analysis of events; the rubric items that were associated with questions that demonstrated high factor loadings for factor 2 were problem subdivision/sequential/iteration/operator; the rubric items that were associated with questions that showed high factor loadings for factor 3 were the rubric items that corresponded to questions with high factor loadings in Factor 3 were problem subdivision/abstraction/generalization/inference/functionalization/extraction of actions/construction of actions. The assessment objectives in the class at school A were “sequence/analysis of events/problem subdivision/abstraction/generalization/inference/ functionalization” related to the idea of focusing on the elements and relations that make up the properties of regular polygons. The factor correspondence ratio is 1, which is consistent with the factor. The factor correspondence ratio was 1, indicating that the evaluation tallied with the purpose of the evaluation. Next, the results of the evaluation at school B (two-factor structure) demonstrated that Q3-1/3-2 and Q2/Q5/6-1 showed high factor loadings for factors 1 and 2, respectively. The rubric items associated with the questions that showed high factor loadings for factors 1 and 2 were subdivision/ordering/repetition/operators and branching/extraction of actions/construction of actions, respectively. The evaluation objectives for classes in school B were sequential/branching/iteration/subdivision of problem/extraction of action/construction of action/reasoning and were related to a program to control electricity with sensors. However, sequential, branching, iteration, extraction of action, construction of action, and subdivision of the problem agreed with these factors. The factor correspondence ratio was 0.86, indicating that the evaluation agrees with the evaluation objective.
The overall alpha coefficients for schools A and B were 0.841 and 0.767, respectively, which are higher than 0.7, considered the benchmark for consistency. This indicates that the ratings of both schools are consistent. Next, we considered items whose alpha coefficients were higher than the overall alpha coefficient when they were deleted. These items may be inconsistent with the overall. However, Q4-1/6-1 makes a set of questions with others, and only Q5 includes branching as an evaluation target, indicating that these items are necessary to comprehensively evaluate programming-thinking skills. In school B, no item had a higher alpha coefficient than the overall alpha coefficient, indicating that the items assessed in B agreed with the overall alpha coefficients. From the above, we can see that the evaluations in schools A and B satisfy the characteristics of the rubric.
5.1.3. RQ3: Can We Confirm the Generality of Evaluation by Evaluating and Analyzing Rubrics?
The KMO value of the evaluation result of school C is 0.541, which can be judged appropriate for factor analysis. From the factor analysis and the evaluation results of school C (two-factor structure), Q5/Q8/Q10 and Q1/Q3 showed high factor loadings for factors 1 and 2, respectively. The rubric items commonly associated with the questions that showed high factor loadings for factors 1 and 2 were sequential/variable/function/analysis of events/construction of behavior/functionalization/understanding of program and sequential/branching/iteration/analysis of events/understanding of the program. The factor response rate was 0.89, indicating that the evaluation agrees with the evaluation purpose.
The overall alpha coefficient was 0.778, which is greater than the value of 0.7, considered the benchmark for consistency, indicating that the evaluation in school C is consistent. Next, we considered the items whose alpha coefficients were higher than the overall alpha coefficient when they were deleted. In the results of the evaluation in school C, question 7 was mentioned. However, question 7 is associated with sequential/branching/iteration, which is necessary for a comprehensive evaluation of programming-thinking ability. Therefore, each item of the assessment in school C is consistent with the whole. We conclude that the evaluation in school C satisfies the characteristics of the rubric.
The evaluation results of schools A, B, and C satisfied the characteristics of the rubric. From this, we confirm the generality of the evaluation of the rubric with respect to the evaluation characteristics for the improved rubric.
5.2. General Comments on the Application of the Evaluation Framework
5.3. Threats of Validity
Because the mapping between the evaluation stages of the rubric and the programming-oriented thinking quiz was performed by the creator of the quiz, the quiz results may not represent the actual learning achievement. In future, we will confirm the validity of the evaluation by correlating the objective evaluation in the rubric with the subjective evaluation by people in the past.
Moreover, evaluating the characteristics of the rubric was limited to the rubrics created, which threatens external validity. In future, we will confirm the validity of the rubrics used for evaluating various programming-thinking skills.
6. Related Works
As a related study, a study [17] made a list of elements that were required properties of a rubric. In that study, the quality of the rubric was judged based on whether the listed properties were satisfied. This is similar to this study in that the properties of the rubric were considered, but the difference is that the listed properties were scored, and the quality of the rubric was judged based on the total score of the satisfied properties. The method used in this study is superior in that the characteristics are judged based on statistical methods.
Another related study [1] repeatedly tested and designed a rubric to evaluate students’ programming creations, and made improvements based on statistical measures of reliability. In that study, reliability was measured using a statistical method and improvements to the rubric were considered; however, the difference was that the reliability was based on whether the test results consistently provided the same results. However, the method used here is superior in that it judges the characteristics of the rubric based on whether the evaluation agrees with the evaluation purpose and the consistency of the evaluation.
Furthermore, another related study [2] measured the reliability of rubrics for evaluating the learning achievement of programming-thinking skills. They used Cronbach’s alpha coefficients and inter-item correlations to evaluate the consistency of the assessment, and factor analysis was performed to identify underlying factors affecting the rubric. Our method is superior in that it considers the improvement and generality of rubrics.
Furthermore, there are studies that have investigated how rubrics are created and how they are consistently evaluated [18]. This study proposes a method for creating low-stake rubrics for computer science education. The study examined the consistency of evaluation for the created rubrics, and the results claimed that the evaluation is consistent. Moreover, there are several other studies that have examined the consistency of rubric creation and assessment in computer science education and programming education [19,20]. However, the method of creating the rubric may vary depending on the creator of the rubric. Therefore, there is a possibility that the consistency of evaluation may be compromised. Moreover, teachers may want to use rubrics that already exist, so it is important to have evaluation methods that are independent of the rubric creation methods.
7. Conclusions and Future Work
This study proposed a framework for evaluating the characteristics of the rubric to assess the learning achievement of programming-thinking skills. Factor correspondence rate, Cronbach’s alpha coefficient, and inter-item correlation were identified by the GQM method as statistical methods for evaluating the characteristics of the rubric. Furthermore, we evaluated the rubrics we had created, the improvement, by applying these statistical methods to the rubrics in terms of their characteristics. We confirmed the generality of the rubric characteristics.
This framework for evaluating traits applies to evaluating the traits of the rubric itself. It is expected to help improve rubrics and create new rubrics.
In future, we plan to systematize the characteristics of rubrics that can be evaluated more practically and effectively in education by measuring the correlation with conventional subjective evaluation by people.
Author Contributions
Conceptualization, D.S. and R.Y.; methodology, R.Y.; validation, D.S. and R.Y.; investigation, D.S. and R.Y.; data curation, D.S.; writing—original draft preparation, D.S. and R.Y.; writing—review and editing, D.S.; visualization, R.Y.; supervision, H.W. and Y.F.; project administration, D.S. and H.W.; funding acquisition, D.S. All authors have read and agreed to the published version of the manuscript.
Funding
This research was funded by Japan Society for the Promotion of Science, grant number 19K14328.
Institutional Review Board Statement
This research complied with the Ethics Regulations related to Research with Human Subjects of Waseda University and was exempted from ethics review and approval as a result of checking the Application Guidelines for Ethics Review.
Informed Consent Statement
Patient consent was waived due to the confirmation result of the Ethics Regulations related to Research with Human Subjects of Waseda University.
Data Availability Statement
Not Applicable.
Acknowledgments
I would like to thank the people at the educational institutions who helped me with the experiment.
Conflicts of Interest
The funders had no role in the design of the study; in the collection, analysis, or interpretation of data; in the writing of the manuscript, or in the decision to publish the results.
Appendix A

Table A1.
Programming Thinking Skills Rubric.
| Category | Item | Stage 5 | Stage 4 | Stage 3 | Stage 2 | Stage 1 |
|---|---|---|---|---|---|---|
| Understanding of the algorithm (the concept of the algorithm) | Sequence | It can be tied to understand the sequence of ideas with other ideas | Multiple things the in’s order, can be considered in conjunction | It can be multiple things the have’s order, respectively | It is possible that it is the order for one thing | Do not understand the concept of sequence |
| Branch | Able to connect the idea of branching to other ideas. | Consider the plurality of conditions for a matter can be branched in combination | It can be branched in a plurality of conditions for a matter | It can be branched at one condition for a certain matter | Do not understand the concept of branch | |
| Repetition | The concept of repetition can be combined with other ideas. | It can be used to combine multiple iterations (double loop) | You can notice from one procedure to the plurality of iterations | You can notice a certain procedure or one iteration | Do not understand the concept of repetition | |
| Variable | It is possible to link the concept of variables and other ideas | It is possible to make multiple variables associated with a certain matter | It is possible to create multiple variables for a certain matter | It is possible to make one of the variables for a certain matter | Do not understand the concept of variable | |
| Array | It is possible to link the idea of the sequence with other ideas | It can be in unity associated with some of the elements as | Can some elements into a plurality of separate unity | It can be some of the elements in one of unity | Do not understand the concept of array | |
| Function | It is possible to link the concept of a function and other ideas | Summarized the several steps in the form associated with each of the plurality of elements | It is summarized a few steps into a plurality of elements | It is summarized a few steps to one of the elements | Do not understand the concept of function | |
| Recursion | It is possible to link the concept of recursion to the other way of thinking | Notice cannot be a comeback can function, use recursion for recursion can function | For some functions, it can be issued to call the function itself in the function | For some functions, Kizukeru call the function itself in the function | Do not understand the concept of recursion | |
| Sort | It is possible to link the idea of the sort to other ideas | It can be sorted in an optimal way associated with some of the elements to the element | It is possible to sort each with some of the elements of a plurality of different ways | It can be sorted in one way some elements | Do not understand the concept of sorting |
Appendix B
Table A2.
Programming-Thinking Skills Rubric (Continuation1).
| Category | Item | Stage 5 | Stage 4 | Stage 3 | Stage 2 | Stage 1 |
|---|---|---|---|---|---|---|
| Thinking in the design and creation of the program | Subdivision of the problem | Can subdivide the problem, it is possible to make the solutions and other things subdivided problem | It can be divided into several smaller problems associated with major problems | It can be separated from a big problem into smaller problems | It is possible to find one small problem from a big problem | Cannot subdivide the problem |
| Analysis of events | It is the analysis of the events, the results of the analysis can be used in problem-solving and other things | It can be found several factors (causes) related to an event | You can find multiple factors (causes) for a certain event | You can find one factor (Cause) about a certain event | Cannot analyze events | |
| Extraction operation | Operation can be extracted, the extracted operation can be utilized to solve problems and other things | It can be withdrawn a plurality of operations associated with existing matter | It is possible to extract a plurality of operations from the existing things | It is possible to extract one of the operations from the existing things | Cannot extract operation | |
| Construction of the operation | Following the purpose to build an operation, it can be used in problem-solving and other things | You can build more of the operations related to suit your purpose | You can build a plurality of operations following the purpose | You can build one operation by the purpose | Cannot build operation | |
| functionalization | Big thing can function reduction, can be utilized for their problem-solving and other things that | Can be summarized into several smaller steps associated with large things that | For large things that can be summarized into several smaller steps | Can be summarized for the big things that, one in small steps | Cannot function of | |
| Generalization | Be generalized to various things, it can be used for problem-solving and other things | It is possible to combine the common parts of the various things in the big concept | It can represent multiple things to a large concept | It can express one thing as a great concept | Cannot be generalized |
Appendix C
Table A3.
Programming-Thinking Skills Rubric (Continuation2).
| Category | Item | Stage 5 | Stage 4 | Stage 3 | Stage 2 | Stage 1 |
|---|---|---|---|---|---|---|
| Thinking in the design and creation of the program | Abstraction | Big thing can abstract for, can be used for their problem-solving and other things that | Be focused on a plurality of elements associated with large things that | For large things that can focus on several important factors | For large things that can focus on one important element | Cannot be abstracted |
| inference | Hypothesized cause to the problem, it can be utilized to resolve methods (deduction and induction) were derived problem-solving and other things on the basis thereof | Hypothesized cause to the problem, derivable how to solve based thereon (deductive, inductive) | You can both the following (independent form) 1. is a hypothesis of the cause for the problem. 2. derivable how to solve the problem | You are either the following 1. is a hypothesis of the cause for the problem. 2. derivable how to solve the problem | Cannot be inferred | |
| Logical algebra | It can be used in conjunction with logical algebra and other ideas | It can be used in combination logical sum, logical product, a logical negation | Logical sum, logical product, and understand more about the logical negation | Is the logical sum, logical product, one of the logical NOT understand | Do not understand the logic of algebra | |
| operator | It is possible to use the operator in conjunction with other ideas | Can be used in conjunction to understand several types of operators | We are familiar with several types of operators | We are familiar with one type of operator (assignment operators, arithmetic operators, comparison operators, Boolean operators, bitwise) | Do not understand the operator | |
| Understanding of the program (reading, editing, and evaluation) | Understanding of the program | Comprehension of procedures and operations, evaluation, to understand the editing, can be utilized in problem-solving and other things | Comprehension of procedures and operations, evaluation, can be associated with the editing | Possible reading of procedures and operations, evaluation, editing each | It is possible to read the procedures and operations | Do not understand the program |
References
- Stegeman, M.; Barendsen, E.; Smetsers, S. Designing a rubric for feedback on code quality in programming courses. In Proceedings of the Koli Calling 2016: 16th Koli Calling International Conference on Computing Education Research, Koli, Finland, 24–27 November 2016; pp. 160–164. [Google Scholar]
- Alves, N.D.C.; von Wangenheim, C.G.; Hauck, J.C.R.; Borgatto, A.F. A large-scale evaluation of a rubric for the automatic assessment of algorithms and programming concepts. In Proceedings of the SIGCSE ‘20: The 51st ACM Technical Symposium on Computer Science Education, Portland, OR, USA, 12–14 March 2020; pp. 556–562. [Google Scholar]
- Chen, B.; Azad, S.; Haldar, R.; West, M.; Zilles, C. A validated scoring rubric for explain-in-plain-english questions. In Proceedings of the 51st ACM Technical Symposium on Computer Science Education, Portland, OR, USA, 12–14 March 2020; pp. 563–569. [Google Scholar]
- Saito, D.; Kaieda, S.; Washizaki, H.; Fukazawa, Y. Rubric for Measuring and Visualizing the Effects of Learning Computer Programming for Elementary School Students. J. Inf. Technol. Educ. Innov. Pract. 2020, 19, 203–227. [Google Scholar] [CrossRef]
- Sadhu, S.; Laksono, E.W. Development and validation of an integrated assessment for measuring critical thinking and chemical literacy in chemical equilibrium. Int. J. Instr. 2018, 11, 557–572. [Google Scholar] [CrossRef]
- Demir, K.; Akpinar, E. The effect of mobile learning applications on students’ academic achievement and attitudes toward mobile learning. Malays. Online J. Educ. Technol. 2018, 6, 48–59. [Google Scholar] [CrossRef]
- Christmann, A.; Van Aelst, S. robust estimation of Cronbach’s Alpha. J. Multivar. Anal. 2006, 97, 1660–1674. [Google Scholar] [CrossRef] [Green Version]
- Angell, K. The application of reliability and validity measures to assess the effectiveness of an undergraduate citation rubric. Behav. Soc. Sci. Libr. 2015, 34, 2–15. [Google Scholar] [CrossRef]
- Reising, D.L.; Carr, D.E.; Tieman, S.; Feather, R.; Ozdogan, Z. Psychometric testing of a simulation rubric for measuring interprofessional communication. Nurs. Educ. Perspect. 2015, 36, 311–316. [Google Scholar] [CrossRef] [PubMed]
- ISTE. Standards for Students. Available online: https://www.iste.org/standards/for-students (accessed on 25 January 2021).
- CSTA K-12. Computer Science Standards. 2017. Available online: https://www.doe.k12.de.us/cms/lib/DE01922744/Centricity/Domain/176/CSTA%20Computer%20Science%20Standards%20Revised%202017.pdf (accessed on 25 January 2021).
- Van Solingen, R.; Basili, V.; Caldiera, G.; Rombach, H.D. Goal question metric (GQM) approach. In Encyclopedia of Software Engineering; John Wiley & Sons: Hoboken, NJ, USA, 2002. [Google Scholar]
- Tsuda, N.; Washizaki, H.; Honda, K.; Nakai, H.; Fukazawa, Y.; Azuma, M.; Komiyama, T.; Nakano, T.; Suzuki, T.; Morita, S.; et al. Wsqf: Comprehensive software quality evaluation framework and benchmark based on square. In Proceedings of the 2019 IEEE/ACM 41st International Conference on Software Engineering: Software Engineering in Practice (ICSE-SEIP), Montreal, QC, Canada, 25–31 May 2019. [Google Scholar]
- Brown, T.A. Confirmatory Factor Analysis for Applied Research; The Guilford Press: New York, NY, USA, 2006. [Google Scholar]
- DeVellis, R.F. Scale Development: Theory and Applications; SAGE Publications: Thousand Oaks, CA, USA, 2003. [Google Scholar]
- Jackson, J.E. Oblimin rotation. In Wiley StatsRef: Statistics Reference Online; John Wiley & Sons: Hoboken, NJ, USA, 2014. [Google Scholar]
- Arcuria, P.; Morgan, W.; Fikes, T.G. Validating the use of LMS-derived rubric structural features to facilitate automated measurement of rubric quality. In Proceedings of the 9th International Learning Analytics & Knowledge Conference, Tempe, AR, USA, 4–8 March 2019; pp. 270–274. [Google Scholar]
- Catete, V.; Lytle, N.; Barnes, T. Creation and validation of low-stakes rubrics for k-12 computer science. In Proceedings of the 23rd Annual ACM Conference on Innovation and Technology in Computer Science Education, Larnaca, Cyprus, 29 June–3 July 2018; pp. 63–68. [Google Scholar]
- Mustapha, A.; Samsudin, N.A.; Arbaiy, N.; Mohammed, R.; Hamid, I.R. generic assessment rubrics for computer programming courses. Turk. Online J. Educ. Technol. 2016, 15, 53–68. [Google Scholar]
- Allen, S.; Knight, J. A method for collaboratively developing and validating a rubric. Int. J. Scholarsh. Teach. Learn. 2009, 3, 10. [Google Scholar] [CrossRef] [Green Version]
Figure 1.
The definition of a statistical evaluation method for the characteristics of a rubric.

Figure 2.
The statistical method applied and defined using the GQM method.

Figure 3.
Ugokashite-Miyo.

Figure 4.
Programming Quiz.

Figure 5.
Puyo Puyo Scratch * Copyright of Puyo Puyo belongs to SEGA (The authors have obtained permission for use). © SEGA.
Figure 5.
Puyo Puyo Scratch * Copyright of Puyo Puyo belongs to SEGA (The authors have obtained permission for use). © SEGA.

Figure 6.
Scratch Quiz.

Figure 7.
Evaluation result (School A).

Figure 8.
Evaluation result (School B).

Figure 9.
Evaluation result (School C).

Table 1.
Example of Rubric.
| Learning Perspective | Learning Goals | |||||
|---|---|---|---|---|---|---|
| Category | Item | Stage 5 | Stage 4 | Stage 3 | Stage 2 | Stage 1 |
| Thinking in the design and creation of the program | Subdivision of the problem | Can subdivide the problem, it is possible to make the solution and other things a subdivided problem | It can be divided into several smaller problems associated with major problems | It can be reduced from a big problem into smaller problems | It is possible to find one small problem from a big problem | Cannot subdivide the problem |
| Analysis of events | It is the analysis of the events, the results of the analysis can be used in problem-solving and other things | Several factors (causes) related to an event can be found | You can find multiple factors (causes) for a certain event | You can find one factor (cause) about a certain event | Cannot analyze events | |
Table 2.
The properties required in the rubric were defined and summarized.
| Name | Definition | Details |
|---|---|---|
| Factor correspondence rate | X = A/B | A: Number of factors in the rubric that matches the evaluation objective B: Number of concepts in the evaluation objective |
| Intrinsic Consistency | X = A/(A − 1) + (1 − B/C) | A: Number of items B: Total variance of each item C: Variance of the total score |
| Item Correlation | Xn = A − Bn | A: Overall alpha coefficient Bn: Alpha coefficient when the nth item is deleted |
Table 3.
The three types of classes.
| Label | Subject | Number of Students | Number of Quizzes |
|---|---|---|---|
| A | Arithmetic | 47 | 13 |
| B | Science | 36 | 9 |
| C | Information | 18 | 10 |
Table 4.
Rubric and quiz correspondence (School A).
| Q1 | Q2-1 | Q2-2 | Q2-3 | Q3-1 | Q3-2 | Q3-3 | Q3-4 | Q4-1 | Q4-2 | Q5 | Q6-1 | Q6-2 | |
|---|---|---|---|---|---|---|---|---|---|---|---|---|---|
| Sequence | 2 | 2 | |||||||||||
| Branch | 3 | ||||||||||||
| Repetition | 2 | 2 | |||||||||||
| Subdivision of the problem | 4 | 4 | 4 | 2 | 2 | 2 | 2 | 2 | |||||
| Analysis of events | 2 | 2 | 2 | 2 | |||||||||
| Extraction operation | 3 | 3 | |||||||||||
| Construction of the operation | 3 | 3 | |||||||||||
| functionalization | 2 | 2 | 2 | ||||||||||
| Generalization | 4 | 4 | 4 | ||||||||||
| Abstraction | 3 | 3 | 3 | ||||||||||
| Inference | 2 | 2 | 2 | ||||||||||
| Operator | 2 | 2 |
Table 5.
Rubric and quiz correspondence (School B).
| Q1 | Q2-1 | Q2-2 | Q2-3 | Q3-1 | Q3-2 | Q4 | Q5 | Q6-1 | Q6-2 | |
|---|---|---|---|---|---|---|---|---|---|---|
| Sequence | 2 | 2 | ||||||||
| Branch | 2 | 3 | ||||||||
| Repetition | 2 | 2 | ||||||||
| Subdivision of the problem | 2 | 2 | ||||||||
| Extraction operation | 3 | 3 | ||||||||
| Construction of the operation | 3 | 3 | ||||||||
| Operator | 2 | 2 |
Table 6.
Rubric and quiz correspondence (School C).
| Q1 | Q2 | Q3 | Q4 | Q5 | Q6 | Q7 | Q8 | Q9 | Q10 | |
|---|---|---|---|---|---|---|---|---|---|---|
| Sequence | 3 | 3 | 3 | 3 | 3 | 3 | 3 | 3 | 3 | 3 |
| Branch | 3 | 3 | 3 | 3 | 3 | 3 | ||||
| Repetition | 3 | 3 | 3 | 3 | 3 | 3 | ||||
| Variable | 3 | 3 | 3 | 3 | 3 | 3 | ||||
| Array | 3 | |||||||||
| Function | 2 | |||||||||
| Analysis of events | 2 | 3 | 3 | 3 | 3 | 3 | 3 | 3 | 3 | 3 |
| Construction of the operation | 2 | |||||||||
| Functionalization | 2 | |||||||||
| Understanding of the program | 2 | 2 | 2 | 2 | 2 | 2 | 2 | 2 | 2 | 2 |
Table 7.
KMO values.
| A | B | C | |
|---|---|---|---|
| KMO value | 0.519 | 0.709 | 0.541 |
Table 8.
The factor loadings for each evaluation result (School A).
| Q | Factor1 | Factor2 | Factor3 |
|---|---|---|---|
| Q1 | 0.403 | 0.099 | −0.153 |
| Q2-1 | −0.047 | 0.050 | 0.658 |
| Q2-2 | 0.163 | −0.015 | 0.700 |
| Q2-3 | 0.025 | 0.499 | 0.446 |
| Q3-1 | 0.971 | −0.087 | 0.024 |
| Q3-2 | 0.971 | −0.087 | 0.024 |
| Q3-3 | 0.928 | 0.091 | 0.008 |
| Q3-4 | 0.928 | 0.091 | 0.008 |
| Q4-1 | −0.126 | 0.869 | −0.001 |
| Q4-2 | 0.095 | 0.840 | −0.052 |
| Q5 | 0.134 | 0.263 | −0.006 |
| Q6-1 | −0.010 | −0.126 | 0.684 |
| Q6-2 | 0.352 | 0.485 | −0.076 |
Table 9.
The factor loadings for each evaluation result (School B).
| Q | Factor1 | Factor2 |
|---|---|---|
| Q1-1 | 0.18 | 0.30 |
| Q1-2 | −0.10 | 0.30 |
| Q2 | −0.11 | 0.58 |
| Q3-1 | 0.94 | −0.01 |
| Q3-2 | 0.99 | −0.01 |
| Q4 | 0.43 | 0.07 |
| Q5 | 0.03 | 0.55 |
| Q6-1 | −0.01 | 0.88 |
| Q6-2 | 0.40 | 0.46 |
Table 10.
The factor loadings for each evaluation result (School C).
| Q | Factor1 | Factor2 |
|---|---|---|
| Q1 | 0.10 | 0.68 |
| Q2 | 0.48 | 0.11 |
| Q3 | 0.10 | 0.84 |
| Q4 | 0.37 | 0.28 |
| Q5 | 0.80 | 0.03 |
| Q6 | 0.62 | −0.42 |
| Q7 | 0.48 | −0.44 |
| Q8 | 0.81 | 0.14 |
| Q9 | 0.30 | 0.28 |
| Q10 | 0.72 | 0.12 |
Table 11.
Alpha coefficients results.
| A | B | C | |||
|---|---|---|---|---|---|
| Q | α | Q | α | Q | α |
| Overall | 0.841 | Overall | 0.767 | Overall | 0.778 |
| Q1 | 0.84 | Q1-1 | 0.723 | Q1 | 0.778 |
| Q2-1 | 0.841 | Q1-2 | 0.759 | Q2 | 0.756 |
| Q2-2 | 0.832 | Q2 | 0.728 | Q3 | 0.779 |
| Q2-3 | 0.831 | Q3-1 | 0.685 | Q4 | 0.760 |
| Q3-1 | 0.809 | Q3-2 | 0.677 | Q5 | 0.723 |
| Q3-2 | 0.809 | Q4 | 0.721 | Q6 | 0.769 |
| Q3-3 | 0.803 | Q5 | 0.717 | Q7 | 0.788 |
| Q3-4 | 0.803 | Q6-1 | 0.696 | Q8 | 0.714 |
| Q4-1 | 0.847 | Q6-2 | 0.685 | Q9 | 0.776 |
| Q4-2 | 0.835 | Q10 | 0.733 | ||
| Q5 | 0.847 | ||||
| Q6-1 | 0.842 | ||||
| Q6-2 | 0.831 | ||||
Table 12.
The results of measurement by statistical methods.
| Statistical Methods | A | B | C |
|---|---|---|---|
| Factor correspondence ratio | 1 | 0.86 | 0.89 |
| Internal consistency | 0.841 | 0.767 | 0.778 |
| Inter-item correlation | Q4-1/Q5/Q6-1 | N/A | Q7 |
Table 13.
The results of measurement by statistical methods.
| Question | A | B | C |
|---|---|---|---|
| Q1: Is the rubric-based assessment consistent with the purpose of the assessment? | Consistency. | Generally consistent | Generally consistent |
| Q2: Is it possible to evaluate the items for evaluation purposes using the rubric? | Evaluated | Generally evaluated | Generally evaluated |
| Q3: Do the rubric’s assessment items evaluate a consistent concept? | Evaluated | Generally evaluated | Generally evaluated |
| Q4: Are the rubric’s evaluation items appropriate in terms of consistency? | Generally appropriate | Reasonable | Generally appropriate |
Publisher’s Note: MDPI stays neutral with regard to jurisdictional claims in published maps and institutional affiliations. |
© 2021 by the authors. Licensee MDPI, Basel, Switzerland. This article is an open access article distributed under the terms and conditions of the Creative Commons Attribution (CC BY) license (https://creativecommons.org/licenses/by/4.0/).
Share and Cite
MDPI and ACS Style
Saito, D.; Yajima, R.; Washizaki, H.; Fukazawa, Y. Validation of Rubric Evaluation for Programming Education. Educ. Sci. 2021, 11, 656. https://0-doi-org.brum.beds.ac.uk/10.3390/educsci11100656
AMA Style
Saito D, Yajima R, Washizaki H, Fukazawa Y. Validation of Rubric Evaluation for Programming Education. Education Sciences. 2021; 11(10):656. https://0-doi-org.brum.beds.ac.uk/10.3390/educsci11100656
Chicago/Turabian StyleSaito, Daisuke, Risei Yajima, Hironori Washizaki, and Yoshiaki Fukazawa. 2021. "Validation of Rubric Evaluation for Programming Education" Education Sciences 11, no. 10: 656. https://0-doi-org.brum.beds.ac.uk/10.3390/educsci11100656
Note that from the first issue of 2016, this journal uses article numbers instead of page numbers. See further details here.