Visual Representation Construction for Collective Reasoning in Elementary Science Classrooms


1
Department of Science Education, Chuncheon National University of Education, Chuncheon 24328, Gangwon-do, Korea
2
Faculty of Education, University of Alberta, Edmonton, AB T6G 2G5, Canada
3
The Center for Values in Medicine, Science, and Technology, University of Texas at Dallas, Richardson, TX 75080, USA
*
Author to whom correspondence should be addressed.
Educ. Sci. 2021, 11(5), 246; https://0-doi-org.brum.beds.ac.uk/10.3390/educsci11050246
Submission received: 2 May 2021
/
Revised: 13 May 2021
/
Accepted: 17 May 2021
/
Published: 20 May 2021
Abstract
:There has been a recent increase in research interest in the ways that visual representation is used to facilitate students’ understanding in science classrooms. Yet while many studies have explored individual students’ drawing, few studies have looked into drawing as a collective tool to engage students in thinking and talking together in science classrooms. This study employed a case study approach to understand some of the possibilities for visual representation construction as a collective reasoning tool. By examining two cases of visual representation construction during classroom talk in two elementary science classrooms, this study demonstrates how teachers use visual representation as an instructional strategy, and how visualization engages students’ reasoning, meaning making, and social interactions. We selected two cases that demonstrate the emergence of the teacher’s and students’ drawing activities and analyzed each with a focus on the interactions that occur during the construction of visual representation and how this interaction promotes scientific reasoning and meaning making. For the case analysis, three researchers reviewed the video cases separately several times, and then collectively developed in-depth discussion to bring forth possible themes. The findings include (a) that there were common grounds of visual representation established for collective reasoning, and (b) that visual representations expanded knowledge and reasoning from the individual to social level, thus playing a critical role in students’ reasoning and knowledge building during classroom talk. Pedagogical questions and reflection are discussed for further research on visualization as a cognitive and social tool in classrooms.
1. Introduction
No scientific discipline exists without a visual representation and written language to develop existing questions and investigate various phenomena during scientific problem solving [1,2]. Visual representations, such as drawings, graphs and models, have played significant roles in helping scientists develop hypotheses and make tentative claims that have led to breakthroughs in scientific development. Examples of such visual representations include Watson and Crick’s drawings of DNA structure and the recent visualization of a black hole with gravitational forces [3]. Traditionally, science teachers have used pre-generated visual representations on lecture notes or in textbooks as instructional methods. However, in recent years, there has been growing research interest in students’ use of visual representations to support and enhance their engagement, conceptual gains, and reasoning processes in science classrooms [4,5,6,7]. Researchers have found that student-generated visualization enables and enacts students’ meaning making and reasoning in science classrooms, just as scientists explore and develop claims within scientific communities [8,9]. For example, students’ drawings of dynamic chemical simulations [10] or forces and interactions around galaxies [11] helped them think through the complexity of science concepts [4,12]. Grade seven students who were involved in visual representation construction refined their scientific concepts of forces and developed their reasoning through drawing [13]. Drawings help students think through the approximations of reality and abstractions of scientific concepts and engage in meaning making and problem solving around such concepts [7]. Researchers have further explained that visual representation as a semiotic and epistemological tool often helps students process information more efficiently than verbal or written representations by organizing and highlighting key concepts, thus making information accessible for further thinking and action [14,15,16]. In this regard, visual representations are not only an aid to linguistic communication, but also a critical means to understanding scientific problems, developing and using scientific models, and communicating scientific ideas in all scientific processes [17,18].
Visual representation construction such as drawing can be practiced individually, where students draw to explain their ideas without social interactions. For instance, individual students have used drawings to explain their mental models of science concepts or big ideas in science [19]. In this case, drawings can highlight individual students’ conceptual understandings of different concepts, as well as any misconceptions they hold, which then helps teachers develop instructional attention and guidance [20,21]. Visual representations can be also constructed at a collective level when students interact and generate drawings together during problem solving [11]. In their study of students’ drawings during group work, Tytler et al. [6] explained that students’ collaborative reasoning was enacted and developed through drawing activities. The researchers found that during problem solving, visual representations became a co-constructive and co-representational tool for students’ knowledge negotiation and meaning making. Despite the fact that there have been some studies that looked into students’ visualization construction in collective levels [6,11], there is a lack of discussion on how students’ drawing and reasoning emerges and develops in whole-classroom interactions, especially whole-classroom talks. Thus, this study focused on the use of visualization construction, both by the teacher and students, that emerged during whole-classroom talks, which teachers generated to help students’ meaning making of science concepts. By looking into how drawings emerge and develop through classroom dialogues, this study examined visualization construction as a collective cognitive process to develop students’ reasoning and learning.
1.1. Visualization as a Cognitive Tool
Reasoning in science involves external representations that are constructed during the internal reasoning process [22]. These external representations include models, images, graphs, photos, and many others, as well as devices that make representation possible. From the perspective of distributed cognition, representations are not only external products that make internal thoughts visible, but also functional elements of the reasoning system [23]. Distributed cognition theory explains that cognition can be spread across the cognitive system during complex cognitive activities [24,25,26,27]. Hutchins [25] argued that all cognitive processes include distributed processes at different scales. For example, when learning occurs in the classroom, it does not occur only within an individual student’s brain. Indeed, effective learning involves the entire cognitive system, including brains, bodies, artifacts, environments, and social interactions. These are all elements of the cognitive system and each element affects students’ cognitive processes. Similarly, social interaction amongst students or between the teacher and students as part of the cognitive system enhances or hinders learning. Physical or social learning environments such as classroom settings or activity materials influence learning. Students’ learning is a complex interactive process, since cognition is distributed throughout the system where each element of the learning environment contributes to the thinking process.
When visualization is involved in the learning system, cognition is also distributed to visual representations. Hutchins and Palen’s study of pilots’ communication in an airline cockpit [28] is an example of how cognition is distributed amongst persons, materials, verbal and nonverbal actions, and visual arrangements of the dashboard. In the study, pilots communicated using a combination of words and gestures. Often, words and gestures were used to indicate the dashboard that visually represented the status and various functions of the airplane. However, neither words nor gestures alone made sense in their communication. Without being able to see the graphs, maps, and charts on the dashboard, language itself did not contribute much to the pilots’ understanding. Only when considering all aspects together did the pilots’ communication make sense in the situation at hand. In this example, visual representation is not a subordinate tool that helps communication, but rather a crucial part of the cognitive process that facilitates understanding problems and solutions within a specific context.
Visual representations are used frequently in science classrooms. Teachers often present or draw images, symbols, or graphs to explain complex or abstract concepts. Students also draw images to explain their understanding of scientific concepts. When students draw to explain something or use drawing as a medium of communication with fellow students, the cognition in the learning system is distributed across students’ minds and bodies, constructing actions of visualization, visual representations, devices and physical environment, and social environment and interaction. Accordingly, drawings become part of the distributed representational system that aids reasoning in classrooms [6].
1.2. Visualization as Social Interaction
In classroom situations, visual representations generated by students individually often move beyond the domain of individual reasoning to the collective realm during classroom interactions. While problem solving, students share their own drawings and refer to, compare, and interpret others’ drawings to develop meaning making and solutions [29]. Visual representations are an efficient way to enhance information processes, especially when students and the teacher are engaged in learning about abstract science concepts [4,30]. For instance, in order to explain sound wavelengths, a teacher might draw tight and loose curvy lines on the board. But, how do students understand the concept of wavelengths through the curvy lines? How do these visual representations become a tool to explain one’s ideas to others? Vygotsky’s sociocultural theory of cognitive development [31] explains the complexity of collective reasoning through drawing. Vygotsky described how all the higher-level cognitive functions develop first on an interpsychological plane and later on an intrapsychological plane. Signs such as language, symbols, diagrams, graphs, and so forth as cultural tools require a higher level of cognition as students need to understand what each sign signifies to understand the learning contexts. Accordingly, learning and meaning making in relation to signs take place through social relations first in order to understand their function as communicative tools. For instance, in science classrooms, students understand the concept of ‘gravity’ through language, the physical phenomenon, and teacher interactions that present the connection of falling objects, unseen forces, and the word ‘gravity.’ Once the word gravity is experienced and learned through social interaction, students will be able to use the word in communicating with others. In this regard, Vygotsky explained, “every symbolic activity of the child was once a social form of co-operation and preserves throughout its development, to its highest point, the social method of its functioning” [31] (p. 138). This approach to cognitive development is also aligned with distributed cognition in learning. The child’s learning about gravity takes place through the cognitive system of seeing the falling object, reviewing symbols, and the teacher who scaffolds the connection of these elements for the child’s understanding.
Social interactions in classrooms are introduced as the importance of teacher scaffolding in the zone of proximal development (ZPD) [31]. In the ZPD, students’ every day and scientific domains of certain concepts are linked to develop students’ understanding of science concepts with empirical and concrete experiences. Social relations, such as teachers’ efforts to bring forth the connection of experiences, signs, and meanings, are key elements for effective learning. Classroom talk creates a critical space for student learning through social interactions. Mercer explained that teaching and learning is an intermental process where a teacher and students participate in joint activities such as dialogue [32]. While interacting through mediating systems in classroom talk, the teacher and students jointly think and reason to achieve certain learning objectives while sharing a dynamic, reflexive maintenance of a purposeful consciousness [33]. By using communicative tools (dialogue, writing, gestures, drawings, etc.), the teacher and students verbalize, visualize, and share ideas, and students learn how reasoning and meaning making become accountable publicly through classroom talk. Vygotsky explained that signs and thoughts are interconnected, since as people talk, their ideas develop and vice versa [34]. Thus, the meanings of signs are created and developed through the intersection of thought and speech [19]. Through recursive practice of visual representations in certain scientific contexts, meanings of the signifiers are shared, understood, and accepted among interlocutors and mutual understandings, i.e., common grounds of the signifiers are built as the basis of communication [35,36]. Thus, grounding signifiers into certain contexts is both cognitive and social [37]. For the question of signifying the curvy lines for the concept of wavelengths, the teacher’s drawing of the curvy lines on the board is recursively introduced to explain the concept of wavelength and frequency and students adapt the lines to explain their understanding of wavelength and frequency in future conversations. Knowing what is shared as a common ground is also important as the teacher and students change their communication patterns, that is, they may use less words when speakers know there is the common knowledge of certain visual representations shared with their recipients [36].
Visualization is a mediating system that is experienced, learned, and developed through classroom interactions. Visualization intersects and creates meaning through classroom interactions [38]. It formulates one’s thoughts and one’s thoughts are formulated and communicated through visualization [19]. Accordingly, in this study, we understand visual representations as cognitive, dialogical, and collective tools in science classrooms. We strived to explore how drawings take place and how they become cognitive and dialogical tools in whole classroom talk by examining children’s reasoning and meaning making during classroom drawings and interactions. While many studies have explored individual students’ drawing, we attempted to look into how drawings and dialogues develop together for children’s reasoning. We explored the possibilities of collective drawing in two aspects: classroom interactions and scientific reasoning. We examined how the teacher and students interacted through drawing and how the interactions contributed to students’ reasoning, learning, and meaning making.
2. Research Process
2.1. Case Study
A case study involves the study of a case, unit, or phenomenon with boundaries [39]. Merriam used the term “fencing in” to bracket researchers’ choice as a case for their case study. She wrote that the case is “a thing, a single entity, a unit around which there are boundaries. I can fence in what I am going to study” [39] (p. 27). Educational practice is a complex situation where the teacher, learners, and learning environments are consistently intersecting and influencing the process and products of teaching and learning. Thus, determining how to fence and decide the boundaries of the case that is going to be studied is critical for researchers. The boundaries of the case in this study were visualizations constructed in/through social relations in science classrooms. Students and the teacher interact to understand science concepts during whole classroom talk by employing drawings to communicate with each other. Within these boundaries, this study looked closely at cases of classroom interactions with visualization. We developed a thick description and explanation of the cases, which will be provided later in this paper. The descriptive and explanatory nature of the case study method enabled us to understand how visualization emerged in science classrooms, how the teacher and students interacted with each other through visual tools, and how visualized ideas moved students’ reasoning and meaning making forward.
2.2. Cognitive Ethnography
Our case study method was largely based on a cognitive ethnography approach. Ethnography refers to research methods that rely on observations to explore socio-cultural questions [24,40,41]. Ethnography frequently uses data collection methods such as field observations, participant observations, and interviews, and uses data analysis methods such as thematic analysis, grounded theory coding, and case study [41]. Cognitive ethnography is a type of ethnography that aims to understand cognitive processes, in other words how a human brain and mind work individually or in a group to perform cognitive tasks such as problem solving and decision making [41,42]. Thus, cognitive ethnography has been well-used to study cognitive processes in a classroom [42], research laboratories [41,43,44,45], student project groups [46,47,48], professional trainings and performances [23,24,28], and video game learning [49]. In addition to traditional ethnographic methods, cognitive ethnography also uses analytic methods in cognitive science, such as micro-scale discourse analysis, video analysis, highlighting, and cultural model analysis to analyze cognitive processes [23,28,42,46,47,48,50].
2.3. Classroom Videos Selection and Analysis
Classroom videos
This study examined two sets of classroom videos from the studies in which one of the researchers was engaged. The videos were from two Grade 5–6 science classrooms in Western Canada. For Class A, the topic of learning was the weather, and for Class B, the topic of learning was electricity. Both the classes had similar physical learning environments, including an interactive whiteboard at the front of the room, tables and chairs that allowed both individual and group work settings, collections of books and learning materials, a sink, windows, and so on. Both teachers were enthusiastic about science teaching to develop students’ critical thinking and problem-solving skills. Class A included a teacher and 20 students, and Class B included a teacher and 23 students. During the classroom video recordings, no specific pedagogical interventions were applied, except that the classroom teachers were keen on using an inquiry-based teaching approach. Thus, these videos contained natural classroom settings without any experimental treatment and represented everyday situations of learning and teaching in elementary science classrooms.
Pilot analysis
Previous studies showed that discourses, gestures, and artifacts should be holistically analyzed to study cognitive processes [23,28,46,47]. To study students’ cognitive processes, we used microscale discourse analysis, including words, gestures, and drawings that are considered as artifacts. We conducted a pilot analysis to test this method of analysis. First, we reviewed videos and extracted 10 video clips in which drawing construction occurred in science classrooms. Next, we selected one video clip (2:28 min), during which students collectively drew the structure of atoms. The video clip was divided into eight segments, the length of each segment was between three seconds to 30 s. To interpret the status of the student’s cognitive process, we examined each segment for words, gestures, and drawings altogether. For example, if a student stopped in the middle of drawing an atomic model right after talking about electrons, traced her drawing with the pen in the air, not actually touching the screen, then picked up the eraser and erased a few electrons in the drawing, we interpreted this series of actions that she mentally compared what she knew about electrons in the atom (what she talked about) to what she drew, realized the inconsistency between them (stopped drawing), examined her drawing (tracing it), made a decision to correct the gap (erase extra electrons), and took an action (erased electrons). We also highlighted the important cues in the video, added connectors, such as subordinating conjunctions and correlating conjunctions, and filled in gaps in discourses to complete the interpreted description. We reviewed the interpreted description in the perspectives of visual representation for cognitive and social interactions. After the pilot analysis, we determined that the focus of our analysis would be interactions and reasoning during the drawing process.
Video selection and further analysis
After the initial work of video analysis, we reviewed the whole selection of the videos again and selected two cases that showed the most active drawing construction and classroom interactions: one case from the weather unit and the other from the electricity unit. The videos of Case 1 (air pressure and weather devices; 15 min) and Case 2 (electromagnets; 14 min) were transcribed. The researchers individually watched the videos repeatedly to locate scenes that represented what and how interactions and reasoning were taking place around visual representation construction. After multiple reviews and discussions among the researchers, themes emerged and three scenes in each video were extracted. Extracted scenes underwent in-depth and microscale analysis to complete interpreted descriptions of themes as findings. The findings were cross-checked and discussed until the consensus among the researchers was achieved.
3. Results
3.1. Case 1. Air Pressure and Weather Devices in Class A
Many science concepts are abstract and difficult to understand as they are often impalpable, invisible, and elusive for students to experience in everyday life. Air pressure is one such concept. The following case is from Class A, where the teacher attempted to explain how air pressure changes under certain conditions and how it is related to cloud condensation. At the beginning of the lesson, the teacher initiated a class discussion by asking students if they had any questions from the previous lessons. One student shared her confusion about the appearance and disappearance of clouds inside of a 1.5 L plastic bottle when it was squeezed and released. The teacher explained that when the bottle was released after being squeezed, the air pressure inside the bottle became lower, which caused the vapor to condense and a cloud to form inside. During her explanation, the teacher incorporated gestures of squeezing and releasing an imaginary bottle. Following the teacher’s explanation, students freely added what they knew about this notion. Mike, a student, described how he saw a balloon changing size inside a bottle at a science center and asked if what he saw was related to air pressure. The teacher turned toward the interactive whiteboard and made a drawing based on Mike’s description. While drawing, the teacher continued to discuss Mike’s ideas and questions with other students. The teacher generated more drawings in relation to the initial drawing to develop scientific explanation of air pressure and further classroom activities.
Theme 1.
Arrows: symbolic visualization of abstract concepts
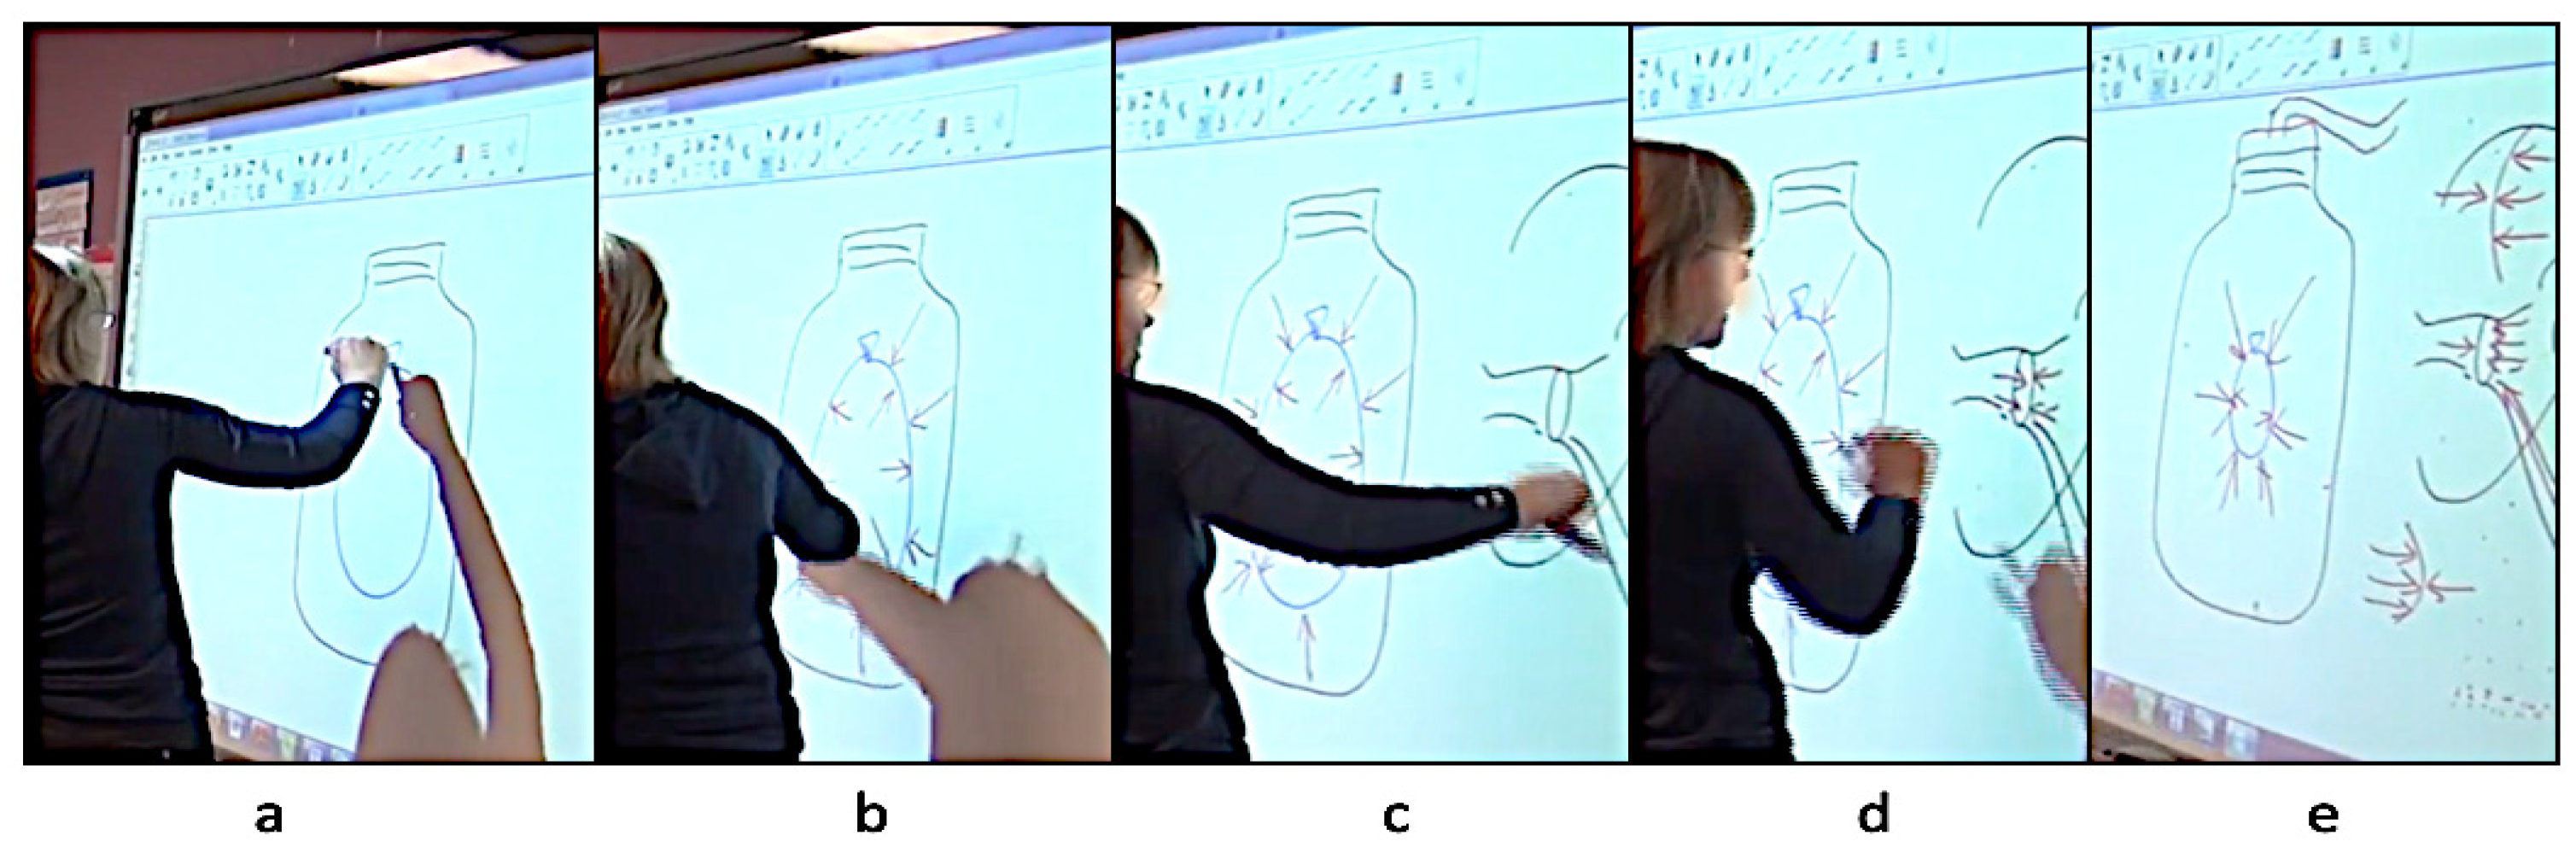
Mike explained that he had observed a balloon changing its size inside a bottle at the science center. He described how when the air inside the bottle was vacuumed, the balloon got bigger and when the air was put back in, the balloon got smaller. He asked if this was related to the idea being discussed in class. The teacher attempted to recap what Mike had explained verbally, then turned toward the interactive whiteboard and started to draw. She drew a jar with a balloon inside (Figure 1a) and many arrows inside and outside of the balloon to show the air pressure around it (Figure 1b). In this scene, Mike’s verbalized experiences were visualized through the teacher’s drawings. His explanation of “air was vacuumed” and “the balloon got bigger” was developed into the changes of air pressure with arrows. While drawing, the teacher kept asking students’ agreement and participation saying “right?”, “okay?”, and “come on, work with me.” Students responded to the teacher’s drawing and explanation by saying, “okay” or “Oh, we’re putting it in”, or they answered the teacher’s questions, e.g., “it [pressure]’s equal.” In this scene, the teacher drew many arrows to explain how air pressure changed. Then she drew an eardrum beside the jar to remind students about a previous lesson (Figure 1c). She asked if students remembered the topic. A student jumped into the conversation and said, “The little people!” The teacher replied, “Like little people pushing your eardrums,” while she continued to draw the eardrum and air pressure with arrows and asked if students remembered the discussion about their experiences of ears popping on an airplane (Figure 1d). She changed the number of arrows to show the different levels of air pressure inside and outside of the eardrum, referring again to students’ experiences of being on an airplane (Figure 1e).
The drawings of the jar, balloon, ear, and eardrum are the visualization of actual objects that can be seen in everyday life or under certain conditions (i.e., eardrum), yet air pressure and its effects on these objects are difficult to observe. To explain this abstract notion of air pressure, the teacher drew arrows around the objects. Air pressure was becoming visualized for students to understand how it affected and was affected by the surrounding conditions and what the changes of the balloon size and the clogged feeling around the eardrum meant in relation to air pressure. While drawing, the teacher changed the numbers, sizes, and directions of the arrows to visualize how the air pressure changed. Students understood that if an arrowhead was toward the right side, it meant something was moving from the left to the right, and in this case specifically, some force was affecting from the left to the right. When students saw three arrows vs. one arrow, they knew three arrows meant more force than one arrow. Similar to this finding, in Hubber, Tytler, and Haslam’s study of students’ visualizations on the concept of force [13], students used arrows to express their ideas on the science of forces. It indicated that students and the teacher shared a common ground of understanding about the arrows as a symbolic tool. Having a common ground of understanding during visual representation is critical to communication and meaning making in classroom teaching and learning.
Theme 2.
Three drawings on the board: visible connection of knowledge
While the teacher was visualizing Mike’s ideas, she was explaining how air pressure worked in the jar. By drawing an eardrum, she recalled students’ previous knowledge and everyday experiences. The teacher said, “when we had our eardrum, remember? We had the ear canal, and there’s the eardrum, and then we now, we have the cochlea in here and all that kind of stuff. And there’s the Eustachian tube that goes down into your throat, right?” She continued to draw how the eardrum was located in the ear, then a student jumped in and said, “And the balance!” Then, the teacher said, “And we said that when the air pressure is equal in the inner ear and the outer ear …”, continuously drawing how air pressure works around the eardrum. She kept moving back and forth between these two drawings by changing the size and number of arrows and explained how these drawings were related to the same concept. Once the teacher and students had discussed air pressure in the jar and around the eardrum, the teacher attempted to connect this idea to the activity she was preparing for the next class, which was for students to make a barometer using balloons, straws, and jars. The teacher then drew an image of how to construct a barometer with the materials (Figure 2a). Now, all three drawings—the balloon in the jar, the eardrum, and the barometer—existed side by side, showing how all three were connected to air pressure. These juxtaposed drawings represented how the concept of air pressure (visualized with balloon and arrows) is connected to what our body feels (the eardrum) and to the measuring device of the air pressure (the barometer). During the explanation of air pressure with the drawings, the teacher also used gestures to visualize air pressure. Whereas the verbal and gestural explanations disappeared in real time, these pictorial visualizations remained on the whiteboard and demonstrated the connection between the ideas. The teacher and students referred to the drawings back and forth to enhance their understanding in the later conversations. Mike’s experience of air pressure in the bottle, students’ previous knowledge of the eardrum, and now the structure and principle of the barometer for the upcoming class were all connected in this visualization (Figure 2a). The teacher continued to draw how the straw would change when the weather and air pressure changed. She drew a straw up and down (Figure 2b) and a line to show how to collect data on the level of air pressure (Figure 2c).
Through her drawing, the teacher was also inviting students to recall their previous knowledge, to connect it to the present concepts, and to understand how the concepts were applied to the principle of a barometer. Accordingly, this case shows the way that drawings anchored and developed the connection of knowledge and experiences that were pointing to the same science concept.
Theme 3.
Teacher-generated visualization and guided reasoning
In this case, classroom talk was initiated by the teacher to encourage students to share their ideas and areas of wonder, which led the conversation onto the topic of air pressure. The teacher adapted drawings as a tool to lead the whole-classroom talk after Mike’s response. She visualized his idea on the whiteboard so that the whole class could understand what he had experienced and wondered together about the experience. Through the teacher’s drawing, Mike’s idea became visually public for other students to think about together. The classroom talk continued with the teacher’s drawing and a verbal exchange of ideas between the teacher and students. While she was drawing, the teacher encouraged students to become engaged in the process by asking questions. Dialogue #1 below shows how drawing was developed through the interactions.

Dialogue #1
 | 01 Teacher | Let’s imagine that I take away some of the air pressure. Inside the jar, okay? So, I’m removing some of the air pressure. Ooh, what is going to—is the pressure on the balloon and outside of the balloon even now? |
| 02 Ss | No. | |
| 03 Teacher | So, what is going to happen to the size of the balloon? Yeah? | |
| 04 Cathy | Two things: you can use a vacuum and like for the tube you can use a vacuum. And … | |
| 05 Teacher | So, I can suck air out, so there’s less (removing arrows around the balloon) | |
 | 06 Cathy | And second of all, kaboom! |
| 07 Teacher | Air out here. So, the balloon will do what? Will it get bigger or smaller? | |
| 08 Cathy | Bigger. | |
| 09 Eden | Kaboom | |
| 10 Teacher | So, it got bigger, right? (erasing and redrawing the balloon around the arrows) Because there’s more pressure on the inside now, so now my balloon is going to become larger. | |
| 11 Eli | And then it can’t hold all the air so then it’ll explode. |
While drawing, the teacher continued to ask questions and students’ answers were directed to the teacher’s drawing. When the teacher asked what would happen if the air in the bottle was sucked out while removing arrows around the balloon (turns 01–05, Dialogue #1), students said the balloon would get bigger (turns 08–09), which showed that students had thought through the connection between air pressure and balloon size. Then the teacher was drawing the balloon bigger and continued the conversation (turns 10–11). The teacher’s drawing was developed with students’ engagement as their ideas developed together through both talk and drawings. In Dialogue #1, the teacher was drawing, but at each step, she asked students questions or sought students’ agreement (“Okay? (turn 01)”, “Yeah? (turn 03)”, “Right?(turn 10)”). When the teacher was not asking questions (turn 05, 10), students voluntarily provided opinions (turn 06, 11). In fact, the teacher did not proceed to the next step without students’ inputs. Also, the teacher kept urging students to think about what happened by saying, “what is going to…” and “do what?” These exchanges indicated that, though the author of drawing looked to be the teacher, the agents of thinking to develop the drawing were the students and the teacher in the collective community of classroom dialogue. It is evident that the teacher’s drawing became a tool to guide students’ reasoning on scientific ideas.
The teacher-generated drawing continued to develop students’ reasoning and meaning making by drawing the barometer activity. She drew what the barometer would look like and showed where each material would be placed. By following the instructions in the drawing, making the device with the given materials would be a simple task. Yet understanding how the device works in relation to air pressure is complex and challenging. Why does the straw on the top of the sealed rim move up and down? What does it mean when the straw moves up and down and how is that notion related to air pressure? What are the scientific principles at work behind the technology of the barometer? These questions require a high level of reasoning for students. Accordingly, to help them reason about how this device was connected to air pressure, it was critical for the teacher to explain how the straw moves up and down by drawing and connecting this notion to their knowledge of the weather and air pressure (Dialogue #2). The teacher reminded students of their previous lesson about the weather and air pressure and asked:
I put a straw across the top of here. And then I have a piece of paper here. What if tomorrow it turns really, really rainy? And the pressure becomes lower, what’s going to happen? Are there going to be more arrows pushing up or down?
Students became engaged in the conversation to develop the drawing as well as their thinking.
Dialogue #2
 | Teacher | Okay, so if there’s more arrows pressing up, which way is our balloon going to bulge? |
| Cathy | Up | |
| Teacher | It’s going to bulge. If it bulges up, which way is the other end of the straw going to … | |
| Cathy | Down | |
| Teacher | Straw’s down … (the teacher draws it down.) And then the next day what if the air pressure gets really high, what’s going to happen? Which way is this going to bulge? | |
 | Eli | It’s getting down. |
| Teacher | It’s going to go bulging downward. If the pressure gets higher then this will bulge down, and then what will happen to our straw? | |
| Eli | Straw? | |
| Teacher | You will get—it will go up. Our straw will go up like this. This is a little bit exaggerated but you get the idea, right? | |
| Ss | Yeah. |
The teacher thoughtfully guided students’ reasoning on the mechanism of the device by questioning and drawing. The teacher-generated drawings were helpful to connect students’ ideas and anchor their reasoning about the mechanism of the barometer based on air pressure. This idea was revisited after students made barometers and collected data in the next class.
3.2. Case 2. Electromagnets in Class B
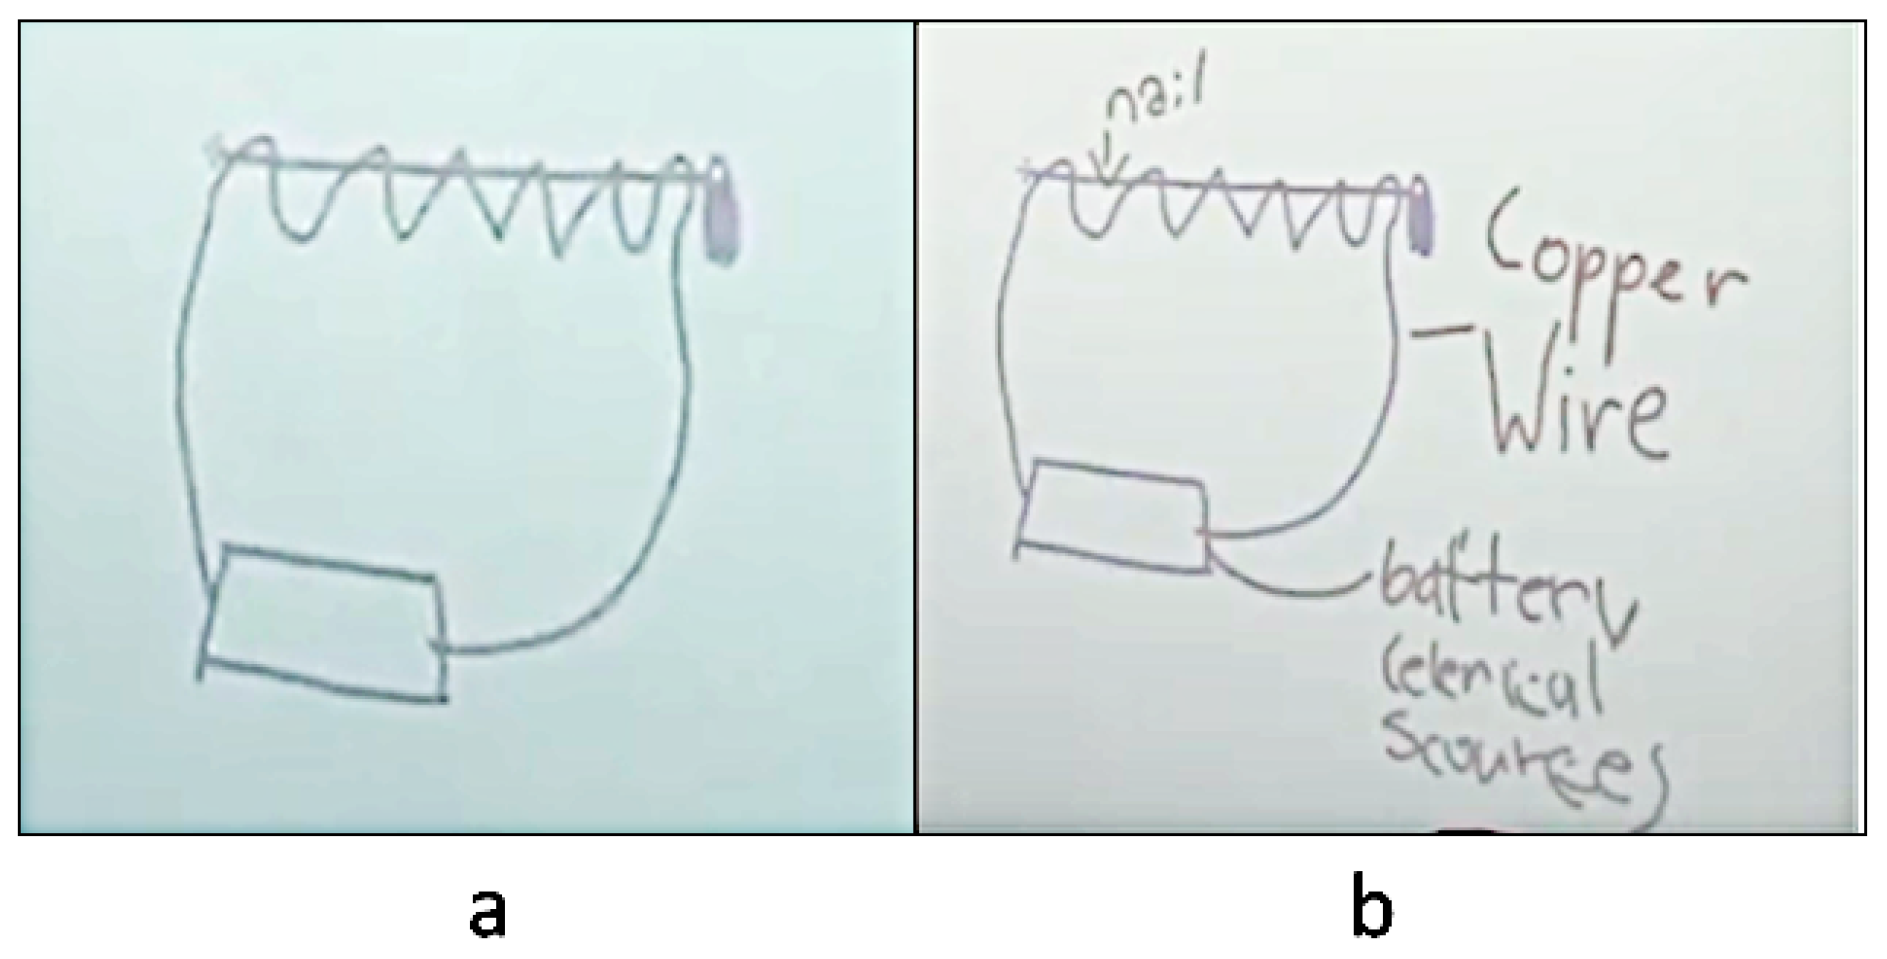
This case from Class B began with the teacher’s request for students to reflect on the previous class about electromagnets. To review students’ understanding, the teacher asked students to draw what they knew. One student went up and drew on the whiteboard (Figure 3a), followed by three other students, one by one, who further elaborated the image on the board. The teacher facilitated students’ drawing by giving additional questions and suggestions such as adding labels. The completed image showed a battery, a nail and a wire that connected the battery and the nail (Figure 3b).
While reviewing the drawing together, one student asked, “Is the nail an electrolyte?” The teacher did not answer directly but instead used the question to stimulate a classroom discussion by raising questions and asking students to expand on each other’s ideas. Students shared their ideas about an electrolyte, a battery, a circuit, a lemon battery, and so on. In the middle of the conversation, the teacher raised another question: “Can we make an electromagnet with a lemon?” Again, students became engaged in a lively discussion, which encouraged them to draw more and reflect on their previous knowledge and the drawings already in front of them. Some students went up to the whiteboard to draw in order to explain their ideas or referred to the drawings done by other students to expand their explanations. During this process, students actively participated in reasoning and meaning making in the shared space. Some of their ideas were not scientifically accurate in their explanations through drawing, which indicated students’ misunderstanding or partial understanding.
Theme 1.
Image of an electromagnet: common ground for reasoning
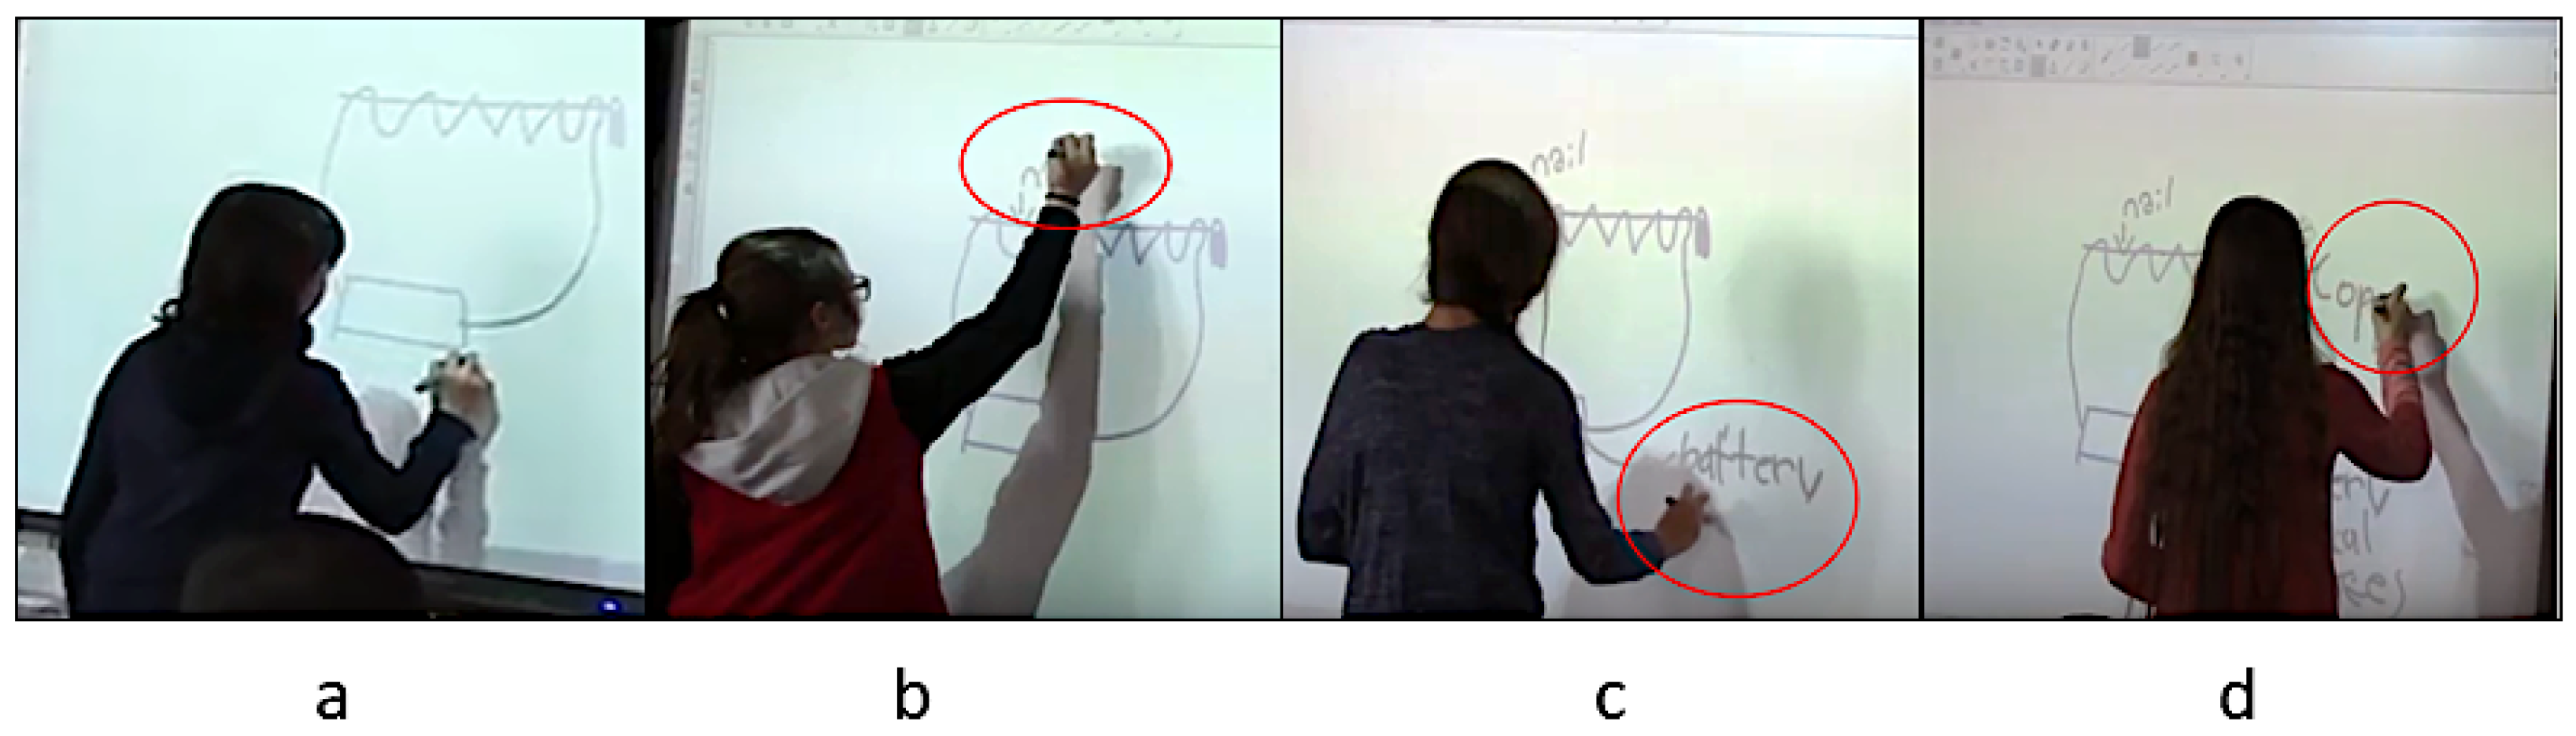
In this case, students collaboratively constructed an image of an electromagnet on the interactive whiteboard. After a student drew the model of the electromagnet that consisted of a battery, a nail, and a wire (Figure 4a), other students added labels to complete the image. The second student added the label ‘nail’ (Figure 4b). The third student added the label ‘battery’ (Figure 4c), then added a supplementary label ‘electrical source’ to the battery. At this point, the teacher asked, “Are you sure the battery is the electrical source?” The student pointed to the image and replied, “This is the battery that is the electrical source.” The fourth student added the label ‘copper wire.’ At first, she wrote ‘wire,’ then she erased it and wrote ‘copper wire’ (Figure 4d). Her addition indicates that this student thought the word ‘copper’ was important in functioning of the electromagnet. The drawing was being expanded collectively and students who did not participate in the actual drawing were verbally agreeing with what had been drawn and were also engaged in the discussion.
While the students expanded the image of the electromagnet by adding labels, they did not alter the initial image drawn by the first student. This indicates that students agreed with the initial image of the electromagnet. Otherwise, each student may have drawn a different image or changed parts of the proposed image, which we observed in other lessons. In this case, the drawn image as a model of an electromagnet was accepted by the students as a shared image and they used it to develop further discussion about electric circuits. This shared image provided students with common ground for reasoning and communication. Students understood what these visualized images meant and there was a certain degree of an unspoken agreement amongst them about how to interpret images of an electromagnet. This common ground became the basis for collective reasoning and meaning making through classroom talk.
Theme 2.
Reasoning through drawing
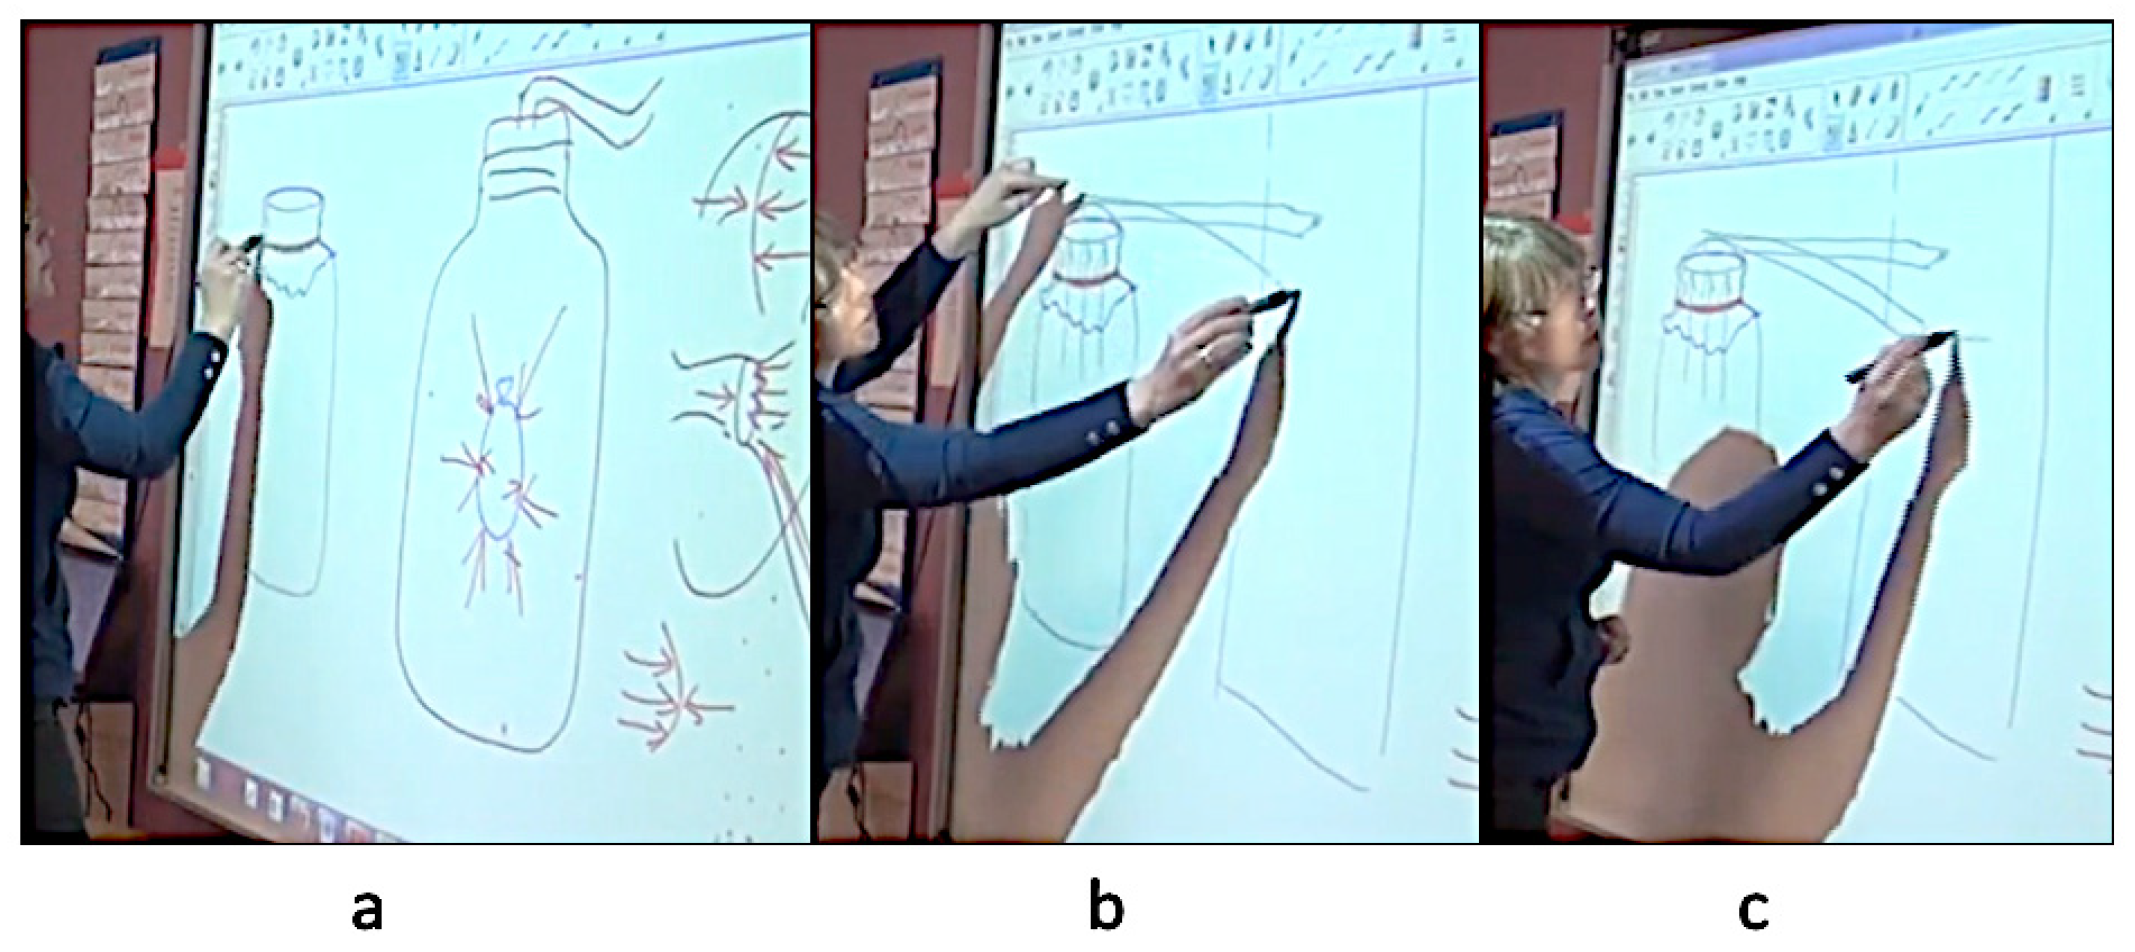
Students’ drawings continued to develop on the interactive whiteboard and their questions and ideas were also developed collectively. Figure 5 below shows an example of reasoning and thinking through drawing. For the question of whether the nail was an electrolyte, students explained their ideas about what an electrolyte was, how electrical current took place, and how zinc and copper acted as electrodes in the lemon battery. While students were actively engaged in the discussion, Rae, who had been quiet until that point, asked the teacher if she could draw to show her thoughts.
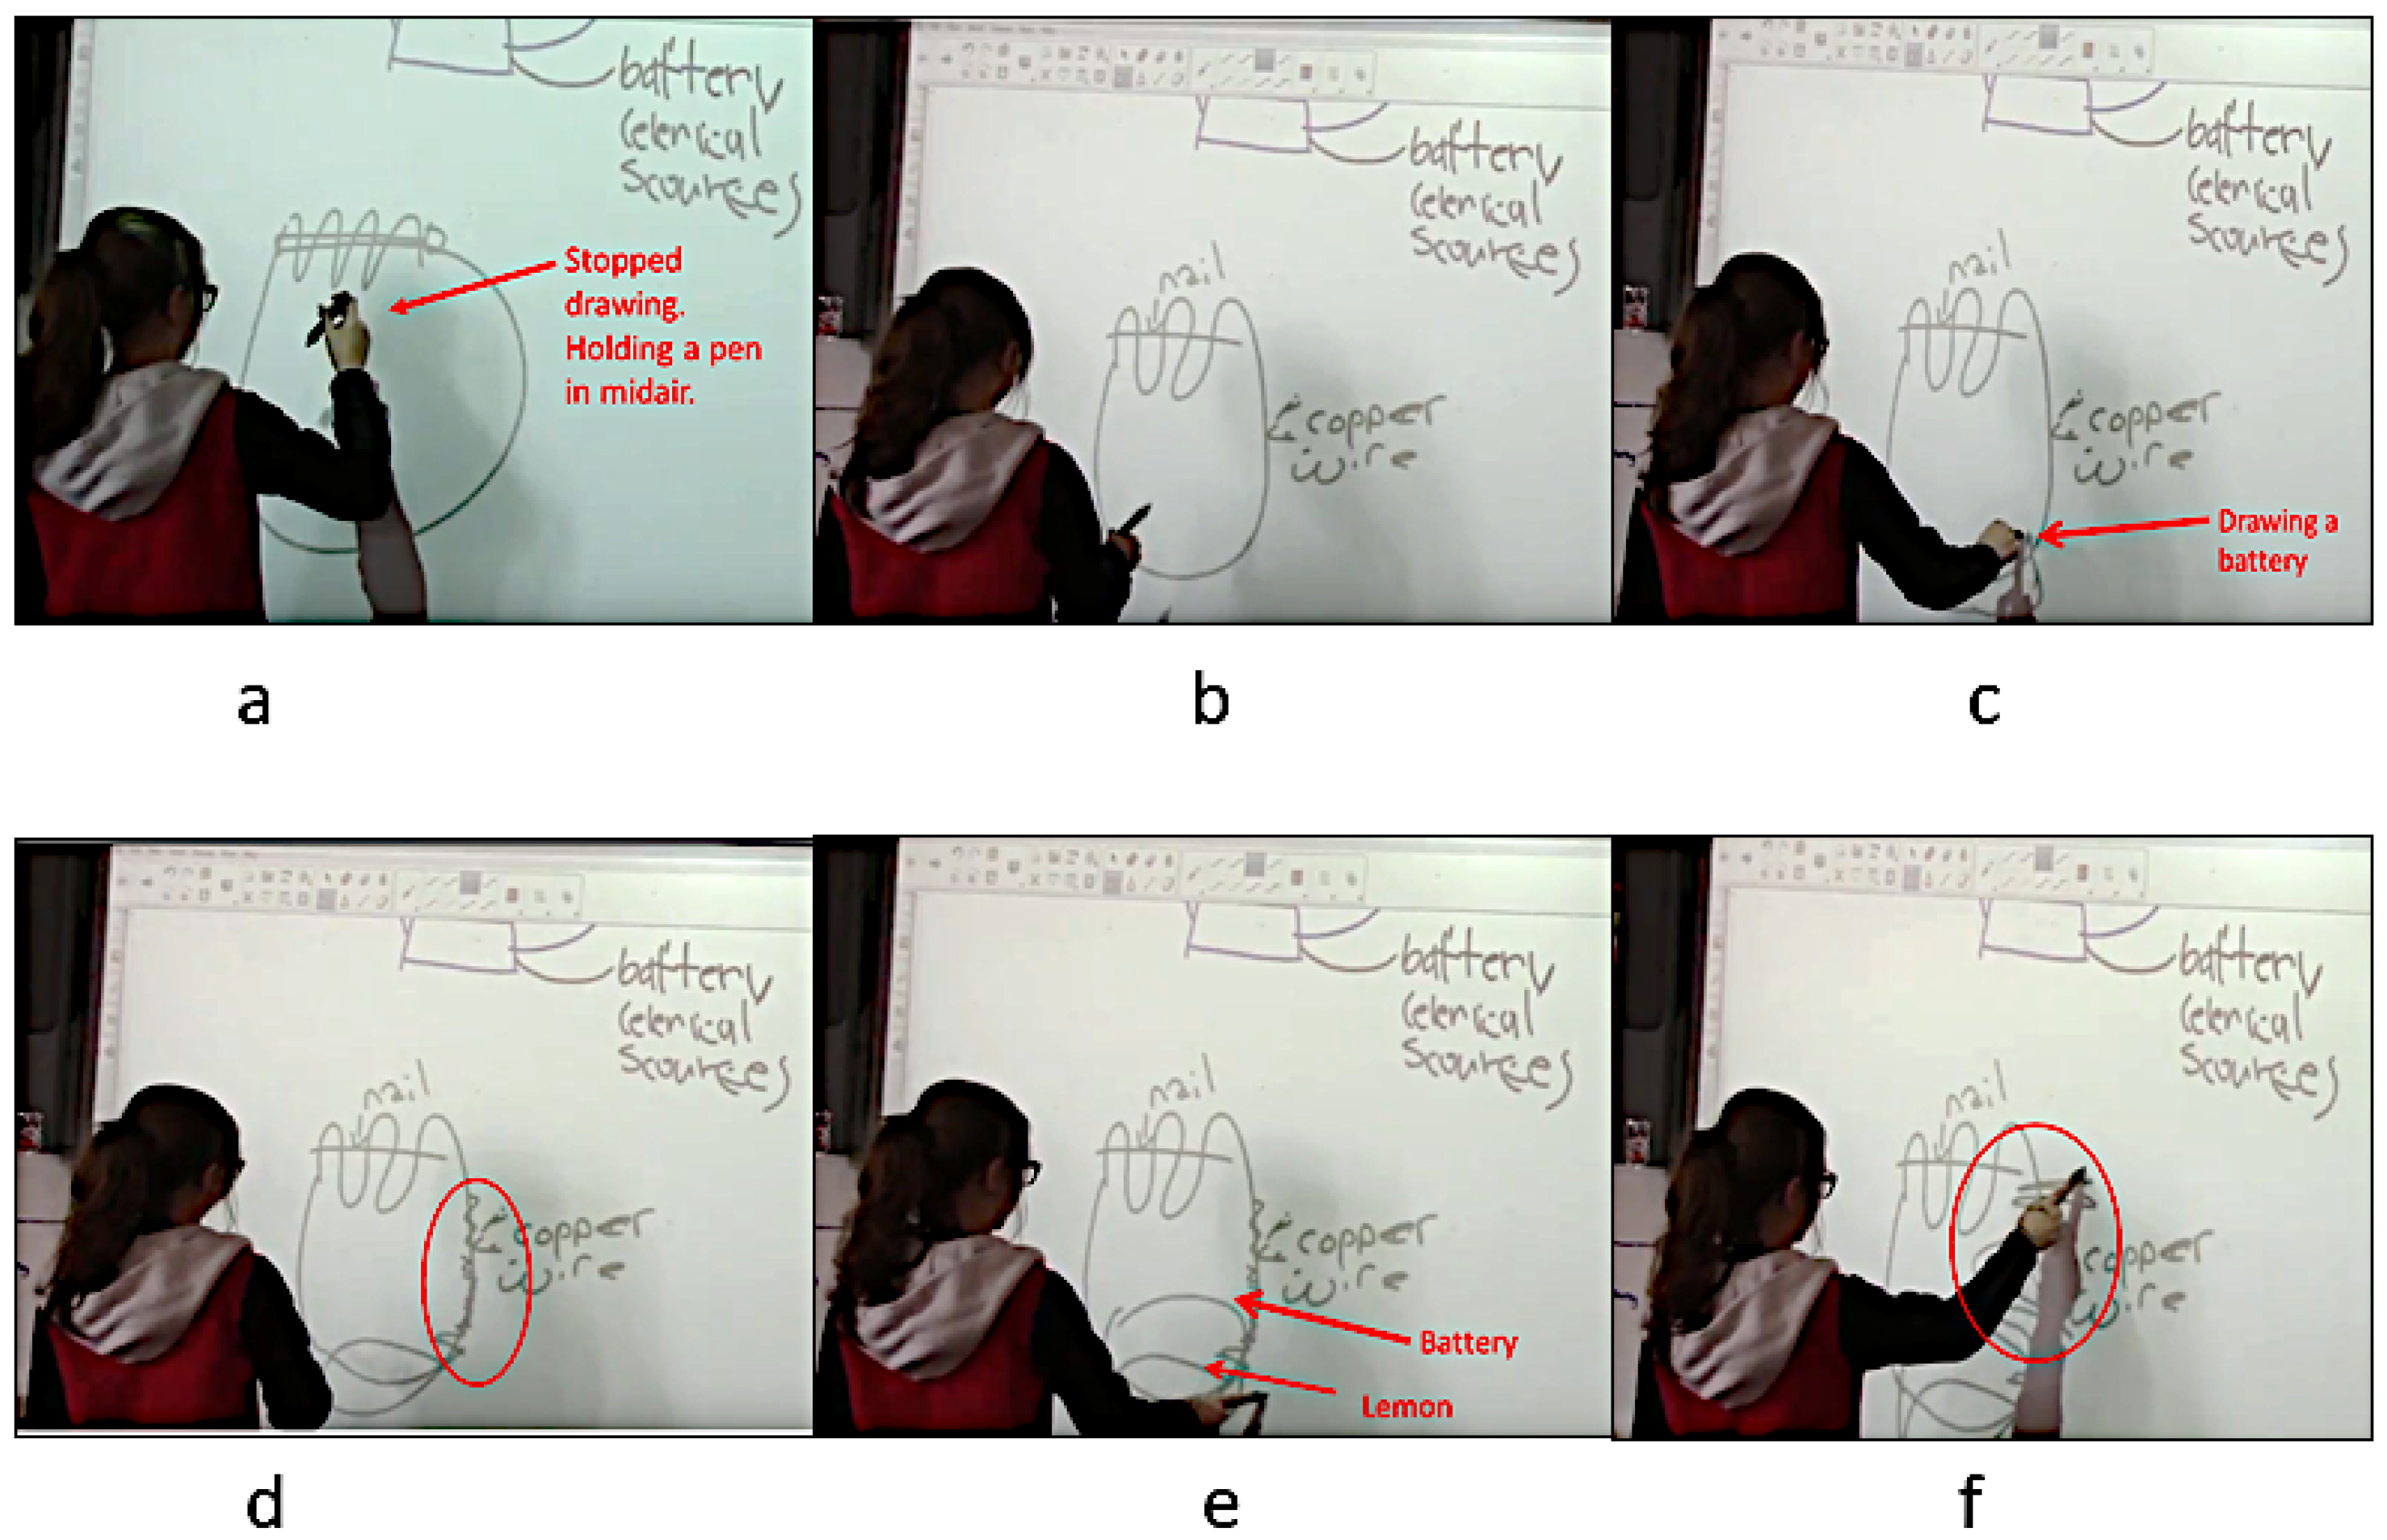
Rae started to draw an electromagnetic circuit on the board. Then, she stopped drawing for several seconds while staring at her drawing and moving the interactive whiteboard pen up and down (Figure 5a). She then erased her whole drawing and drew another one with labels. She stopped again for about ten seconds (Figure 5b). Rae was looking at the drawing and moving the pen around as if she were drawing some more. We do not know what she was thinking at this point, yet evidently, she was thinking something because she soon restarted drawing a battery and explained her thinking (Figure 5c). Rae said, “So you need a battery. But if there’s a battery, you would have to have… (inaudible).”
The teacher summarized and recapped Rae’s explanation by saying, “So you’re suggesting that the battery is very important. If you didn’t have the battery, you wouldn’t get an electric current.” Rae kept thinking about the role of the lemon in the circuit as she replaced the battery with a lemon seen in Figure 5d and continued to draw small waves along the wire and explained the weak electric current. Rae drew the battery on the top of the lemon to compare the electric current generated by the battery and the lemon (Figure 5e). To show the stronger electric current with the battery, she drew big waves along the wire. By showing the visible difference through drawing, she was working to show the comparison between strong and weak electric currents (Figure 5f).
During this process, Rae’s drawing and explanation were being developed with ideas of the elements of circuits and the movement and strengths of electric currents. At times, she paused, then continued to draw. When she completed the circuit drawing, she started to add verbal explanations. Yet, drawing seemed a crucial tool for her to think through what she knew about electricity, how to connect her knowledge to the current problem, and how to explain it. At times, Rae’s explanations during this process included scientifically incorrect ideas and showed that she did not completely understand the function and mechanism of electromagnets and electric current, which is part of the learning process. However, the action of drawing itself was critical to enhancing students’ reasoning and thoughts and for the teacher to develop instructional strategies for helping to clear up any misconceptions.
Theme 3.
Student-generated visualization and shared reasoning
What we observed in this case can be an example of student-generated drawing and reasoning. Students connected and compared their knowledge, asked questions, and had lively discussions to answer those questions. In the active discussion, the teacher only facilitated the classroom discussion by occasionally adding supplementary questions or redirecting the discussion when the discussion digressed or when she noticed a misconception. Students sought to reason why and how things happened with their peers. Sometimes they supported others’ claims and at other times, they suggested counterclaims. One student’s drawing and talk initiated another student’s idea and drawing and later engaged more students to think and draw together. The process of reasoning was shared and meaning making and explanation were developed in the collective space. The example of the question, ‘if the nail is an electrolyte (or not)’ shows how reasoning and meaning making is shared in/through drawing in classroom interactions. Once the question was raised by a student, the class discussion became active for about twelve minutes. Students came up with different ideas to make sense of the question and answers. Iris claimed that the nail was not an electrolyte because even if it were taken out, the electricity would still go through. Rose said it was not, because there should be a lemon with zinc and copper to talk about an electrolyte. Daisy agreed with the idea, explaining that the two things (zinc and copper) needed to be connected to the wire in the fruit battery. Therefore, even though students agreed that a nail is not an electrolyte, their justifications were somewhat different.
While Rae was adding her ideas by drawing (Figure 5), the teacher asked the class if they could make an electromagnet with a lemon. Anna jumped into the conversation by saying, “I think that with the lemon it might not work because the battery maybe has like the electrolyte and the copper and zinc inside it already, but with the lemon you have to add it so that it works.” Eve added, “I don’t think it was working with just adding the lemon or copper or zinc or anything because the lemon itself is not an energy source. And also, the electromagnet is created when the electric current is moving.” Then, Iris stood up, walked to the interactive whiteboard and scrolled up the screen to find the first drawing of an electromagnet and explained her thoughts. She again scrolled down to the second drawing by Rae and continued her explanation (Dialogue #3).
Dialogue #3
  | Iris | I don’t think it would work because if you get this circuit − most of the people got their things to work, they had two batteries and I think the only group that was successful doing it with one battery was Anna’s group and they had, they could only pick up grab a paper pin and it was very low magnet. And a battery can charge say like − like a hundred increment size, (then she scrolls down the screen to show another drawing and continues) |
| Iris | And a lemon couldn’t possibly really charge anything, well very small things, so I don’t think we create any electromagnets because it was too hard for a single battery to charge. | |
| Teacher | That makes me think of the multimeters with those − the measurements with those lemons, those, very lowest. | |
| Iris | Maybe if you had a lot of lemons but that would be able to try to have to get, like, a hundred lemons and then all connect them when you could just use batteries. |
The teacher responded to Iris’s claim about “a lot of lemons.” She asked if adding more lemons mattered in the lemon battery, which raised questions Iris could not answer. Alice jumped in and explained that what was needed was extra zinc and copper, not lemons. She suggested how to make the electric current strong in the current model of the electromagnet. She went to the interactive whiteboard and added something over the first collective drawing.
Dialogue #4
  | Alice | If you put paper around here, then electricity is going around here. |
| (Alice starts another drawing of a nail on the board). | ||
| Alice | Maybe at the first, a nail and then put some paper on it and some wiring around it, maybe it will make more electromagnetism. | |
| Teacher | Did you say wrap it with paper or were you connecting the sandpaper? | |
| Alice | No, it’s just wrapping with paper or rubber, insulator, so that electricity does not go to the nail. |
During this process, Alice was reasoning through the question of how to increase the power of the electromagnets and wanted to share her thoughts through drawing. Alice’s misconceptions also came through in her drawing and explanation.
This case shows how students’ reasoning developed to make sense of electromagnets by exploring the concepts of electrolyte, electrodes, battery, and electromagnetism. Students shared various claims and explanations to justify their ideas by drawing or referring to the drawings shared on the interactive whiteboard. Drawings shared in the collective space resulted in further questions and reasoning. For instance, Rae’s drawing and explanation added another layer of reasoning by shifting the focus of the discussion from the battery to the strength of electric currents. Students’ meaning making was developing through drawing. Students’ misconceptions and confusion were also shared in the drawing and reasoning process, when it became apparent that some students did not understand the role of the lemon in the lemon battery, how some thought that wrapping the nail with paper would affect the strength of electromagnet, and so on. These were important aspects of students’ thinking that required pedagogical attention to develop clearer understandings.
4. Discussion and Conclusions
4.1. Drawing as Cognitive Social Tool
In this study, we looked into two cases of classroom talk with drawing to understand the possibilities of visual representation construction, specifically drawings to develop students’ collective reasoning and meaning making in elementary science classrooms. In each case, the drawings demonstrated how visual representation became a tool to develop thinking and social communication. The drawings that emerged during the whole classroom talk showed that visual representation was not limited to a subordinating tool to students’ linguistic expression, but rather became an inseparable part of their thinking and communication within the classroom. The students and teachers were actively engaged in drawing to communicate and the construction of the drawings further enhanced students’ thinking and talking. As seen in the two different cases, drawings during classroom talk can be generated by the teacher or the students. In Case 1, the teacher was drawing on the interactive whiteboard as the classroom talk developed. Yet through her drawing, the teacher was not presenting her own ideas but rather the drawing emerged from a student’s idea and was further developed with other students’ verbal responses and explanations. The whole class was involved in reasoning together with the drawings on the interactive whiteboard to understand the phenomenon and concept of air pressure. In Case 2, the drawings were generated by students. Students stood at the interactive whiteboard and created models of electromagnets and electric circuits. While drawing, students developed their understanding around electric circuits with electromagnets by raising questions and connecting their prior knowledge. The teacher facilitated the classroom talk by questioning and commenting to develop students’ reasoning and knowledge. In both cases, drawing was complementary to other modes of dialogue, such as talks, gestures, and writing [29], but its role was neither subordinating to nor replaceable by words, but essential for students’ reasoning [16,23,28]. It was evident that drawings were at the center of the classroom interactions and students were reasoning and meaning making together through/with the actions of drawing. At times, it was necessary for the teacher and students to draw as they could not fully explain their ideas otherwise. The teacher in Case 1 started to explain Mike’s ideas verbally and through gestures, but soon turned to the interactive whiteboard to draw. In Case 2, Rae, a student, expressed that she wanted to draw to share her ideas. In both cases, the teacher and student chose to draw because they might have felt challenges in their verbal explanations and thought of the benefits of drawing. In these moments, the teacher and students were thinking together through the drawings. Other students were also engaged in the processes of thinking and problem solving that were being shared and discussed through drawing. Accordingly, the drawings on the interactive whiteboard were critical parts of the collective cognition that made teaching and learning possible in these two classrooms.
For visual representation construction to be a cognitive social tool, a common ground of understanding of the aspects of visual representation was essential at the collective level. When the students and teacher were engaged in drawing, they held already agreed-upon understandings about the symbols and models that made their collective reasoning and communication possible. In Case 1, when the teacher changed the size, number, and direction of the arrows, the students understood what these various elements signified in terms of forces and air pressure. In Case 2, based on the agreed-upon model of an electromagnet and electric circuit, students could develop further discussion about electric circuits. Even though it is beyond the scope of this study to understand how the common ground of visualization was established, a certain level of common ground for the visualized signs was already established before the cases of drawing, which was critical to utilizing visual representation as a cognitive and social tool in the classroom community. It is believed that the common ground was being further developed while the drawings were recursively discussed and amended in the shared space [37]. As common ground affects the patterns of communication, for instance, speakers change their speech and gestures when they talk to recipients with or without shared common ground [36], this could be an area of further study about how certain drawing activities in class establish common ground and how students change their communication and meaning making process accordingly.
4.2. Pedagogical Attention to Collective Drawing
Teachers’ facilitation strategies during whole classroom talk were another important aspect to move students’ reasoning forward in the collective space of drawing. Whether drawings were initiated and developed by the teacher or students, the teachers were attentive to students’ ideas in relation to the drawings. While either drawing or observing students’ drawings, the teachers prompted questions and sought feedback from students to distribute the agency of reasoning from individuals to the collective space. In Case 1, the teacher asked the students to think together by drawing and talking about Mike’s ideas. She asked them to imagine—using the drawing—how the balloon top would change in response to a change in air pressure. She modeled how ideas and concepts could be explained and communicated through visualization and encouraged students to think, talk, and learn toward the intended curriculum knowledge. In Case 2, students’ drawings were at the center of their reasoning and interactions facilitated by the teacher. The teacher continued to bring students’ attention to the drawings on the whiteboard and their thinking by raising questions. Students’ knowledge was being shared, negotiated, and developed through drawing and explaining. In both cases, the teachers placed the drawing at the center of classroom talk and facilitated classroom interactions and students’ reasoning with the drawings. Students’ agency of thinking and talking was respected and developed in whole-classroom talk and drawing.
Each case of drawings, either drawn by teachers or students, provided different pedagogical opportunities to help students’ learning and meaning making. There are not many studies on teachers’ visualization construction during their whole-classroom talk, i.e., drawing while explaining, but Case 1 in this study provides some pedagogical aspects of teachers’ drawing. The teacher-generated drawings in Case 1 were able to model and explain scientific concepts with certain curriculum intentions. They helped students to make sense of what was being shared and explained and encouraged them to participate in thinking visually and talking together. The student-generated drawing in Case 2 provided more opportunities to notice students’ conceptual understandings and misconceptions. Students’ misconceptions and confusion about electromagnetism were revealed during the classroom interactions, and they became the focus of the teacher’s instruction later on. When students drew on the whiteboard, they drew, paused, erased, and redrew. In this process, the students’ thinking process, uncertain ideas, and confusion were shared. Some of their drawings and talking with the drawings demonstrated misconceptions. The teacher attempted to understand what and how students’ misunderstandings were emerging and shared throughout the interactions and developed further lessons on those ideas. The teacher’s pedagogical attention to students’ talking and drawing was critical to enhancing students’ learning in classrooms.
While visual representation construction could be an effective tool for thinking and learning, students’ engagement and interests in drawing activities could be diverse. As seen in Case 2, some students were willing to draw and some simply referred to others’ drawings. Some students needed to draw because they struggled to verbally articulate their thoughts. Just as Rae was eager to draw in order to express her ideas, there will be some students who need to draw to think and communicate. We also noticed that some students never expressed interest in sharing their thoughts by drawing on the interactive whiteboard. Yet despite the different types of engagement in visual representation such as active drawing, observing and interpreting, or using others’ drawings to explain their thoughts, all students were actively engaged in thinking through drawing. This reminds us of the diversity of students’ interests and epistemological approaches in classrooms [51]. As we have observed in this study, we assume students’ responses to drawings will be diverse and dynamic depending on their needs and interests in drawing. There will be some students who are simply not inclined to drawing. Others might feel incompetent at drawing and therefore be reluctant to draw in front of others. There might be a lack of space and opportunities for drawing when more than one student wants to draw at a time in collective drawing activities. With time constraints, teachers might encounter difficulties in engaging students in collective drawing in whole-classroom talk. Therefore, teachers’ pedagogical attention, decision making, and facilitation strategies are needed to engage students’ multiple epistemologies in order to effectively implement student-generated drawings as a cognitive social tool for science learning and teaching.
Utilizing visual representation and its construction as an effective learning and teaching tool for all is a complex question. This study explained how visual representation is related to the reasoning process through classroom talks, but did not explain the complexity of its relationship to other modes of representation (verbal, written, or gestural) in the data analysis. The differences of students’ interests, needs, and interactions with drawing processes were not explored. These are important aspects of learning and teaching through drawing in classrooms; thus, further studies are required to understand these missing puzzles in order to understand the role of drawing fully for students’ reasoning and learning.
Author Contributions
Conceptualization, H.-G.Y.; methodology, M.K. and E.A.L.; formal analysis, M.K., E.A.L. and H.-G.Y.; investigation, M.K. and E.A.L.; data curation, M.K.; writing—original draft preparation, M.K. and E.A.L.; writing—review and editing, H.-G.Y.; visualization, E.A.L. and M.K.; supervision, H.-G.Y.; project administration, H.-G.Y.; funding acquisition, H.-G.Y. All authors have read and agreed to the published version of the manuscript.
Funding
This research was funded by the National Research Foundation of Korea (NRF) grant funded by the Korea government (MIST: Ministry of Science and ICT), No. 2019R1F1A1040353.
Institutional Review Board Statement
The study was approved by the Research Ethics Board (REB) of the University of Alberta (Pro00075223).
Informed Consent Statement
Informed consent was obtained from all subjects involved in the study.
Conflicts of Interest
The authors declare no conflict of interest.
References
- Latour, B. Visualization and cognition: Thinking with eyes and hands. In Knowledge and Society: Studies in the Sociology of Culture Past and Present; Kuklick, H., Ed.; Jai Press INC.: Stamford, CT, USA, 1986; Volume 6, pp. 1–40. [Google Scholar]
- Lemke, J.L. The literacies of science. In Crossing Borders in Literacy and Science Instruction: Perspectives on Theory and Practice; Saul, E.W., Ed.; International Reading Association & National Science Teachers Association: Newark, DE, USA, 2004; pp. 33–47. [Google Scholar]
- Reddy, F. NASA Visualization Shows a Black Hole’s Warped World. NASA’s Goddard Space Flight Center, Greenbelt, Md. Available online: https://www.nasa.gov/feature/goddard/2019/nasa-visualization-shows-a-black-hole-s-warped-world (accessed on 24 April 2021).
- Ainsworth, S.; Prain, V.; Tytler, R. Drawing to learn in science. Science 2011, 333, 1096–1097. [Google Scholar] [CrossRef] [PubMed] [Green Version]
- Gilbert, J.K. Visualization in Science Education; Springer-Verlag Inc.: New York, NY, USA, 2005. [Google Scholar]
- Tytler, R.; Prain, V.; Aranda, G.; Ferguson, J.; Gorur, R. Drawing to reason and learn in science. J. Res. Sci. Teach. 2019, 57, 209–231. [Google Scholar] [CrossRef]
- Van Meter, P.; Garner, J. The Promise and Practice of Learner-Generated Drawing: Literature Review and Synthesis. Educ. Psychol. Rev. 2005, 17, 285–325. [Google Scholar] [CrossRef] [Green Version]
- Ainsworth, S. The educational value of multiple representations when learning complex scientific concepts. In Visualization: Framework and Practice in Science Education; Gilbert, J.K., Reiner, M.M., Nakhle, M., Eds.; Springer: New York, NY, USA, 2008; pp. 191–208. [Google Scholar]
- Kozma, R.; Chin, E.; Russell, J.; Marx, N. The roles of representations and tools in the chemistry laboratory and their implications for chemistry learning. J. Learn. Sci. 2000, 9, 105–143. [Google Scholar] [CrossRef]
- Zhang, Z.H.; Linn, M.C. Learning from chemical visualizations: Comparing generation and selection. Int. J. Sci. Educ. 2013, 35, 2174–2197. [Google Scholar] [CrossRef]
- Buck Bracey, Z.E. Students from non-dominant linguistic backgrounds making sense of cosmology visualizations. J. Res. Sci. Teach. 2017, 54, 29–57. [Google Scholar] [CrossRef]
- Colantonio, A.; Leccia, S.; Puddu, E.; Testa, I.; Marzoli, I. Developing the use of visual representations to explain basic astronomy phenomena. Phys. Rev. Phys. Educ. Res. 2018, 14, 010145. [Google Scholar] [CrossRef] [Green Version]
- Hubber, P.; Tytler, R.; Haslam, F. Teaching and Learning about Force with a Representational Focus: Pedagogy and Teacher Change. Res. Sci. Educ. 2010, 40, 5–28. [Google Scholar] [CrossRef]
- Ainsworth, S.; Loizou, A.T. The effects of self-explaining when learning with text or diagrams. Cogn. Sci. 2003, 27, 669–681. [Google Scholar] [CrossRef]
- Prain, V.; Tytler, R. Learning through constructing representations in science: A framework of representational construction affordances. Int. J. Sci. Educ. 2012, 34, 2751–2773. [Google Scholar] [CrossRef] [Green Version]
- Vavra, K.; Janjic-Watrich, V.; Loerke, K.; Phillips, L.; Norris, S.; Macnab, J. Visualization in Science Education. Alta. J. Sci. Educ. 2011, 41, 22–30. [Google Scholar]
- Fan, J. Drawing to Learn: How Producing Graphical Representations Enhances Scientific Thinking. Transl. Issues Psychol. Sci. 2015, 1, 170–181. [Google Scholar] [CrossRef]
- Quillin, K.; Thomas, S. Drawing-to-Learn: A Framework for Using Drawings to Promote Model-Based Reasoning in Biology. CBE Life Sci. Educ. 2015, 14, 1–16. [Google Scholar] [CrossRef] [PubMed]
- Brooks, M. Drawing, visualisation and young children’s exploration of “big ideas”. Int. J. Sci. Educ. 2009, 31, 319–341. [Google Scholar] [CrossRef]
- Chang, N. The role of drawing in young children’s construction of science concepts. Early Child. Educ. J. 2012, 40, 187–193. [Google Scholar] [CrossRef]
- von Zeipel, H. Illustrations in science education: An investigation of young pupils using explanatory pictures of electrical currents. Procedia Soc. Behav. Sci. 2015, 167, 204–210. [Google Scholar] [CrossRef] [Green Version]
- Nersessian, N.J.; Kurtz-Milcke, E.; Newstetter, W.C.; Davis, J. Research laboratories as evolving distributed cognitive system. In Proceedings of the 25th Annual Meeting of the Cognitive Science Society, Boston, MA, USA, 31 July–3 August 2003; Volume 25, pp. 857–862. [Google Scholar]
- Alač, M.; Hutchins, E. I see what you are saying: Action as cognition in fMRI brain mapping practice. J. Cogn. Cult. 2004, 4, 629–661. [Google Scholar] [CrossRef] [Green Version]
- Hutchins, E. Cognition in the Wild; MIT Press: Cambridge, MA, USA, 1995. [Google Scholar]
- Hutchins, E. The cultural ecosystem of human cognition. Philos. Psychol. 2014, 27, 34–49. [Google Scholar] [CrossRef]
- Salomon, G. Distributed Cognition: Psychological and Educational Considerations; Cambridge University Press: Cambridge, UK, 1993. [Google Scholar]
- Sutton, J. Distributed cognition: Domains and dimensions. Pragmat. Cogn. 2006, 14, 235–247. [Google Scholar] [CrossRef] [Green Version]
- Hutchins, E.; Palen, L. Constructing meaning from space, gesture, and speech. In Discourse, Tools and Reasoning: Essays in Situated Cognition; Resneck, L.B., Saljo, R., Pontecorvo, C., Burge, B., Eds.; Springer: Berlin, Germany, 1997; pp. 23–39. [Google Scholar]
- Tang, K.; Delgado, C.; Moje, E.B. An Integrative Framework for the Analysis of multiple and multimodal representations for meaning-making in science education. Sci. Educ. 2014, 98, 305–326. [Google Scholar] [CrossRef] [Green Version]
- Tibell, L.A.E.; Harms, U. Biological Principles and Threshold Concepts for Understanding Natural Selection: Implications for Developing Visualizations as a Pedagogic Tool. Sci. Educ. 2017, 26, 953–973. [Google Scholar] [CrossRef] [Green Version]
- Vygotsky, L.S. Mind in Society: The Development of Higher Psychological Processes; Harvard University Press: Cambridge, MA, USA, 1978. [Google Scholar]
- Mercer, N. Words and Minds: How We Use Language to Think Together; Routledge: London, UK, 2000. [Google Scholar]
- Mercer, N. The Seeds of Time: Why Classroom Dialogue Needs a Temporal Analysis. J. Learn. Sci. 2008, 17, 33–59. [Google Scholar] [CrossRef]
- Vygotsky, L.S. Thought and Language; Hanf-mann, E., Vakar, G., Eds.; MIT Press: Cambridge, MA, USA, 1962. [Google Scholar]
- Clark, H.H.; Brennan, S.E. Grounding in communication. In Perspectives on Socially Shared Cognition; Resnick, L.B.L., Teasley, J.M., Stephanie, D., Eds.; American Psycho Kieslerlogical Association: Washington, DC, USA, 1991; pp. 127–149. [Google Scholar]
- Holler, J.; Stevens, R. The effect of common ground on how speakers use gesture and speech to represent size information. J. Lang. Soc. Psychol. 2007, 26, 4–27. [Google Scholar] [CrossRef]
- Bohn, M.; Köymen, B. Common ground and development. Child. Dev. Perspect. 2018, 12, 104–108. [Google Scholar] [CrossRef] [Green Version]
- Herman, D. Genette meets Vygotsky: Narrative embedding and distributed intelligence. Lang. Lit. 2006, 15, 357–380. [Google Scholar] [CrossRef]
- Merriam, S.B. Qualitative Research and Case Study Applications in Education; Jossey-Bass Publishers: San Francisco, CA, USA; Routledge: Oxford, UK, 1988. [Google Scholar]
- Ball, L.J.; Ormerod, T.C. Putting ethnography to work: The case for a cognitive ethnography of design. Int. J. Hum. Comput. Stud. 2000, 53, 147–168. [Google Scholar] [CrossRef] [Green Version]
- Nersessian, N. Interdisciplinarities in action: Cognitive ethnography of bioengineering science research laboratories. Perspect. Sci. 2019, 27, 553–581. [Google Scholar] [CrossRef]
- Williams, R.F. Using cognitive ethnography to study instruction. In Proceedings of the 7th International Conference of the Learning Science, Bloomington, IN, USA, 27 June–1 July 2006; Barab, S.A., Hay, K.E., Hicky, D.T., Eds.; Lawrence Erlbaum Associates: Mahwah, NJ, USA, 2006. [Google Scholar]
- Lee, E.A.; Gans, N.; Grohman, M.; Brown, M.J. Ethics as a rare bird: A challenge for situated studies of ethics in the engineering lab. J. Res. Inn. 2019, 6, 284–304. [Google Scholar] [CrossRef]
- Nersessian, N. The cognitive-cultural system of the research laboratory. Organ. Stud. 2006, 27, 125–145. [Google Scholar] [CrossRef]
- Nersessian, N. How do engineering scientists think? Model-based simulation in biomedical engineering research laboratories. Top. Cogn. Sci. 2009, 1, 737–757. [Google Scholar] [CrossRef] [Green Version]
- Lee, E.A.; Grohman, M.G.; Gans, N.; Tacca, M.; Brown, M.J. Exploring implicit understanding of engineering ethics in student teams. In Proceedings of the ASEE Annual Conference & Exposition, Seattle, WA, USA, 14–17 June 2015. [Google Scholar]
- Lee, E.A.; Grohman, M.G.; Gans, N.; Tacca, M.; Brown, M.J. The roles of implicit understanding of engineering ethics in student teams’ discussion. Sci. Eng. Ethics 2017, 23, 1755–1774. [Google Scholar] [CrossRef] [PubMed]
- Lee, E.A.; Gans, N.; Grohman, M.; Tacca, M.; Brown, M.J. Guiding engineering student teams’ ethics discussions with peer advising. Sci. Eng. Ethics 2020, 26, 1743–1769. [Google Scholar] [CrossRef] [PubMed]
- Dubbels, B. Cognitive ethnography: A methodology for measure and analysis of learning for game studies. Int. J. Gaming Comput. Mediat. Simul. 2011, 3, 68–78. [Google Scholar] [CrossRef] [Green Version]
- Goodwin, C. Professional vision. Am. Anthropol. New Ser. 1994, 96, 606–633. [Google Scholar] [CrossRef]
- Tan, E.; Calabrese Barton, A.; Benavides, A. Engineering for sustainable communities: Epistemic tools in support of equitable and consequential middle school engineering. Sci. Educ. 2019, 103, 1011–1046. [Google Scholar] [CrossRef]
Figure 1.
Air pressure with arrows.

Figure 2.
Knowledge connection to reason through barometer drawing.

Figure 3.
The initial image of the electromagnet drawn by a student (a) and the completed image drawn by students’ collaboration (b).
Figure 3.
The initial image of the electromagnet drawn by a student (a) and the completed image drawn by students’ collaboration (b).

Figure 4.
Students’ collaborative drawing of the electromagnet.

Figure 5.
An example of students’ reasoning and thinking through drawing.

Publisher’s Note: MDPI stays neutral with regard to jurisdictional claims in published maps and institutional affiliations. |
© 2021 by the authors. Licensee MDPI, Basel, Switzerland. This article is an open access article distributed under the terms and conditions of the Creative Commons Attribution (CC BY) license (https://creativecommons.org/licenses/by/4.0/).
Share and Cite
MDPI and ACS Style
Yoon, H.-G.; Kim, M.; Lee, E.A. Visual Representation Construction for Collective Reasoning in Elementary Science Classrooms. Educ. Sci. 2021, 11, 246. https://0-doi-org.brum.beds.ac.uk/10.3390/educsci11050246
AMA Style
Yoon H-G, Kim M, Lee EA. Visual Representation Construction for Collective Reasoning in Elementary Science Classrooms. Education Sciences. 2021; 11(5):246. https://0-doi-org.brum.beds.ac.uk/10.3390/educsci11050246
Chicago/Turabian StyleYoon, Hye-Gyoung, Mijung Kim, and Eun Ah Lee. 2021. "Visual Representation Construction for Collective Reasoning in Elementary Science Classrooms" Education Sciences 11, no. 5: 246. https://0-doi-org.brum.beds.ac.uk/10.3390/educsci11050246
Note that from the first issue of 2016, this journal uses article numbers instead of page numbers. See further details here.