1. Introduction
The market for mobile communications and applications is one of the fastest growing and most dynamic areas in digital technologies, with new formulas to be tested, namely operating systems, types of devices to be used, navigation systems and business models.
Forty-nine percent of the Consortium for School Networking [
1] advisors considered that mobile devices are the most important technology to enhance and accelerate innovation in teaching and learning in the short-term future [
1].
Mobile users have very different usage habits of applications and the reports that usually support studies about mobile use are created with questions directed to the users themselves and to their perception of the applications they have on their devices. Gerpott and Thomas argue that other studies are needed to properly support this type of research [
2].
Therefore, it is relevant for this area of research to have studies that cross the reported use with the actual one. As mentioned by De Reuver and Bouwman [
3] the use of logs is a possible way to meet this goal.
Thus, the present study intends to use a different and innovative approach, by cross-referencing survey data with actual usage data from the logs of applications usage during classes.
The application of this approach, in this study, aims to contribute to the improvement of the understanding of the use of mobile applications by students of higher education institutions (HEIs), in this case at the University of Aveiro (UA), by revealing the profile of these users and the kind of applications they use, and relate the stated use with the actual use that participants make of mobile applications.
This contribution may also be relevant for the creation of a model to measure the use of mobile applications in Higher Education Institutions (HEIs) which could be used, for example, by HEIs when developing a strategy for the implementation of good practices in mobile learning.
This article aims to present the main results of the study carried out, based on the approach presented above.
2. Theoretical Framework
In the article “The Computer for the 21st Century”, Wiser defines what he called Ubiquitous Computing as the continuous integration of computers into the environment in which we live, arguing that computers would be integrated into various aspects of our lives and even into everyday objects [
4].
The development of these ubiquitous technologies and the constant use of these technologies and mobile devices have also created new ways of communicating, studying and working. Spatial restrictions have also been reduced; today, people can be reachable and connected anytime and anywhere [
5]. This also applies to higher education institutions, where students use their devices such as laptops, smartphones and tablets, and, thanks to fast Internet connections, keep them permanently connected, in and out of class. These students show a great acceptance of these new technologies [
6].
This strong growth in the use of mobile devices and applications by the academic community has led higher education institutions to make efforts to promote initiatives aimed at promoting even greater proximity and connection with the academic community. Higher education institutions are enhancing constant access to valuable information and solutions that facilitate institutional dynamics and/or are linked to academic life in general [
7] and provide their communities with new means of interaction and promotion of learning supported by mobile technologies [
8]. This is one of the main challenges faced today by educational institutions using the educational paradigm that is called Mobile Learning (M-Learning).
Considering the availability and connectivity of mobile devices, M-Learning is configured as a strategy of integration of mobile technologies in the learning process, allowing for a closer approach of students to the current technological paradigm, as well as contributing to the promotion of strategies of general access to information, and knowledge construction by all users.
The definitions also emphasize the capacity to create new learning environments with these devices. Young people are permanently connected, and devices, particularly smartphones, are part of their natural context [
9]. It is possible to access information anywhere and at any time, so one can learn regardless of the space or time the individual is in [
10].
Thus, learning can occur in different places. It can take several forms and when the individual wants to learn, access to learning does not necessarily happens within the school, reducing the limitations of learning confined to the classroom [
9], which led UNESCO to consider that M-Learning increases the reach and equality of education [
11].
Therefore, M-Learning does not refer to the devices themselves or to their connectivity, but to a different way of looking at learning and to a new way to perceive the role of the teacher and of the students. Thus, it is relevant to understand how they make use of the devices during teaching activities.
A significant part of the studies on the use of mobile applications in HEIs are carried out based on self-answer surveys from users [
12] reported that about 40% of the studies on the use of mobile devices present on communication journals (41 articles between 2003 and 2010), are based on this type of instrument.
Usually, in these studies, generic questions are asked, but the most common ones are related to the frequency and duration of use of these devices, such as “how many SMS or calls are made?” or “how often do you use the device?”
These questions are asked in such a way that the user estimates how long or what kind of use they have made of their devices daily, and it is sometimes asked about time periods of several days.
In fact, this type of instrument is widely used in this type of studies. However, since mobile devices are completely integrated into our daily life and we make use of them quite intensively, it is difficult to retain and define with plausible accuracy the use we make of them.
Considering the above, some studies have focused on the validity of the use of these instruments. One of these studies, carried out by Parslow et al. [
13], aimed at determining the number of calls made and received in the days, weeks or months preceding the date of the survey and their duration. The answers were compared with the operators’ logs and it was concluded that self-answer surveys do not always represent the actual pattern of use.
Finally, in self-answering instruments, which refer to questions of daily activity on mobile devices, this activity may not represent a general pattern of activity, since the usage patterns may differ greatly from individual to individual and thus, reflect very irregular usage.
Given the moderate correlation between self-response instruments and data from logs [
12], the authors consider that researchers can significantly improve the results if they use, along with other instruments, data from logs to make their studies more accurate and rigorous.
3. Methodology
This article intends to present the main results of a study that aims to understand how students in the University of Aveiro (Portugal) use mobile devices during class time, inside or outside the classroom, both in the academic context and at a personal level. It also aims to understand the use of those devices, namely which applications they use the most and if the applications they report to use in response to a survey correspond to their actual use of the devices and applications. This was achieved through the analysis of institutional Wi-Fi traffic logs.
It was also intended to understand whether factors such as the profile of the students, the degree of the classes they attend, the area of the course, the typology of the classes or the timetable can potentially influence the way they use the mobile devices and applications.
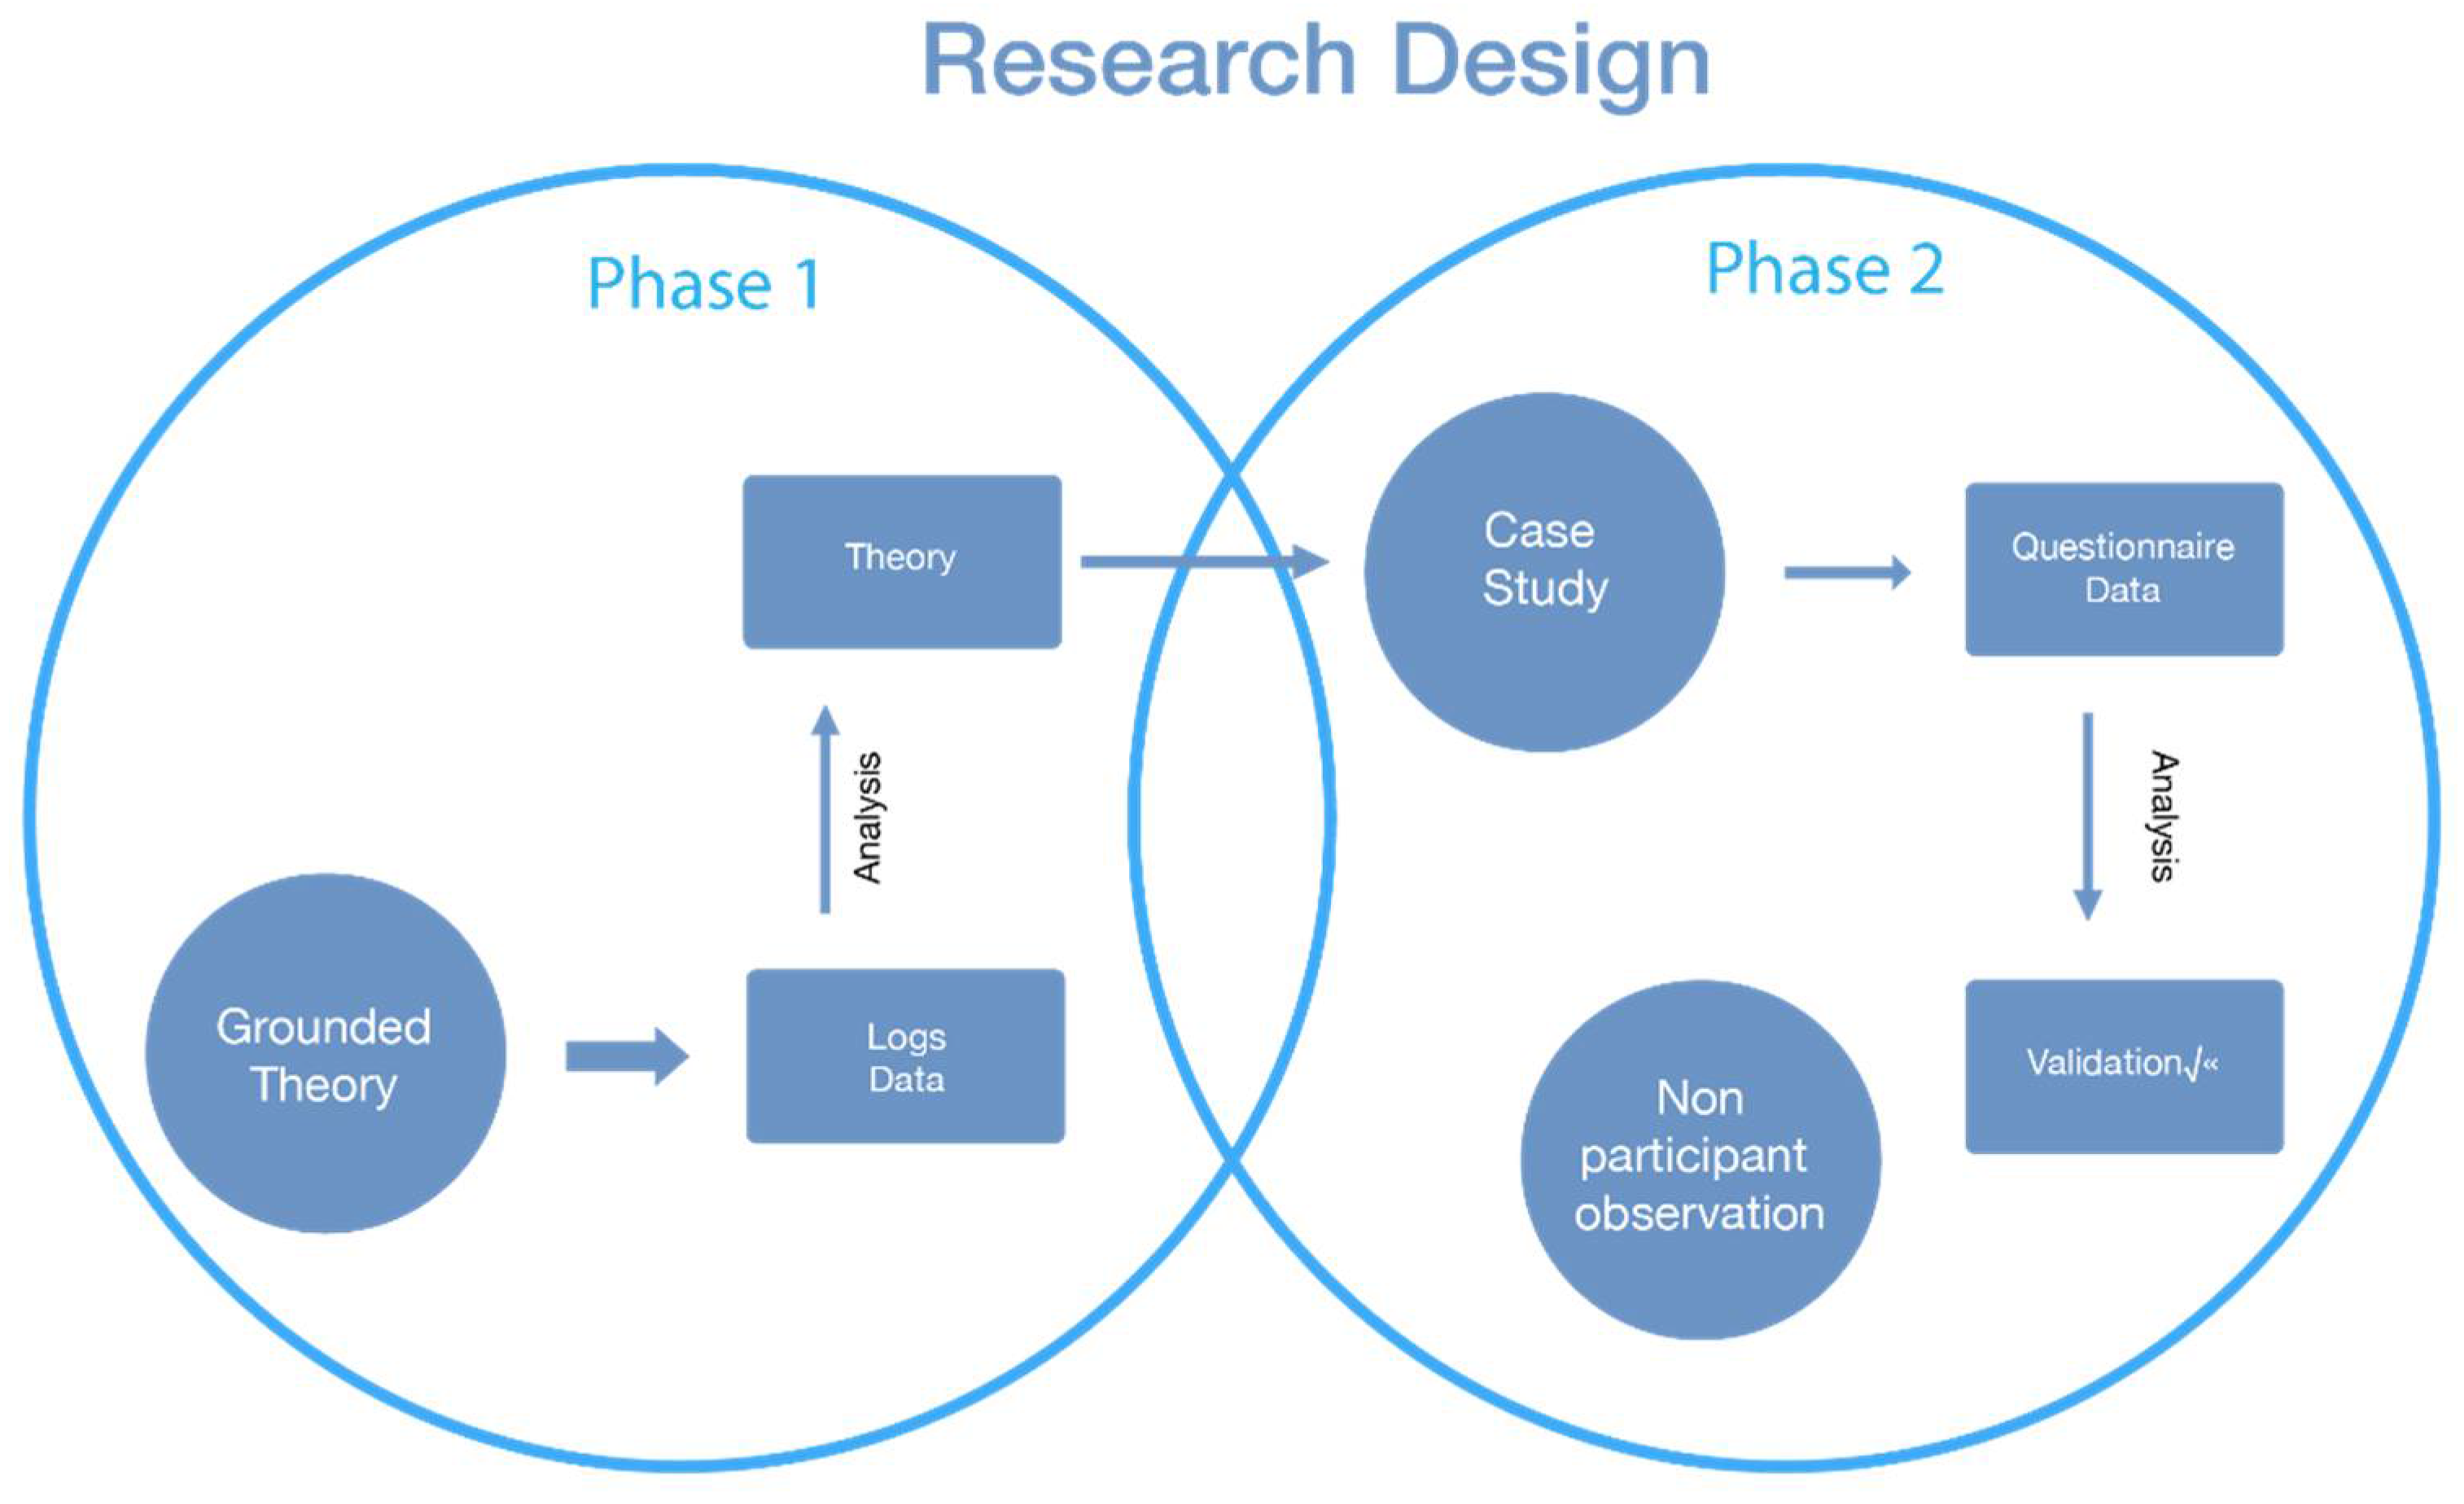
Thus, the main study was divided into two distinct phases, represented in
Figure 1.
3.1. Data Collection
The first part of this study consisted of an approach close to the Grounded Theory methodology, in which a provisory theory is constructed from the observed and analyzed data [
14,
15,
16]. Starting from data of the usage logs of mobile devices, it is intended to propose a theoretical position, constantly comparing the data with the categories that emerge from them. In a second phase, a case study was implemented where an attempt was made to validate the results of the first phase. To this end, a survey was applied to the participants, trying to evaluate whether the results obtained through the logs matched the data resulting from the implementation of the survey. This research design is represented in the scheme above (
Figure 1). In this respect, Yin [
17] states that the main advantage of the case study is that it can analyze the case in its actual context of occurrence, an approach adopted in this study.
In the first phase and with the collaboration of the Technology and Informatics Services of the University of Aveiro, anonymized statistical data (logs) about the mobile device use during the previously selected classes were collected and analyzed. The logs are essentially quantitative data that were collected via Wi-Fi traffic from the institution’s network and had the purpose of monitoring the real use of mobile applications that the participants of this study make with their devices. Thus, the activity performed by students with mobile devices in the selected classes was monitored.
A system was created that allowed us to capture HTTPS usage logs of devices and mobile applications of a certain group of students belonging to the study, of a class selected based on a list of universal users of the university enrolled in the class. For this purpose, the following scenario was set up:
If the traffic of the concerned student is communicating through one of the APs (Access Points) covering the room, then the device will be assigned an IP from the “room network”.
If the concerned student’s traffic is not communicating through one of the APs covering the room, then the device will be assigned a “non-room network” IP.
If the student’s traffic does not belong to the group to be analyzed and the device in question is communicating through one of the APs covering the room, then the device will be assigned an IP from a “normal eduroam network”.
The logs resulting from each of these scenarios were exported to files, which were later treated. The option to capture only HTTPS traffic should be highlighted, which helps later in the anonymization of the data because in this protocol, all the data are encrypted, which makes it completely impossible to obtain personal data or messages from the users. The IP data assigned to the students were also anonymized, so it is not possible to establish any type of relationship between the initial identifier of the student and the logs obtained. We emphasize the importance of identifying a unique identifier field for the students belonging to the class to be analyzed as a way of anonymizing the students.
This tracking mechanism made it possible to identify effective patterns of use of mobile devices by students of the selected classes inside the classrooms but also, and in a second phase, to identify the pattern of those who were outside the classroom
From these logs, we were also able to extract information on which were the most used applications in class, for how long and how many users were using them at any given time. In addition, according to the same methodology, logs were also collected from students who should have been present in class, but who, though on the institution’s network, were not in the classroom.
3.2. Data Tratment
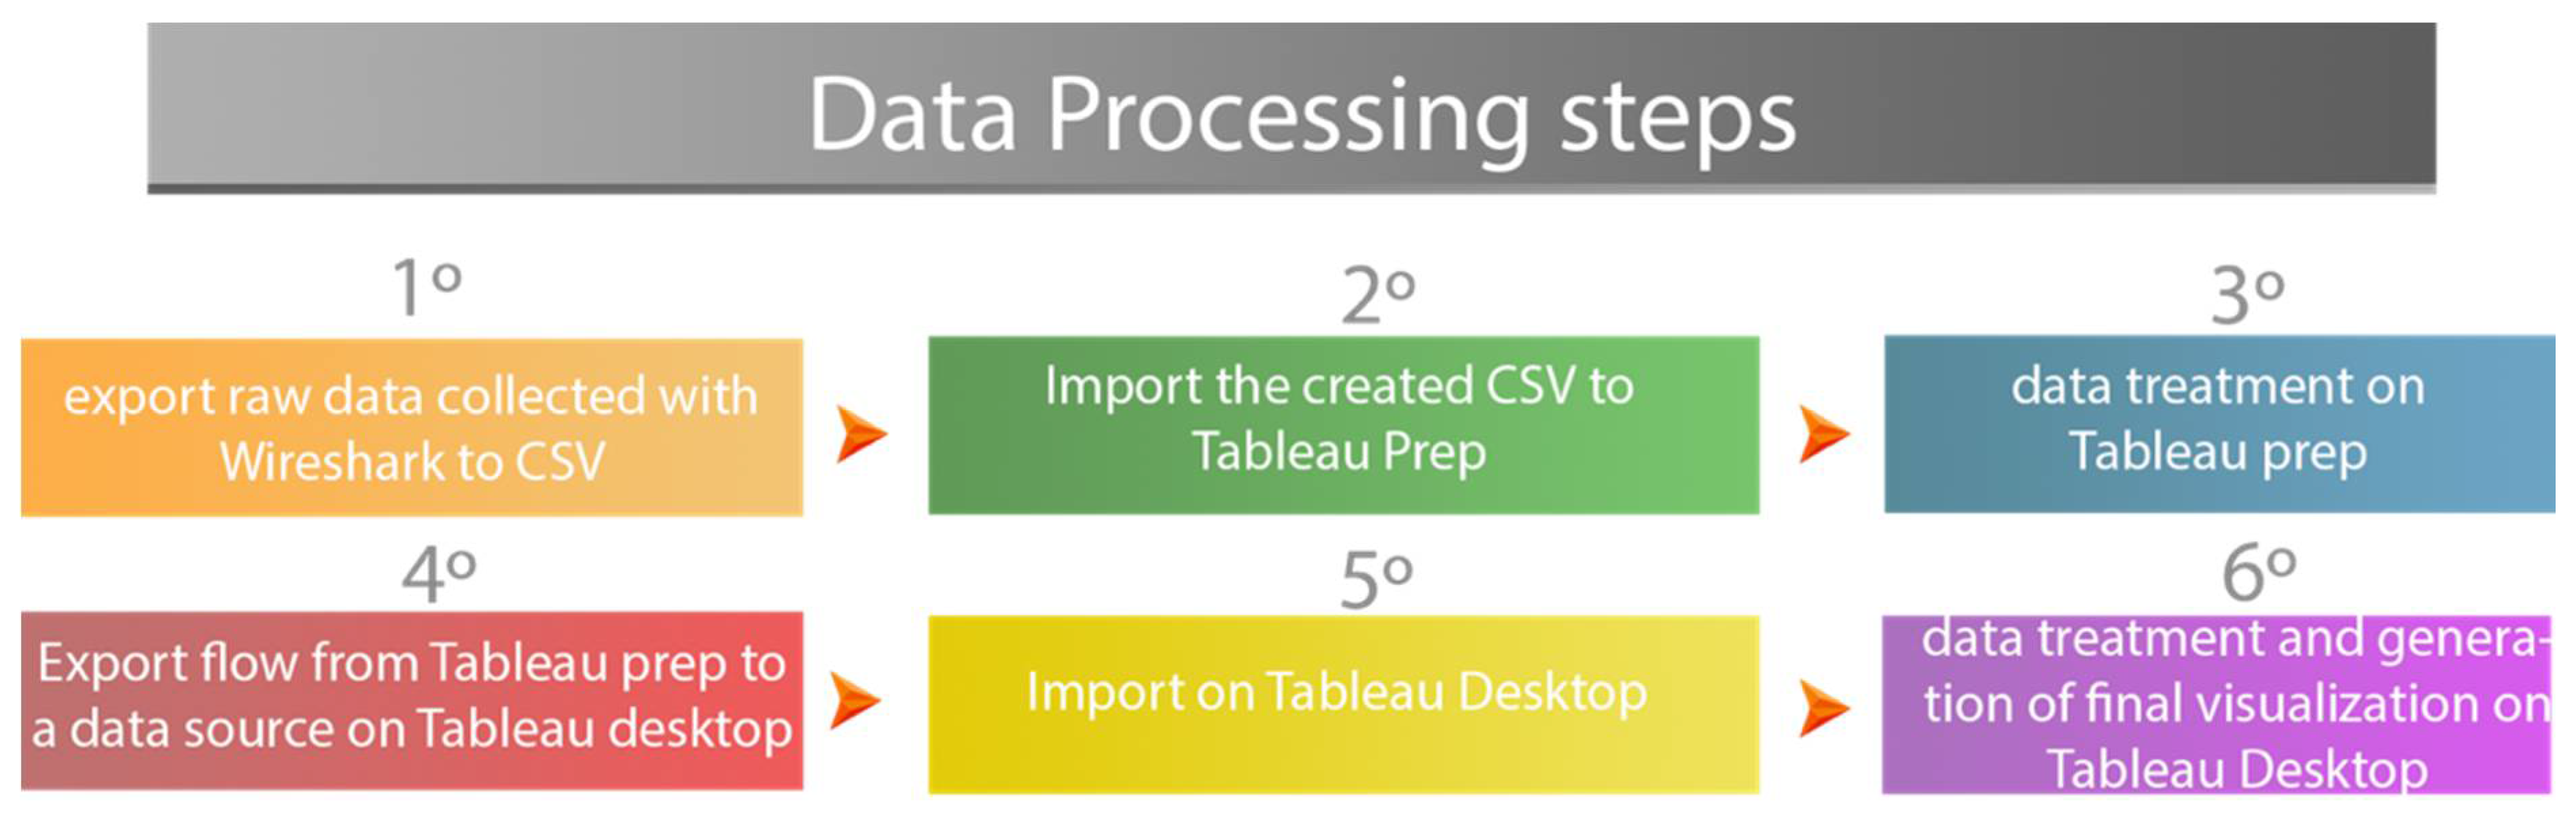
To process and view the data, the choice was an integrated solution for both steps. Given the variety of tools available, several were tried out and the option fell on Tableau Software® (Tableau Prep®, Version 2018.1.1 and Tableau Desktop®, Version 2018.3), an interactive data processing visualization tool belonging to the Salesforce company and which, despite being a paid software, grants an academic license that was used in this project.
This solution, in addition to allowing us to work with a large amount of data, also allows a very interactive treatment and visualization of data. This software also allows us to import data from various sources, which in the case of this study has also been an advantage.
The logs contained a large amount of data which, to be analyzed, were subjected to various processing stages. The data processing phases can be seen in
Figure 2.
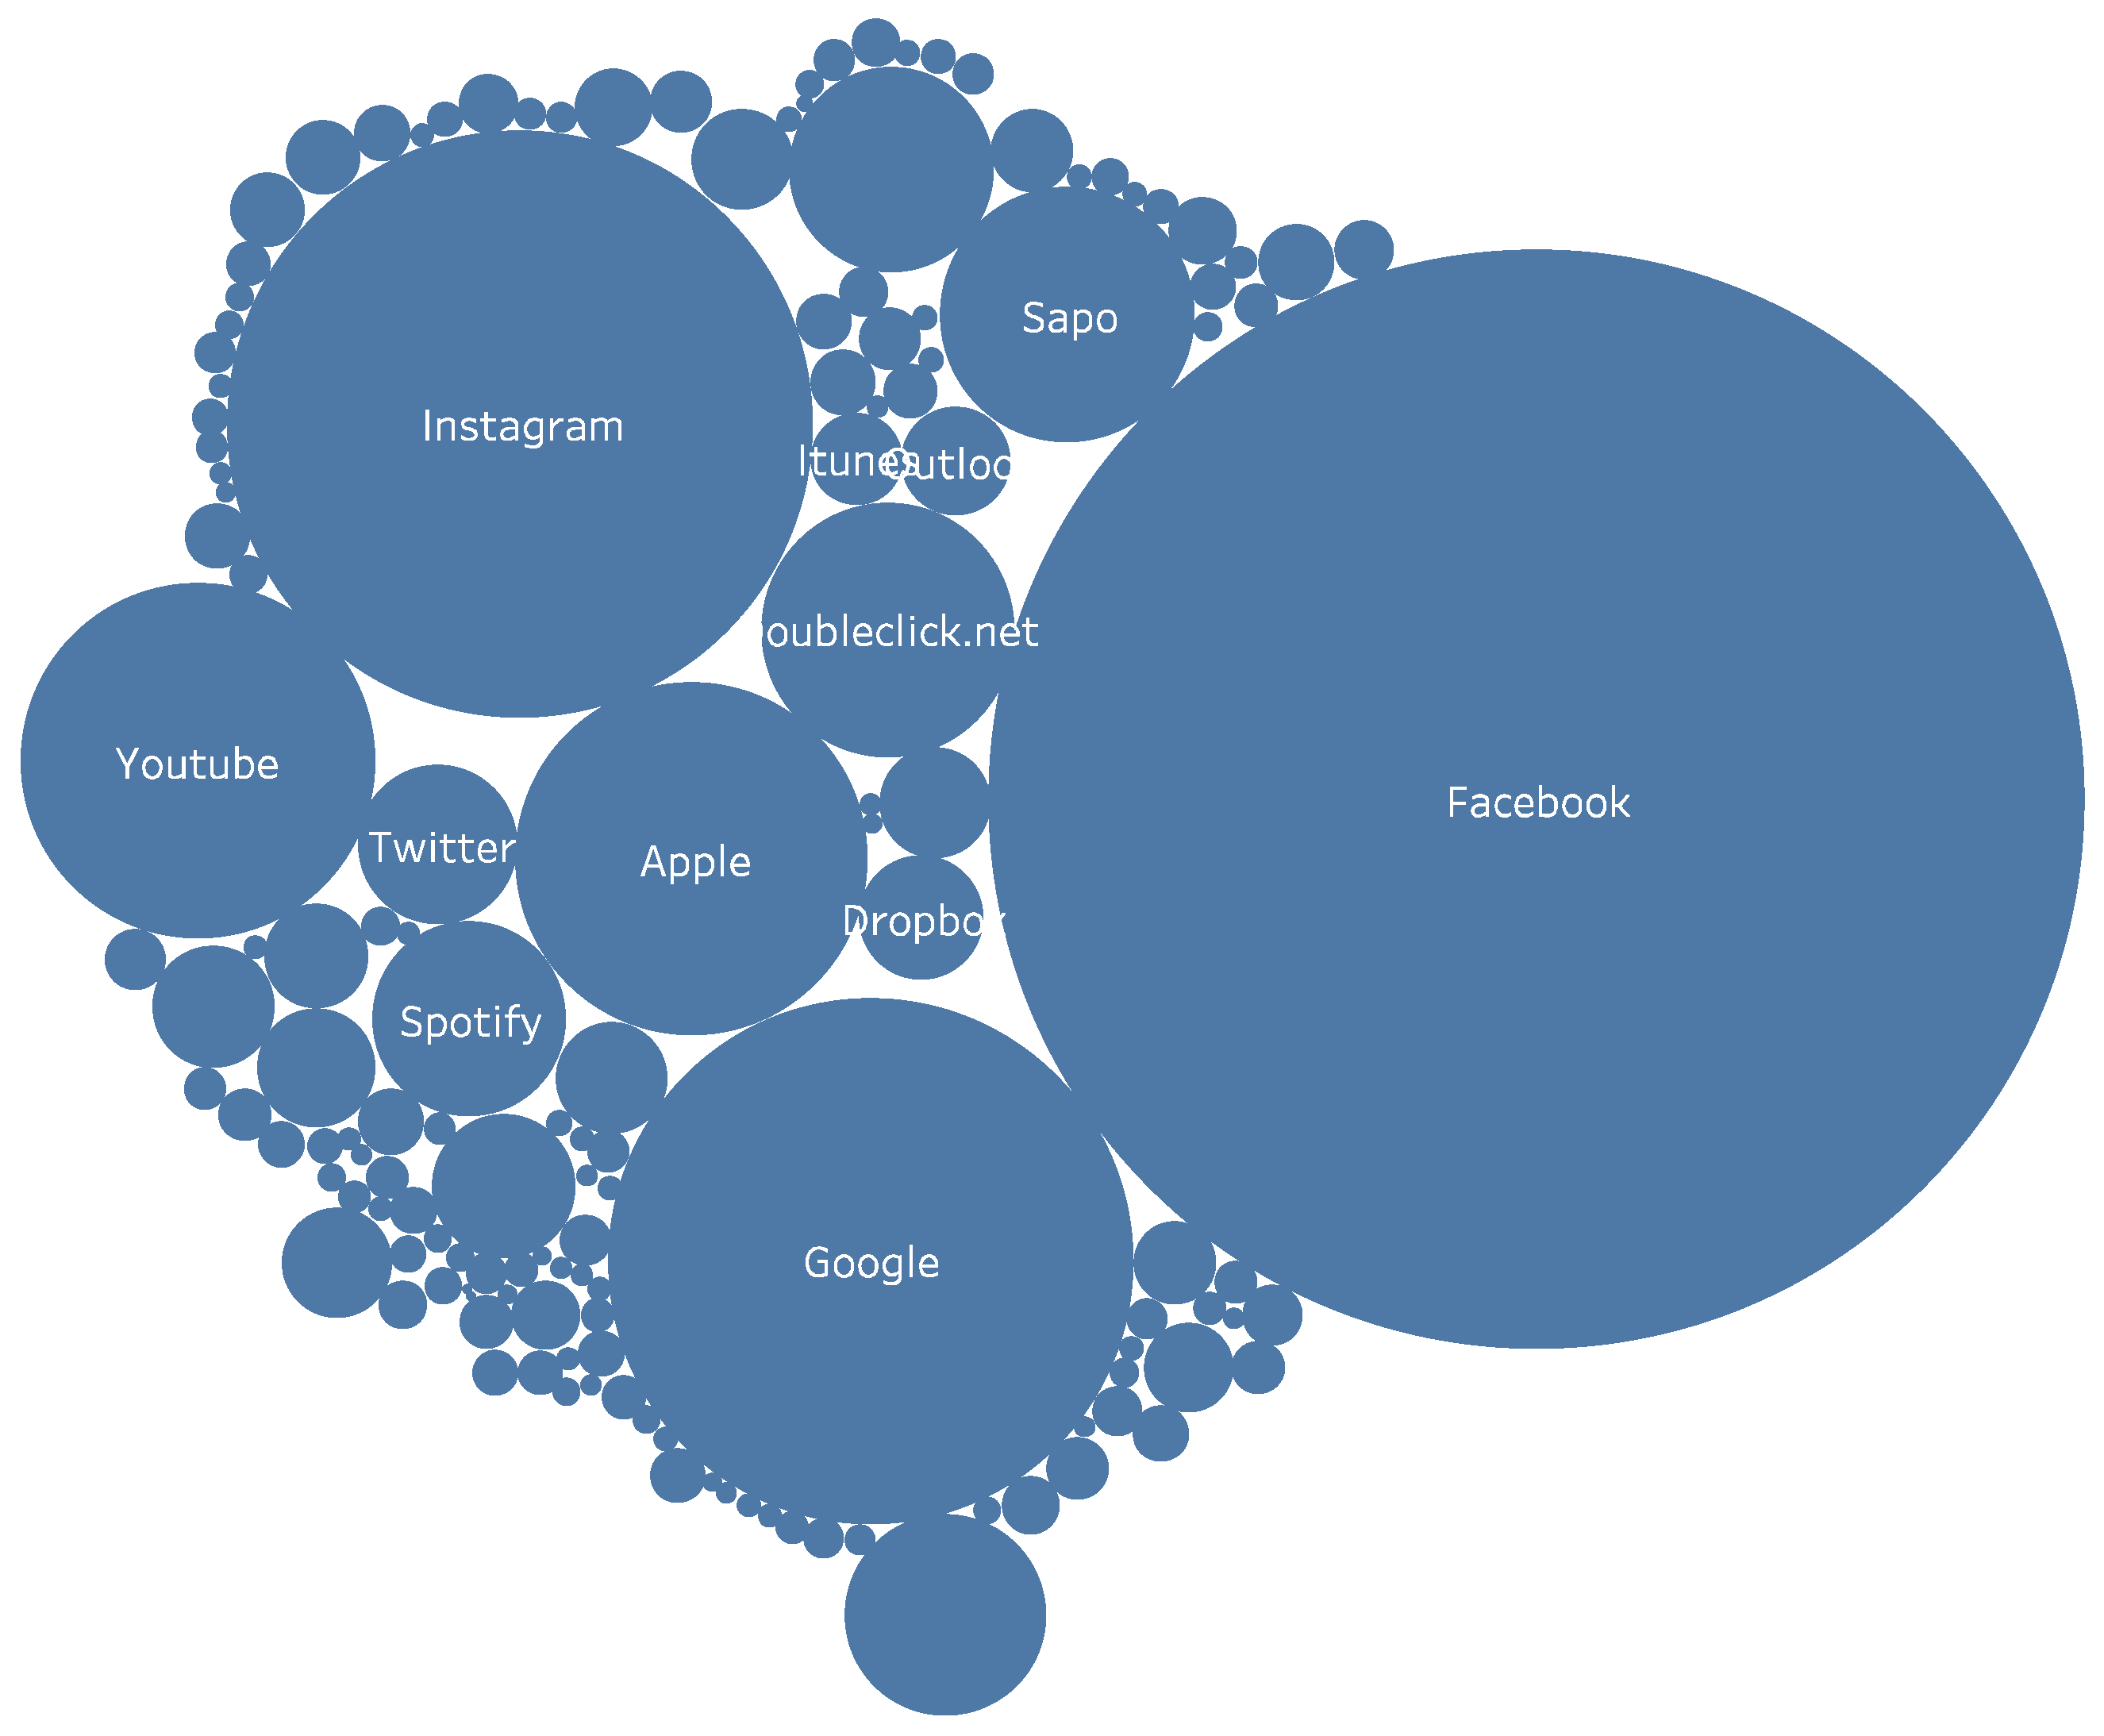
The triangulation of these logs with the data obtained from non-participating observation (carried out in the classes selected by the researcher) and from the surveys made it possible to assess the usage profiles more objectively and to identify discrepancies between self-perception and the effective use of the devices by the students. We can see an example of the visualizations created for each lesson in
Figure 3.
In parallel, and using the non-participating observation technique, class notes were made using an observation grid to collect data on the type of use of mobile devices and digital applications in class context.
This instrument, used during the lessons where data were collected, was used essentially as a guide for the collection of the logs and for their subsequent analysis, as well as for the in loco observation of what was happening in class. It was also used for collecting other information such as the layout of the room and the arrangement of students in the space and to record some questions to the teachers, such as whether they allowed the use of mobile devices in class and whether they planned their lessons for this use. This instrument was composed of several main observation categories, such as general information, class characterization, applications planned in the lesson plan and applications used by students. The researcher recorded the observation of the applications that students used during the lesson, placing a tick in each of them. After applying this instrument, it was concluded that the information of the grids did not have the relevance intended in its design, as it was not possible to assess and record in the grid, in class, which applications students were using.
This data aimed at identifying whether there were variations according to study cycles, scientific areas, class typology (T/P) as well as timetables (morning/afternoon). It also aimed to analyze the level of use of devices in class according to the planned class dynamics/strategies and teachers’ planning, although they did not participate directly in the study.
After the classes where the data of the logs were collected, an online survey was applied to the participants of the selected sample. This survey intended to characterize the participants of the study, the use they make of their devices in the classroom and to collect data about the self-perception of the use of mobile devices, both in the classroom and in the academic context in general, as well as on a personal level. Participants were also asked about the advantages/disadvantages of a wider and more structured introduction of mobile devices and digital applications to support teaching and learning. Before applying this instrument, a pilot was carried out in parallel with the logs to validate the instrument. It was also validated by experts. The answers collected made it possible to draw up a profile of the user and the type of application they use. It also allowed triangulation of information with the other instruments to validate if the use that users make corresponds to what they say they make.
The target audience of this study were students from the University of Aveiro. The students were from all study cycles (undergraduate/master’s/doctoral), from different scientific areas (exact sciences/social sciences/engineering) and came from 7 different departments (Communication and Art; Civil Engineering; Mechanical Engineering; Management, Economics and Tourism; Physics; Education and Psychology; Materials Engineering).
In
Table 1, we can see a summary of the final collected data from students, survey responses and data collected logs.
With the overall data from the surveys of all classes analyzed, we have the following general data: with respect to gender, 68% of the respondents are female and 32% are male; when it comes to age, 72% are between 17 and 20 years old, 7% are between 21 and 22 years old, 8% are between 23 and 25 years old, 7% are between 26 and 35 years old, 5% are between 36 and 45 years old and the remaining 1% are more than 45 years old.
4. Results
4.1. General Data on Students and Their Use of Mobile Devices
To begin this chapter, we intend to provide a generic description of the participants and the respective use of mobile devices in the university context to which this study relates.
When asked about their mobile devices for academic tasks, 44.4% of respondents say they use the laptop, 44.4% mention using the smartphone, 7% refer to the use of tablets and 5% say they do not use any device. When asked about the operating systems of the smartphones, 64% of the respondents have smartphones with an Android operating system, whereas 33% have devices using iOS. The remaining 3% have other operating systems.
After an analysis of all the classes in study, 68% of the students agreed or fully agreed they usually use mobile applications to manage academic tasks. When asked if mobile applications can be used in academic activities as a pedagogical tool, as a complement to the ones already used, 94% of the respondents agree or fully agree with the statement. On the other hand, when asked if the use of applications in teaching activities distracts students and disturbs teaching activities, only 31% report agree or fully agree. When asked whether mobile applications should be used more to support academic learning, 55% say they agree or fully agree, 38% say they do not agree or disagree and 7% say they disagree.
Table 2 below summarizes all the logs collected in various lessons. Here, we can check the peaks of mobile application usage in the respective classes. Lessons 1, 2, 3, 4, 5, 6 and 7 are undergraduate classes. Lessons 8, 9 and 10 are master’s classes. Classes 11 and 12 are Ph.D. classes.
The results presented reflect the analysis of the data collected in the survey and in the logs and present the crossing of the data from both (1k = 1000 lines in logs).
The conclusions of this analysis are divided into several dimensions, which are presented below
4.2. Teachers’ Planning and Permission to Use Applications/Services during Lessons
When we asked students whether there should be a higher use of mobile applications as a resource and support for academic learning, we realize that 65% of students agree or fully agree with the statement, regardless of the dependent variable used (study cycle, scientific area, class, typology, timetable) and mostly with values of at least 50% of the answers obtained. The only exceptions are the master’s students who have lower values with 42% and the engineering students with 41%.
When asked if they think that the integrated use of mobile applications in the courses can be useful for them, 92.4% of the students answered positively and only 7.6% of the students considered the opposite. Finally, the students were asked if their teachers allow the use of their portable PC, smartphone or tablet in the classroom: 63% of all students say that teachers allow the free use of devices, while 34% say that teachers only allow it when planned. Only 1.1% say teachers do not allow their use.
In the observation grid, teachers were also questioned about their position on the use of mobile devices and if they planned their use and the use of applications. Of the 12 lessons analyzed, five of the teachers said that their use was planned, although it should be noted that these teachers taught two course units each. All the teachers said that they allowed the use of mobile devices and applications in lessons.
In the logs, it is not possible to determine whether the use is planned, nor to understand whether this planning has an impact on the usage, although when planned, there is a slight tendency for social networks to drop from the top of usage and, for example, Google searches assume a higher position, as they are most used.
Thus, we can deduce that teachers allow the use of applications during classes, although this is not always planned. When planned, there is a slight focus on search applications rather than on the use of social networks. For this reason, it can be concluded that more attention should be paid to this planning of use, either in research applications considered useful to the course units, or even in the use of social networks for the same purpose.
4.3. Do Students Use Applications/Services Intensively during Class?
Another factor that was investigated was whether the use of mobile devices and applications in classes is intensive. To this end, an analysis of the data collected was carried out. We began by analyzing the number of hours per day students use mobile applications: 53% of the respondents said they use them for 2 to 4 h or for 4 to 6 h, with 11% saying they use them for more than 6 h. Moreover, 30% of the respondents reported periods of use “between 1 and 2 h” and 6% said they used them for less than 1 h. There is no reference to non-use.
Students were also asked about the number of days per week they use mobile applications during the teaching activities. Some 56% of the respondents reported using them 4 to 5 days per week and 39% reported 1 to 3 days per week. Only 5% reported not using mobile applications during teaching activities. Still, in this dimension of analysis, we tried to know how many times they access mobile applications on their smartphone, on average, during a teaching activity. Notably, 70% of the respondents referred 1 to 5 times, 22% indicated 6 to 10 times and 4% refer more than 10 times. It should also be noted that only 4% reported not using mobile applications.
Crossing these data with the counting of all the accesses collected after being processed (approximately 1,614,000), the raw value was higher (2,051,000). With the number of students detected by the logs as accessing through the institutional Wi-Fi network (213), these accesses correspond to approximately 7577 accesses per student. In
Table 3, we can see a summary of number of students, number of accesses and average of accesses. This figure is a division of the number of accesses by the number of students and should therefore be interpreted as such.
There are classes with much higher uses than others, but taking as an example the two classes with the lower number of accesses (about 8000 and 27,000, with 24 and 10 students, respectively) and making the calculation for them, we have about 333 access and 2700 access, respectively, per student. Even if we consider the hypothesis that part of these accesses may be automatic accesses from the operating system or from the facilities themselves, we still have quite high values per student.
4.4. Perception vs. Effective Use of Applications during Classes?
Regarding the students’ perception of the use of mobile devices and applications during classes, and as already mentioned in the previous question, in the duration of a lesson, 70% of the students report using the applications between 1 to 5 times, 22% indicate 6 to 10 times, and 4% more than 10 times. It should also be noted, as mentioned above, that only 4% report not using them. There is also a relatively low percentage of students mentioning that they use the devices more than ten times during the lesson (4%).
However, the analysis of the logs shows that this use appears to be much more intensive. We counted all the accesses of all the students in the logs, and considering that, based on the pilot, in each application there were about 30 accesses per application per class/hour, we consider that more than 300 accesses is significant and that this would correspond to about 10 accesses to applications per class/hour. In this analysis, we have that 142 students from a total of 213 made more than 300 accesses during the class. If we raise the value to 1000 accesses, we still have 118 students, as we can see in
Table 4.
Considering that in the surveys, only 4% of the students refer using the mobile phone more than 10 times per class, we can say that even for the most favorable case, the number of accesses is always much higher.
Therefore, we consider that the students’ perception of their use may be incorrect, and they feel that their use is less than it is. In fact, there may be some correspondence in the type of applications they say they use, but the perception of use, in terms of frequency and amount of access, appears to be less than the actual use.
4.5. Which Applications Are Most Used and What Kind of Applications?
In this question, we used the data to understand what kind of applications they used the most. The type of applications most reported are social networks (84%), email (78%), music (64%) and research (58%). The least reported are blogs (3%) and cloud applications (10%). Regarding the most used applications, the results show that the most reported are Facebook and Instagram (both with 82%), YouTube (74%), email (69%) and instant messaging applications (56%). The least mentioned are Skype (1%) and Snapchat (5%).
When analyzing the mobile applications they use most often by category, the data reveal: in the chat category, Facebook Messenger (63%) and WhatsApp (52%); in the browser category, Chrome (70%) and Safari (24%); in the social networks category, Instagram (62%) and Facebook (53%); in the video category, YouTube (72%) and Netflix (18%); in the music category, Spotify (44%); in the photography category, Instagram (56%) and finally, in the email category, we have Gmail (82%) and Outlook (72%).
The logs confirm the data from the surveys because, in fact, social networks, messaging tools and video applications often appear at the top of use, followed by email or search applications.
4.6. Are There Differences in Use Regarding Scientific Area, Typology Study Cycle and Class Schedule?
To answer this question, we used the data collected and divided this analysis into the categories created.
Regarding the data from the surveys, we can start by saying that the engineering students mention the use of mobile applications and devices during classes due to lack of interest in the subject of the classes or for entertainment purposes in higher percentages. They also present higher values of agreement that mobile applications distract students during classes. There are also differences in the perception of usage as engineering students report using the applications mostly on the incidence of “4 to 5 days a week” and those in the social sciences “1 to 3”. Engineering students also mention a lower use compared to social sciences.
In relation to the type of applications, engineering students claim to use more music and video applications whereas social science students use browser applications/services and research more. Through the logs, we can perceive that, for example, in engineering, there are many more destinations in comparison to the social sciences area.
Regarding the difference in the use of devices per cycle, we start by noting that Ph.D. students claim to use personal computers more when compared to other mobile devices.
As for the question “do you use mobile applications during classes?”, master’s students have a higher level of disagreement with this possibility compared to undergraduate respondents. Ph.D. students agree with this question, i.e., they are more aware of their actual use of applications.
Another point to be mentioned is that when asked about the reasons why they use mobile applications in a classroom context—excluding the academic reasons—answers regarding habit, routine or the need to be connected or entertained are mentioned in greater numbers in the afternoon.
Master’s students are those who report less use of applications for non-academic purposes, while Ph.D. students admit and report using them, but considering that such use is a benefit. On the other hand, in the surveys, doctoral students report lower use rates than other cycles. From the data in the logs, we can see that undergraduate students are those with higher use rates compared to other cycles.
Regarding the typology, we can refer that in the surveys, the students of the theoretical classes refer to a use of applications that later in the logs, we perceive to be superior to that claimed in the answers to the surveys.
In relation to the timetable, we can mention that students use more music and video applications in the morning and browsers, schedules and e-mail in the afternoon.
We can see the summary of the data collected in the logs in
Table 5 and
Table 6.
We can conclude by pointing out that on this issue, there is a difference in the use of devices and applications by area of study, and that the same happens in relation to the cycle. The same cannot be said with regards to the typology and timetable. In these categories, the difference is not so significant.
4.7. Are There Times of the Day and Classes When Students Use Applications the Most?
Regarding this question and using the data from the surveys first, we tried to find out at which time of the day, during the class period, students most frequently use mobile applications, and we noticed that 53% of the students reported using the applications indifferently, although 20% reported using them more in the evening, 12% more in the morning and another 12% more in the afternoon. Only 3% reported not using them. If we compare these data with the logs of the morning lessons (6 lessons) and the afternoon lessons (6 lessons), in terms of number of accesses, the difference is not significant, since in the morning we have about 392,000 accesses and in the afternoon, we have 343,000 accesses. However, as far as the destinations themselves are concerned, in the morning there are a lot more different destinations, which may be since most of the morning lessons are in engineering, which typically has more destinations than the other areas.
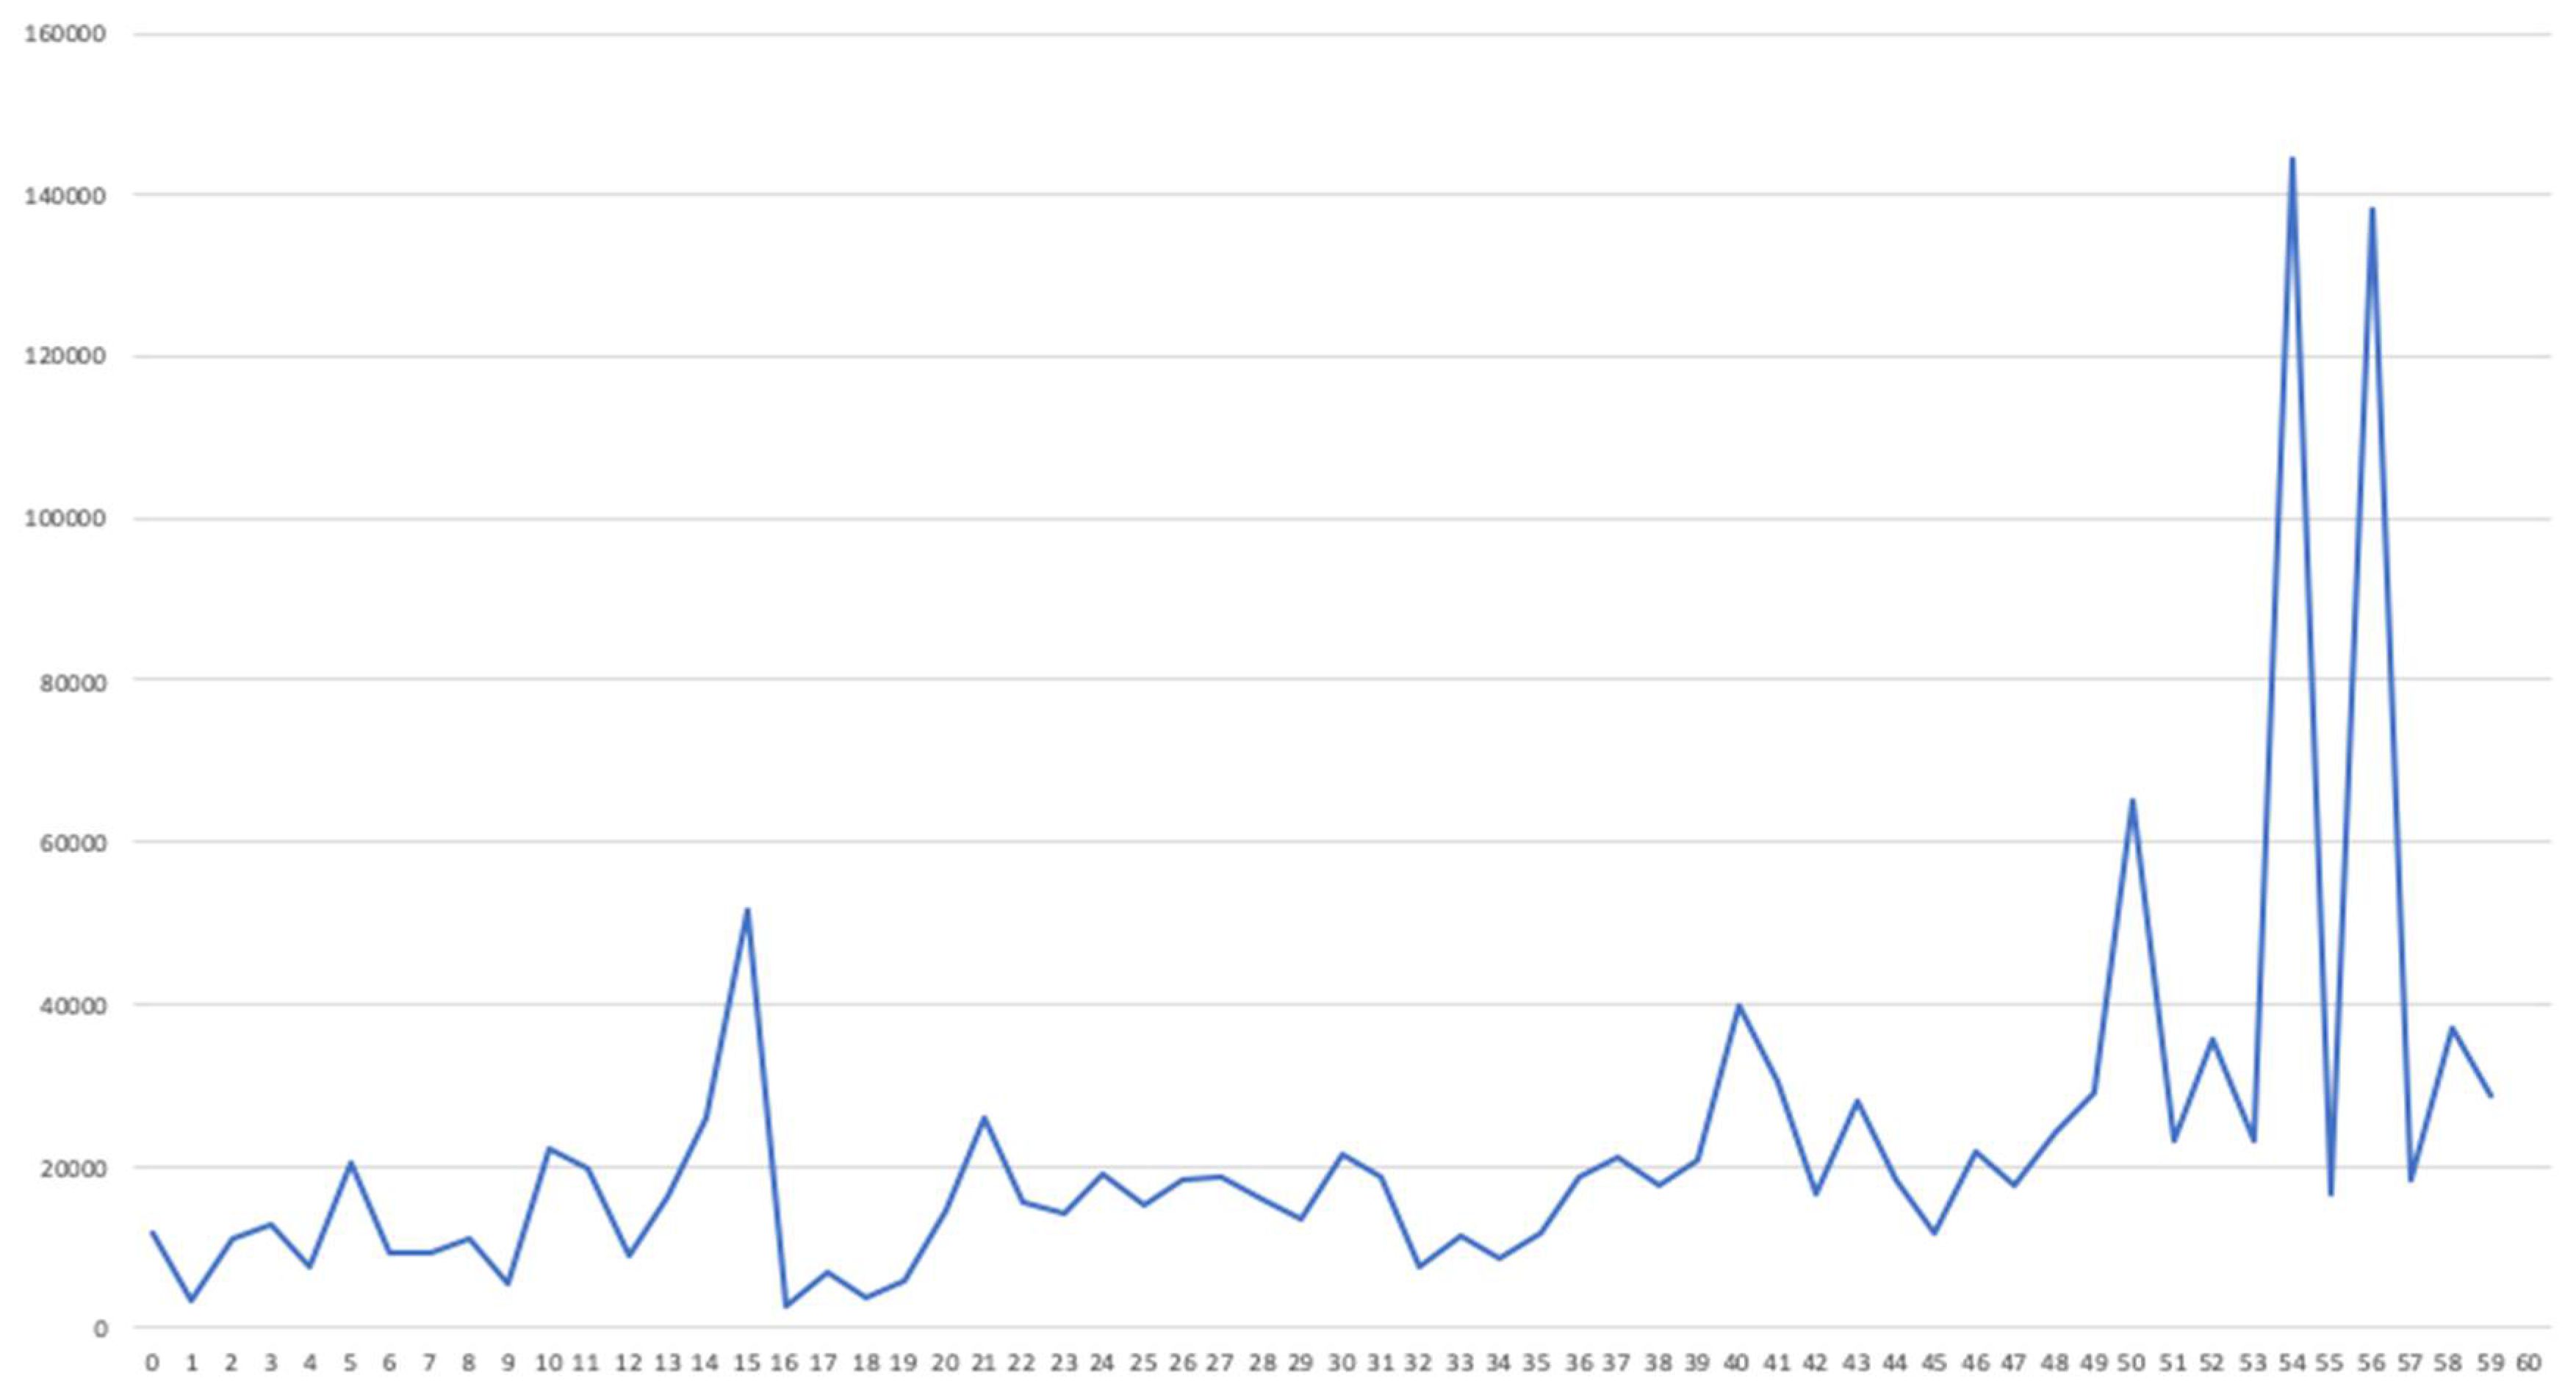
To understand at what point in the lesson students use applications more, we used the data from the logs by comparing the peak usage graphics and the hourly usage of all the lessons. Thus, we start by saying that almost all the lessons have different usage patterns. However, after a mapping of the usage peaks in each 60-minute lesson, we notice that there is a prevalence of usage peaks at certain times in the lessons, typically corresponding to the beginning of the lesson (between minutes 10 and 20) and the end of the lesson (between minutes 40 and 60). This is also the case when we group classes into the categories of degrees, cycle and timetable.
Figure 4 presents the peaks in use from the 12 lessons analyzed.
4.8. What Do Students Do When They Are Not in Class?
To try to answer this question, we used the data collected to compare the use by the students who were present during the class period with the use of the non-attending students who were also connected to the institutional Wi-Fi network.
Regarding the answers to the survey, the respondents generally mentioned the use of social network applications (83%), e-mail (78%) and music (64%) outside the classroom context. In general, the effective use outside the classroom corresponds to what the students say, but in the process of this analysis, some differences have emerged in the use the students make of the applications when they are in class, compared to the use made when they are not there. We begin by mentioning that outside the class, the application WhatsApp appears in two of the cases, which does not appear during classes. There are also some shopping services, IPTV, news sites and some games.
When comparing the use according to the degree, in the case of Ph.D. students, the opposite happens: the use of social networks outside the class goes up in the ranking of use. In addition, Ph.D. students and those out of class have a less use of institutional services in the ranking.
5. Discussion and Conclusions
In this article, we intend to present the conclusions obtained from the study on the use of mobile applications by students at the University of Aveiro.
During this study, the accesses in classes correspond to approximately 7577 accesses per student. Although some of these accesses may come from automatic processes, we still consider that to be a rather high number. This use is essentially made from smartphones and laptops. The results from our study are reinforced by the ones from other studies, namely the Mobile Survey Report, which states that students use laptops and smartphones during classes [
18].
Furthermore, in this context and based on the data collected through the application of the surveys, about 70% of the respondents reported accessing mobile applications on their smartphone between one to five times during a teaching activity. Regarding the use during the week, about 56% of the participants state that they use them between 4 to 5 days per week and 39% between one to three days, and there are no respondents who assume not to use them. Very few reported using them more than five times during class and most students reported using applications between 1 to 3 times. However, the analysis of the logs shows that the use seems to be daily and much more intensive than the one reported in the surveys, thus being aligned with the findings which claim that the perceptions of users are misleading in terms of the actual use.
With regards to the purposes of using the applications, at an academic level and in a classroom context, 77% of the respondents say they use mobile applications for academic and non-academic tasks and 75% say they use them during class to assist their work in class/to conduct research. Only 13% assume their use for non-academic tasks. We also noticed that in the surveys, many respondents reported using the applications for academic reasons, which is not the case, since the accesses verified in the logs show uses for other purposes. From the analysis of the logs, it seems that the participants in the study do, in fact, use the devices for academic tasks, but what is shown in the data is that they also use them quite frequently during classes for non-academic purposes. Participants acknowledge the use for non-academic purposes in the survey. However, according to the analyzed logs, the use is more intensive than they admit to.
The most used applications are Instagram, Messenger, YouTube, E-mail and Facebook. This perception seems to be confirmed in the logs, although it should be noted that Facebook has more intensive use than that reported in the surveys, and there is a huge tendency to use social networks during classes. Furthermore, in this context, it is important to highlight the fact that many respondents stated that they do not use music and video applications during classes which, in fact, does not correspond to the evidence: the logs allow us to confirm that students use music and video apps, which in fact registered a rather high number of accesses.
These facts seem to contradict previous studies such as that of Chen and DeNoyelles, who state that despite the time distance between the two studies and the respective changes in the use of smartphones in this time interval, the most frequently used applications were those that provide access to information (Google and Safari), digital dictionaries, university applications and applications for information management such as Dropbox, Evernote and the word processor [
19]. In another more recent study, with one of the authors in common, they report “Social Networking, Music, Social Media and Entertainment” apps as the most frequently used apps by students for personal activities [
20], which seems to be confirmed by the results of this study. This may mean that students are increasingly using apps during lessons in a similar way to those they use outside of lessons and in more personal usage scenarios.
When analyzing the use of apps in different study areas, respondents from the area of engineering say they use the computer and tablet more in the classes. In fact, the data show that there are many more accesses and to more destinations than those found in social sciences. These students report in higher percentages that they do not use applications in the classes, admitting that when they do, they use them for distraction or entertainment. Students in the social sciences do not have this clairvoyance in the same proportions. On the other hand, engineering students agree in higher percentages that the use of applications distracts students, when compared to the social sciences students.
Moving on to the conclusions by study cycle, we begin by pointing out that Ph.D. students use laptops more than undergraduate and master students, who prefer the use of smartphones. Ph.D. students also have one of the lowest percentages of use of the devices in classes and say they use them to complement classes and access institutional services, which is fully confirmed in the logs: the purposes of use are class related and linked to institutional tasks as well as to the management of academic tasks. It should also be noted that Ph.D. students always report higher percentages of non-use, followed by master’s students and undergraduates, which corresponds to the results of the logs. Ph.D. students are also the ones who show more confidence in the use of mobile devices/applications to support the classes.
Regarding the type of class, in the theoretical-practical classes, the applications are more used, but the students agree more that the accesses can distract the students during these classes. On the other hand, there is a discrepancy, since the students report that in these classes, they use applications such as social networks less, which is contradictory to the data from the logs.
With regards to the timetable, there are differences in use between the morning and afternoon. For example, students use more music and video applications in the morning and present higher accesses to browsers, calendars and e-mails in the afternoon. It should also be noted that the habit, routine or the need to be connected and entertained has more occurrences of response in the afternoon.
Given that this study shows that students make considerable use of mobile applications during their classes, it seems sensible to recommend teachers to direct this use towards the objectives of the courses by including this use in the preparation of the classes. In this study, we could see that a large majority of students consider that there should be more integration of mobile applications during lessons, as mentioned before, to support learning and this could be useful to them. This consideration is reinforced by the Mobile Survey Report, in which 40% of students surveyed indicated that they would like their teachers to use more mobile applications or devices in class. However, students reported modest support from teachers using mobile applications/devices in class [
18].
Another relevant factor that emerges from this study is that the use of applications during classes is often due to distraction, habit, routine, the need to be connected, entertainment or lack of interest in the subject. If the use is planned, based on the results, it can contribute to increase the interest in the contents of the classes. It should also be noted that a large majority (percentages always above 80%) of students agree with the integration of mobile applications in their curriculum.
In this study, we also conclude that this integration becomes even more relevant at the highest levels of education, i.e., doctorate and master’s degrees. This is probably due to a greater maturity of these students as, for example, Ph.D. students use applications more as a complement to their respective curricular units and for their management. Still, in this context, we consider that in first cycle studies, there is a greater predominance of the use of social networks, so the integration of their use in the curricular units could be an advantage.
Regarding the limitation of this study, one of the main limitations was the fact that the owners of the services changed the name of the destinations. As an example, we can mention Google, which during this project changed the way it presents the destinations of its products, such as YouTube, Gmail or Drive. Another limitation has to do with the use of intermediate cache servers due to the enormous amount of data which comes from the main application servers, and which makes the analysis more complex and possibly with greater deviations.
Another limitation was related to the size of the data files resulting from the logs, since they were files which involved an enormous processing capacity, since most of them were files with more than 500,000 lines, corresponding to the accesses made per class.
Concluding with future lines of research, we consider it pertinent to continue the present research on this theme in research projects, namely in the cross-referencing of usage data with academic results and in extending this study base to other institutions with different typologies. It should also be noted that it is important that there are more studies conducted to allow more solid results, using logs as a complement to the surveys which are the most common way to verify the use of applications and devices in these contexts.


