1. Introduction
The focus of university education should be on the development of students’ competencies [
1,
2,
3]. This implies a paradigm shift from the traditional model in which university teaching activity was centered on professors and content development [
2]. Motivation is a multi-dimensional phenomenon that has a directive function indicating an objective that the individual seeks to attain, an activating dimension that sets the person in motion, and a persistence dimension that encourages the individual to continue with the task instead of giving up [
4,
5,
6].
Engineering courses tend to have low success rates, and students often consider them to be difficult and show low motivation towards them [
4,
7,
8]. In this sense, it is useful to have information on the evolution of non-cognitive variables, such as motivation, to evaluate persistence in engineering degrees [
9,
10]. In this context, it is essential to obtain information about the profile of the students so that the teaching can be adapted based on the perceived needs and motivations. The student’s profile is determined through elements and/or traits that make it possible to highlight the individual’s basic identifying characteristics, such as personal identification, learning profile, knowledge about certain subjects, personal and social preferences, etc [
9]. One of the elements of the student profile that can support the teaching process is the learning profile. This is specific to each individual and is developed autonomously and unconnected with them, offering a detailed and characteristic model of the individual learning factors that can be contrasted and extrapolated to a representative sample [
11].
Xie et al. [
12] investigated various methods to establish university students’ learning profiles. They showed that selecting the appropriate learning profile facilitates the student’s acquisition of knowledge. In this line, Chang [
13] particularised his study of learning profile to Taiwanese university foreign language students using four variables (gender, academic subject, fondness for the language, and previous experience). Previous experience was discovered to be the variable presenting the greatest significance in the adoption of the learning profile. Applying a descriptive-quantitative method and extending the line of research of the previous authors, Wewe [
14] studied the learning profile of mathematics undergraduates with the objective of finding the optimal learning model for the transfer of knowledge and skills. As a result, he obtained a theoretical-reflective profile characterised by analytical individuals who present logical thinking and integrate their observations into logical and complex theories.
In the field of engineering, Nelson et al. [
15] applied the learning profile approach to test whether students of a foundational and introductory engineering course adopt maladaptive motivational beliefs and self-regulated learning models. According to their results, the students fell into five learning profile types: Strategic, Knowledge Building, Apathetic, Surface Learning, and Learned Helpless. The first two are considered to be in the category of adaptive learning and the last three in that of maladaptive learning.
Within the same field of study, Zaina and Bressan [
16] developed a system to assess learning profiles in engineering students based on their preferred categories. These categories are defined from the model of learning styles in engineering education developed by Felder-Silverman [
17]. With the emergence of the global pandemic of COVID-19, the educational paradigm changes completely. This fact creates the need for new studies on the learning profile of university students to understand the new needs of students. Thus, Suryaman, Kusnan and Mubarok [
18] studied the learning profile of engineering construction students during the COVID-19 pandemic. They concluded that online learning applications need to be easily accessible and that they must be combined with various applications to provide the seamless delivery and acceptance of the material in the teaching and learning activities.
From the point of view of student motivation, Moreno-Losada [
19] examined the motivation of students in order to discover which were their internal motivations intrinsically associated with study and which were their external motivations. Complementing this line of research, Corrales-Serrano [
20] analysed what the students motivations were for choosing their upper secondary education modality.
To support this scientific approach, Tapia et al. [
21] developed and validated a questionnaire in Spanish, known as MAPE-3, that helps to classify adults in academic environments according to various motivational dimensions on the basis of the prevalence of different basic belief scales. The MAPE-3 questionnaire was used in a pilot study to assess the participants’ motivation in order to test the effectiveness of a practical clinical intervention in reducing procrastination [
22]. An adaptation of the questionnaire was used to evaluate the degree of motivation of nursing students in the Universidad Nacional Mayor de San Marcos (Peru), in this case distinguishing between intrinsic and extrinsic motivations [
23]. On the other hand, Serrano et al. demonstrated that the MAPE-3 questionnaire is suitable for the field of engineering [
24], as it allows a detailed assessment of the motivation of students who are characterised by great dynamism, a high motivation to develop challenges and a high ability to solve problems in extreme work environments. The latter qualities are also very characteristic of the health field [
25] for which the questionnaire was designed. The motivational profile obtained from the MAPE-3 questionnaire will allow the creation of an appropriate learning profile for the target students.
Learning profiles based on the motivational profile allow for the determination of which teaching-learning methodology is best suited to the motivational needs of the students. Active learning methods are an interesting instrument with which to motivate students [
26], improve their emotional performance [
4] and guarantee the development of their competencies [
27]. In order to ensure their correct implementation, it is essential to know what the undergraduates’ motivations are [
28]. The research examines methods such as gamification, Project-Based Learning and Problem-Based Learning in the field of engineering [
4,
29]. However, there are few precedents in the scientific literature that analyse students’ motivation for their learning profile. Moreover, there are no studies in the field of engineering projects. Therefore, the aim of the study is to answer the following question: what is the learning profile of engineering project students? In order to establish the learning profile of those assessed, their motivational profile will be analysed. The study will compare the motivational profile of the students by classifying them into different sample groups: educational background, higher education trajectory, and gender. This will allow an in-depth analysis of the similarities and differences in the motivations of engineering project students, establishing a learning profile that best suits the target group. The learning profile will allow the selection of the most appropriate teaching methodology and will serve as a guide for the development of successful educational programmes.
2. Materials and Methods
2.1. General
A descriptive-exploratory study of the learning profile of engineering project students was carried out based on their motivation profile. The “Projects” course is common to all Bachelor’s degrees in engineering (industrial branch), and belongs to the final year. It is taught at the School of Industrial Engineering at the University of Extremadura. The content is related to the general theory of engineering projects. It deals with the morphology of the project document, the content and independent studies that each constituent document should contain, their rules and regulation, the economic and temporal planning, as well as administrative procedures.
2.2. Data Acquisition
The validated instrument for the assessment of motivational orientation in adults, MAPE-3 [
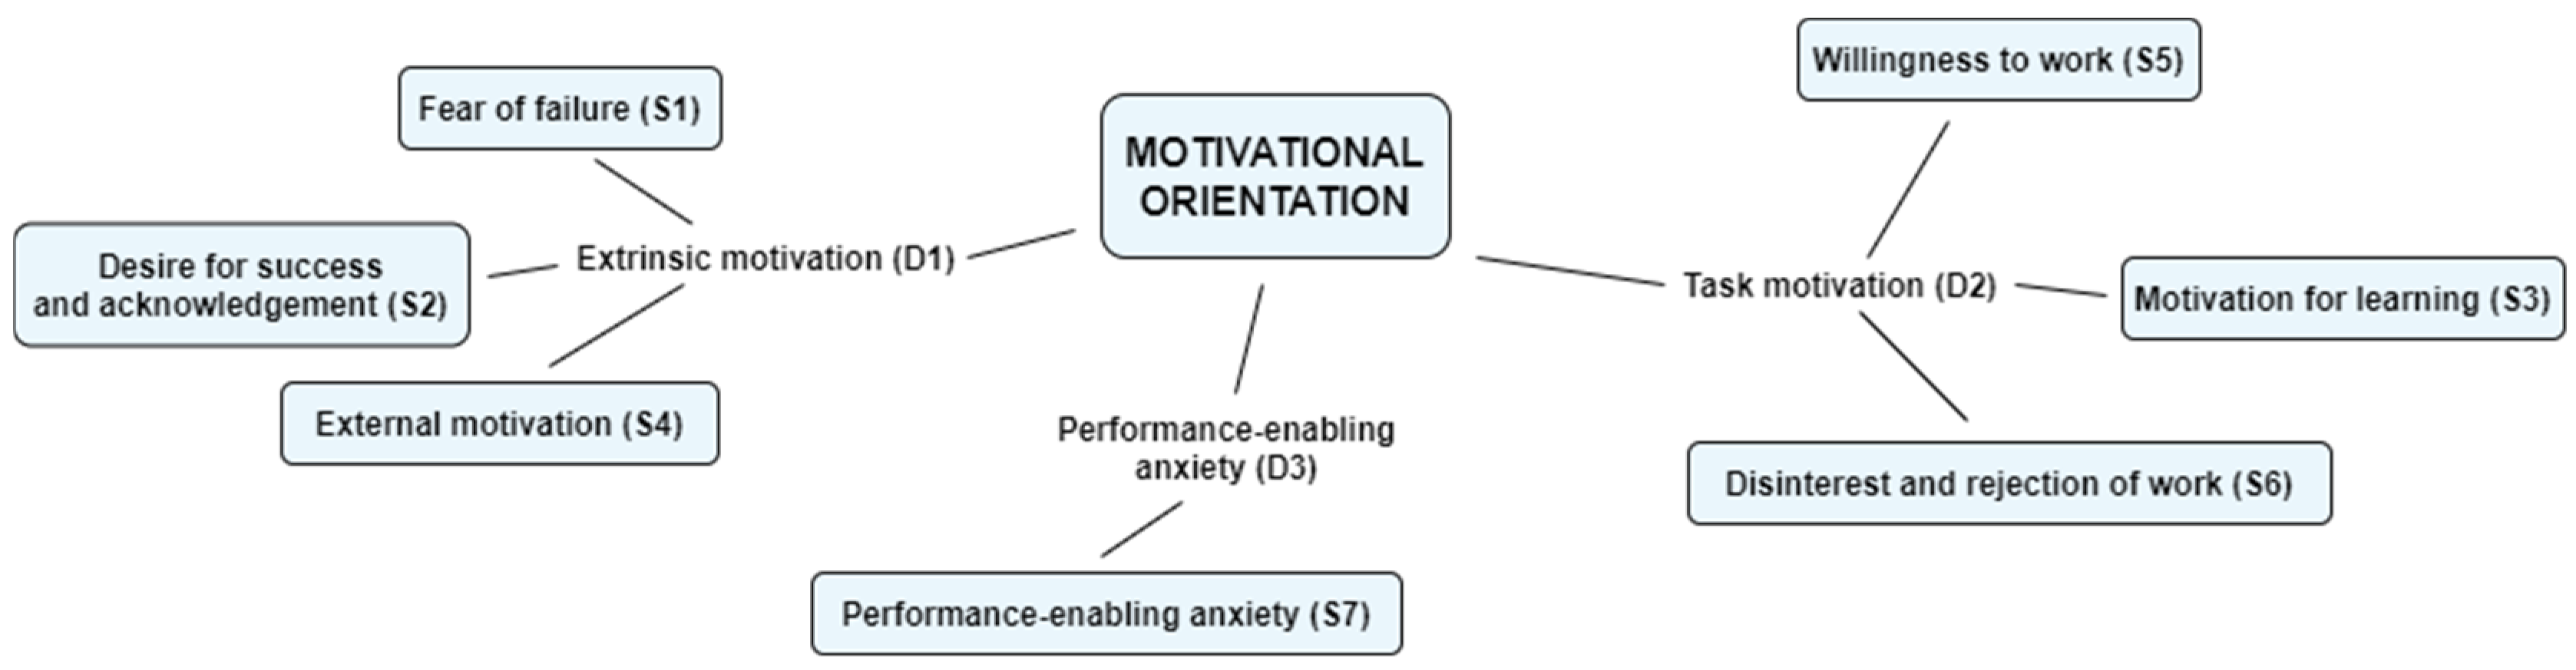
21], was used for the quantitative evaluation of motivation. This instrument comprises 124 questions with dichotomous responses of either agreement or disagreement with the said statement. The questionnaire asks questions such as: “I like to do different things at the same time”; “I don’t mind the pay when the work satisfies me”; “I like to stand out from my colleagues”; “Having a bit of nerves helps me to concentrate on the work”, or “The greater the difficulty the better I perform”. A basic scale or first-order factor consists of a set of questions. There also exist the following seven scales: fear of failure (S1), desire for success and its recognition (S2), motivation to learn (S3), external motivation (S4), willingness to work (S5), disinterest and rejection of work (S6), and performance-enabling anxiety (S7). One or more of these basic scales make up the second-order factors or motivational orientations, of which there are three: extrinsic motivation, task motivation, and performance-enabling anxiety.
Each question contributes to the raw score of the first-order factors (scales). The conjunction of one or more basic scales constitutes one of the three motivational orientations.
Figure 1 shows the interrelation between first- and second-order factors.
The sample comprised 132 individuals, 106 men and 26 women, with a mean age of 23 years (minimum 21 and maximum 30). The selection of individuals was voluntary and was limited to students who were currently enrolled in the subject of Projects (first semester of the final year) during the academic year 2018–2019. No further selection criteria were imposed. In this way, the sample is intended to represent engineering students who have received at least three years of education. The participation rate was 89.3% of the students. With respect to their upper secondary education, 92% came from Baccalaureate and the rest from Vocational Training, and most had attended a public secondary school (73.5%), 18.4% came from a concerted (taxpayer-supported private) secondary school, and the remaining 8.2% came from a private secondary school. By degree course, the greatest proportion of the students (50%) were in Mechanical Engineering, followed by Electronic and Automatic Engineering (32%), Electrical Engineering (14%), and Materials Engineering, with only 4% enrollment. While nearly three-quarters of the sample (74%) were enrolled in fourth-year subjects, 48% were enrolled in subjects of previous years. Of those surveyed, 80% said they attended more than 75% of the classes, and only 4% attended less than 25%. Their mean mark on a scale of 10 points was 6.66, with a deviation of 0.67.
2.3. Data Processing
The raw scores of the scales and then of the dimensions were calculated. The internal consistency of the first- and second-order factors was analysed by calculating Cronbach’s alpha to check their reliability. An α value equal to or greater than 0.7 was considered adequate. Pearson’s correlation coefficient was used to discover any significant correlations between the basic scales and between the motivational dimensions.
The scale and dimension scores were standardized to allow comparisons. In particular, a McCall-T [
30] transformation was applied to the raw scores, giving T-scores with a mean of 50 and a standard deviation of 10.
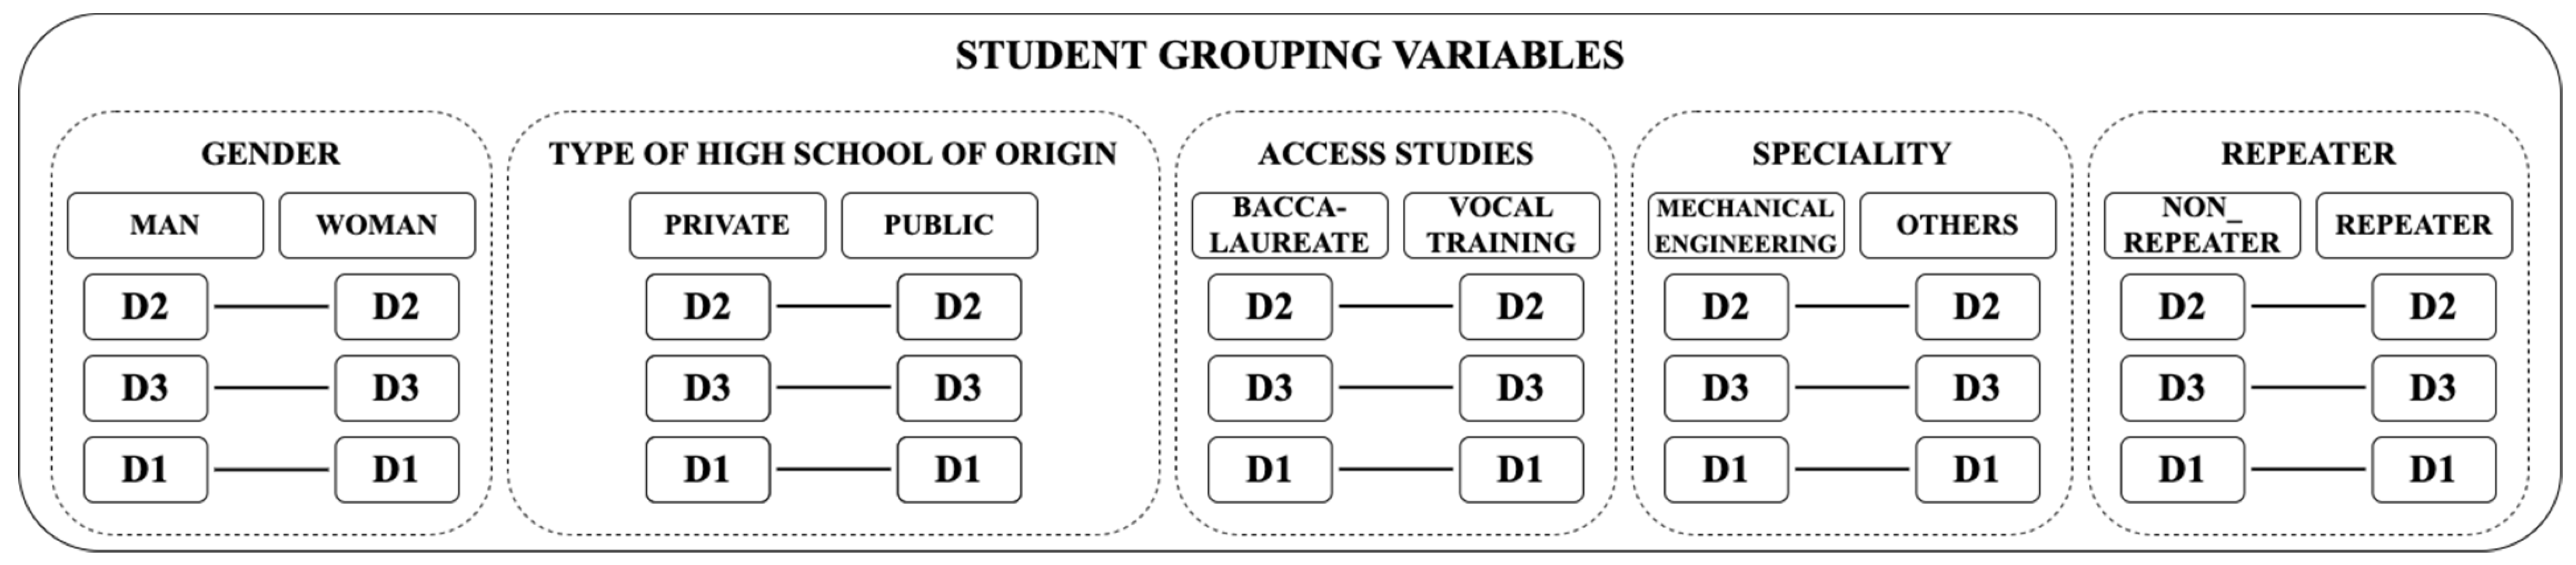
The scales and motivations present in the different groups (
Table 1) were analyzed, checking for any significant differences between the students’ scores in the different categories. For this, a prior normality check (Shapiro-Wilk) was carried out, resulting in the null hypothesis (H
0: the sample follows up a normal pattern) being rejected. The non-parametric Mann-Whitney U test for independent samples was then applied, leading to acceptance of the null hypothesis, so that it was assumed that there was no relationship between the categories analysed. The results of the statistical tests are listed in the
Appendix A in
Table A1,
Table A2,
Table A3,
Table A4 and
Table A5.
3. Results
3.1. Internal Consistency
The mean Cronbach’s alpha for the scales is 0.750, with a minimum of 0.664 and a maximum of 0.872. For the dimensions, the minimum is 0.708 and the maximum 0.879, with a mean of 0.791.
Table 2 lists the mean Cronbach’s alpha values for the scales and dimensions, respectively.
3.2. T-Score
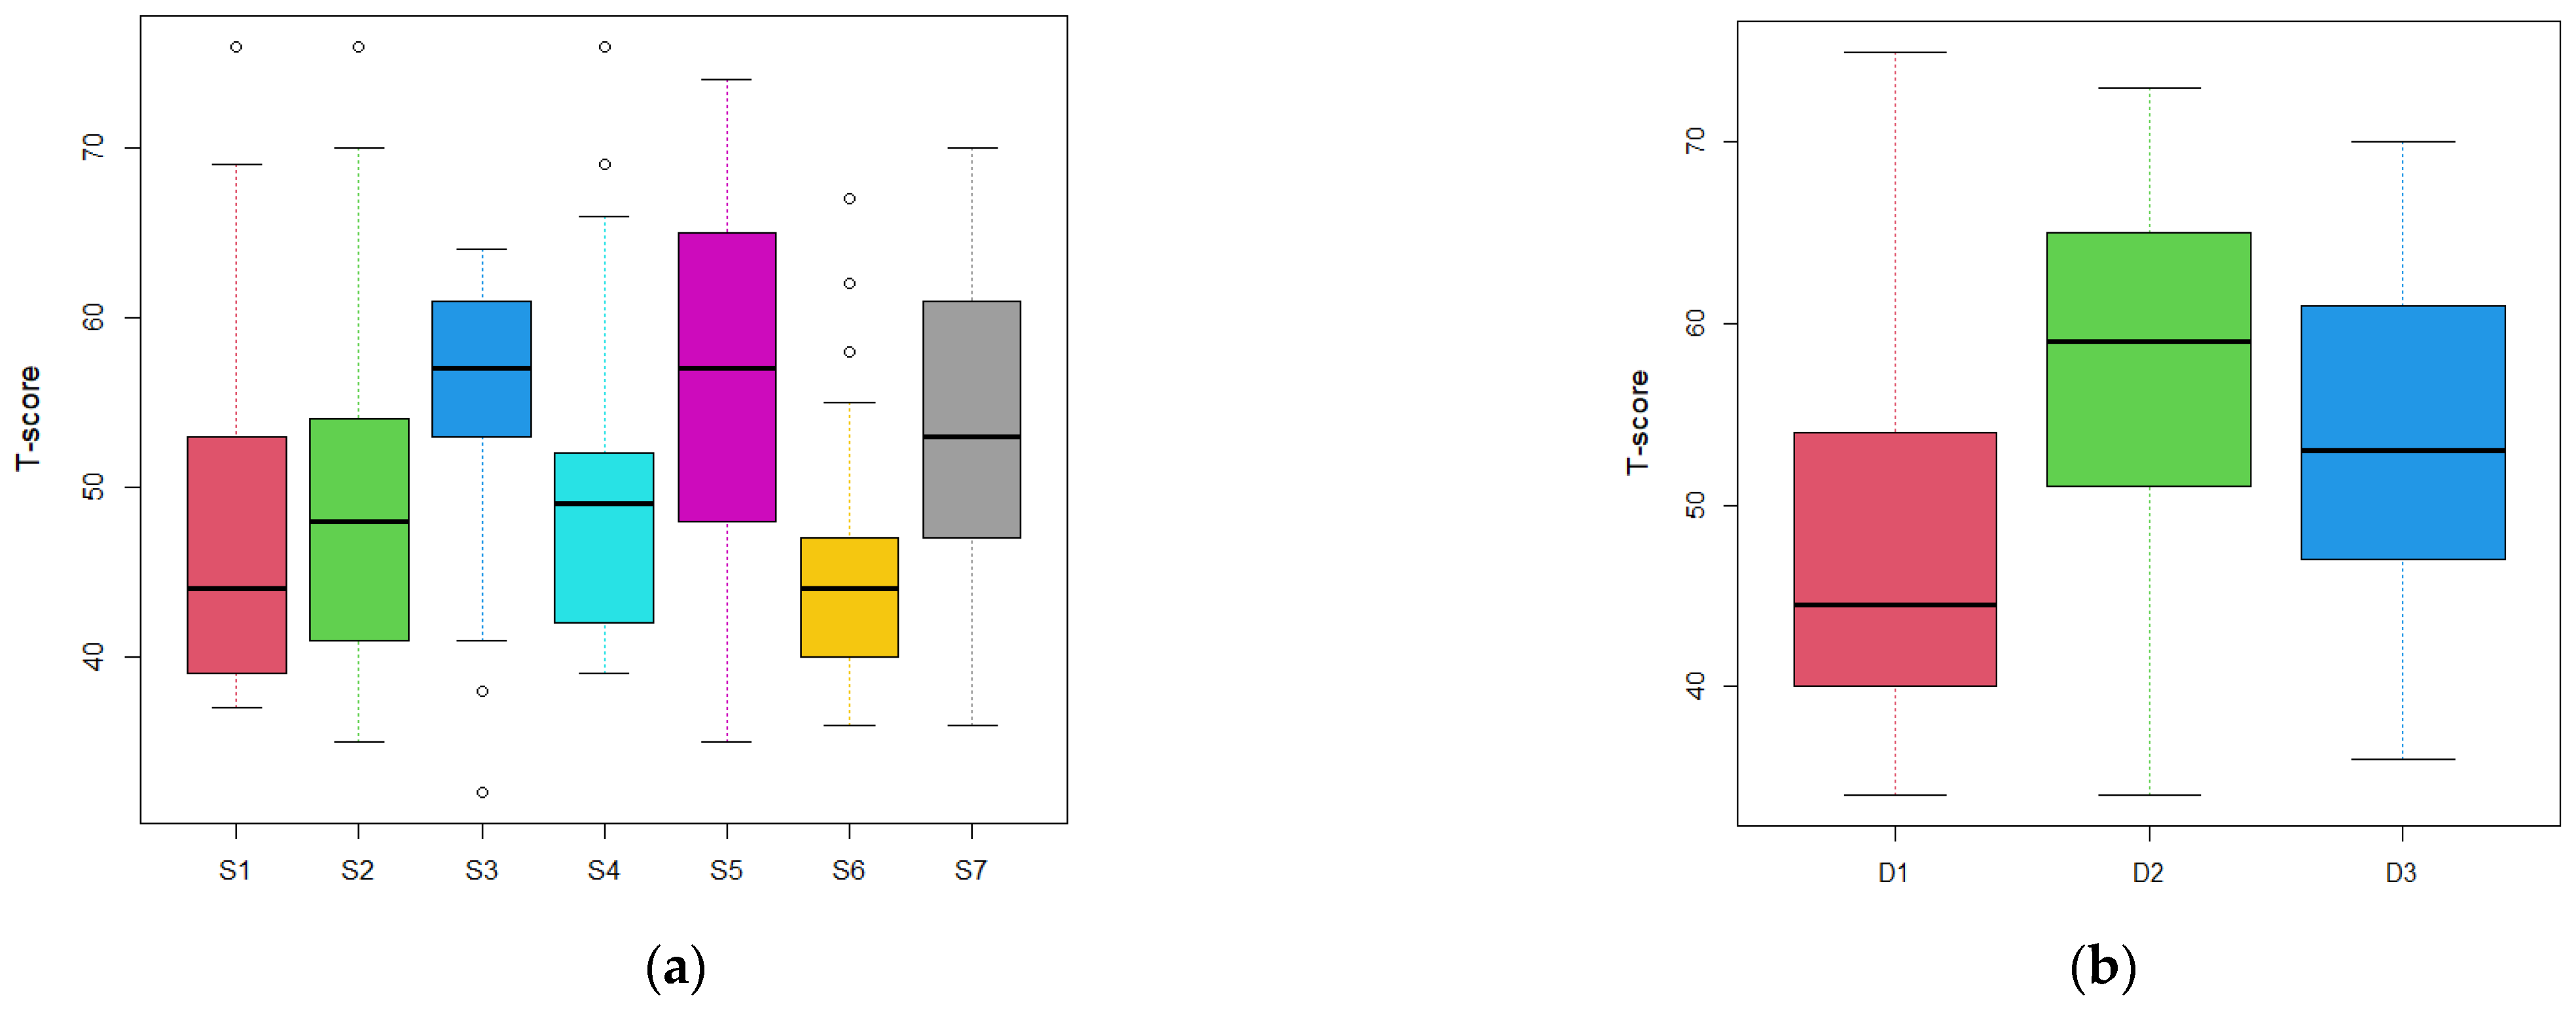
It was observed that the predominant first-order factor is the motivation to learn (S3), with a mean score of 55.9 points (standard deviation (SD) = 6.9). On the other hand, the least predominant is lack of interest in and rejection of the work (S6), with a score of 45.4 points (SD = 7.8).
In the middle were found two other more predominant scales–willingness to make an effort (S5), with 55.8 points (SD = 10.2), and performance-enabling anxiety (S7), with 53.2 points (SD = 8.4). Less predominant scales were external motivation (S4), with a mean of 50.1 points (SD = 9.4), desire for success and recognition (S2), with a mean of 48.4 points (SD = 8.8), and fear of failure (S1), with a mean of 46.9 points (SD = 9.4).
The predominant dimension among the students is task motivation (D2), which reaches a mean score of 57.8 points (SD = 8.4). Least predominant is extrinsic motivation (D1) with 47.7 points (SD = 9.1). In the middle is performance-enabling anxiety (D3) with a mean score of 53.1 points (SD = 8.5).
Figure 2 shows the distribution of the first- and second-order factor T-scores.
3.3. Correlations between Scales and between Dimensions
Different combinations of significant correlations between the scales are obtained. Fear of failure (S1) correlates positively with desire for success and recognition (S2) (R = 0.509) and negatively with willingness to make an effort (S5) (R= 0.312). Desire for success and recognition (S2) and external motivation (S4) correlate positively (R = 0.458). Motivation to learn (S3) is directly correlated with willingness to make an effort (S5) (R = 0.325) and inversely with lack of interest in the work and rejecting it (S6) (R= 0.348). Finally, willingness to make an effort (S5) is negatively correlated with lack of interest in the work and rejecting it (S6) (R= 0.342). All of these combinations of correlations, despite their low values, are significant because their respective Cronbach reliability indices lie within the range 0.7–0.87 [
31].
Table 3 lists the correlations between scales.
Among the dimensions, the only significant correlation is between extrinsic motivation (D1) and task motivation (D2), which are inversely correlated (R= 0.279).
Table 4 lists the results for correlations between dimensions.
3.4. General Motivational Analysis
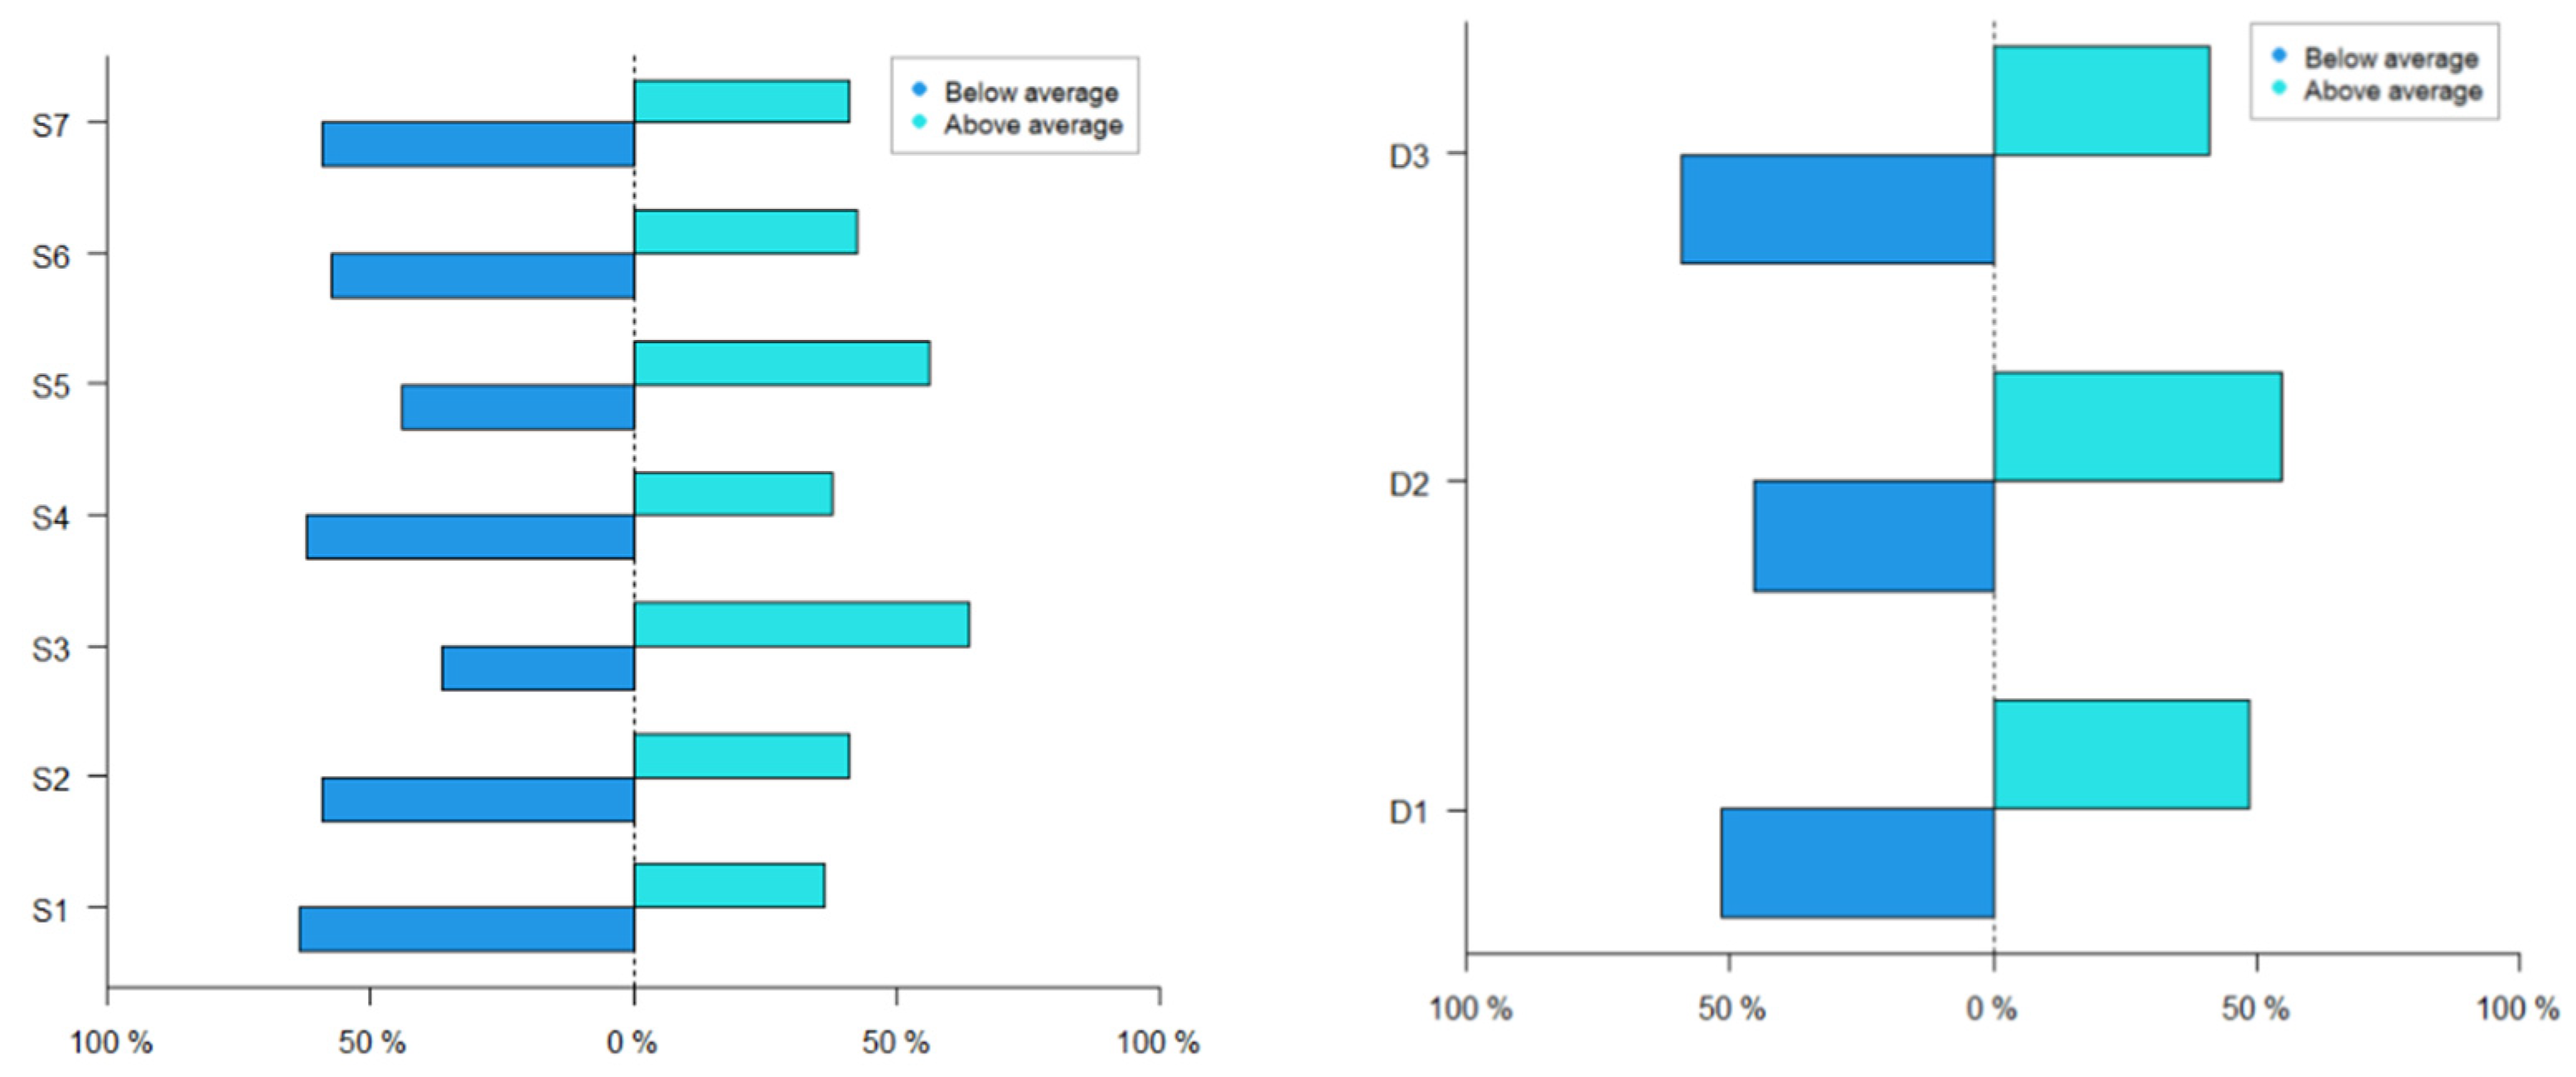
Figure 3 shows the distribution of the students according to whether they are above or below the mean of the T-scores for each of the motivational scales and dimensions.
Analysing the values from the perspective of the motivational scales, one observes that the maximum scores correspond to motivation to learn (S3) followed by willingness to make an effort (S5). The minimum scores correspond to fear of failure (S1) and external motivation (S4). The rest of the scales present mean score values with a downward trend with respect to the mean and whose values are very similar to each other.
From the perspective of the motivational dimensions, one observes that the maximum scores correspond to those students who feel motivated by the task (D2), and the minimum scores in the performance-enabling anxiety dimension (D3). The remaining dimension (D1) presents intermediate values that are practically aligned with the sample mean.
3.5. Motivations According to Segmentation
Table 5 and
Table 6 show the T-scores of the scales and dimensions for each category of students, respectively.
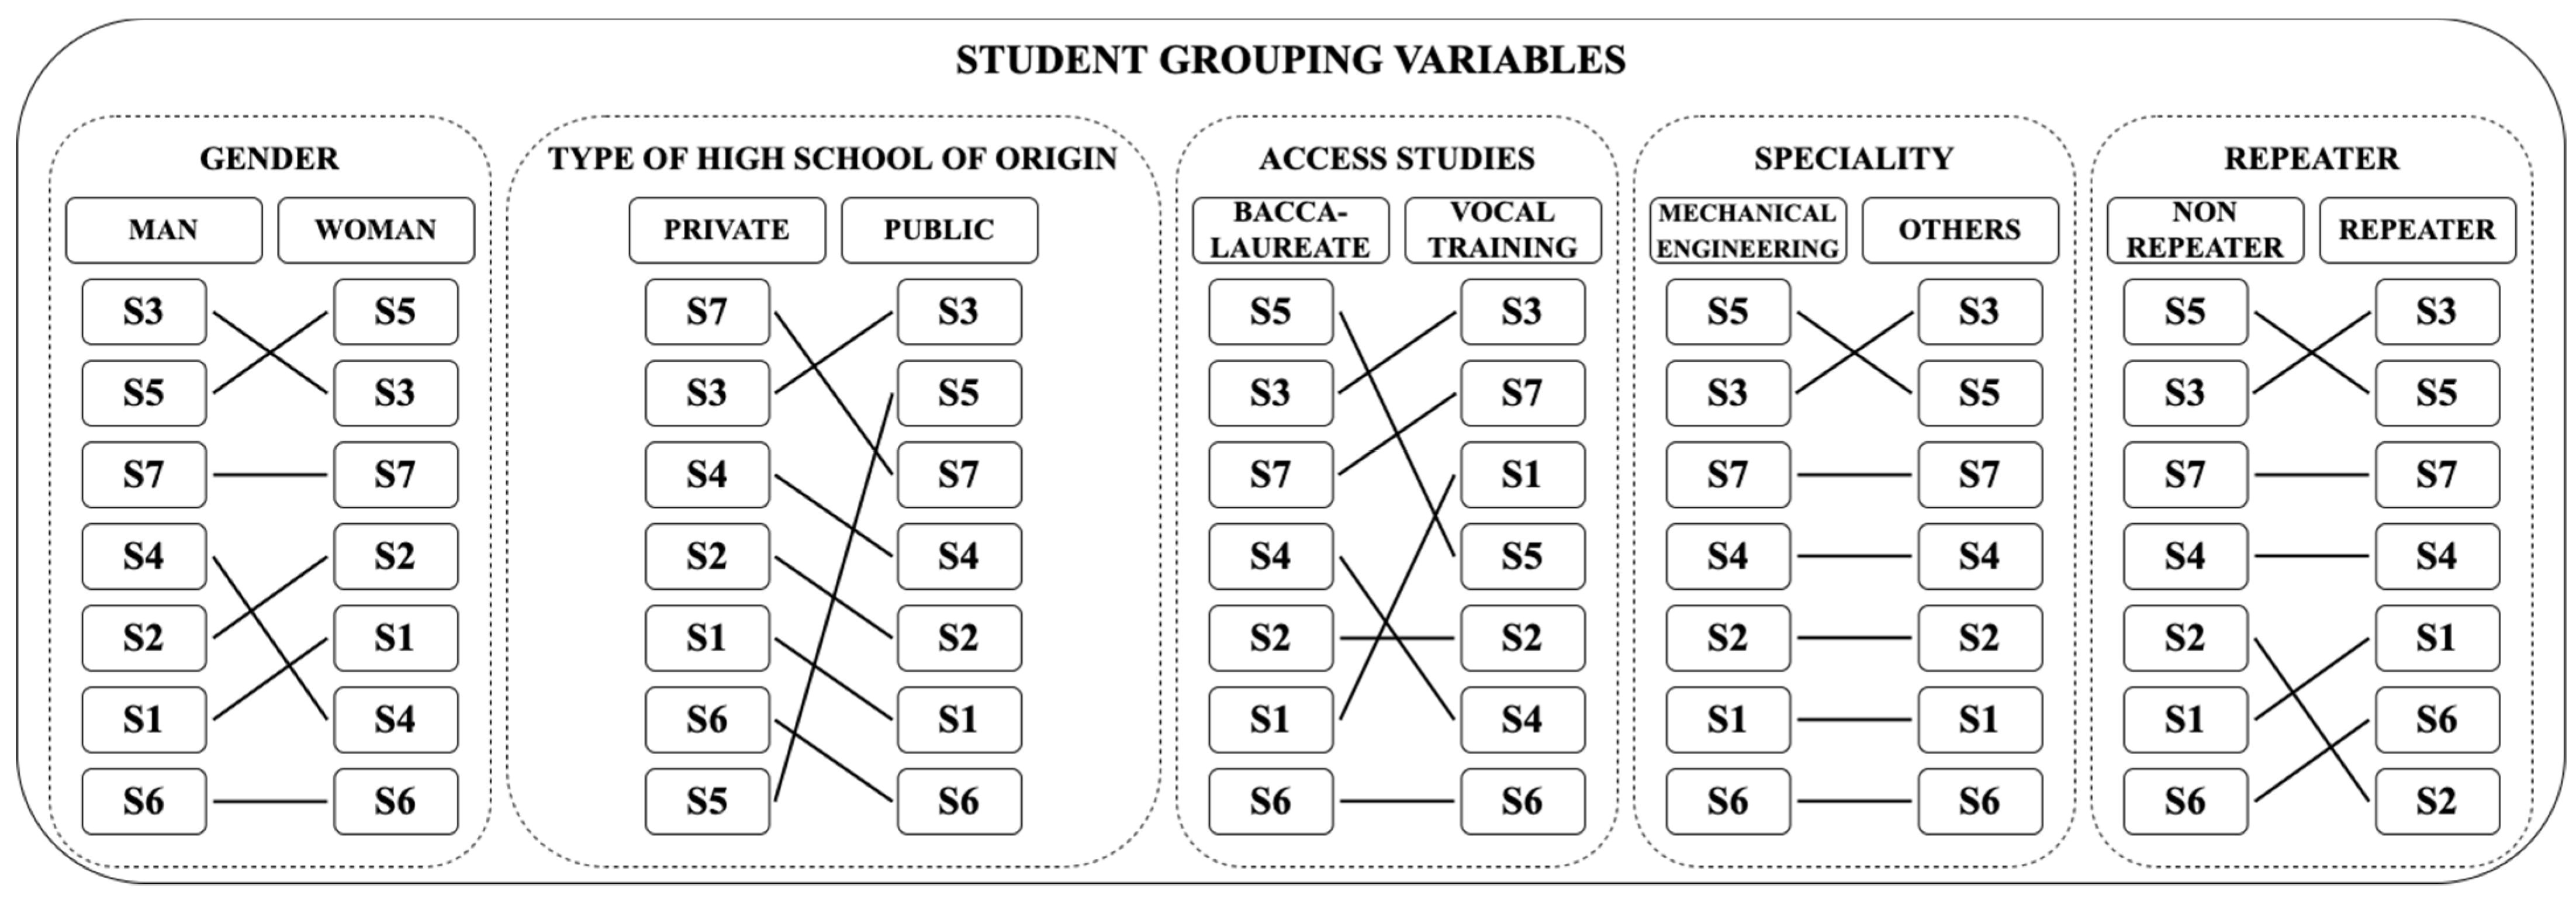
The student’s motivational profile is determined by the order of dominance of the scales and dimensions. Consequently, the results in
Table 5 and
Table 6 were ordered from highest to lowest. For each category, the position of each primary and secondary factor is compared in
Figure 4 and
Figure 5.
By ranking them from highest to lowest score and comparing them with their equivalent, we obtain the predominance of the scales and dimensions for the category of gen-ger, type of high school of origin, access studies, and specialty.
3.5.1. Gender
Men and women only coincide in the position of performance-enabling anxiety (S7), which ranks third (53.89 and 50.54 T-score respectively), and lack of interest in the work and rejecting it (S6), which ranks last (45.70 and 44.00 T-score respectively). Motivation to learn (S3, 55.45 T-score) and willingness to make an effort (S5, 58.67 T-score) rank first in men and in women, respectively. For the second position of both categories, these scales exchange places.
The two groups of studies to access the degree present the same order of prevalence of the dimensions: task motivation (D2, 57.08 and 60–77 T-score respectively), performance-enabling anxiety (D3, 53.75 and 50.31 T-score respectively), and extrinsic motivation (D1, 47.34 and 49.25 T-score respectively).
3.5.2. Type of High School of Origin
Motivation to learn (S3, 56.18 T-score) ranks first among the students who come from public secondary schools, while for the homonymous category it moves to second place. In students coming from private/concerted high schools, performance-enabling anxiety (S7, 58.00 T-score) stands out. Disinterest in work (S6, 45.40 T-score) occupies the last position for public high schools, while in private high schools it is willingness to work hard (S5, 45.00 T-score).
The two groups of studies to access the degree present the same order of prevalence of the dimensions: task motivation (D2, 58.00 and 57.84 T-score), performance-enabling anxiety (D3, 52.75 and 53.46 T-score), and extrinsic motivation (D1, 52.24 and 47.32 T-score).
3.5.3. Access Studies
The two groups coincide in the scale that occupies the last place: lack of interest in the work (S6, 45.31 and 46.25 T-score). But they differ in the most predominant. There, willingness to make an effort (S5, 55.92 T-score) stands out for the students from baccalaureate secondary educations, and motivation to learn (S3, 57.50 T-score) for those from vocational training.
The two groups of studies to access the degree present the same order of prevalence of the dimensions: task motivation (D2, 57.82 and 57.50 T-score), performance-enabling anxiety (D3, 52.82 and 57.00 T-score), and extrinsic motivation (D1, 47.24 and 54.75 T-score).
3.5.4. Specialty
Comparing students from Mechanical Engineering (the largest group) and the rest (Electronic and Automatic Engineering, Electrical Engineering, and Materials Engineering), one sees that they coincide in the three most predominant scales (S3, S7, and S5). The mechanical engineers had poorer scores in S3 (55.31 T-score), but better in S7 (53.69 T-score) and S5 (55.88 T-score) with respect to the other three groups as a whole. The scales ranked second are different between the two specialties. The two categories coincide in lack of interest in the work (S6, 46.19 and 44.59 T-score respectively) being the last scale.
The two groups of studies to access the degree present the same order of prevalence of the dimensions of task motivation (D2, 57.19 and 58.38 T- score), performance-enabling anxiety (D3, 53.69 and 52.50 T-score), and extrinsic motivation (D1, 49.41 and 46.09 T-score).
3.5.5. Repeater
Those who are enrolled in all the subjects corresponding to their year present willingness to make an effort (S5, 57.79 T-score) and motivation to learn (S3, 56.86 T-score) as being the first and second scales, respectively. Repeaters present these same two, but in reverse order (55.29 and 54.29 T-score respectively). The two groups do not coincide in the least predominant scale which is lack of interest in the work (S6, 43.25 T-score) for non-repeaters and the desire for success and recognition (S2, 46.58 T-score) for repeaters.
The order of the dimensions is the same for both groups: task motivation (D2, 60.07 and 56.13 T-score), performance-enabling anxiety (D3, 53.50 and 52.76 T-score), and extrinsic motivation (D1, 49.43 and 46.42 T-score).
4. Discussion
The results in terms of the highest relative mean scores between the scales are very positive. Motivation to learn (S3) stands out as the predominant basic scale and, while fear of failure (S1) stands out as the least predominant.
The dimension that most stands out among the students is task motivation (D2). The least prevalent is performance-enabling anxiety (D3).
Extrinsic motivation is the second dimension with the greatest relative mean score. Perhaps this is due to the desire to improve [
32] or to humans’ inherent eagerness to resolve problems, activities, or issues successfully [
33]. Or perhaps it could be influenced by the current job market, which in most cases struggles to establish incentive systems for its stakeholders [
34,
35].
Analysing the results based on the proposed student grouping variables, one more easily observes the disparity or similarity of the results for each of the related categories [
36,
37]. Thus, for the variable gender, the two categories (man and woman) present similar scores for the different scales, with the willingness to make an effort scale being predominant. In the case of the variable type of high school of origin, the three categories (public, private, concerted) again present very similar values in all the scales except in the case of the willingness to make an effort, in which the private secondary school category presents disparate values that are lower than the rest of the categories. In addition, it is on this scale where the public and concerted categories present their maximum values. The variable access studies again present very similar values for the two related categories (Baccalaureate and Vocational Training) in the different scoring scales, except for the fear of failure scale, where the scores for the Vocational Training category are slightly greater. Lastly, the specialty and repeater variables once again present very similar values in the different motivational scales of the different related categories.
For the motivational scales that were defined and analysed, one observes that the highest scores in practically all the categories of the different variables correspond to the willingness to make an effort. For the dimensions, the highest scores correspond to task motivation, and the lowest to extrinsic motivation. Thus, one observes a mixed reflective-practical learning profile, characterized by meticulous and analytical individuals (reflective profile) who opt for the transmission of knowledge through practical, efficaciously executed methods (practical profile) [
38].
Adnan and Boz-Yaman [
39] studied the learning profile of a total of 102 first-year students of computer engineering and civil engineering based on the variables gender, subject, and previous experience, showing that there exist no significant differences between them. Nonetheless, they did not take into account variables that have been considered in the present research study—the type of high school of origin, access studies, and/or specialty. Paimin et al. [
40] developed questionnaires with which to define the learning profile of engineering students from learning strategy, emotion, conation, and achievement motivation scales. They carried out tests with a total of 207 final year engineering students, obtaining strong correlations between the aforementioned scales. In the present study, the instruments chosen for motivational assessment (MAPE-3) had already been contrasted and validated [
21]. The results of this research is therefore novel in the field of engineering, and are in line with the results of Escat and Romo [
41] in their study of the learning profile of undergraduates with entrepreneurial intentions. However, there are significant differences between the two studies. The present research analyses the learning profile of engineering project students, while Escat and Romo analyse the entrepreneurial spirit of university students of business administration and psychology. Furthermore, in this research, the motivational profile of engineering project students is explored in depth and the learning profile resulting from the study is justified.
Although there are previous studies on the establishment of the learning profile of engineering students, this profile has not been established based on the motivational profile of the students. The present research has determined that the learning profile of engineering students is a mixed reflective-practical profile. This has been done based on the results of a motivational analysis obtained by applying MAPE-3. In addition, a teaching methodology has been selected that is adapted to the motivation and learning of the students.
Previous studies have shown that up to 83% of students present motivational and self-regulated learning characteristics that do not predispose them to a good use of their studies and that are correlated with the low success and efficiency rates of engineering studies in their first years [
15]. Knowing students’ motivation is crucial for an adequate teaching design [
15,
28]. Moreover, in a context in which the COVID-19 pandemic has accelerated the process of the digitization of universities [
42,
43], it is essential to create spaces that personalize the university teaching experience.
4.1. Implications of the Study
Generally, the study provides the instructor with a set of defining characteristics of each type of student they have in class, so that he or she will consequently be able to adapt their teaching method to guarantee maximum academic performance.
The results obtained in this study will make it possible to establish the different learning profiles of engineering project students, increasing the success of the teaching methodologies used and the acquisition of knowledge, skills, and abilities. The evaluation of the learning profile of the students allows the development of training activities that meet their needs and increase their participation and motivation. In addition, it allows for the determination of which methodology or innovative teaching technique is best suited to the learning profile of students in engineering projects.
The learning profile obtained from the study is a mixed reflective-practical profile. This profile includes individuals who are analytical and prefer the practical acquisition of knowledge. This serves to determine the most appropriate teaching methodology. It is recommended to implement and combine Challenge-Based Learning or Project-Based Learning methodologies with the Game Based Learning methodology to create a practical, creative, and fun environment where students cooperate and analyse different solutions to the same problem.
Finally, it is recommended that coordinators use the results obtained when updating and developing teaching plans. These lecturers should develop teaching plans that promote practical learning of basic, general, transversal, and specific competences. In addition, the results are useful for the evaluation of the teaching quality of lecturers in order to analyse whether the teaching provided has been adapted to the learning profile of the students.
4.2. Limitations of the Study
There are many higher education programmes in engineering. However, there is little precedent for assessing the student’s motivational profile. Moreover, the findings of these analyses are highly influenced by the socio-economic and developmental conditions of the region where they are carried out [
44,
45]. In this way, the motivational profile of the individual may be influenced, leading to differences in learning profiles. These two points limit the comparison of results and the development of a common protocol for all higher education institutions. In this sense, the results generated in this study are useful for the degree programme evaluated but are difficult to extrapolate to other training programmes in engineering.
The applicability of the methodology is another limitation, as a large sample size is necessary for the results to be representative. The sample size of this study is significant. However, other higher education institutions may not have the same number of students, so its reproducibility is limited.
5. Conclusions
In this research, a descriptive-exploratory study was carried out to determine the learning profile of engineering projects students through their motivational profile based on five grouping variables (gender, type of high school of origin, access studies, specialty, repeater). Each of these variables was further divided into two or three related categories, for a total of 11 categories.
The method used was based on the consolidated motivational assessment instrument MAPE-3 [
21]. This consists of a set of questions that are based on a series of seven basic scales. These are aligned and grouped together into three motivational dimensions using the McCall-T standardization method [
30], unifying all of the scales in the T-score unit.
The results show a student profile dominated by the dimension task motivation, which encompasses the scales of motivation to learn, willingness to make an effort, and lack of interest in the work. It is characterized by a mixed reflective-practical learning profile, represented by meticulous and analytical individuals whose transmission of knowledge is predominantly practical and effective. In addition, it is a profile that is not closely related to the extrinsic motivation dimension and, therefore, to the scales of fear of failure, desire for success and recognition, and external motivation.
Finally, one can observe that the order of the dimensions is the same in all categories except for those students who come from private secondary schools. These students put performance-enabling anxiety before task motivation, which is ranked first for the rest of the categories.


 ,
, 


