
Post-COVID-19 Transition in University Physics Courses: A Case of Study in a Mexican University


Tecnologico de Monterrey, School of Engineering and Science, México CP 52926, Mexico
†
Current address: Carr. a Lago de Guadalupe km. 3.5, Atizapán, México CP 52926, Mexico.
Educ. Sci. 2022, 12(9), 627; https://0-doi-org.brum.beds.ac.uk/10.3390/educsci12090627
Submission received: 2 August 2022
/
Revised: 23 August 2022
/
Accepted: 23 August 2022
/
Published: 16 September 2022
(This article belongs to the Special Issue Reshaping Higher Education for a Post-COVID-19 World: Lessons Learned and Moving Forward)
Abstract
:The extended confinement imposed by the COVID-19 pandemic lockdowns resulted in the imposition of online education for two years. Many students experienced their transitions to higher educative levels during this time, surely losing some academic learning as a consequence. On the other hand, this context could have promoted different types of competencies, until recently not explored, as a function of students’ personalities or academic profiles. Physics teaching is among those areas which have changed from its traditional methods during this period. The return to school during the ‘New Normal’ has resulted in certain concerns about students’ adaptability due to their possible lack of learning over this time. We analyse, in the current research, the transitions of three generations crossing several pandemic stages during their time participating in university physics courses during the first year, a common entry point for engineering programs. In addition, we analyse several academic traits as causal factors of academic success in order to understand how performance could be affected during online education and during the ‘New Normal’. The results highlight a general high level of adaptation for the most of the students, but still, some of them were affected in terms of the functioning of their learning styles or regarding their personality profiles. Notably, no meaningful losses were detected among the last transition; instead, several interesting aspects were found relating to academic profile appearing to have an effect on the students’ performance during the first transition to online education, and then during the second transition back to face-to-face education in the ‘New Normal’.
1. Introduction
Higher education during the COVID-19 pandemic encountered many disruptions and obstacles that needed to be overcome. These did not occur uniformly in all countries, universities, or programs, nor were they the same for all students and areas of learning. Underneath the generic reality of online education are many aspects that have not been considered. These are not limited to education and predate the period of lockdown. Issues include not only the design and planning of online education, but also the accessibility of resources, appropriate environment, availability of services, discipline for dedication, and the previous non-curricular learning of each student at the pandemic time. Those aspects were intensified during the lockdown period, despite the implementation of student monitoring and large number of new teaching techniques. For many, if not most students, this period will mark education and generations for many years into the future. Some students will have abandoned or truncated their studies due to the lack of inclusion in education; others will suffer from organizational deficiencies in learning for the rest of their lives [1].
On 16 March 2020, forced confinement in schools and most non-essential activities was announced in Mexico. The schools suddenly closed. It took between a week and months for each school and educational level to organize and establish an alternative educative plan. Primary public education was the most affected because of the absence of experience, perspective, and a technological base. In Mexico, the government’s late reaction was implementing a national television education plan that operated for over a year. In contrast, private primary education schools reacted more quickly, implementing existing videoconferencing technologies, usually within two or three weeks. Despite this experience, the average student population had never used such technology for educational purposes [2].
With an evident lack of preparation, the online education system was finally implemented nationwide. However, this happened without essential considerations for this type of education and with poor support or even ignorance about complementary computer applications and methodologies. This was due to a generalized lack of previous and sustained teacher training [3]. In another trend, differences could be seen in higher education, not only in the ability to implement an online teaching system but also in the previous training of teachers. Such teaching methods were more common in private universities. For public ones, the absence of technological culture was an issue for students, although it can be considered that the new generations are more experienced and attached to technology. Another of the most notorious problems was the lack of personal resources, computers, and home internet connection. Moreover, the domestic conditions that enabled students to receive online education were highly diverse, revealing profound differences between private and public higher education in Mexico [4]. The best-adapted sector was private higher education, where teacher training programs have existed for almost two decades [5,6]. A notable contrast in these results in Latin America could be perceived when Mexico was recognized for its national plan of educational implementation during the lockdown period [2].
However, two years later, the return to the ‘New Normal’ in education has become a complex and multi-factorial process in which several issues remain unresolved. The lockdown period has left pending education tasks on top of those already pre-existing. In Mexico, the two-year period has shown a diverse spectrum of situations in the health field and social, political, and behavioral realms [4]. The dismantling of the entire national, institutional, familial, and personal aspects of education has caused a poor and less agile return than the initial establishment of the system. In this context, it is regrettable that the lessons learned and sustained by the health emergency are not being assimilated if they are only being dismantled to return to the old practices and the same pre-pandemic scenario [7]. It could be said that this critical stage has not been worth experiencing and has not taught us anything. It is not yet possible to measure the social changes that the educational disruption of the pandemic has left us globally, nationally, and personally in the long term.
This work sought a comprehensive understanding of students’ behavior in a computer science course at a Mexican university and learning physics at a higher education institution throughout the COVID-19 lockdown. The period studied spanned the pre-pandemic period to the ‘New Normal’. Performances were compared in several sections of each course for several cohorts transiting the confinement period. In addition, an academic categorization for the newest cohort was performed. It transitioned from the COVID-19 confinement with only online courses to the ‘New Normal’ stage with only face-to-face courses. In addition, the transition from high school to university was undertaken entirely under pandemic conditions. The second section presents the context and the related literature preceding this experience. The third section describes the research questions and objectives, the methods utilized, and the data gathering. The outcomes are presented and compared in the fourth section, corresponding to the specific research objectives. The fifth section discusses the outcomes interpreted in light of the teacher experience. Conclusions, opportunities, and future work are presented in the final section.
2. Theoretical Background: Context, Previous Studies, and Possible Success Factors
The COVID-19 lockdown began in Mexico on 16 March 2020. Two years later, education, in general, has not returned to the face-to-face level it previously had, particularly for basic education (primary and secondary) and for a few higher education centers. For the rest of the students, the first half of 2022 has barely established the massive return to the classrooms. During the confinement, many students transitioned into middle, high school, and college education from their previous educational levels, mainly through online-based education [4]. Many of them continued under the same educational scheme after the transition. In 2022, they fully reintegrated into the classrooms, showing the corrective needs in their education, particularly in the hidden curriculum developed previously in the face-to-face teaching modality (this refers to the students’ pre-existing technological skills). The transition to higher education established a set of changes in the hidden curriculum that was critical to acquiring in a limited time [8]. Together, an inevitable induction is due, which possibly was skipped, leading to a series of recommendations for higher education schools [9]. They are usually based on social learning because there are no courses intentionally developing them. In a complementary trend, previous studies have shown that several success factors could be important for students, including their learning styles, personality, inclusivity, and hidden curricula regarding the ability to exploit relevant technology. Rarely were these factors put on the discussion table when emergent educative plans were formulated. In Mexico, several higher education institutions collaborated to establish quality teaching programs to maintain academic continuity [10].
This paper analyzes several contextual dimensions of the COVID-19 period in higher education physics teaching. Previous studies sought to establish, in a general framework, some elements that had a marked influence on the learning process [11]. Here, we seek to contextualize the analysis during the COVID-19 confinement. Some elements were evident during the transition to the ‘New Normal’ and will be present in students’ future education [12]. These must not be forgotten and generate learning for educators, as has happened with every critical stage of human history. We are a species that considers education as a moral value and an intangible good, so it is essential to pay attention, more than ever, to the changes that this transcendental activity may have for us [13]. We have developed much more educational technology in this period than in any other in human history. The technological competencies of students and teachers have gone through a process of development and standardization never seen before. Technology has been with us, but our students adopted it more than ever during this period. In addition, teachers have been exposed to associated learning theories more than ever during the COVID-19 pandemic; thus, learning as collateral social factors affect Education [14].
2.1. Teaching Physics during the COVID-19 Pandemic
The teaching of physics has been diverse throughout human history. The discipline is crucial in any scientific or engineering program in the contemporary era. It commonly involves at least a core theoretical part and an experimental practice. In the COVID-19 confinement, the teaching of this discipline had to overcome the limitations imposed by the circumstances [15], such as limited social learning, absent or limited experimental teaching, and limited contact between students and teachers. All limited and compromised the future competencies of an entire generation in some not-yet-quantified way. At the same time, however, such limitations should be overcome to a lesser or greater extent so new learning experiences can emerge. This work explores these two aspects: the possible losses in face-to-face attendance that online education has left and the opportunities and lessons of this confinement period, which had not existed before this era.
In addition to the overall technology used to forecast and manage online courses, many applications have been deployed to share, deliver, and receive educative materials, integrating services not always included in a unique service. More critical, concrete applications were used to supersede the absence of experimental practices, including simulators and smartphone applications that integrated sensors for straightforward physical measurements to set up experiments [7,16]. Despite the limitations, the effective use of such technologies produced changes in each student, who acquired new competencies to approach the learning of physics concepts. The transition to the ‘New Normal’ has brought a sudden return to the pre-pandemic conditions, putting each student on foreign ground where specific competencies could be missing [17].
Thus, differentiated performance could denote changes in each cohort passing through the several stages of the COVID-19 pandemic (pre-pandemic, confinement, and ‘New Normal’). In each course, different grade components refer to theoretical or experimental aspects whose evolution could be analyzed separately to determine behavioral patterns. Comparisons should be relatively trustworthy if the main activity items are the same or comparable through the periods [15]. Other complementary analyses could be performed based on demographic information about the composition of the cohorts, particularly ones that refer to learning styles, personality, and others. Those aspects are discussed below.
2.2. Physics for Computer Science and Programming Related Programs
For students in programs related to computer science or computing technologies, the teaching of university physics is compulsory, but its training should be guided. For this reason, our university has created an educational model for engineering with broad avenues allowing adapting the curriculum to the needs of each program. The necessary student competencies related to computer science and technology have been identified [18], so their education in physics involves computing simulation more than experimental elements, as typical in other programs. Under such a scheme, our institution outlined an online teaching model during the pandemic to take care of several aspects of each teaching delivery [19].
Each physics course is taught by three teachers covering the subject contents in the course (the main section), a second teacher instructs math, and a third one teaches computing. These latter two sections support and accompany the physics contents. The computing teacher guides the development of an associated simulation project as a challenge-based learning (CBL) activity. The activity is denominated as the challenge. In this report, we analyzed the complete course information in the three sections, but we focused on the teaching experience just considering physics, the traditional course [15,20]. Thus, during the pandemic, the experimental practice that included the simulations could be easily maintained, despite the accompaniment given to the student; otherwise, the collaboration among students could be reduced [21].
In other practical components, teaching was enriched by including electronic notes using an iPad combined with an i-Pencil and Notability. Publishing electronic notes in each class was a didactic practice supporting students. In addition, using a scientific calculator on a smartphone shared on the screen and some other elements easing visualization (such as Mathematica, Matlab, and Desmos) promoted an enriched learning experience (traditionally absent in the pre-pandemic approach, but now inherited in the ‘New Normal’ practice). The complementary series of teaching videos solving additional physics problems was published on the Learning Management System (LMS), commonly used by the institution in the form of a virtual classroom (which is now included in the new face-to-face course version in the ‘New Normal’ period) [7,15]. We wanted to analyze student transitions through the different stages of the COVID-19 pandemic and consider the teacher learning inherited from the online teaching experience. We were interested in the experimental or applied section in those courses because it involves the core component for the future education of those students.
2.3. Changes, Losses, and Gains in Learning Due to the COVID-19 Confinement
Social learning is one of the main aspects that can be affected. The ability of human beings to meet, share, and rely on the transmission of knowledge was naturally diminished, at least during the early stages of the pandemic [21]. Causal factors conditioning learning performance were diverse. For teachers, an analysis of teachers in Spanish-speaking countries revealed that the stress generated by transitioning to online education led to a diminished capacity to successfully exhibit their digital competencies [22], mainly if they were digital immigrants (born after 1980). A similar analysis of Italian teachers at all educative levels showed the same phenomenon [23]. Cultural and behavioral aspects causing differentiated stress based on internal and external factors have also been noted [24]. In addition, a closer analysis of teachers in the Latin American and Caribbean region revealed another critical factor: the level of digitalization, technology, and innovation in the environment [25]. Regarding the previous reports, such factors are two-fold, internal and external factors involving the country and institutional environment and the previous self-development of educative technologies. Thus, a similar behavior could be expected from students worried about the future, education continuity, resources, self-discipline, and others. Still, geographical and economic regions had different responses and strategies to provide academic continuity to their students. The students also experienced stress in maintaining their education, particularly those in higher education, who, normally more independent, could afford such transition by their means, still had to address diverse family, economic, and curriculum factors and environments [26]. In any case, the situation for public and private schools generally lived differently [27].
The cooperation among the natural student study groups was diminished by the sudden change in the learning dynamics. However, many applications to maintain closer contact were a novelty among students and teachers, despite their existence before the pandemic [15]. Thus, the initial perception of this issue would be corrected with the mastery and proper exploitation of technology to bring the students closer. Similarly, collaboration among teachers occurred very early in some cases, when the institutions they belonged to promoted interaction and collaboration by several channels [7]. These support groups increased throughout the lockdown to share and standardize recommendations on technological applications and teaching techniques during online learning.
The differences in the pre-pandemic, confinement, and ‘New Normal’ stages for social learning should be analyzed because online education could diminish such significant interactions. In addition, teachers improved practice to include technologies and spaces in their teaching designs when confinement was extended. The lessons learned using technology (when they became definitively integrated into the teaching profile) have enriched the face-to-face approach during the ‘New Normal’, closing the distance with improved blended learning, thus bridging the online gap existing before the COVID-19 pandemic [28]. Those losses and gains generated by the COVID-19 era have significantly changed the educative scenario. Thus, as a duty, each teacher should evaluate their own experience to enrich their current practice during the ‘New Normal’, correcting those weak academic aspects detected in their students.
Nevertheless, such recovery could not reach all students evenly. Learning styles [29], personality [30,31], and the diversity of teaching approaches and methodologies of the university [32], played essential roles in the differentiated successes of the students before and during the COVID-19 confinement. In addition, during such confinement, students’ digital competencies were crucial to follow online education with proper discipline [33]. Compared with the school practices and profile, those parameters could define an affinity index impacting each student’s academic success [34]. In this sense, a cross-referenced analysis of the pandemic performance based on such students’ categorization using learning styles, personality traits, technological competencies, and perceptions about school inclusivity is in order.
2.4. Teaching and Learning through the COVID-19 Pandemic to the ‘New Normal’ Era
Returning to the face-to-face scenario after two years of confinement and online education, many students opted for engineering programs after high school without having had a due process of transition [9]. They invariably transition to the face-to-face scheme again, including higher courses in physics and mathematics (typically differential and integral calculus). Whether they do it for the first time after their high school education or in continuity with a previous semester still in partial or optional confinement, there are still several aspects to highlight in this transition. First, there was not adequate follow-up in these courses’ inherent abstract reasoning and mathematical writing [35,36]. The ability to solve problems may be diminished [37]. In addition, experimental ability and skills to relate theory and practice, as well as the ability to assemble an experimental setup, the skills needed to gather measurements and analyze data may be absent or superficial [38]. Finally, the ability for social learning and collaboration in physics may be limited [39].
As indicated before, physics teaching brings together several ingredients that must be integrated into each course. For the students involved in the present study, those elements also included the associated computing learning dictated by the institutional model [20]. The ability to understand physical phenomena requires a minimal relationship with the experimental field to achieve the appropriation of physical concepts; this aspect could be tangibly diminished during online education, at least if the space for them was not considered and created. In addition, identifying problems and their quantitative solutions are aspects where mathematical ability, the algebraic handling of physical laws, and the ability to diagram problems and translate them into mathematical and quantitative language concur. Another component is the following in computing, which contributes to the simulation-based learning performed in the form of a challenge inside the entire physics course. Thus, the course in this current report involved four different sections: physics properly, math and computing as scaffolding, and finally, the challenge section to guide the development of the simulation project in the course as the experimental and applied component for Computer Sciences and Programming students [15].
Personalized follow-up may not have been open and available to every student under confinement conditions. It depended on the type of accompaniment and activities sought during online education. Additionally, and as already emphasized, social learning usually plays a supporting role in many students who prefer to learn in pairs than under the assistance of the teacher, so the limitation of forming effective study groups among students under online education must have been limited in contrast to the natural spaces in face-to-face education [3]. All those aspects have a behavioral component previously settled in each student.
2.5. Learning Styles, Personality, School Teaching Strategies, and Previous Technology Competencies as Success Learning Factors in Adapting to the COVID-19 Transitions
Higher education success has been analyzed in terms of several student traits to identify a possible profile for students with positive outcomes in the university. Those traits refer to students’ learning styles, personalities, and previous technological competencies. In another issue, aspects related to school inclusivity expressed as diversity in teaching strategies or teaching styles are also important [40]. Figure 1 summarizes the contextual development of the current research report. While the students’ history has shaped those academic traits, the university profile deliberately scaffolds (or not) for each student. In one sense, the horizontal grey arrows of Figure 1 represent Affinity and Adaptation. They are mutual elements established between each student and the university, even though they are offered (or not) by each institution. Then, in such a scenario, the COVID-19 pandemic introduced new elements affecting academic success through its different stages. In addition, specific requirements were demanded for appropriate education in physics for its student profile.
The COVID-19 pandemic has been a period when education practitioners have attended to some pending issues about knowledge of Education theory regarding the impact on academic success. To a great extent, teachers have become updated in educative technologies, theories, and research reports about online education. Regarding academic success, cognitive learning theory (CGLT) states that learning practices should be designed as a function of the learner’s thinking style [41]. Constructivist learning theory (CNLT) assumes that knowledge is constructed by steps departing from previous knowledge and recent additional experiences [42]. In a more psychological approach, behavioural learning theory (BLT) suggests that learners usually act based on their interactions with their environment and community necessities [43]. From a modern point of view, connective learning theory (CCLT) states that learners are moved into action to learn by the overall connections in their lives: the past, their needs, people, and duties, for example [44]. Then, this diverse theoretical scenario should be attended to state some causal factors for academic success in terms of affinity and adaptation, for the crucial connections shown in Figure 1.
2.5.1. Learning and Teaching Styles Categorization in Higher Education
Learning styles theory is an intended categorization in the approach to retaining information on several scales and channels during the learning process. A series of scales corresponds to a specific learning style model. While learning different concepts, students take several differentiated approaches to shaping the outcomes of their academic performance.
First introduced by Felder [45] in a lean classification, it has been modified diversely to include more concrete approaches to information processing in learning [46]. Classification introduced by Fleming and Mills [29], includes four categories: external/internal (Concrete/Abstract), visual/auditory, sequential/global, and active/reflexive. Sometimes, a fifth dimension could be added, Deductive/Inductive [46]. Thirty-two possible learning style combinations could then comprise each category. Despite this, many are commonly underrepresented in the university population [29].
In our analysis, a learning style assessment was used to examine possible relationships between the learning styles of each student and their performance in physics courses, mainly concerning the cohort transitioning to the ‘New Normal’. Those learning styles could also be identified as teaching styles for the faculty: the ways stated by teachers to deliver the knowledge.
2.5.2. Personality as Academic Traits Identified in Higher Education
Personality traits are symbolic qualities supposedly related to the potential of creating a brand personality which is helpful for competitive differentiation [31]. Drawing on a series of qualitative and quantitative studies based on psychometric scales, those traits, confirmed by statistical correlation, provide particular suggestions about success in higher education [47]. Most common personality types use the Myers–Briggs type indicator (MBTI) to identify the learning preferences of these personality types: external/internal, sensitive/intuitive, thinking/reflexive, or judgement/perception [32]. Again, as for learning styles, many of those personality traits combinations were underrepresented in a university population. Despite this, those personality traits could be remarkable in the adaptive context to learning changes imposed by the COVID-19 era.
2.5.3. Technology Dominion in Hidden Curriculum and Its Impact on the Higher Education Success
COVID-19 has brought fast changes in the learning and teaching formats in higher education. At the same time that teachers tried to adapt themselves to existing and emergent technology, students did the same, thus transitioning first to a completely online model to then slowly returning to combined face-to-face models, possibly retaining several online components [48].
During the COVID-19 pandemic, several education systems worldwide moved to an online format, assuming that users (both teachers and students) had specific technological competencies. Analyses performed on previously acquired technological competencies aimed to examine the relationship of such mastery to the success of online teaching during the crisis [49].
Thus, the COVID-19 pandemic significantly shifted education from a traditional face-to-face to an online format, completely emergent for teachers and students. We were interested in how the success rate of such learning transition was due to skills mastery [50]. Such research could be performed with a mastery scale by typed of technology. For instance, the Digital Competency Framework (EDCF) for Citizens states proficiency levels for a previous technology classification [51]. Such a framework can be applied to teachers and students.
2.5.4. Diversity in Teaching Strategies as a Measure of Inclusivity in Higher Education
The diversity in teaching approaches inside a university implies learning possibilities that match each student’s different abilities. In that sense, such diversity sets a possible measure of inclusivity covering the diversity of learning styles and personalities inside the student population [52].
Inclusivity could be correlated with each student’s actual or perceived performance to set interesting possibilities for each educative system to succeed in its learning task. During the COVID-19 pandemic, identifying the fundamental causes and barriers in learning adaptation became relevant to improving educative systems and revealing the learning impact of individual differences (learning styles, personality, teaching strategies) [53].
2.5.5. Some Considerations on the Reliability of Learning styles and Personality Traits on the MBTI Scale
Despite that Learning Styles theory still has relatively good acceptance from its initial proposal, through time, it has had a natural declination in some black spots where particular weaknesses have been observed. As an interpretative behavioral science, academic psychology defines reliability as the property of obtaining the same outcomes in repeated tests performed under identical conditions. Of course, it is almost impossible, although one can reach a sufficiently good approximation to that ideal under certain conditions. Otherwise, as in social sciences, theories could exhibit temporal validity trends in the newest studies and professional considerations in each field.
Thus, learning styles have been commonly used in teacher training to characterize some didactic methodologies in students’ preferred approaches. Despite not being universally accepted and sometimes considered inaccurate [54], they should be carefully interpreted as ways of interaction between learners, teachers, and content, instead of definitive ways to learn [55]. In the words of Felder [56], they are not strict and invariant student behaviors; instead, they are guides to strengthen the teacher’s practice for certain groups of students and topics. Our primary interest was to include such a concept as a possible causal acting on their academic performance because some of our institution’s initiatives have been based on methodologies and approaches to deliver content intending to emphasize these methodologies. In face-to-face practice, learning activities promote stimuli variation. Despite this, such practice could have diminished under the online learning approach during the confinement. Thus, learning styles still provide a valuable basis to set particular affinity between learners’ and teachers’ actions. The affinity could alter when the teaching media changed in each COVID-19 transition.
Similarly, in the study of personality typology, the MBTI scale suggests how people perceive the world and make decisions. Nevertheless, it has been considered an indicator of the preference for some activities and professional abilities. This last interpretation has developed many detractors criticizing the MBTI scale’s reliability and validity. Based on a previous Carl Jung scale related to psychological types, the MBTI scale is still valuable to track some behavioral traits barely characterizing certain academic conduct (mainly related to the decisions made when we learn) [57]. Such traits are not definitive or universal to each person; instead, they are adaptable for each learning experience (student and content). Despite this, a student can repeatedly show each trait for specific topics (for instance, physics).
So, the current analysis considers the MBTI scale valuable because some personality traits as conditioners of effective learning became notable during teaching. Under controlled and limited conditions, those traits could have an observable correlation [58]. The correlation is mainly observed in groups of concurrent traits, as in the current analysis [57]. Our final interest was establishing a specific characterization of the student population based on observable behavioral categories of particular tendencies affording learning activity. The MBTI scale became more reliable for academic purposes [59].
3. Research Questions and Objectives
The interest of the current research was to analyze how the different stages of the COVID-19 pandemic impacted the teaching of physics under the university’s contemporary educative model, which was implemented in August 2019 [20]. This model intends that each physics course should be accompanied by a couple of teachers in math and computing to scaffold the course basics and the development of the challenge. The beginning generation (class year in the study) was the first cohort under an entirely face-to-face approach before Covid19. Its students completed two courses (Kinematics–Dynamics and Conservation Laws) in Fall 2019. Then, a couple of cohorts followed, the first in the fall of 2020 (AD, August–December) and spring of 2021 (FJ, February-June). The second one occurred in the fall of 2021 and Spring of 2022. Both cohorts completed four courses (Kinematics–Dynamics, Conservation Laws, Electricity, and Electromagnetism). While the first cohort became educated entirely under the face-to-face model, the second and third transitioned into the hybrid and face-to-face approaches in the ‘New Normal’.
Research Questions and Objectives
The current research analyzed how several behavioral, environmental, and academic factors conditioned the educational transitions toward confinement and the physics courses and how the differentiated performance, by course sections and activities, evolved in each cohort during the pandemic’s different periods.
Of particular interest was how the transition from confinement to the ‘New Normal’ was evaluated considering the characterization of the students in each stage. We intended to analyze the relative aspects of each group and then deduce some possible success and failure factors. Thus, for the current report, we established the specific research objectives as follows:
- (1)
- To analyze the computer science students’ outcomes and performances in the physics courses through the several stages of the COVID-19 pandemic.
- (2)
- To compare the student performance in those courses in the several sections and among the cohorts studying the courses to make sense of changes produced by the Covid-19 confinement and online education.
- (3)
- To analyze the students’ perception of the transition for the most recent cohort crossing the confinement period to the ‘New Normal’ period.
- (4)
- To characterize the behavior during the educative transition in terms of several possible academic traits reported in the literature.
4. Materials, Methods, and Data Collection
Table 1 depicts some demographic or temporal issues of each cohort included in the analysis and each course type. It shows the corresponding semester of the program course and the sub-period in which it was taught. For instance, AD2019-1 refers to the first part of the Fall 2019 semester (August to December) because two sequenced courses of physics were offered to each cohort in each period.
4.1. Groups of Analysis, Materials and Methods
The study corresponds to all students in the computer science programs (Robotics and Digital Systems Engineering, Computer Technologies Engineering, and Business Digital Transformation Engineering), starting with the cohort entering 2019. All students enrolled in the introductory physics courses taught in the first year of the university (from fall 2019 to spring 2022) were included, despite some periods missed not taught by the author. They are summarized in Table 1; nevertheless, three existent cohorts were included in most of the physics courses with activities following a similar methodology.
In general, the physics courses in which those students were enrolled corresponded to four blocks in the topics of Kinematics–Dynamics, Conservation Laws, Electricity, and Electromagnetism. The last cohort transitioned to the face-to-face model again one semester after entering the university. Those students completed one semester (Fall 2021) for the courses of Kinematics–Dynamics, and Conservation Laws under online education and their second semester (Spring 2022) for Electricity and Electromagnetism courses under a fully face-to-face model. In addition, detailed performance information was available for all cohorts. The design of activities was broadly similar, although there were slight adaptations in the online model, some of which continued in the new face-to-face version. Each course or block consisted of three sections taught by three teachers: physics (primary), math, and computing. Physics, the most extensive, comprised one-half of the teaching time. It was the physics course itself, while the other two (mathematics and computing) scaffolded the teaching of physics concepts through a computer simulation project (the challenge) associated with each of the three blocks. This expanded the mathematical vision and applicability of the course to related courses studied simultaneously, such as Differential and Integral Calculus (one and several variables) and Programming [15].
To cover the last two objectives in the last cohort, we applied a combined instrument to this group. This demographic survey was developed by combining several documented instruments (see Appendix A). This instrument (questionnaire) combined in independent sections the data collection on learning styles [45,46] (section A) and personality [32,60] (Section B) of each participant. pre-existing technological skills in each student were compiled as a ’hidden curriculum’ [50,51,61], and the students’ perception of the average skills of their teachers, their educational institution, and its characteristic teaching strategies (section C). In addition, it measured each student’s perception of the institution’s preponderant approach to diversifying teaching, comparing the learning styles advanced by the university to theirs [32] (section D). A specific question sought the self-perception of each student about the relevance of their current education in their period of studies to their career (section E).
Those factors had to be assessed to understand student perception during the pandemic and the return to the ‘New Normal’ in education. Sections F and G gathered this information. The correlations were contrasted with the observed performance in the physics courses in the different cohorts and the cohorts in transition under this additional study. Thus, because at least two cohorts went through the same treatment in physics courses, the last one, in transition to the ‘New Normal’ in face-to-face courses, allowing for additional comparisons.
In brief, the instrument evaluated the learning styles on the Fleming and Mills [29] scale and the personality [32] using the MBTI. This instrument included the students’ perception of those dimensions and their assessment in the same sense of the learning styles in their school environment. The instrument also included the self-perception of their mastery of various computing technologies per the EDCF [51] and their teachers’ mastery in the school environment. At the same time, the students assessed the diversity of activities implemented in the institution to vary the teaching strategies. Finally, the second part of the instrument measured the perception of success, adaptation, and preference or quality, first for online education during confinement and then during the return to face-to-face educational activities under the ‘New Normal’.
4.2. Data Collection and Analysis
Data for the first two objectives were obtained from the detailed grades in a weblog. Grades of each activity were gathered but grouped into only two kinds of activities: exams and global grades for each section: physics, math, and computing. For the challenge, we compared it with the global grade for the overall course because there was not a proper examination. Grades were maintained separately for each student to obtain statistical central or dispersion for each sub-period in Table 1 (AD2019-1, 2019-2, etc.). Exams were applied face-to-face during AD2019-1, AD2019-2, and FJ2022-1. In other sub-periods, exams were presented online from a large question bank on each course topic. For the transitional cohort into ‘New Normal’ (that entered AD2021-1 and transitioned to FJ2022-1 entirely to face-to-face teaching), the previously depicted instrument (see Appendix A) was applied to the entire population. Forty-nine of the 57 students answered it (86 %), thus giving overall confidence). Notably, despite the number of students through cohort 3 varying slightly in each course, 53 students common to the three courses were reported. Of them, 48 students responded to the survey (98 % from the fixed population studying the three courses and experiencing the transition to the ‘New Normal’). The survey reported in Appendix A contains, in parentheses, the codification to gather the answers (Co, Ab, …) in sections A and B of the questionnaire. For answers in Section C, a combination of a word (ID, CC, …) and a number denoting the dominion (1, 2, …) were obtained. Section D accounted for each Teaching strategy, summing activities for each one. Answers for section E were open. Finally, for sections F and G, a level in the ordered (but not parametric) scale was obtained from each student (questions Q32 to Q38, except for question Q35, which was open). Responses were analyzed by crossing them with another data series to compare with the next section. Appendix B reports the raw data obtained from the application and the final grade for the physics course during the FJ2022-1 period for cohort 3. In some cases, statistical tests were performed to infer certain observed behaviors. Such analysis is in the Discussion section.
5. Raw Outcomes, Relevant Comparisons, and Factor Analysis
This section reports the synthesized outcomes partially processed from the raw data. We comment only on the evident conclusions derived from the presentation. A deeper discussion involving the outstanding facts is presented in the next section in light of author interpretations and other contextual considerations.
5.1. Comparative Analysis of Performance through Several Stages around COVID-19 Pandemic
First, we analyzed the differentiated grades obtained in each course section (physics, math, computing, and the challenge). Because each section included an exam and other graded learning activities, we differentiated both components. The challenge did not involve an exam, so we paired it with the final grade for the entire course. Thus, Figure 2a–i report for each sub-period the grades by section (computing, physics, math, and the challenge) and on each axis, comparing the exams (horizontal) and the global one (vertical). For each section and type of grade, the comparison between those grades includes horizontal and vertical bars to mark the standard deviation of each group of grades. They are colored in a different gray tone, as indicated in the legends for each section. Nine plots are reported, referring to each sub-period as they were listed in Table 1. Sub-periods are marked in the red labels. They correspond to the following cohorts: First cohort (a,b), Second cohort (c–f), and Third cohort (g–i).
Comparing the plots, we advise that for cohort 1, the exam grades were the lowest in the entire sub-periods and among the cohorts, particularly for the sub-period AD2019-2. This was more dramatic in the computing section than math and slightly different in physics. Nevertheless, the challenge grade was almost maintained in the same range (80–90) as most sub-periods. It impacted the global grades of each section and the final course grade. Despite this, the phenomenon was not uniform among all students, noticeable from the wide dispersion in the grades, indicating that only some students had lower grades in each group of students. We highlight that cohort 1 corresponds to the pre-pandemic face-to-face version of the course, the first version of the institution’s educative model [20]. The challenge grade was uniform for the whole of the students.
For the remaining cohorts, courses, and sub-periods, the grades were almost in the same range, except the exam grades, which were performed online, increased except notably for the last sub-period FJ2022-1. Despite this, the dispersion was significant for the AD2020-2 sub-period in the Conservation Laws course, the corresponding one with AD2019-2, the most variable course in the plot. Such course still exhibited a slight lowering in the grades. Nevertheless, it was not the same for the corresponding course AD2021-1. Another notable aspect was the flattening in the differences in grades for each course after cohort 1. Nevertheless, we note the sudden recurrent dispersion for computing in some sub-periods (AD2020-2, FJ2021-2, and AD2021-1). Such behavior appears to impact the global evaluation for its section. As a rule, grades in the exams were commonly in increasing order for computing, math, and physics. In addition, after cohort 1, we note that Global/Course grades were almost in the same range.
In another view of the outcomes, Figure 3 shows the evolution of grades for each section: (a) challenge versus final grade for the Course; and Exams versus Section grade for (b) math section, (c) physics section, and (d) computing section. Colored dots indicate the outcome for each sub-period in agreement with the color-bar scale (going from the blue dots to the red ones). The ending arrow marks the transition order from the pre-pandemic into ‘New Normal’, going through the different cohorts. Figure 3a–c again highlights the odd behavior of cohort 1 (initial dots in blue).
First, we note the more significant changes in the exams’ grades for the computing section, more stable among cohorts 2 and 3. Modest, similar behavior is observed in the math section. The final grade for each section exhibits similar ranging through the sub-periods. The average grades for the course and each section were maintained in similar ranges throughout the sections (despite the differences in the dispersion noticed for cohort 1 in Figure 2). Interestingly, the exam grades varied only mildly for cohorts 2 and 3. Remarkably, the changes did not revert to the pre-pandemic situation for cohort 3 when it moved to the ‘New Normal’.
These facts suggest that the lower exam grades for cohort 1 are proper for this population, but there is no apparent evidence that face-to-face exams give a different range of grades compared with online exams. At least, there is a different treatment for those face-to-face exams for cohort 3. Against popular belief, another possible explanation could be an improved ability of students to prepare themselves for the exams, inherited from confinement as a positive aspect, gaining this discipline because of the crisis. We will try to find specific evidence on this issue in subsequent analyses. In the next section, we analyze cohort 3 in detail, trying to detect possible facts related to the transition to the ‘New Normal’.
5.2. Demographic Analysis of the Transitional Cohort Based on Learning Styles, Personality, the Hidden Curriculum, and perception of Teaching Strategies
Transitional cohort 3 had high school studies under an online model to a great extent. They arrived in higher education under the same online model in several aspects, with similar flexibility rules, possibly relaxed discipline, and teaching limitations. How did the students in this cohort address the changes required for their academic growth? Which factors produced different academic paths for each student? In the current section, we report the cohort’s behavior in learning styles, personality, technology-hidden curriculum, and perception of their university and academic life. With of the cohort 3 population represented and of the sample taking the three physics courses reported, we gathered an authentic representation of the entire cohort. Then, with their additional self-assessment of the pandemic stage, we intended to identify possible paths and traits for academic success.
5.2.1. Analysis of Learning Styles in the Transitional Cohort
Learning styles are analyzed in five dimensions based on the classification introduced by Fleming and Mills [29]: External/Internal (Concrete/Abstract), Visual/Auditory, Active/Reflexive, Sequential/Global, and adding Deductive/Inductive. The instrument included in Appendix A and partially based on the instrument used by [46] gathered the students’ self-perception and perception of the equivalent average teaching orientation in the university. The raw outcomes were first analyzed by crossing their opinions about their own learning style versus the learning style of the environment. Figure 4 shows the comparisons by dimension. Each quadrant crosses the student learning style versus the perceived orientation of the university (the dispersion of dots in each quadrant is non-meaningful; they only represent the size of the conglomerate.) Percentages in the center of each plot correspond to the part of the sample in each quadrant.
For External/Internal (Concrete/Abstract), most of the students considered themselves Concrete, but the perception of learning orientation was split to a great extent on Abstract (Figure 4a). The same situation holds for Visual/Auditory, with student predominance in Visual (Figure 4b). However, for Deductive/Inductive, the population was divided into both categories, despite most students perceiving predominantly a Deductive orientation for learning in the university (Figure 4c). For Active/Reflexive, most students considered themselves active, despite the university orientation being perceived as equally divided (Figure 4d). Finally, for Sequential/Global, most students perceived themselves as Sequential, and the predominant perception was that the learning style orientation in the university fit them, a common outcome in Engineering programs.
Another view of the global composition of cohort 3 is presented in Figure 5a, representing the frequency of learning style classes effectively as a radar plot. Notably, two classes are predominant: CoViDeAcSe and CoViInAcSe (the short names given in the instrument), with only one dimension split, Deductive/Inductive. More than one-half of the sample fell in those classes. Interestingly, regarding the learning style orientation in the university, the perception was disperse (Figure 5b). Notably, the real student classes in cohort 3 were not the most perceived among the learning styles promoted in the university; they were just moderately represented. Instead, classes CoAuDeReSe, AbViDeAcSe, AbViDeReSe, and AbAuDeAcSe became the most perceived. There, the Abstract, Deductive, and Sequential styles predominated. By comparison, the two first probably disrupted the main learning styles of the students. An Affinity index could be constructed by considering the matching fraction of coincident learning styles of each student with their opinion about the university orientation. We discuss the Affinity index below in the context of academic performance.
5.2.2. Academic Personality Traits for the Transitional Cohort
Certain personality traits have been identified as meaningful in higher education success. MBTI considers the learning preferences of students: external/internal, sensitive/intuitive, thinking/reflexive, or judgement/perception. Using an adaptation of MBTI [32], we included Section B in the instrument of Appendix A to gather the students’ self-perception of those personality traits.
Thus, Figure 5c shows the frequency of personality classes in those dimensions in cohort 3. The main class, InItThJu (using the short names in the instrument of Appendix A), was followed by ExSeThPe, InItThPe, InSeThJu, ExItThJu, and ExSeThJu, comprising more than two-thirds of the sample. Note that predominant traits in cohort 3 were Thinking and Judgement. Below, we report the correlation of each class and trait with academic performance, discussing Figure 5d.
5.2.3. Technology Hidden Curriculum for the Transitional Cohort
A hidden curriculum for each student commonly contains diverse lifelong learning that is practical to scaffold academic performance. It is crucial in higher education, where students prepare for a professional life where success cannot only depend on academic knowledge. Technology is part of that hidden curriculum on several levels in science and engineering. The EDCF classifies technology in five spheres: Search for information and data (ID), Communication and collaboration (CC), Creation of digital content (CD), Computer security (CS), and Troubleshooting (TS). The instrument used in this work gathered in Section C the mastery of each student in five levels (1–5, with 5 the highest) based on self-evaluation. The mastery means are reported in Figure 6a for each of the last technology spheres (solid blue line in the middle), including bands marking minus/plus one standard deviation (red/green or inner/outer dashed lines) to show the dispersion among students. The average evaluation is around 3, denoting an expected value for a student in the Freshman level (Search for information and data the lowest and Computer security the highest, but with the highest dispersion). In fact, technological command was not a concerning issue throughout the confinement, mainly due to the university orientation.
In the same trend, students were asked about their perception of their teachers’ mastery in the identical technology spheres. The outcomes are shown in Figure 6b with the same features as Figure 6a. There is evident similitude, but the teachers’ computer security rating is lower than the students’. This aspect generally reflects that students consider themselves at the same level or higher in technological abilities as their teachers. At this level of mastery, the students surely have sufficient ability to develop online learning.
5.2.4. Variability in Teaching Strategies Perceived by the Transitional Cohort
Diversity in teaching strategies widens the opportunities for diverse learning styles, adapting to the learning trend. It means certain inclusivity in academic life. In the instrument applied, we included in Section D the gathering of perceived practices for several teaching strategies classified as Learning organization (LO), Motivation (MO), Practice or skills development (PR), Effective feedback (FB), Reflection or metacognition (MC), and Social learning (SL) [52]. Practices present in each class add points to an increasing score. Then, average student outcomes are presented in Figure 6c on a scale of 0 to 1 (solid blue line in the middle), with 1 being the highest. The figure also displays bands marking minus/plus one standard deviation (red/green or inner/outer dashed lines) to show the dispersion among students. Such an average is defined as the Inclusivity Index. Learning organization is the highest strategy recognized (≈0.8), possibly due to using an institutional learning management system (LMS). Other teaching strategies are average evaluated on half of the scale (). A uniform evaluation of the teaching strategies suggests a considerable Inclusivity index for cohort 3. Both terms will be considered equivalent in further analysis.
5.3. Performance Analysed by Academic, Curriculum, and Personality Factors
In this section, several analyses were performed correlating learning styles, personality traits, and teaching strategies (sometimes shown as Affinity or Inclusivity indices) versus Online or Face-to-face learning performances and the physics course final grade in the most recent face-to-face course (FJ2022-1). The instrument’s answers in Sections F and G were used for analysis.
The affinity index is defined as the matching fraction between each student’s learning style against the corresponding perceived orientation of learning style in the university (0–1 scale). It indicates the fraction of coincidences between those two indicators. The inclusivity index is first measured by assigning a normalized score for each teaching strategy by adding the selections in Q25-Q30 and then averaging the scores of the six types. In addition, we used the ordered 1–3 scale in Q34 to measure the teaching quality in online instruction (3 is the best quality). The ordered 1–3 scale in Q38 was used to measure the preference for face-to-face learning over online (3 is the higher preference). Adaptation (for online and face-to-face models) is also measured in its own ordered 1–4 scale in Q33 and Q37, respectively (4 represents the highest adaptation).
Online and face-to-face perceived performances (Q32 and Q36, respectively) were measured in the ordered scales 1–6 and 1–5, respectively (6 and 5 representing the highest performances). Finally, the physics course grade was measured on its own 0–100 scale as given to the student.
5.3.1. Minimum Online Performance and Physics Course Final Grade versus Personality Traits
When Online performances (Q32 and Q36) are classified by Personality trait (Figure 5c), they sometimes become statistically multi-modal by trait. Thus, Figure 5d comprises the minimum mode (the worst performance) of each trait in declared Online performance (radial) versus their average physics course performance (final grade, in color agreement with the color-bar below). The final grades had values above 80 except for the ExSeThPe () and InSeThPe () traits. Interestingly, the most frequent traits in cohort 3 indicated higher performance in online learning, matching the course performance. Online performance was lower for a few traits, coinciding with a lower performance in the face-to-face physics course during FJ2022-1 (despite no clear pattern of individual traits). Note that the most frequent trait belongs to this last group (but not to the lowest online learning performance).
5.3.2. Affinity and Inclusivity versus Physics Course Final Grade
In Figure 7, each student in the sample was characterized by Affinity and Inclusivity indices. Slightly horizontal displacements are non-meaningful; they were introduced to differentiate each respondent. Each dot was colored in agreement with the student quartile of the final grade for the entire physics course, indicated in the color-bar below. The dashed line graphically splits the cases with higher Affinity and Inclusivity indices from those with lower ones. Figure 7a shows that the reddest dots with the best performance are mainly located above the line, with middle and lower performances below (green to blue).
Notably, students in the highest quartile usually have both indices high. The opposite is true for some students in the lowest quartile and the lowest indices. Some students in the highest quartile correspond to a higher Affinity index without a clear dependence on the Inclusivity index. It suggests that Inclusivity provides more support to those students who are academically weaker.
5.3.3. Adaptation and Teaching Quality Perceived versus Online Teaching Performance
We first analyzed the online teaching plot thoroughly. Adaptation to online learning during the COVID-19 period within cohort 3 is represented in Figure 8a. It compares Adaptation versus Teaching quality perception during the online learning period under confinement. Each dot represents each student in the sample, colored in agreement with their declared online learning performance (see the color bar below). Slight displacements are non-meaningful again, just distinguishing the conglomerate of students individually. The dashed line divides the highest Adaptation/Teaching quality from the lowest. The highest declared performance corresponds to the highest adaptation and teaching quality. Note that better Adaptation does not necessarily correspond with the recognition of better Teaching quality.
Figure 8b compares Adaptation to face-to-face learning (coming to the ‘New Normal’) versus preference for face-to-face learning over online learning. The color is again assigned in agreement with the face-to-face learning performance declared under the ‘New Normal’. Higher performances correspond with the preference for face-to-face instruction than Adaptation. Again, lower performances correspond with poor Adaptation and preference for the face-to-face model. In general, the performances declared are lower in face-to-face learning than online.
5.3.4. Preference of Instruction and Physics Course Final Grade versus Online and Face-to-Face Performance
Finally, we analyzed the comparison between declared performances in online instruction versus face-to-face instruction. The reader should remember that the scales for each declared performance were different: 1–6 for online performance (to include a terrible performance hardly present in the short period of the face-to-face transition during the ‘New Normal’), and 1–5 for the face-to-face one. Thus, Figure 9a includes in color the preference for the face-to-face model over the online one. The dashed line splits the lower and upper-performance regions. Note that the reddest points (greater preference for face-to-face over the online approach) are located above that line (both best performances). Performance in face-to-face instruction depends intensely on the preference for such a learning model but still not affecting the performance during online instruction. A few students with lower performances in both models preferred online instruction. Students with indistinct preferences still exhibited a better performance in the face-to-face model.
A similar comparison was performed in Figure 9b but is now considering the final grade of the first physics course during the ‘New Normal’ period (in color). Again, the reddest points corresponding to the higher grades are located above the line, corresponding to the best-declared performances in both models. The grades are patently high and not surprisingly correlated with higher performances in both models. The same previous behavior is noticed; a few students had generally lower performance, not depending on the learning model.
6. Discussion in Context and Outstanding Findings
To fulfill the research objectives, at this point, we analyzed the performance behavior through the pandemic stages, cohorts, sections, and sub-periods. We also introduce the Affinity and Adaptation indices to measure specific interactions between the students and the university that possibly supported their academic performance. We still needed to study the meaningfulness of certain notable relations stating possible variations through the pandemic periods. Beyond grade variations observed for cohort 1 and those related to math and computing in some sub-periods, we were particularly interested in the effectiveness of online education in the transition to face-to-face education under the ‘New Normal’.
Thus, finding critical differences through Affinity and Inclusivity indices precisely identified their meaningfulness. Other factors such as Learning styles and Personality should still be bounded. In this section, we discuss findings and outstanding aspects unveiled by the raw results in the previous section or their comparative analysis, particularly those related to the research objectives. Each of the following aspects derived from the raw data, and the immediate comparisons emerged from them:
- (1)
- Meaningful differences in the performances based on sub-periods and course sections.
- (2)
- Meaningful differences in performance as a function of personality traits and learning styles.
- (3)
- Meaningful differences in performance through the online and face-to-face learning periods.
- (4)
- Education preference conditioned the success in online education during COVID-19 confinement.
- (5)
- Academic traits and preferences conditioned the success of the return to face-to-face learning during the ‘New Normal’.
We reanalyze these noteworthy aspects in the following sub-section, discussing their soundness. The discussion is guided by solid data and formal analysis, which is made more profound by the contextual facts of the teachers’ considerations.
6.1. Meaningful Differences in Performances in Course Sections through Sub-Periods
The Figure 2 clearly shows low performance by the first cohort during AD2019-1,2 sub-periods. This time corresponded to a period before the pandemic. In addition, it was the first class entering under the university’s new educative model [20] changing the traditional approach for a physics course. In this new model, called Tec21, the physics course is delivered in two short courses in sub-periods of five weeks each, with content managed independently compared to the traditional course during the entire semester. In addition, the course is delivered by three teachers, two supporting the physics contents. The author remembers this generation’s poor performances in the physics and computing section exams and requiring extended tutoring sessions. Notably, students were not afforded the short time to prepare for examinations, a rare practice in traditional education models having semesters with spaced examinations. It is additionally noteworthy that, cohort 3 students in FJ2022-1, during the ‘New Normal’ already, had face-to-face exams with much better outcomes than their peers in cohort 1 two years before. Still, they came from an online model and transitioned to the ‘New Normal’ (this cohort had its first semester optionally face-to-face, but less than of students attended.) The facts show good adaptation by this third cohort and a different performance level. Thus, the cohort 1 behavior appears to be an outlier behavior rather than an issue related to the educative model or relaxation in grading during the pandemic.
Regarding the sections, there were no notable differences in performances by activity type, apart from the behavior already commented for cohort 1, where the computing section produced the lowest performances, notably in the exams. Exams and activities had an even composition in the global grade of each section (see the vertical scales in the Figure 2 plots), where no notable differences were observed except in cohort 1. There was no unusual behavior in performance differences by sections, except more recurrent computing sections exhibited lower performances. It was not necessarily in exams but in other activities, as observed in the global grades of each section (already noticed in an initial partial study at the beginning of the pandemic [15]). The latter is seen in the variations in Figure 3b. The final grades for the course (reported vertically in the darkest arrows of each plot against the performance for the challenge shown horizontally in those arrows) sometimes were higher than the sections because they included a qualitative evaluation of engineering competencies added or complementary to the section grades.
Another interesting issue is the dispersion of the courses, especially all in cohort 1, an effect of its student composition. Other courses with notably higher dispersion were those in the AD2020-2 and AD2021-1 sub-periods, both delivered online during the COVID-19 pandemic. The AD2020-2 sub-period for cohort 2 contained the Conservation Laws course, which exhibited the lowest performance outcomes and largest dispersion by cohort 1. The AD2021-1 sub-period contained the Kinematics Dynamics course for cohort 3, again the entry point to the Tec21 model but with a mild impact on this cohort. There was still a smooth behavior of the average final grade for each section in the period (see Figure 3a). Initial variations in the observed period could be explained by the adaptation to the complementary sections in math and computing in the physics course, which promoted deep and applied learning (commonly not present in the traditional approach before the Tec21 model). Still, regarding the outcomes, it is difficult to recognize the effect of the pandemic on the performances because the evaluation and examination conditions were changed. This comment also considers the performance observed in the FJ2022-1 sub-period when the conditions practically returned to those similar to AD2019-1,2.
To establish the significant factor differences in the course performances in the sections and sub-periods, we performed a two-way ANOVA test [62,63] considering two different treatments: Course section (challenge, math, physics, computing) and Sub-period (each of the nine sub-periods from the pre-pandemic to ‘New Normal’). The exam grades were used to compare performance in this test, as they introduced the individual performance. The outcome is shown in Table 2. Considering the p-values and the significance used, , both are , denoting the meaningful differences in the performance markedly through the sections and the sub-periods. The outcome shows that differences observed in the graphical analysis had a real substrate far from the natural variability.
Regarding the teachers, the sub-period differences were not due to the COVID-19 crisis but instead to the composition and abilities of students in each cohort, especially cohort 1 with the lowest abilities. Similarly, for the course sections, the differences were due to developing and evaluating different types of competencies, more applied in computing and the challenge, much more theoretical in math, and more complex and sustained in physics. Still, not all students had consistent performance in each section, so the deviation observed in cohort 1 was generated by a biased accumulation of low-performance students.
In addition, to track meaningful differences in the previous performances by groups, pairwise T-tests [62] with a significance of were performed between the groups of each involved factor. By course section, all pairs exhibited meaningful differences with p-values lower than (the sections exhibiting the highest differences were the challenge with math and computing and physics with computing). The analysis by pandemic sub-period exhibited two meaningful differences. The first was among sub-periods 1 and 2 with any other sub-period (with exception between them) due to the outlier outcomes of cohort 1. For this case, all p-values are below of . The second, among sub-period 4 with sub-periods 5 and 6 (same cohort 2, but changing from the Conservation Laws block to the Electricity and Electromagnetism blocks). In addition, between sub-period 5 and sub-period 7 (cohort 2 for Electricity block and cohort 3 for Kinematics–Dynamics block). All the corresponding p-values were below of in those cases.
6.2. Adaptive Success during COVID-19 Confinement and ‘New Normal’
Interesting initial aspects of the composition of the student population for cohort 3 were analyzed through the survey. First, very few combinations of Learning Styles were present (Figure 5). The university orientation was not always focused on such styles (Figure 2), particularly the Internal, Reflexive, and Global styles. This aspect leads to the relatively extended patterns for the Affinity indices in Figure 7. Regarding personality, Figure 5c shows more represented combination traits, and the predominant trait, InItThJu. The variation of learning stimulus through diverse teaching strategies (Figure 6c) mitigated such differences extending the defined Inclusivity index. Our university has a permanent teacher training program on teaching methodologies, educative technologies, and student welfare. Thus, most students exhibit acceptable values in both indices, indicating that the best performance outcomes in the course were located in that region (Figure 7).
Figure 5d exhibits an interesting aspect of the student composition. The traits on the right side of the plot indicate markedly poor online performances during the COVID-19 pandemic (the Introversion trait was the commonest among them). Still, for the most represented trait InItThJu, (although the face-to-face performance in the physics course appears to have recovered but still not to the best performance level), we have insight into the effect of Personality traits on educative performances.
Interestingly, Figure 7 shows the impact on the face-to-face performance of the students in the physics course with low values for both the Affinity and Inclusivity indices (below the dashed line). From the teachers’ observations, students with the lowest grades in the course were characterized by (a) shy behavior, always with some difficulties expressed in previous abilities in physics and/or math, and (b) a bad attitude toward learning physics and/or math (low attention, distraction by other academic activities or interests, a possible belief that class is not necessary because they already understand—incorrectly—the physics contents). These aspects fit with traits such as Introversion, Intuition, and Judgement, commonly present in the engineering profiles, but we note that they are concomitant with other attitudes or previous weak academic achievements. A causal relation is out of the scope of this study; it means traits contribute to other factors generating low performances, or the low performances are directly observed consequences of the traits.
To assess these aspects, we analyzed the significance of Adaptation for cohort 3 (as evaluated from the questionnaire) as a function of Learning styles and Personality traits, each crossed with the Pandemic Stage (Online and Face-to-Face). Note that cohort 3 better represents the average students in the course because it did not have the outliers like cohort 1. Thus, we considered the students’ declared performance in each academic stage (Q33 and Q37) classified by Learning style and Personality trait, one at a time. Then, considering them as treatments, we again performed a respective two-way ANOVA test to check the significant dependence. Outcomes are reported in Table 3 and Table 4.
In Table 3, the treatments based on Learning styles denote a meaningful impact on the declared Adaptation (). Otherwise, that is not true for the transition from the Online to Face-to-face period (). Similarly, Table 4 does not show a meaningful impact on Adaptation from the Personality trait or the Pandemic Stage (Online or Face-to-face), giving p values above the test significance, . Such outcomes finally reflect that some students’ learning styles could impact the perceived level of Adaptation of each one, while Personality does not appear meaningful. This implies the necessity to align the university teaching practices to the students’ profile in this dimension. Figure 7 depicts that students with lower Affinity and lower Inclusivity denoted the lowest performances. Interestingly, Adaptation to the academic approach through the pandemic periods appeared not to be important, at least in the group of students belonging to cohort 3.
6.3. Differences Perceived in Online and Face-to-Face Performances
We analyzed deeper the performance differences during two different periods of instruction, online during confinement and face-to-face during ‘New Normal’. We had feedback regarding cohort 1 before the pandemic. First, Figure 8a,b, compare each with useful indicators involved in each period. In Figure 8a, students declared higher performances during the online instruction, apparently due to teaching quality and their Adaptation, as understood in this work. Still, few students declared lower performances in general, despite lower values for Adaptation and online quality of teaching. Whatever was the causal in the appreciation, there is a notable distinction between two regions with higher and lower indicators. Few students assessed themselves with extreme performances (highest or lowest) for face-to-face instruction during the ‘New Normal’ but most expressed higher/lower middle performances. Nevertheless, the analysis still discriminates that students assessed themselves with better performances when they identified a higher preference for the face-to-face model. Despite being few, lower-performing students still preferred the lower-quality online model. Both responses were not suggested to be correlated during the survey; such students did not have good academic outcomes during the confinement. We come back to this point in the next section. In the teachers’ opinion, some of those students could be identified in the face-to-face class as students with lower grades commonly trying to return to the online approach, particularly during examinations (our institution opened such a possibility if any student declared himself a possible COVID-19 contaminant).
Figure 9a,b, exhibit a comparison of the differentiated performances. Figure 9a compares both performances in the function of preference for the face-to-face model. In any case, students with the highest performances preferred the face-to-face model. Students preferring the online model exhibited better performance in the online scheme. Those outcomes probably result from the corresponding model’s final course outcomes. When exam grades in the physics course were mapped on both performances, most students had higher performances in both models. Students with lower performance in the physics class show had the lowest outcomes in the online model, thus suggesting that the face-to-face model was more effective. In the daily teaching practice, the teacher did not identify a definite preference for the online model, apart from the declaration at the end of the previous paragraph (the declared COVID-19 spread during the examinations increased more than than previous weeks before the examinations).
Otherwise, in the previous section, we found that Learning style had a meaningful impact on the declared Adaptation, but what was the impact of the students’ traits on their declared performance? Again, we analyzed Performance due to student traits through the pandemic periods. Using a two-way ANOVA test again to establish the statistical significance of Learning styles and Personality traits (one at a time) on the declared performance through the pandemic periods (Q32 and Q36), we got the outcomes shown in Table 5 and Table 6. There, both declared performances were previously normalized on a 0–1 scale to be comparable by the test.
In this case, unlike the Adaptation case, only Personality traits appeared to have a meaningful impact on declared performance (). Interestingly, Learning styles had different levels of Adaptation in the academic context, but Personality traits appeared significant for students’ academic success. As observed in the classroom, the learning styles different from those preferred by students resulted in some students feeling excluded and little interested, but they were not conditional aspects of having bad performance in the course; instead, they produced some discomfort in students. Nevertheless, aspects mainly depicted by Personality traits do impact whether those students become integrated or not in learning the course.
6.4. Analysing Multifactorial Success of Online Education
The behavioral responses of students were probed during the pandemic. Although some contents could have been lightened during the COVID-19 period, new competencies were developed. Possibly for the first time, educative theories were put on the table for most educators during the pandemic. Educators modified, tried, experienced, and assessed new approaches for their educative practices.
In the current work, we learned some causal factors such as learning styles or academic personalities that possibly supported the students during the COVID-19 pandemic, the period of online education, and the return to face-to-face courses in the ‘New Normal’. In our case, learning styles were sufficiently identified in the academic practice, thus being addressed. Adaptation was measured by matching students’ learning styles and the corresponding teaching orientation offered by the engineering faculty. Despite a clear tendency to declare the face-to-face approach as preferred by the students, most perceived a solid effort to adapt, particularly within the physics courses. Outstandingly, some performance outcomes in physics of cohort 1 before the pandemic were widely superseded by the following cohorts taking physics during the pandemic and excellently adapting to the face-to-face return during the ‘New Normal’.
6.5. Transition to ‘New Normal’ Period: Characterizing the Students and Their Response
Transitioning to the Tec21 model was difficult for teachers and students, partially changing the focus on learning goals and teaching approaches. During the first cohort period, still in the pre-pandemic stage, dispersed outcomes in several aspects of grades were disturbing. Thus, one year later, the online approach for the same courses became worrisome due to the conditions and limitations, despite one semester of experience already accumulated, shared, and matured among the cloisters’ teachers [7]. Other previous experiences during the first confinement semester had demonstrated a decreased social learning during the first period of the confinement [21], worsening the learning expectation.
Despite the last scenario and context, teaching physics to students in cohort 2 was a pleasant experience, probably because they were students with computer science orientation. The mandatory simulation activities engaged them, thus producing outstanding outcomes [15]. Thus, experimental practice is not necessarily associated with the courses involved (other experimental courses in physics exist) but with the computer simulation challenge. Together, despite online, outcomes in examinations were better than their face-to-face version exhibited in the previous cohort. In their examinations, a large test bank based on the same textbook and class problems was used. Thus, each student examination could be different but have shared questions. Although multiple choice questions were used, students could upload their procedures and argumentation for the entire test. A preliminary thought was that online examinations offered a more user-friendly environment than face-to-face versions. Still, with the same limited development time, the procedures of cohorts 2 and 3 looked much better executed than those of cohort 1. Electronic preparation of the examination report also pressured the students, so the user-friendly context could pale for the students and sometimes was assumed by teachers.
In any case, cohort 3 demonstrated no significant loss in abilities on writing examinations under the face-to-face scheme of the ‘New Normal’. Thus, for the teacher, cohort 1 exhibited a lower profile in physics than cohorts 2 and 3. The teacher’s appreciation is about an excellent level of adaptation in those groups of students for the online approach, which was rich in learning support and resources [15]. Nevertheless, when we analyzed the individual, detailed behavior, we found groups of students who were isolated from academic accompaniment, despite teachers supporting them with additional tools and follow-up actions. In the groups with lower Adaptation or Inclusivity, the teachers identified only a few students during the analysis; not all were evident during the course time. Their previous categorization could have helped identify potential course droppings or failures.
In the survey, students were asked about the Online teaching quality (Q34) and Face-to-face education preference (Q38). We note that if both questions are well evaluated (either poor online education compared to face-to-face preference or rich online education with poor face-to-face preference), they do not indicate their real preference for the face-to-face learning model. Instead, when they are oppositely concordant, it implies a double check in preference for one of the models, face-to-face or online. Thus, to perform such a comparison, we crossed and counted the outcomes of Teaching online quality (Q34) and Face-to-face education preference (Q38). They are represented in Figure 10 (counts are on the vertical axis). In addition, the relative average of declared online performance is reported for each cluster on the top of each bar.
Outstandingly, in cohort 3, no students were evaluating lower models at the time, which in the teacher’s opinion, denoted well-oriented students in the academic terrain. Most students were divided, with a comparable online performance above the average (scale 1–6). The first group with an Online average performance of 4.8 (red) were the students who preferred the Face-to-face model, despite being well-adapted to the online model. The second one, with an Online average performance of 4.6 (orange), comprised students well adapted to any model (online or face-to-face). A third dominating group (4.8 in Online average performance in blue) preferred the face-to-face model but became well-adapted to the online one. A minority group of students preferred the online model; possibly, they had good outcomes in such a model (gray). Such facts reflect the preference for the face-to-face model but also show a healthy level of Adaptation to the online model.
6.6. Teaching Physics for Computer Science Students through the COVID-19 Stages: A Summary
In practice, teaching physics is a multi-factor experience for complete success. It depends on the previous technical skills and interests of students. During the pandemic stages, with the implementation of the new educative model, teacher adaptation required a swift response during the first months of the confinement in terms of strategies, tools, technology, and accompaniment schemes. As mentioned, for computer science students, with differentiated learning programs and plans, the orientation to computer physics simulations as a challenge helped the online learning approach. Computer simulation alternative to the experimental practice engaged the students outstandingly during the period, boosting the social learning above the previous experiences reported in other courses [21], despite being oriented to simulation.
In a more traditional trend, the theoretical approach to physics was sustained using prepared computer simulations, smartphones as measurement devices, automatic electronic notes, multimedia materials, and a friendly design on the LMS in the form of a virtual classroom. However, still, such a traditional main component of the course became more meaningful due to its quick application in the applied simulations. Those simulations involved a volcano, a roller coaster, and the earth’s magnetic field, making the physics course valuable and visual.
Several practices were adopted during the ‘New Normal’ from the pandemic and online period. These included using Matlab and Mathematica software to address project simulations (not standard in physics despite being adopted due to Tec21 and mainly due to the pandemic) and the use of public electronic notes using an iPad, i-Pencil, and Notability (currently, Blackboard is no longer used in the class). Notably, although students were encouraged to take notes, they found the teacher’s notes helpful as references. During the ‘New Normal’, around of students used iPad to take notes in class. It is an interestingly positive phenomenon because such technology has promoted the practice of taking notes again; before the two years of the pandemic, students used to take pictures of the blackboard. In addition, applications such as Verbe, Socrative, and Desmos, to promote social learning in class activities, and smartphones as measurement devices, have definitively changed the face-to-face approach [7].
The current analysis shows that some student traits, not just learning styles that comprise a common approach but also academic personality and the school’s characterization of teaching strategies, naturally boost students’ engagement and possible performance improvement. Besides the overall analysis and learning about strategies and outcomes in teaching physics during the COVID-19 pandemic, another outstanding observation is the teachers’ self-analysis of their entire teaching practice throughout the time. The self-assessment allowed the understanding of other elements present in teaching together and possible performance improvement strategies.
7. Conclusions
Physics education is typical in the core of engineering programs. This discipline gave a two-fold value to the students involved in the current research. For students to be oriented to robotics, this discipline was the basis for other technical courses related to mechanical engineering or electronics. Physics is a learning lab to integrate math and computing through precise rules to practice programming related to computer simulations, data science, or computer interfaces for students mainly oriented to Computer Sciences. Still, not all students can comprehend that the scope of those courses is relevant to their academic engineering program. Considering question Q31, only of students felt this course was an essential part of their program (considering it represents almost one-half of their course time). The orientation of the Tec21 model promotes in those courses this deliberated approach. The current analysis mainly centered on the effective integration of face-to-face education in the ‘New Normal’ and online education’s positive or negative impact during the extended two-year period of the COVID-19 pandemic. We intended to analyze the behavioral transition based on psychological issues such as Learning styles and Academic personality recognized in Education literature as causal factors in the success of university studies. In addition, the hidden curriculum, particularly that related to technological mastery, helped understand the scope of this educative period widely dominated by technology but invisibly related to personality. Our analysis centered on the academic performance declared and observed during the physics course as an entry point of engineering programs. In addition, Adaptation was considered a crucial factor in success and transition. Finally, the recognition of online teaching quality and the preference for each type of educative approach were at the core of the analysis for different groups crossing the initial period in the university, but also directly associated with our primary interest: physics learning and teaching.
Clearly, additional limitations for the current analysis regard university orientation as essential support in terms of facilities and teacher training. In addition, engineering and science students and teachers are commonly more technology-oriented to enable the transition to online education. Still, experiences throughout the country are generally diverse because each government and institution set different strategies in the regional scenario to overcome the educative crisis [26,27].
7.1. Lessons through the Pandemic: Losses, Gains, and Challenges
Through three cohorts, we compared several sub-periods of a university physics course that passed through the several stages of the COVID-19 pandemic: pre-pandemic period, confinement, and the beginning of the ‘New Normal’. Analyzing almost the entire student population, we observed different variations, possibly due to the students’ group composition and type of education (online or face-to-face). All courses were delivered with practically the same activities and structure, making them widely comparable.
Due to outlier behavior in the first cohort of students, we did not find significant differences in performance for online education during the pandemic; instead, those students exhibited a higher level of adaptation. Dispersion and averages observed in the direct performances on the course grades could be more associated with the group composition than other causal factors. For the transition cohort (cohort 3) in ‘New Normal’, significant deviations in performance were not detected per the type of education received (online or face-to-face).
In cohort 3 (where all students were enrolled at the university during the confinement, question Q35), we detected a few Learning styles and Personality traits possibly representative of engineering students related to Computer Science. Course performance for several Personality traits appeared below the others, particularly those corresponding to introverted students. Among them, personality traits appeared to be a significant factor in deciding performance. In another trend, Learning style exhibited a more meaningful correlation with declared Adaptation (lower for online education).
The hidden curriculum of prior technology mastery is acceptable and uniform for students in the first year of university, possibly aligned with the university profile where the faculty is perceived technologically competent by students. Thus, it was not a critical causal factor of failure in the online education introduced. Notably, students declaring a higher level of affinity and inclusivity with the university had higher performance in the physics courses during the confinement period. In addition, there was a correlation between adaptability and the declared performance in the confinement period and the ‘New Normal’ one. Students declaring good performance commonly had a high opinion about the teaching quality received online; nevertheless, it was not their preferred way of instruction.
Students declaring good performance commonly showed higher levels of adaptation, performance, and recognition of teaching quality (both online and face-to-face). On the other hand, students declaring low performance or physics course grades tended to have a lower assessment of the university’s efforts during the confinement education and the ‘New Normal’. Other performance differences were meaningfully associated with the graded section (physics, math, computing, or challenge). Such differences among sections significantly influenced the physics course (exams) performance through the different sub-periods.
Although a statistically significant preference for the face-to-face approach was found, we identified high adaptation among the students and part of declared performance through the direct grades analysis of the analyzed cohorts. The main clusters formed were split between: (a) a strong preference for face-to-face education or (b) recognition of the value of both models. The students in the research almost comprised of the students in the target population, namely, the students in computer science and computing-related programs. Their level of adaptation completely masked possible differences in the performance induced by the changes in the educational context. The generation of children and adolescents crossing such a period has been called a Lost Generation [64] regarding health, well-being, and education. It could be an exaggerated label for the group of students considered in the current research. What must be considered is the broader care promoted by the institution, years of previous teacher training in educational technology, and educative methodologies. This past and ongoing investment by the university could have resulted in reasonable outcomes in the unexpected COVID-19 pandemic. The author believes it is not the unique explanation; in the end, the human spirit of most students effectively responded and was contextually supported by the establishment. Unfortunately, not all students worldwide had this advantage [65]; the global experience was negative.
7.2. Recommendations for the Practice
As teachers, the COVID-19 pandemic should show us that teacher training is essential for the success of Education. Otherwise, educative technologies arrive in our lives, remain, develop, and effectively become included in our teaching practices. Hybrid learning should be more common as a valuable model to diversify the educative channels in our lives, mainly because it is the recommended channel to be used for training in future professional life [66].
The attention paid and knowledge acquired by teachers during the COVID-19 pandemic about theories and methodologies of education, particularly in higher education where it is not a common practice, has changed how teachers perceive and practice their profession. The necessity for a self or institutional assessment is another inherited aspect that should be remarked on for effective changes and impact on learning. Thus, teachers must follow this practice to improve their teaching and comprehend each student’s educative phenomenon.
7.3. Future Work ad Final Remarks
Despite us possibly (and hopefully) not having another period to prove the advantages of online education and its improvement on a large scale, we must recognize that this period improved teacher training in educative technologies and active methodologies to make a difference in the sustainability and continuity of education. Another significant silent difference is the personal assessment each teacher should perform at the end of each course to improve it, which naturally became a common practice through the pandemic stages.
Thus, it is required that teacher training be boosted, together with institutional and governmental promotion and recognition pursued worldwide. Exciting and valuable future work would account for how extended this practice was, mainly because of the perceived success of education through this crisis. In other additional and more sophisticated trends, the previous analysis and categorization of our students in terms of their learning styles and academic personalities could become helpful in providing closer support to the entire student population. That practice and research should be future work, not requiring a crisis, but rather for more advanced knowledge about the success factors in higher education.
Funding
This research received no external funding.
Institutional Review Board Statement
Ethical review and approval were waived for this study because any individual information or behavior concerning human involvement is being reported.
Informed Consent Statement
Patient consent was waived due to no individual or identifiable information or data being reported in the article.
Data Availability Statement
Data sets were obtained about sensitive individual grades of students from institutional and author records, then processed, losing their individual character for the statistical report. They are partially available upon request to the authors.
Acknowledgments
In Memoriam of Ernestina Zepeda-Trujillo, who passed away at the end of the pandemic era, who in her entire life showed a decided devotion to learning and discipline, two highlighted values during this complex era for humankind. I am grateful to all my students in Tecnologico de Monterrey for their dedication from March 2020 to June 2022 during the COVID-19 lockdown and ‘New Normal’. Their participation contributed to improving the knowledge and the advancement of BL as a sound educative strategy during this critical era. The author also acknowledges the technical and financial support of Writing Lab, Institute for the Future of Education, Tecnologico de Monterrey, Mexico, in the production of this work.
Conflicts of Interest
The author declare no conflict of interest.
Abbreviations
The following abbreviations are used in this manuscript:
| BLT | Behavioural Learning Theory |
| CBL | Challenge-Based Learning |
| CCLT | Connective Learning Theory |
| CGLT | Cognitive Learning Theory |
| CNLT | Constructivist Learning Theory |
| EDCF | European Digital Competence Framework |
| LMS | Learning Management System |
| MBTI | Myers–Briggs Type Indicator |
Appendix A. Higher Education Transition into ‘New Normal’
The textual representation of the questionnaire was applied online to students to gather facts about learning styles, personality, school perception, technological competencies, and personal challenges from the COVID-19 pandemic and the ‘New Normal’ in Education. Each question was labeled with a reference code in the form Qx, x being the data entry number. Scale numbers included in each response item are used in the text to show the outcomes. Symbol +0.5 implies adding 0.5 to the score of each option selected in questions from Q25 through Q30. These Code labels for questions and Scale numbers are used to report the raw outcomes in Table A1.
HIGHER EDUCATION TRANSITION INTO ‘New Normal’
The objective of this questionnaire is to analyze the impact of COVID-19 confinement on higher education. The first part consists of 5 sections categorizing each student. The second part contains questions evaluating the confinement period and the return to face-to-face teaching during the ‘New Normal’.
Next, we ask you to answer the best option in a series of categorizations defining your most common way of approaching learning.
- (A)
- Teaching and learning styles
- (A.1)
- Categorization of your learning styleIt is believed that each person learns differently through certain stimuli, privileging particular approaches. None are good or bad; they are just how we like to do it.
- (Q1)
- What kind of information do you preferentially perceive when learning?
- 1
- External (Co): visions, sounds, physical sensations
- 2
- Internal (Ab): possibilities, hunches, intuitions
- (Q2)
- Through what sensory channel do you commonly perceive external information during learning?
- 1
- Visual (Vi): photographs, diagrams, graphs, experimental demonstrations
- 2
- Auditory (Au): words, sounds
- (Q3)
- When learning, what kind of information organization makes you feel most comfortable?
- 1
- Deductive (De): principles given, to deduce consequences and applications
- 2
- Inductive (In): facts and observations given, to infer principles
- (Q4)
- How do you prefer to process the information?
- 1
- Actively (Ac): by including in a physical activity or discussion
- 2
- Reflexive (Re): through introspection and abstraction
- (Q5)
- How do you progress towards the understanding a learning topic?
- 1
- Sequentially (Se): in small continuous and structured steps
- 2
- Globally (Gl): in leaps and bounds, suddenly towards the whole
- (A.2)
- Categorization of the teaching environmentHigher education and academic disciplines can privilege certain teaching styles that fit your learning experience to a lesser or greater degree.
- (Q6)
- In your current education, what kind of information is mainly emphasized by your teachers?
- 1
- Concrete (Co): based on facts
- 2
- Abstract (Ab): based on concepts or theories
- (Q7)
- What type of presentation of information is most common in your classes?
- 1
- Visual (Vi): photographs, diagrams, films, experimental demonstrations
- 2
- Verbal (Au): presentations, readings, discussions
- (Q8)
- How is the information organized in most of your classes?
- 1
- Inductively (In): phenomena guide learned principles
- 2
- Deductively (De): principles guide the learned phenomena
- (Q9)
- What kind of participation is promoted in most of your classes?
- 1
- Active (Ac): students talk, participate, and reflect
- 2
- Passive (Re): students see and hear
- (Q10)
- What kind of perspective is primarily provided by the information presented?
- 1
- Sequential (Se): step by step as a methodological procedure
- 2
- Global (Gl): the global context and its relevance are initially given
- (B)
- Personality
- (B.1)
- Categorization of your personalityIt is believed that certain personality traits can facilitate insertion and success in university life. The following statements are generic; they are how you approach certain aspects of your life in different situations.
- (Q11)
- What is your fanciful world?
- 1
- Extroversion (Ex): you focus on your external world
- 2
- Introversion (In): you focus on your inner world
- (Q12)
- What information do you privilege?
- 1
- Sensitive (Se): the basic information that comes from the outside
- 2
- Intuitive (It): the meanings and interpretation you generate of the information
- (Q13)
- How do you usually make decisions?
- 1
- Thinking (Th): based on logic and consistency
- 2
- Feeling (Fe): based on people’s opinion or special circumstances
- (Q14)
- When dealing with the outside world, how do you prefer to act?
- 1
- Judgment (Ju): based on consistent and final decisions
- 2
- Perception (Pe): being willing to change based on new information and choices
- (C)
- Technological competencesDifferent digital and computing technologies are classified. Read the statement to understand each one, and then evaluate your proficiency level in the following questions as accurately as possible.
- (i)
- Search for information and data (ID)It uses browsers and information search engines through keywords, information discrimination, and source validation. Likewise, to obtain specific data from public sources.Software examples: browsers, consultation of information bases and their download, precise search for specific information in viable sources.
- (ii)
- Communication and collaboration (CC)It refers to using applications to work and collaborate in groups creating solutions, content, or learning.Software examples: Word, Excel, Power Point, Canvas, Social networks, Zoom, Google docs.
- (iii)
- Creation of digital content (CD)It concerns the creation of web pages or associated materials published in an open or restricted form through servers, drives, and databases. These materials establish curated documents that have a communication or learning purpose.Software examples: Weebly, Word Press, Google Drive, Dropbox, and Applications to generate interactive activities.
- (iv)
- Computer security (CS)It refers to the operational mastery of computer security in terms of comprehensive password and privacy management, discrimination of information, and insecure access, management, and use of antivirus.Software examples: Antivirus, Multi-factor security in public applications, Privacy management.
- (v)
- Troubleshooting (TS)It concerns using specific software to handle information, processing it, and obtaining useful and analyzed information to solve technical problems.Software examples: Programming languages, specialized packaging (Matlab, Mathematica, PSpice, Catia, CAD, Programming languages.
- (C.1)
- Inventory of your level of proficiency in computer technologiesThen, the following domain levels are established for each dominion from lowest to highest.
- 1
- I identify concepts and strategies that would allow me to include this type of technology in classes
- 2
- I have the skills that would allow me to include these technologies in class.
- 3
- I can advise my classmates on the use of these technologies in class
- 4
- I am normally motivated to use this group of technologies in my class
- 5
- I think this type of technology is very significant in class, and I commonly use it
- Select for each one just the domain level (mastery) you consider you have in each group.
Domain & Level (Q15) ID (Q16) DC (Q17) CC (Q18) CS (Q19) TS 1 ◯ ◯ ◯ ◯ ◯ 2 ◯ ◯ ◯ ◯ ◯ 3 ◯ ◯ ◯ ◯ ◯ 4 ◯ ◯ ◯ ◯ ◯ 5 ◯ ◯ ◯ ◯ ◯
- (C.2)
- Inventory on the technological domain of your professors and institution
- Based on your general perception, evaluate the previous competencies for the institutional knowledge and your teachers in the same dominion levels used for you.
Domain & Level (Q20) ID (Q21) DC (Q22) CC (Q23) CS (Q24) TS 1 ◯ ◯ ◯ ◯ ◯ 2 ◯ ◯ ◯ ◯ ◯ 3 ◯ ◯ ◯ ◯ ◯ 4 ◯ ◯ ◯ ◯ ◯ 5 ◯ ◯ ◯ ◯ ◯
- (D)
- Teaching strategies
- An institution should promote strategies to diversify learning regarding organization, motivation, skills development, effective feedback, and reflection. It is crucial in the development of each student. Indicate which of the following practices are common and present in your institution. Select all those that apply.
(Q25) Learning organization Selection +0.5 A public study program is established □ +0.5 Study notes are provided □ (Q26) Motivation Selection +0.5 Discussion is promoted and reinforced about the value of learning □ +0.5 Examples of procedural contents are developed □ (Q27) Practice Selection +0.5 Tests are applied feed-backing to the student □ +0.5 Student is motivated to attend counseling individually □ +0.5 Procedural practice is promoted in small groups through some □ didactic technique +0.5 An applied project is included to be developed from the contents, □ but it includes other related learning or already dominated by the student (Q28) Feedback Selection +0.5 Homework feedback to students □ +0.5 Students receive recommendations in their participation or □ presentations (Q29) Metacognition Selection +0.5 Spaces for reflection are established in class □ +0.5 Self-assessment is promoted □ (Q30) Social learning Selection +0.5 Promotes social learning between activities with peers □ +0.5 Graded team activities are established □
- (E)
- Question about personal academic location
- (Q31)
- Currently, do you consider yourself already in the main line of learning about your career development?
- 1
- Yes, I am already studying subjects related to my career
- 2
- No, most of them are still basic and support courses corresponding to the common core
- (F)
- Academic stage during the COVID-19 confinement
- (Q32)
- Performance in the online teaching model: Which of the following phrases best describes your academic self-assessment during the lockdown period?
- 1
- I failed more than three courses due to poor performance
- 2
- I failed at least one course due to poor performance
- 3
- I dropped out at least one course due to poor performance in the same course
- 4
- I passed all my courses, but I estimate that I was below the average performance of my classmates
- 5
- I passed all my courses and I estimate that I was above the average performance of my classmates without being from the group with the best dominion of the contents
- 6
- I passed all my courses, and I consider that I was in the top of the students with the highest performance in most of them
- (Q33)
- Adaptation to online teaching model: Which of the following phrases best describes your adaptation self-assessment during the lockdown period?
- 1
- I was never able to adapt to online courses and had difficulty tracking activities and content proficiency
- 2
- I adapted to online courses, but I always felt lagging the performance I observed in my peers.
- 3
- I adapted well to online courses and felt as competent as most of my peers
- 4
- I adapted well to online courses and was normally from the most competent group of students in my courses
- (Q34)
- Teaching quality of online courses. During the period of confinement, which of the following phrases best describes your assessment of the teaching received?
- 1
- Most of the online classes were monotonous and without no variation of stimulus from one to the other.
- 2
- I had several outstanding online classes that varied the activities carried out, with what I think I could learn better.
- 3
- Most of my online classes had varied stimuli, making them attractive and allowing me to learn better.
- (Q35)
- I made the transition from high school to university during the period of confinement
- 1
- Yes
- 2
- No
- (G)
- Face-to-face academic stage after confinement
- (Q36)
- During the back-to-school period, which of the following phrases best describes your academic self-assessment?
- 1
- I have already dropped out of at least one course due to poor performance
- 2
- I failed at least one course due to poor performance
- 3
- I have passed all my courses so far, but I estimate that I have been below the average performance of my classmates.
- 4
- I have passed all my courses so far, and I estimate that I have been above the average performance of my classmates without being from the group with the best dominion of the contents
- 5
- I passed all my courses and I consider that I in the top 25% of the students with the highest performance in most of them
- (Q37)
- During the back-to-school period, which of the following phrases best describes your adaptation self-assessment?
- 1
- I have not been able to adapt to the face-to-face courses and I had difficulty monitoring activities and content mastery
- 2
- I adapted to the face-to-face courses, but I always felt lagging in relation to the performance I observed in my classmates
- 3
- I adapted well to the face-to-face courses and felt as competent as most of my peers
- 4
- I adapted well to face-to-face courses and was normally from the most competent group of students in my courses.
- (Q38)
- Comparing your online classes with your face-to-face classes, which of the following phrases best describes your assessment of the teaching received?
- 1
- Online classes have more advantages over the classes I receive in person to facilitate my learning
- 2
- Both classes, although of a different nature, have elements that facilitate my learning.
- 3
- Face-to-face classes have more advantages over classes I received online to facilitate my learning
The questionnaire is over. We appreciate your participation in enriching the knowledge about higher education’s effectiveness.
Appendix B. Raw Data Obtained in the Questionnaire Application Together with Physics Course Grades
This section includes the raw data gathered for the current analysis in the questionnaire using the Code labels and Scale numbers reported in Appendix A. Column ID is a non-meaningful number identifying each student. The column labeled Grade reports the final grade in the physics course FJ2022-1 for cohort 3 being surveyed.

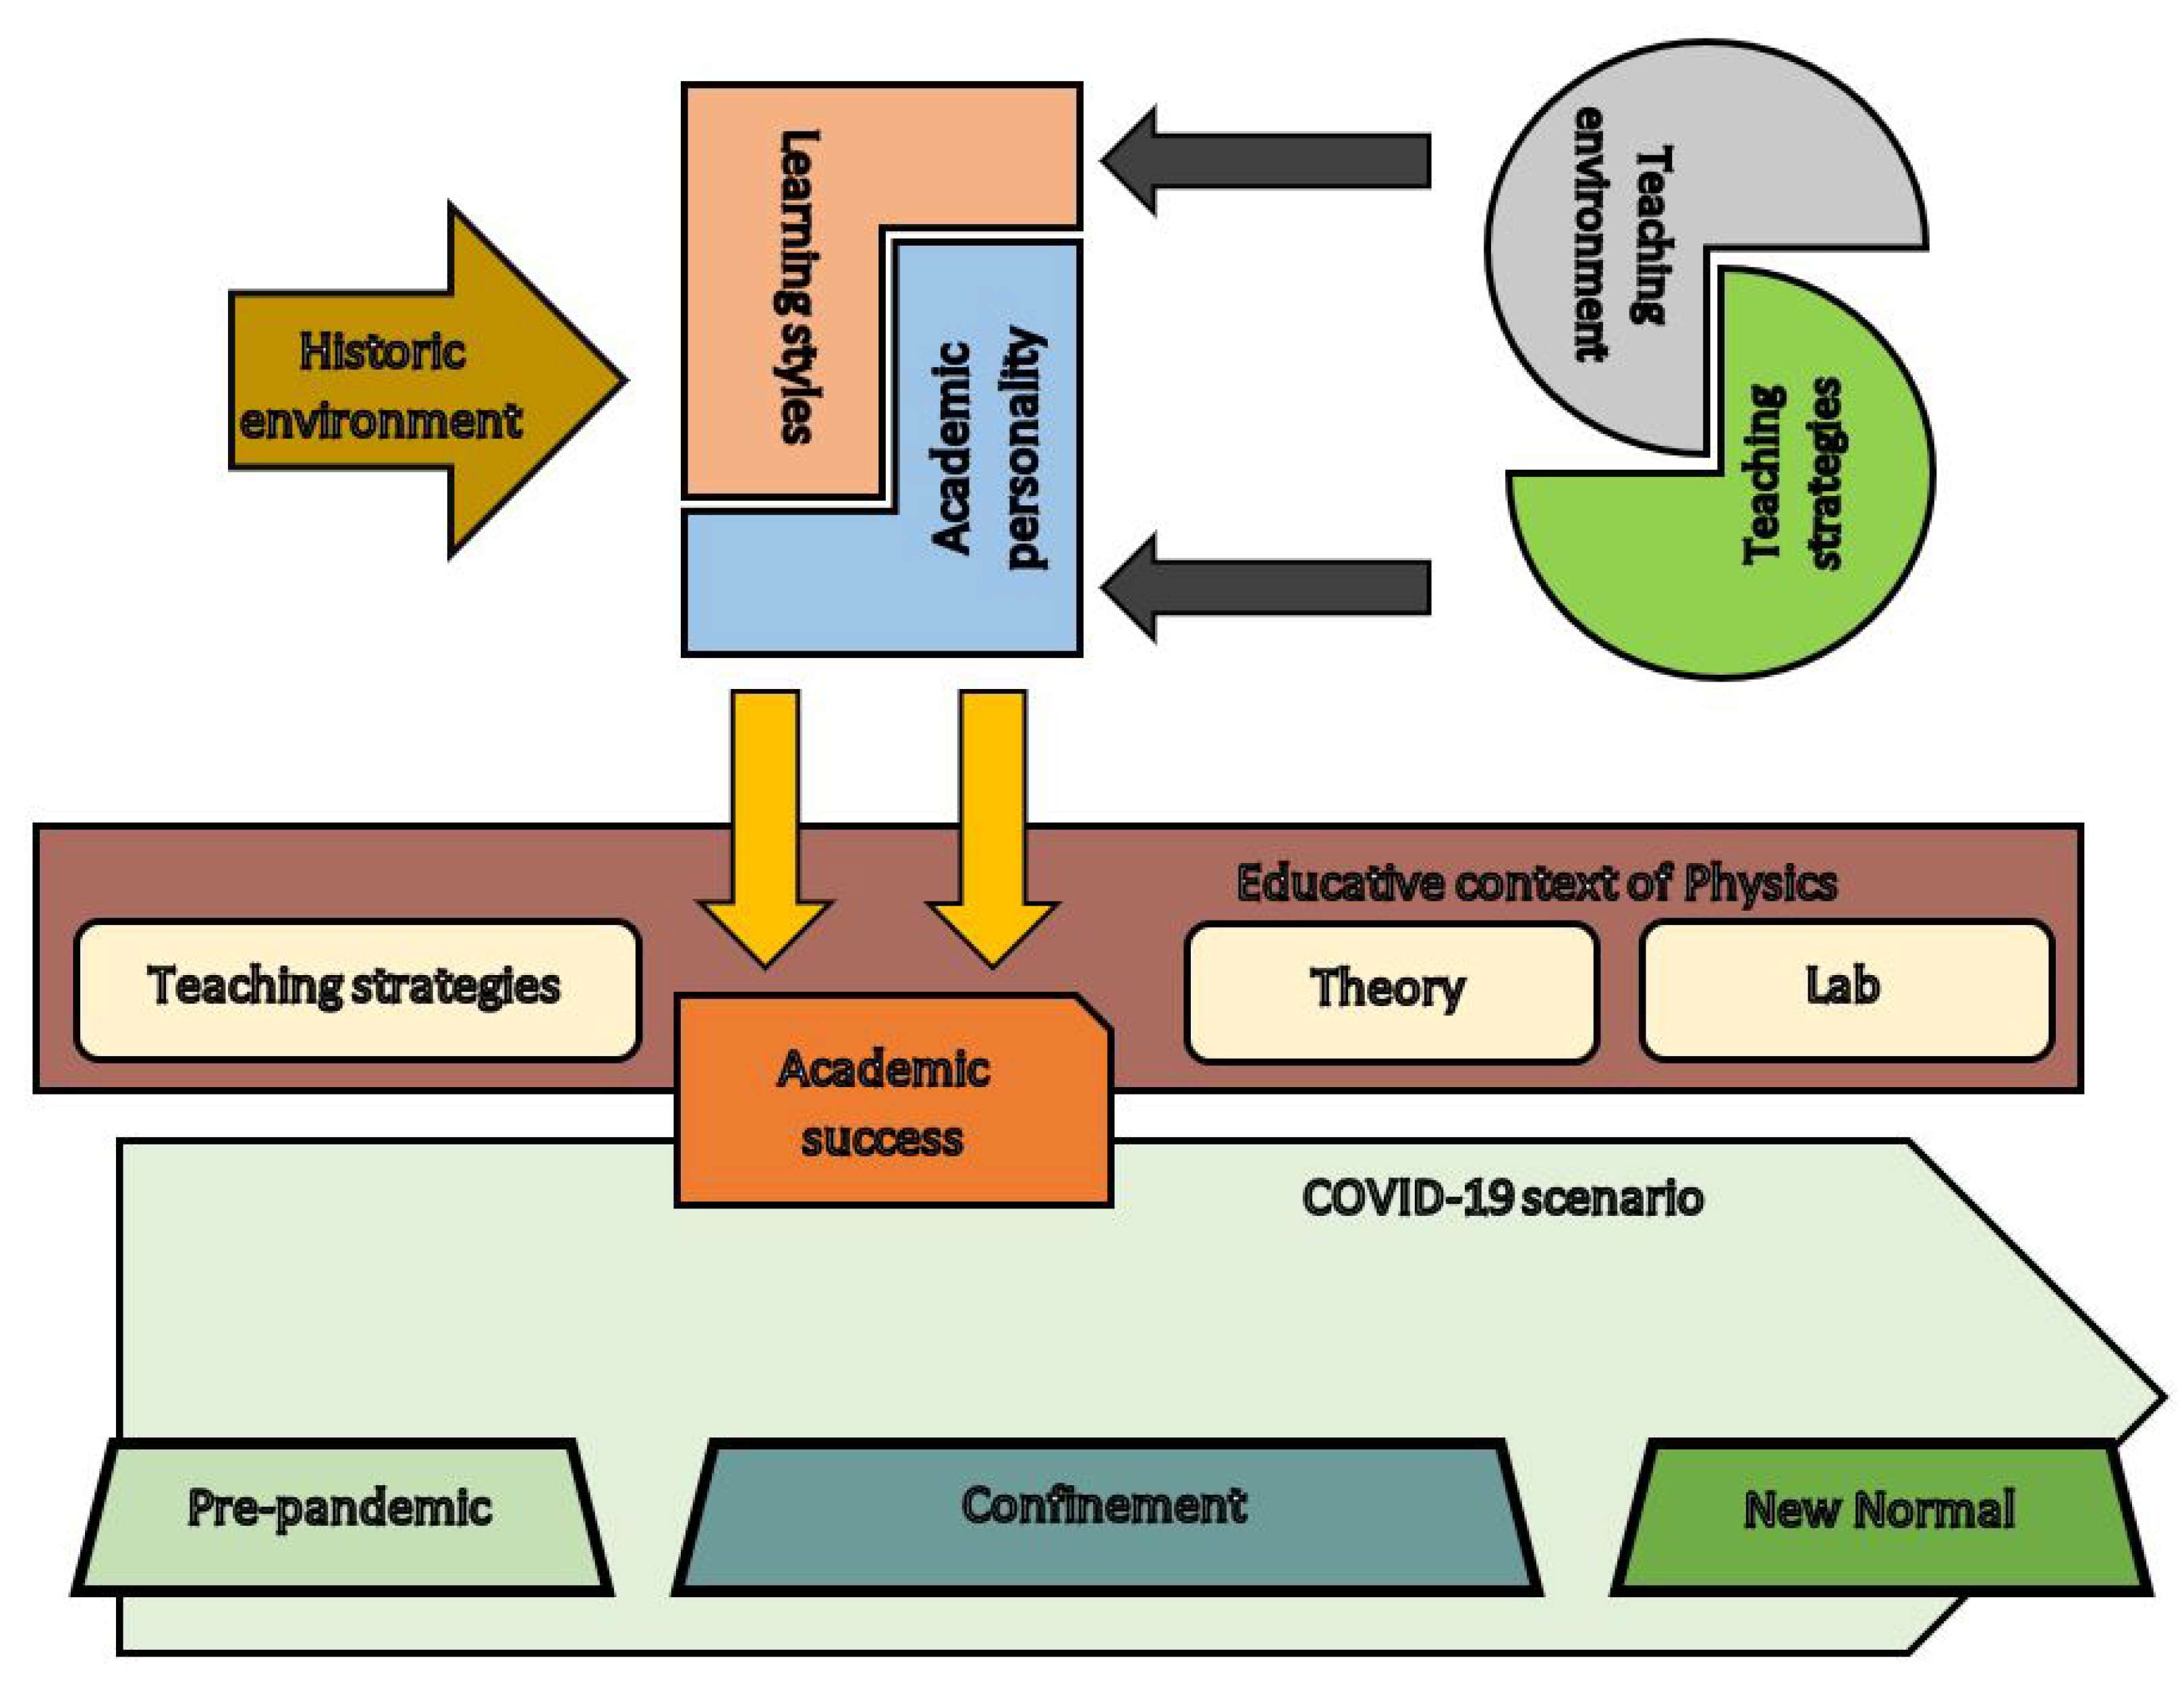
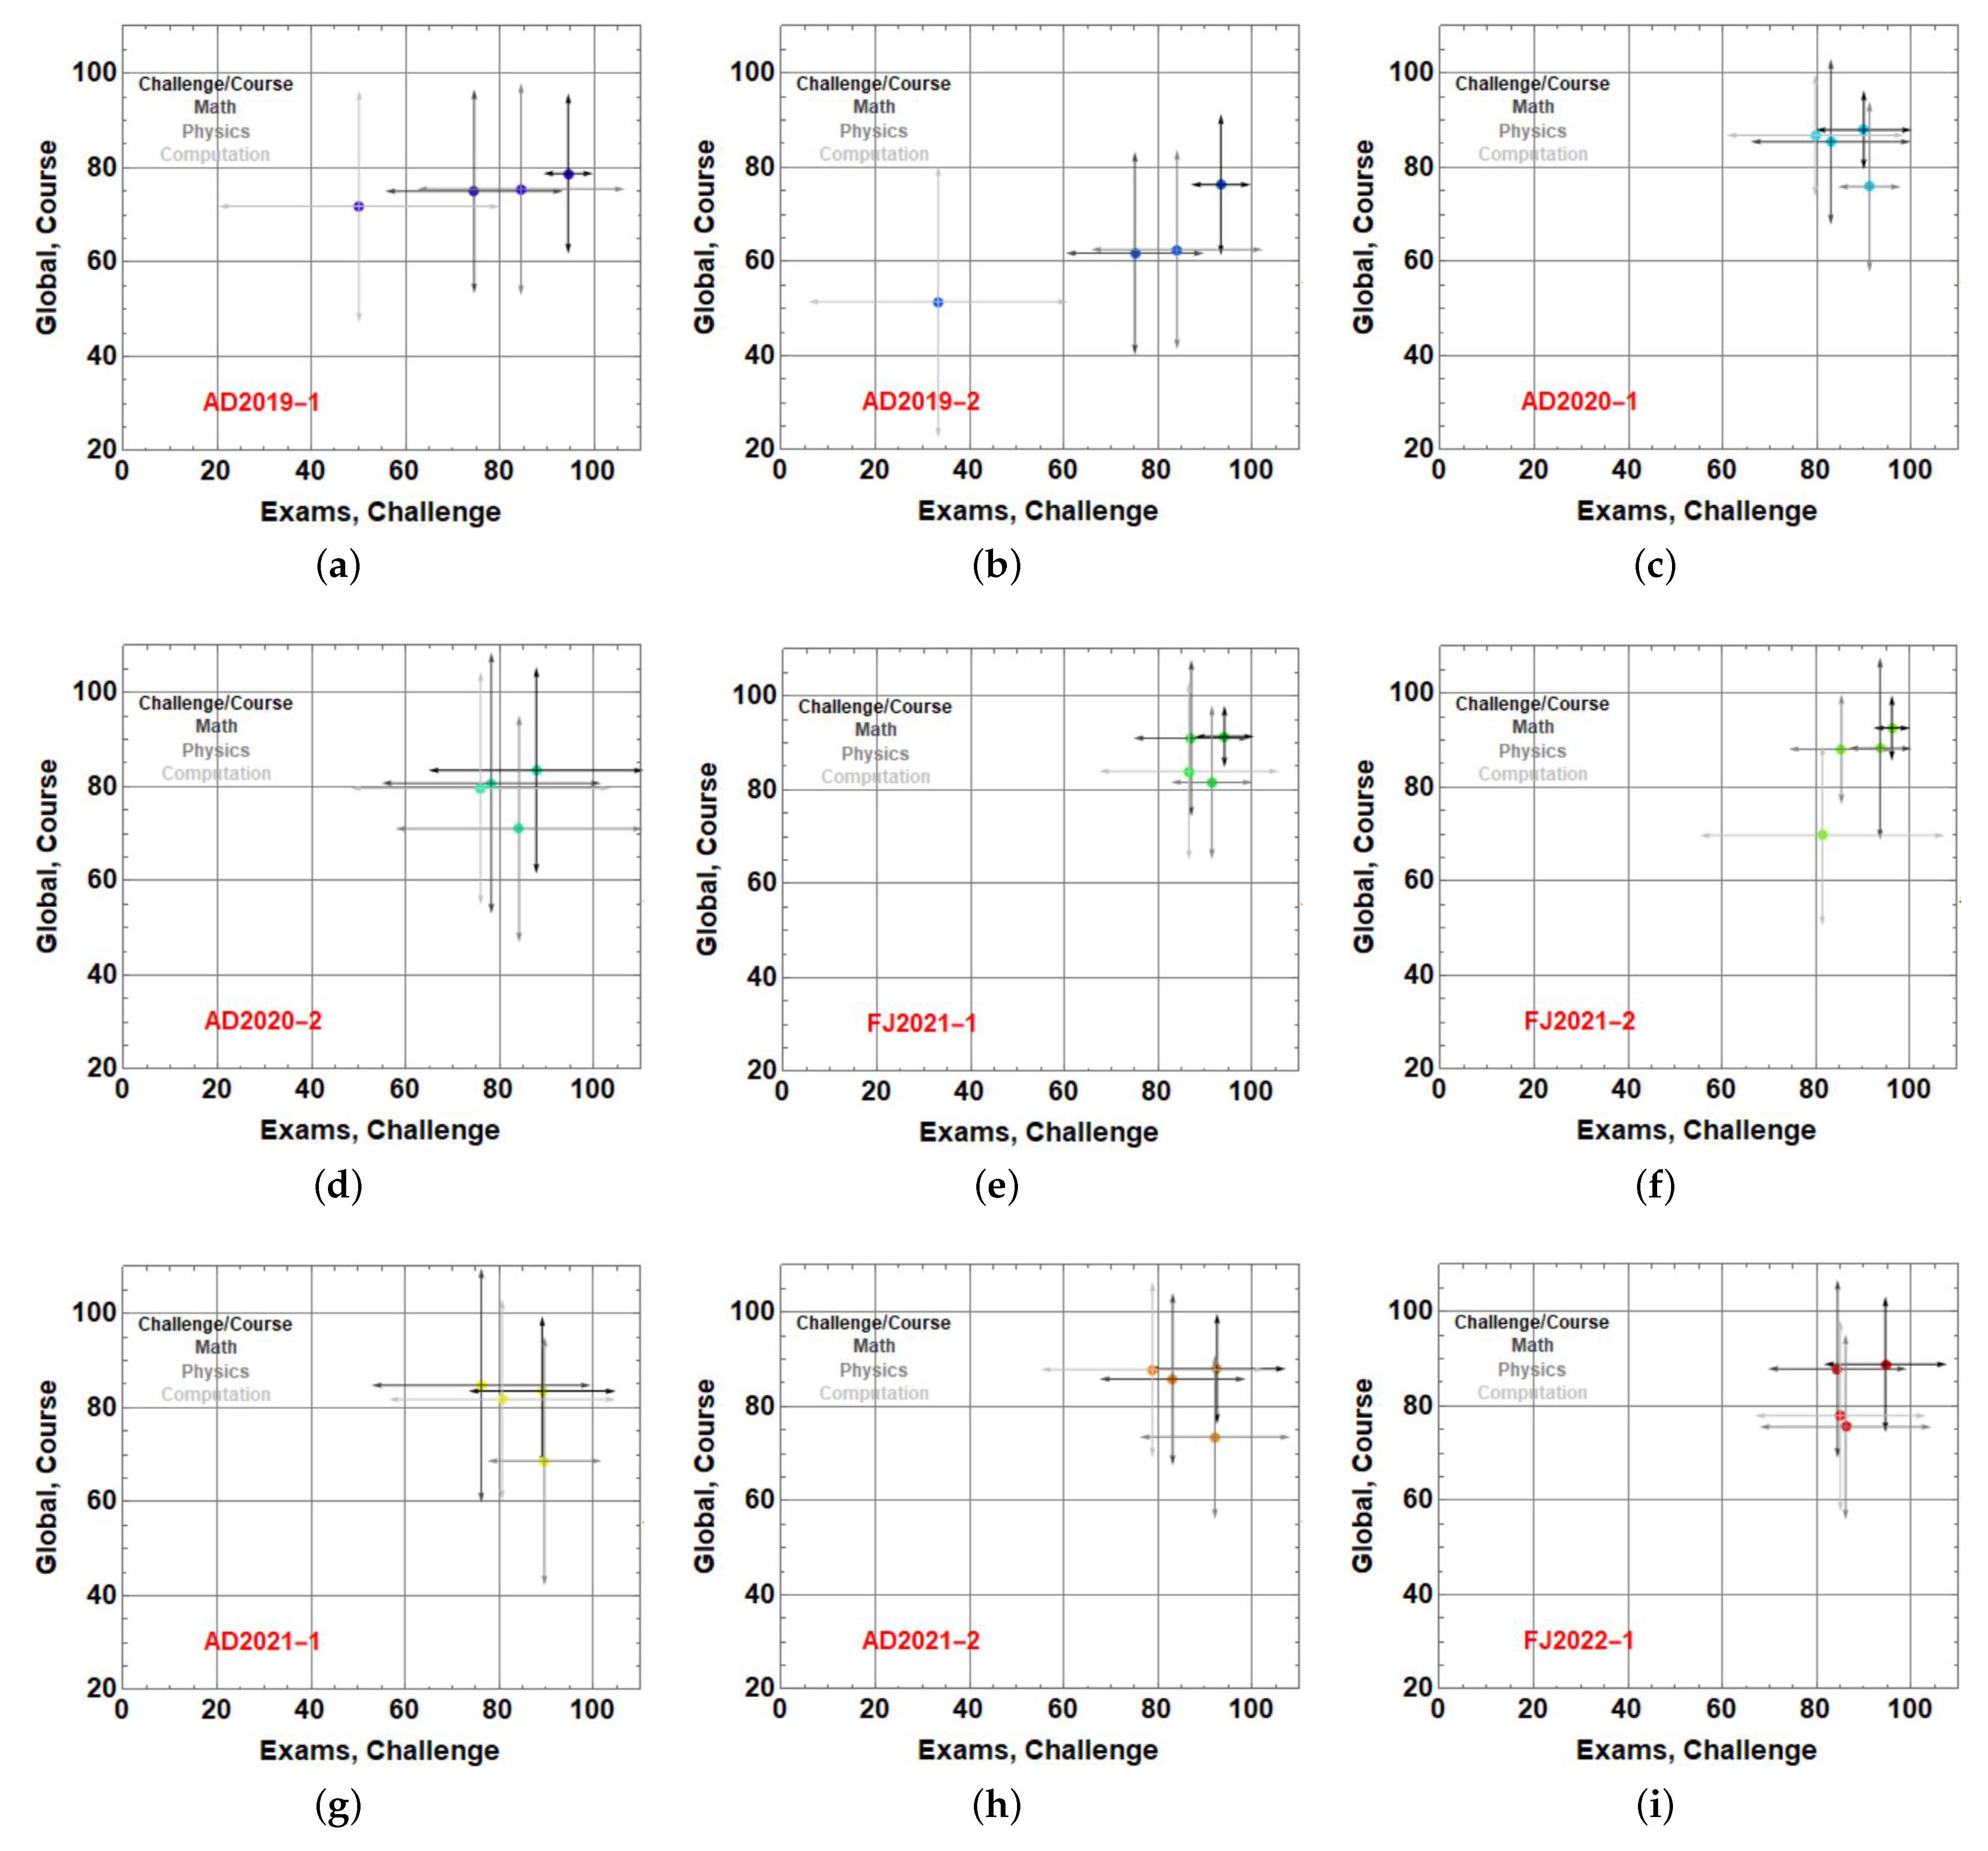
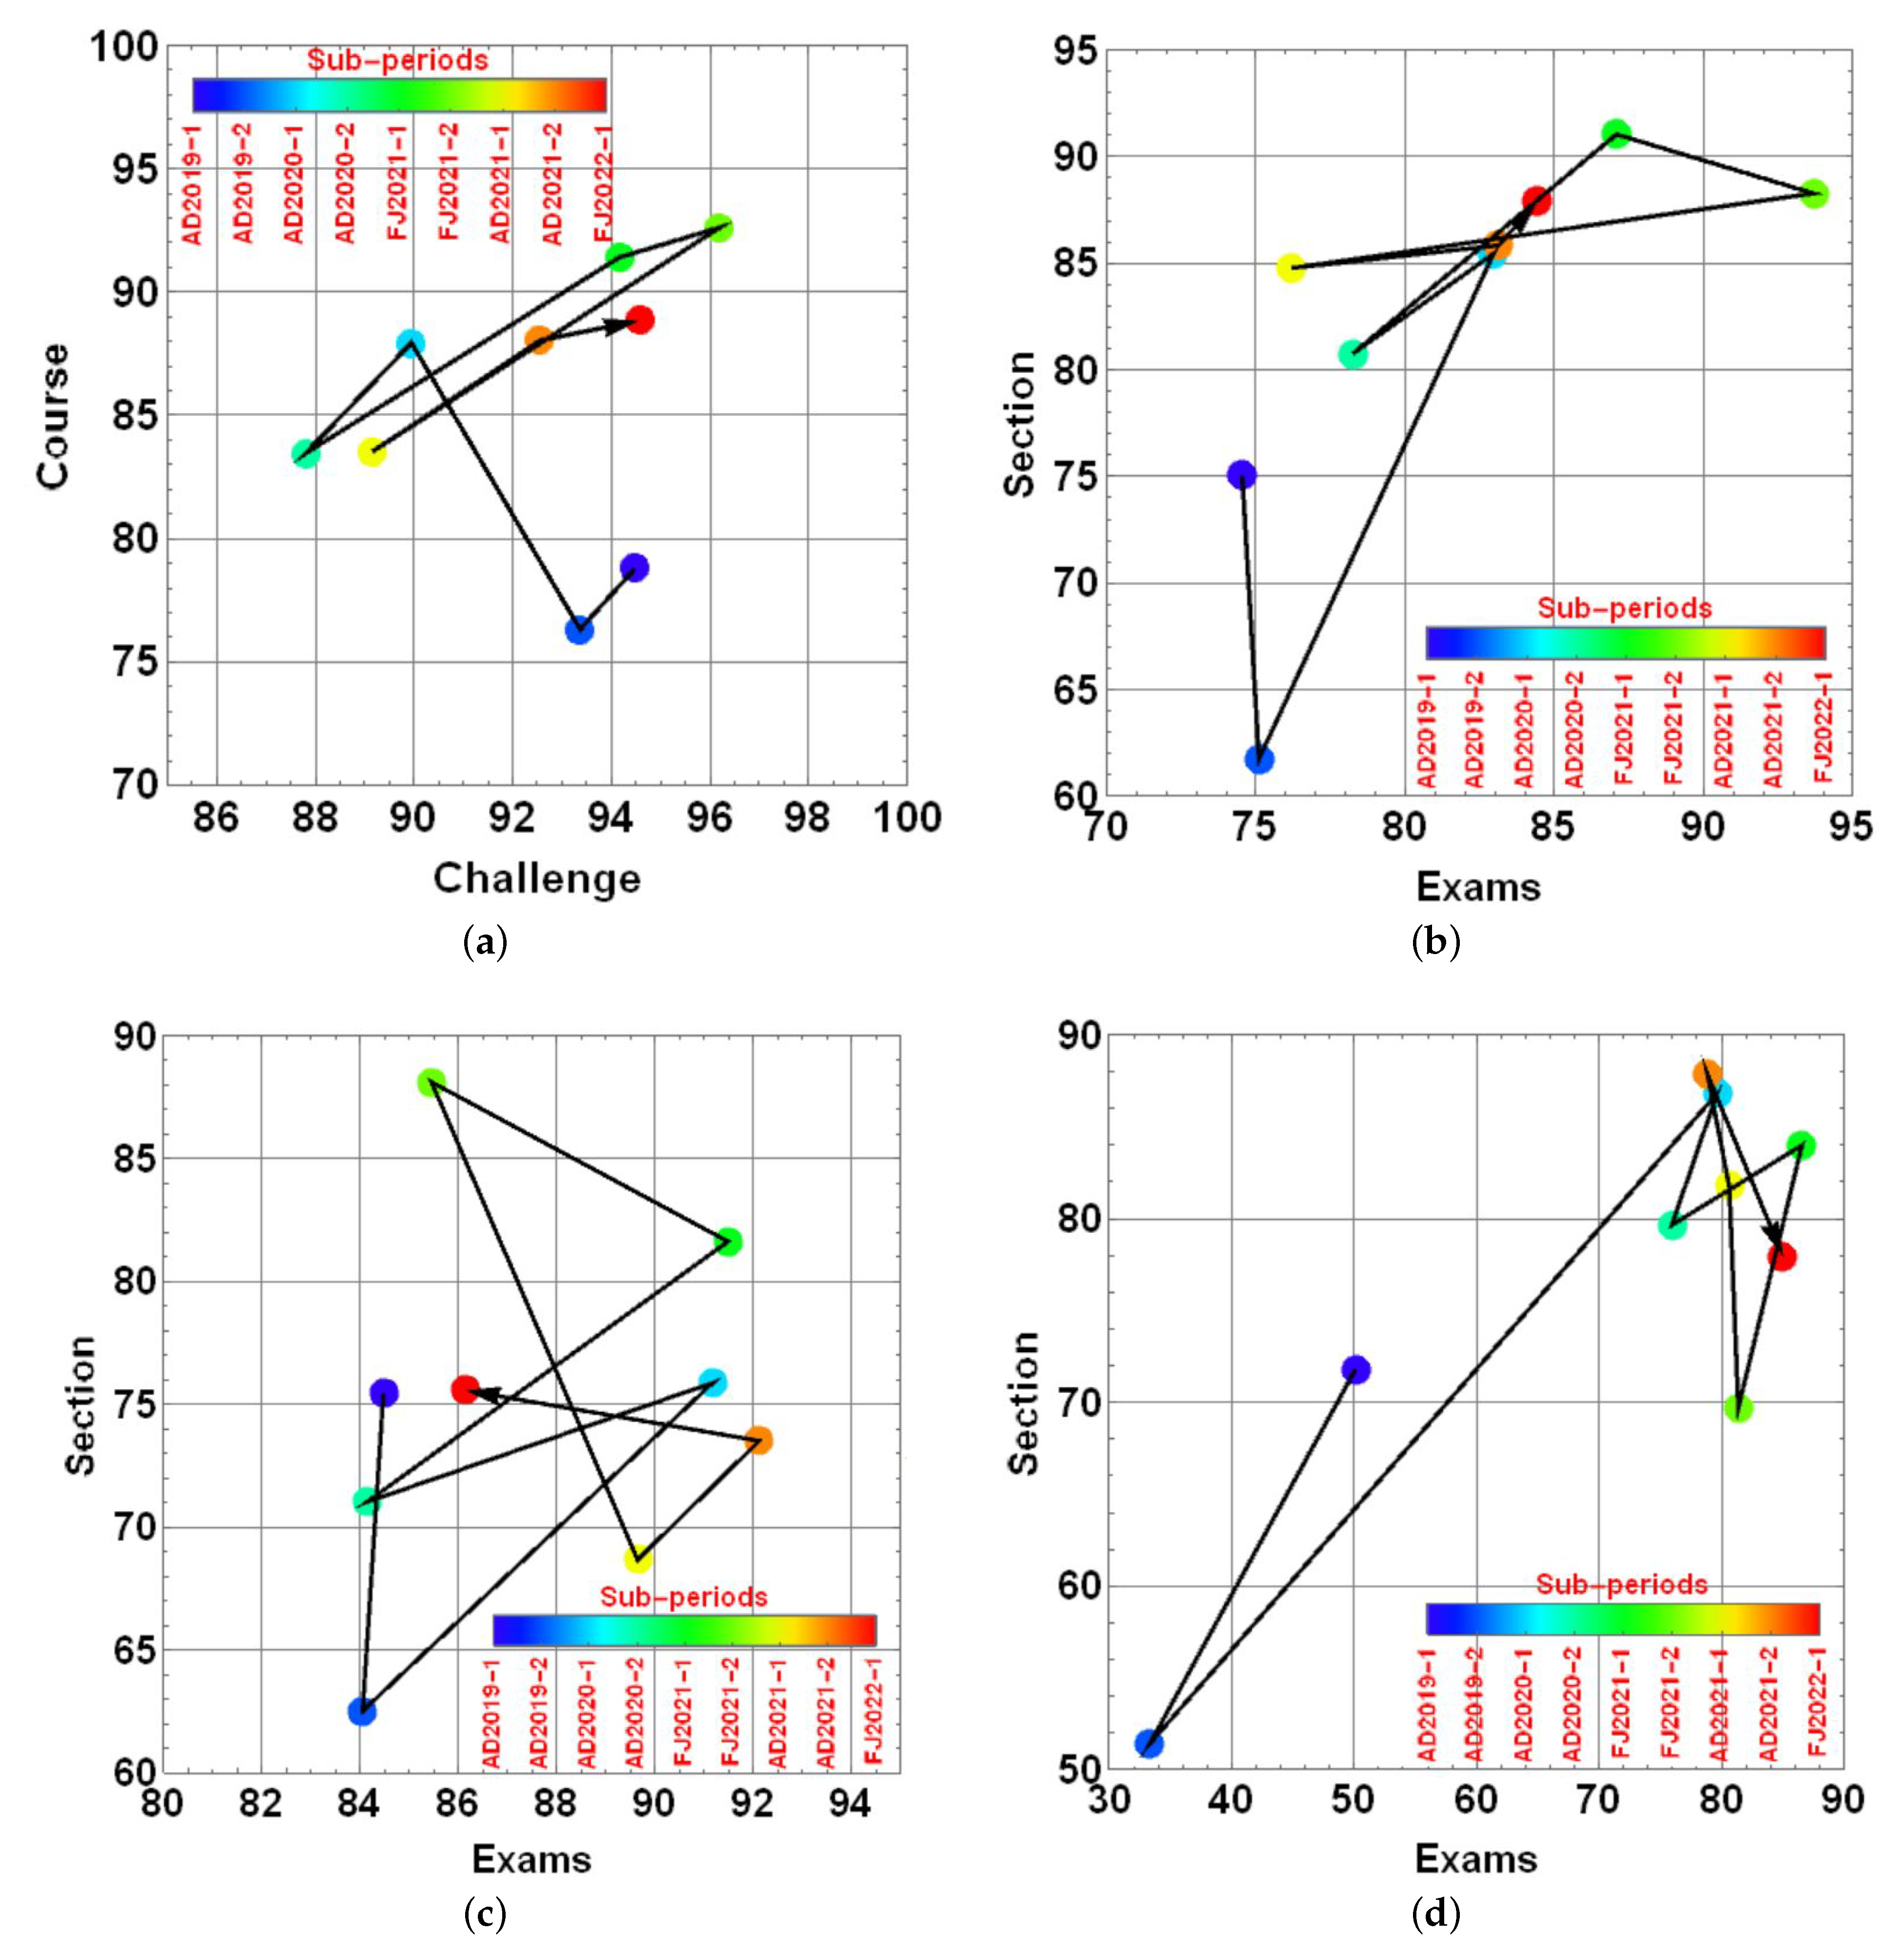
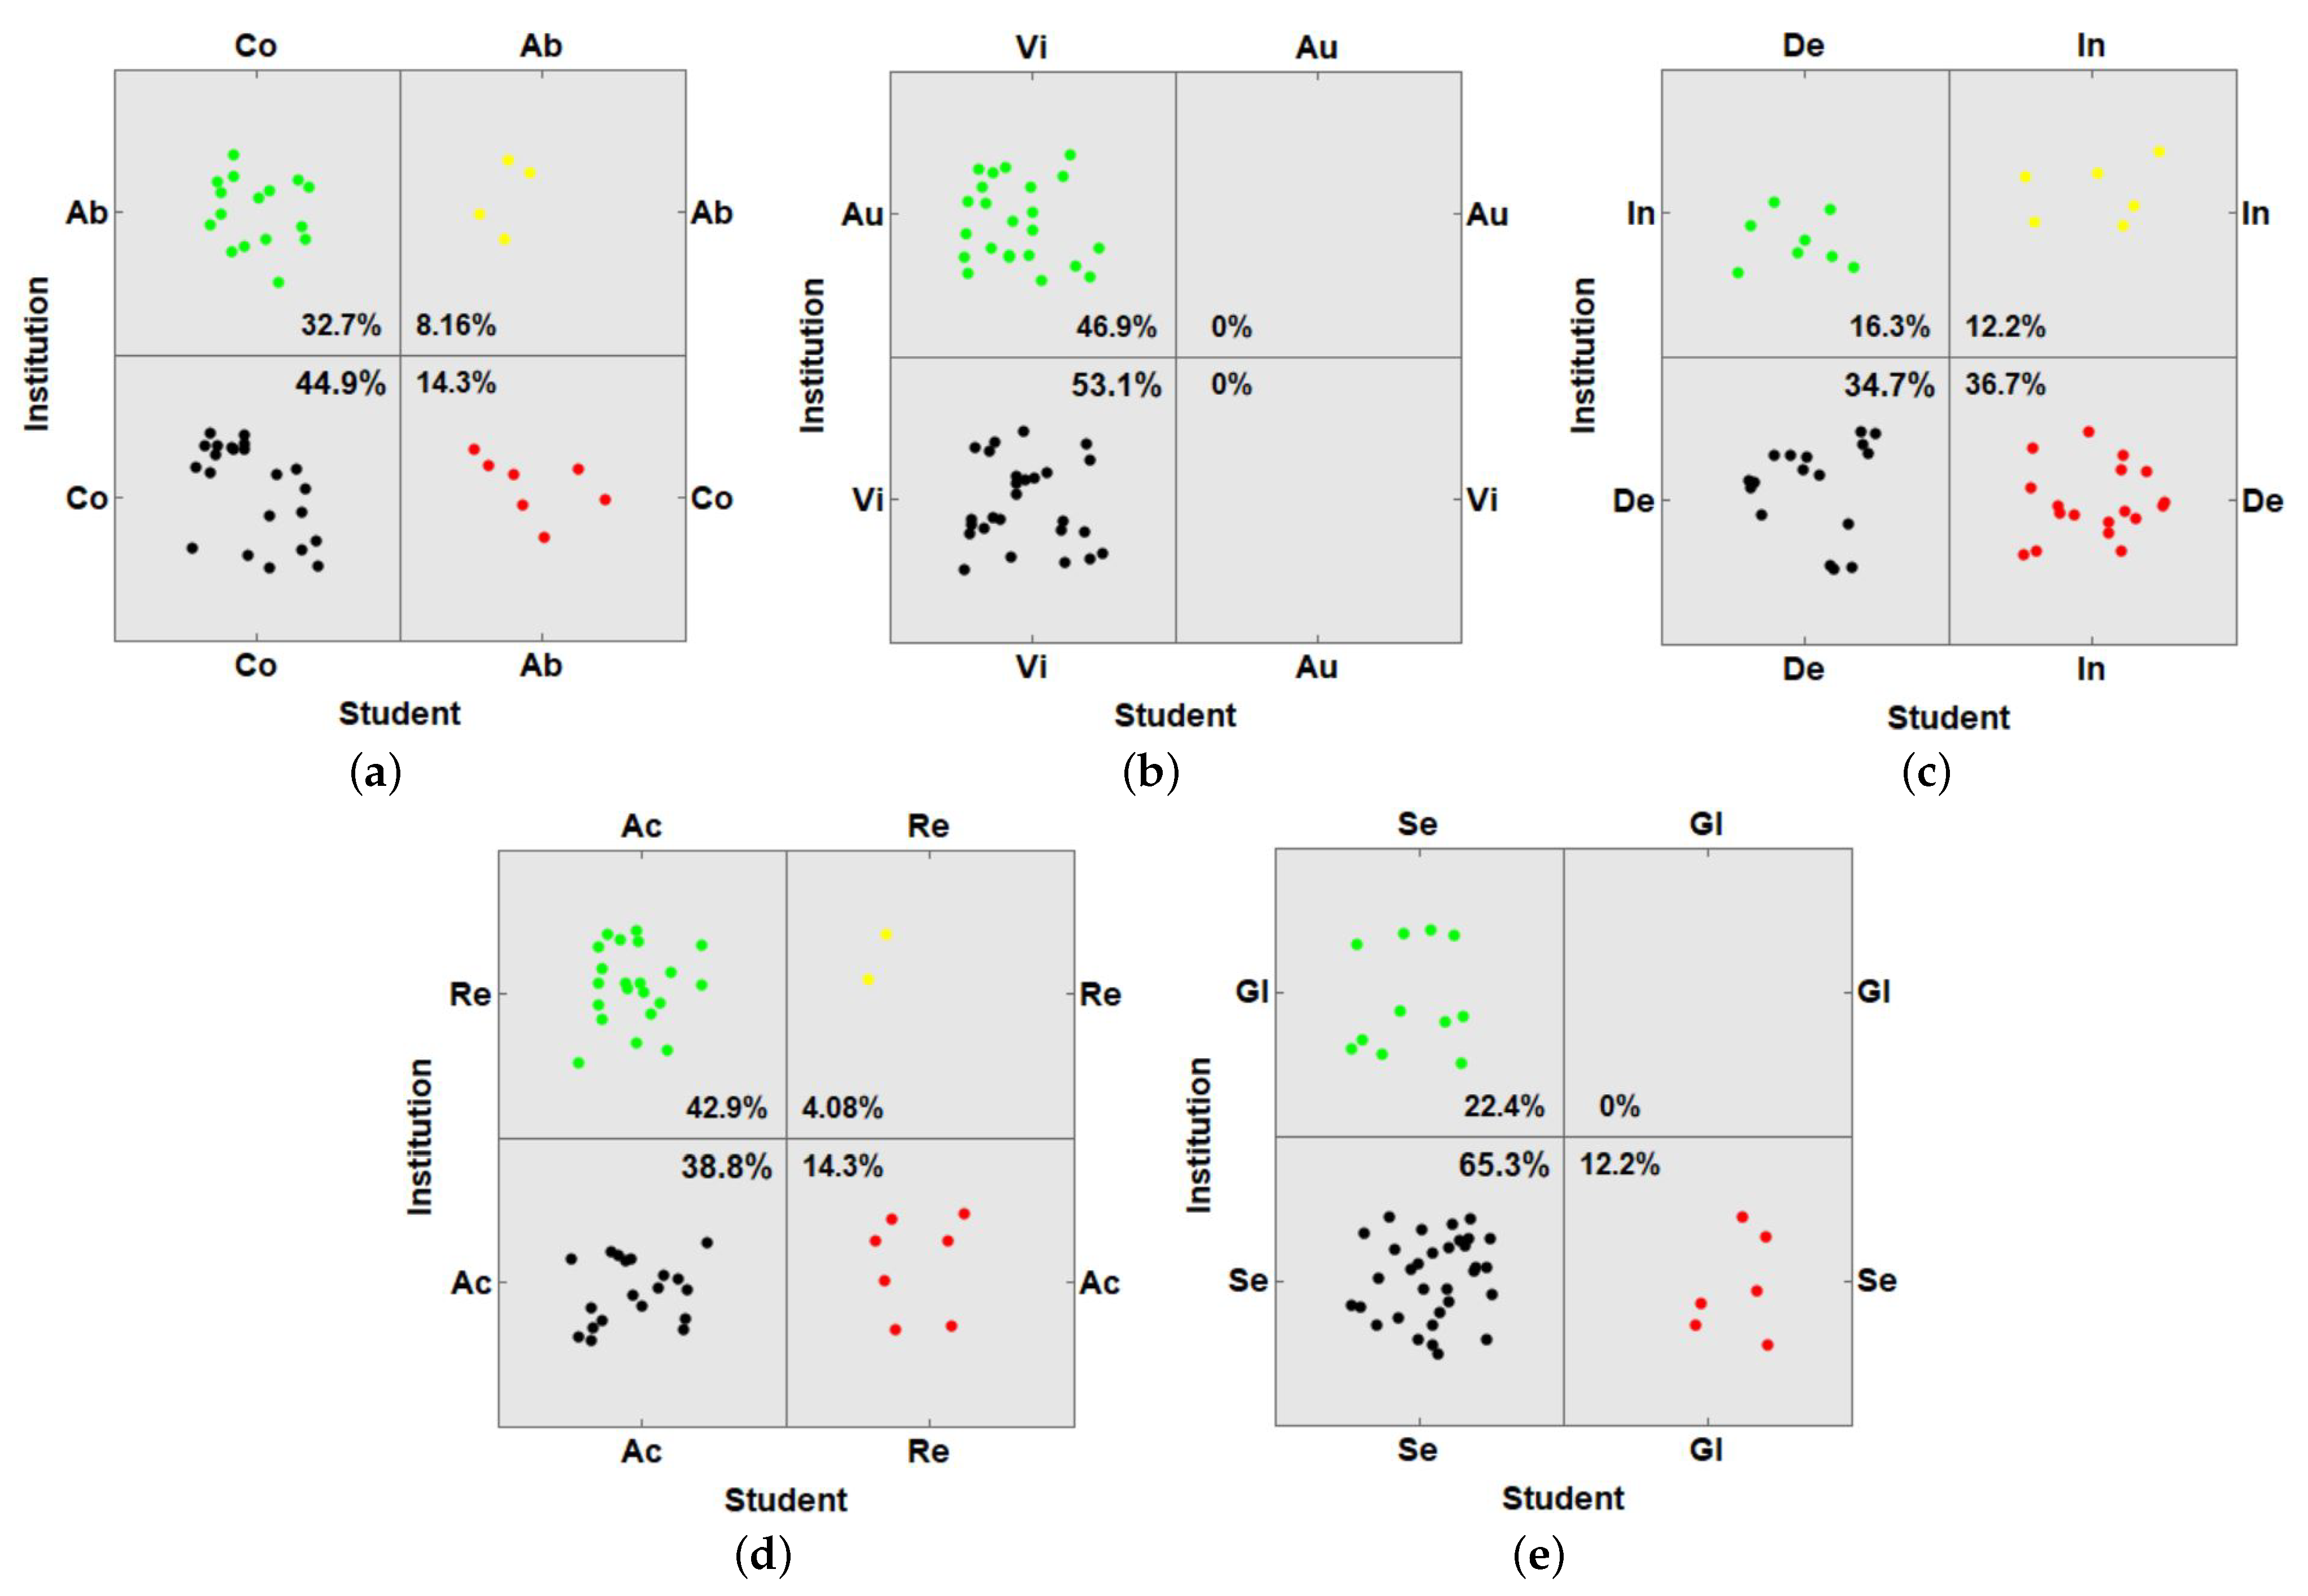
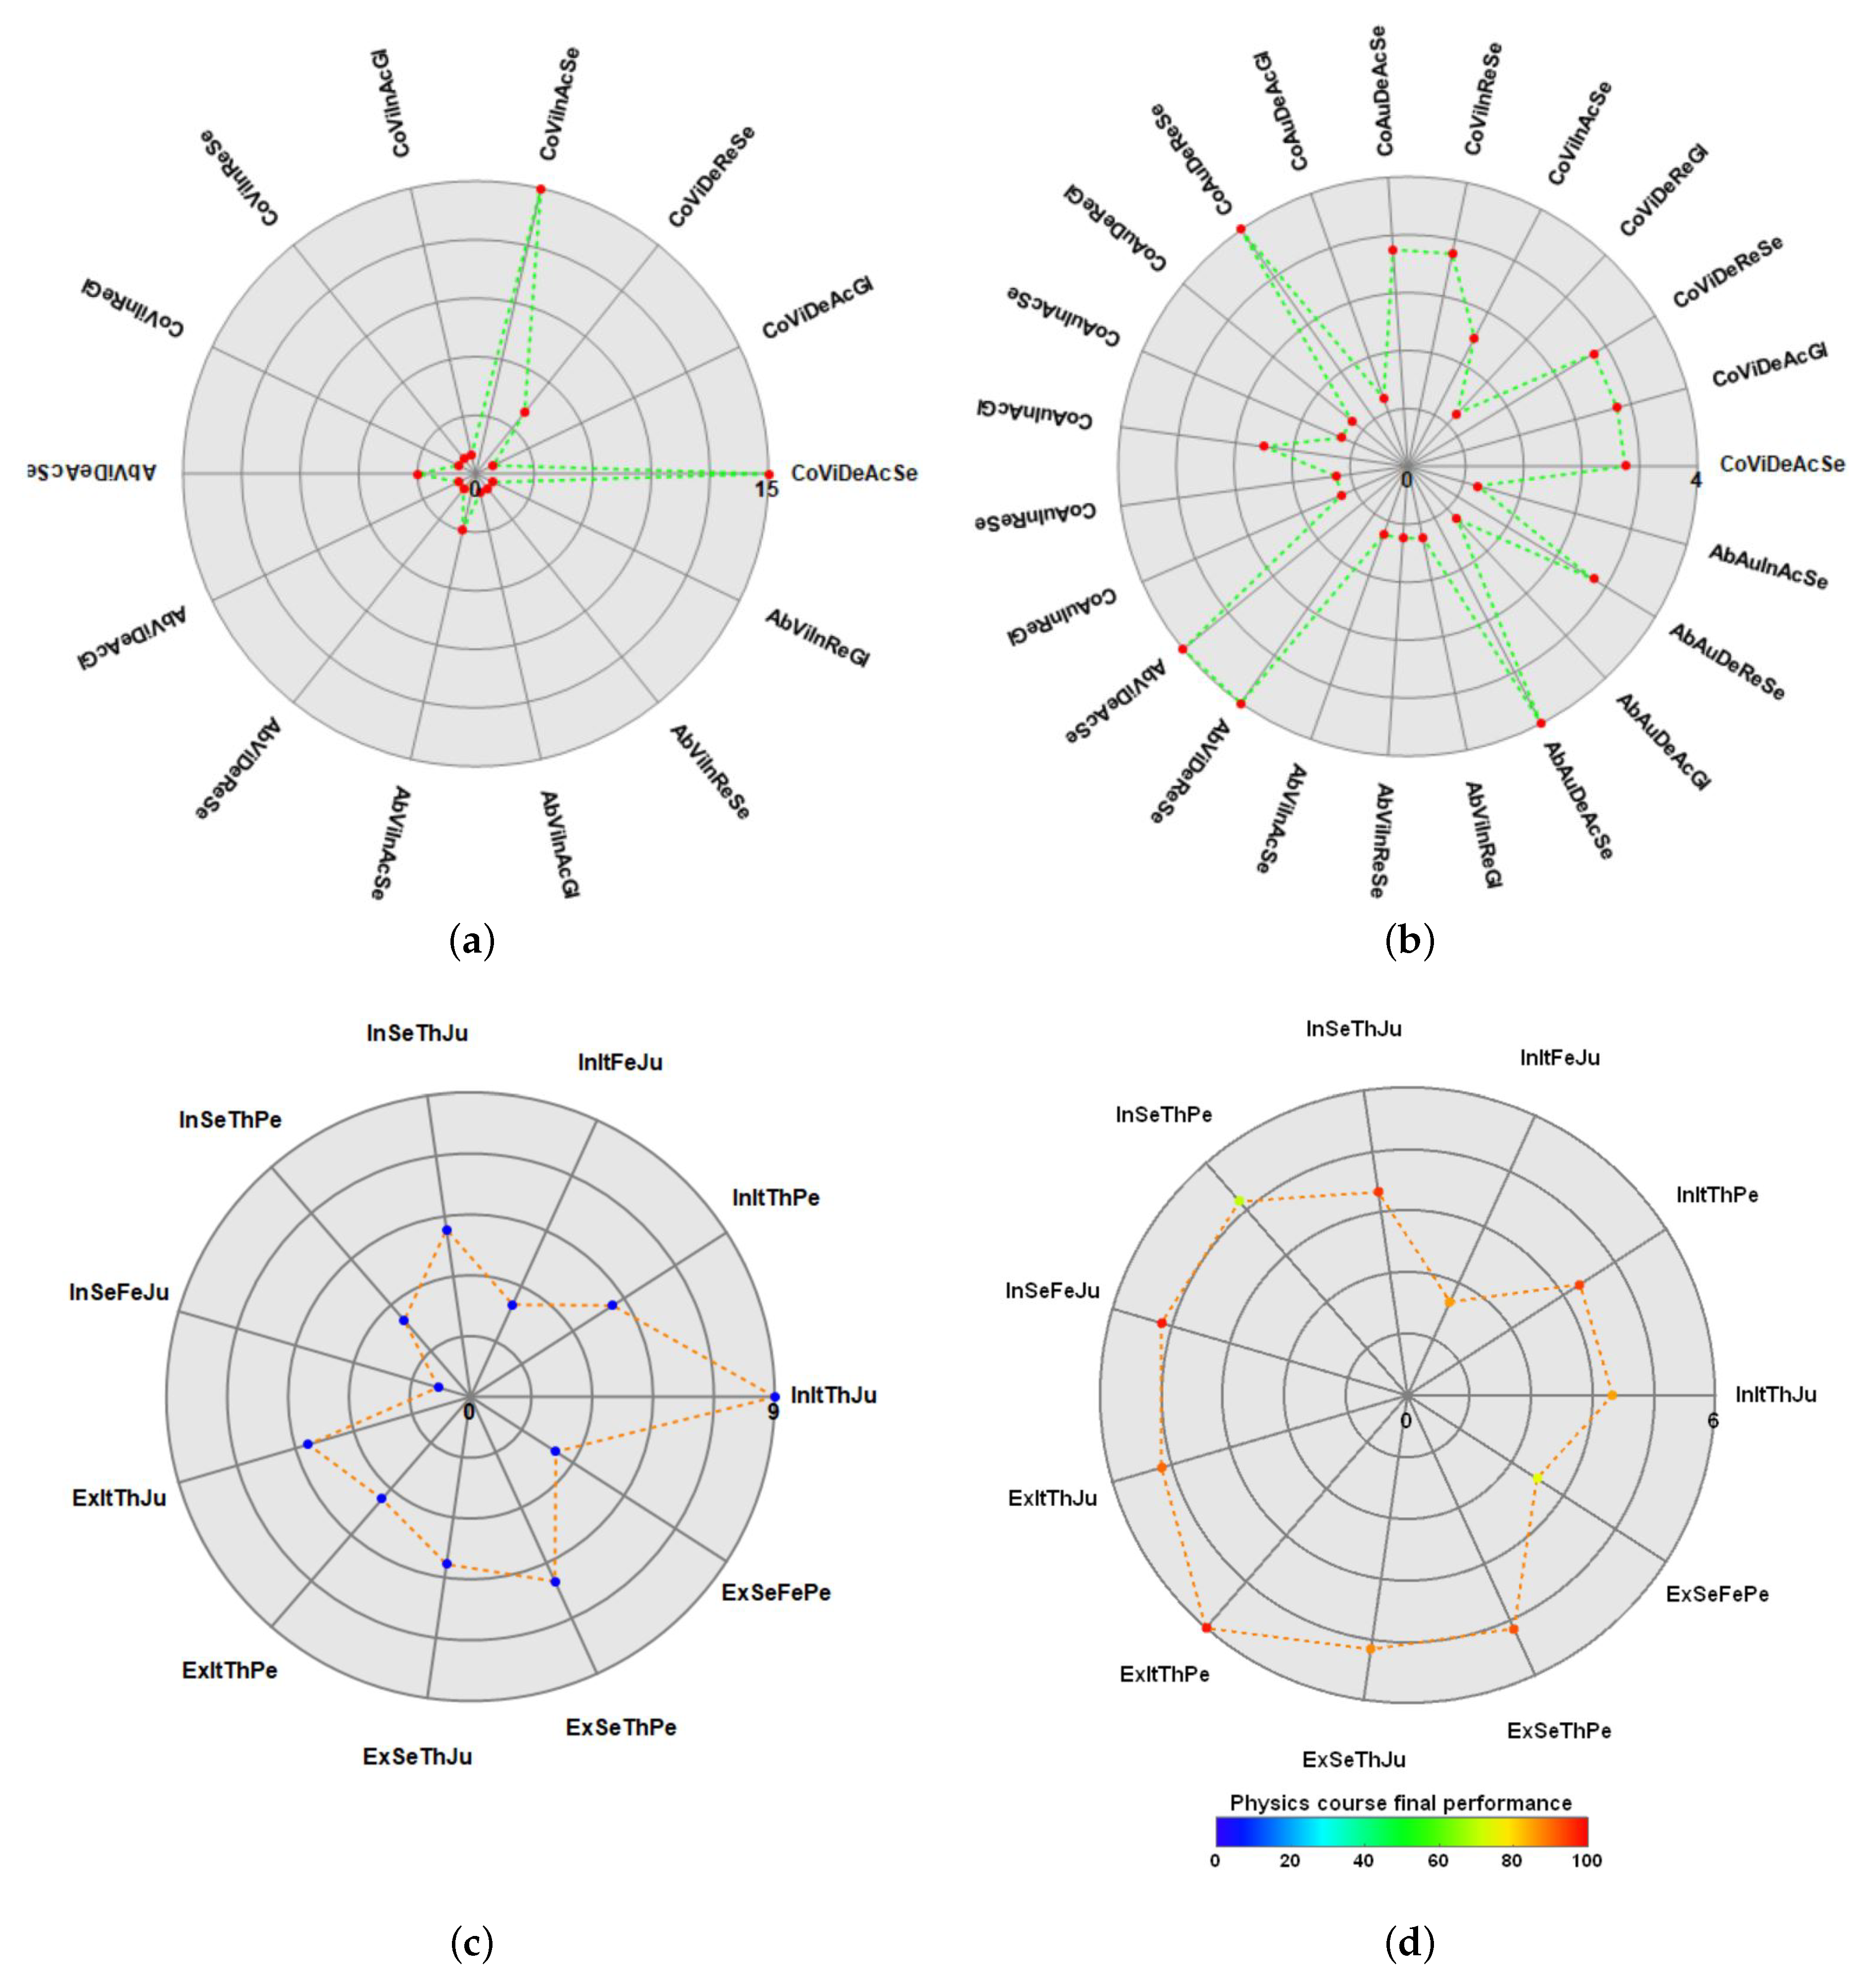
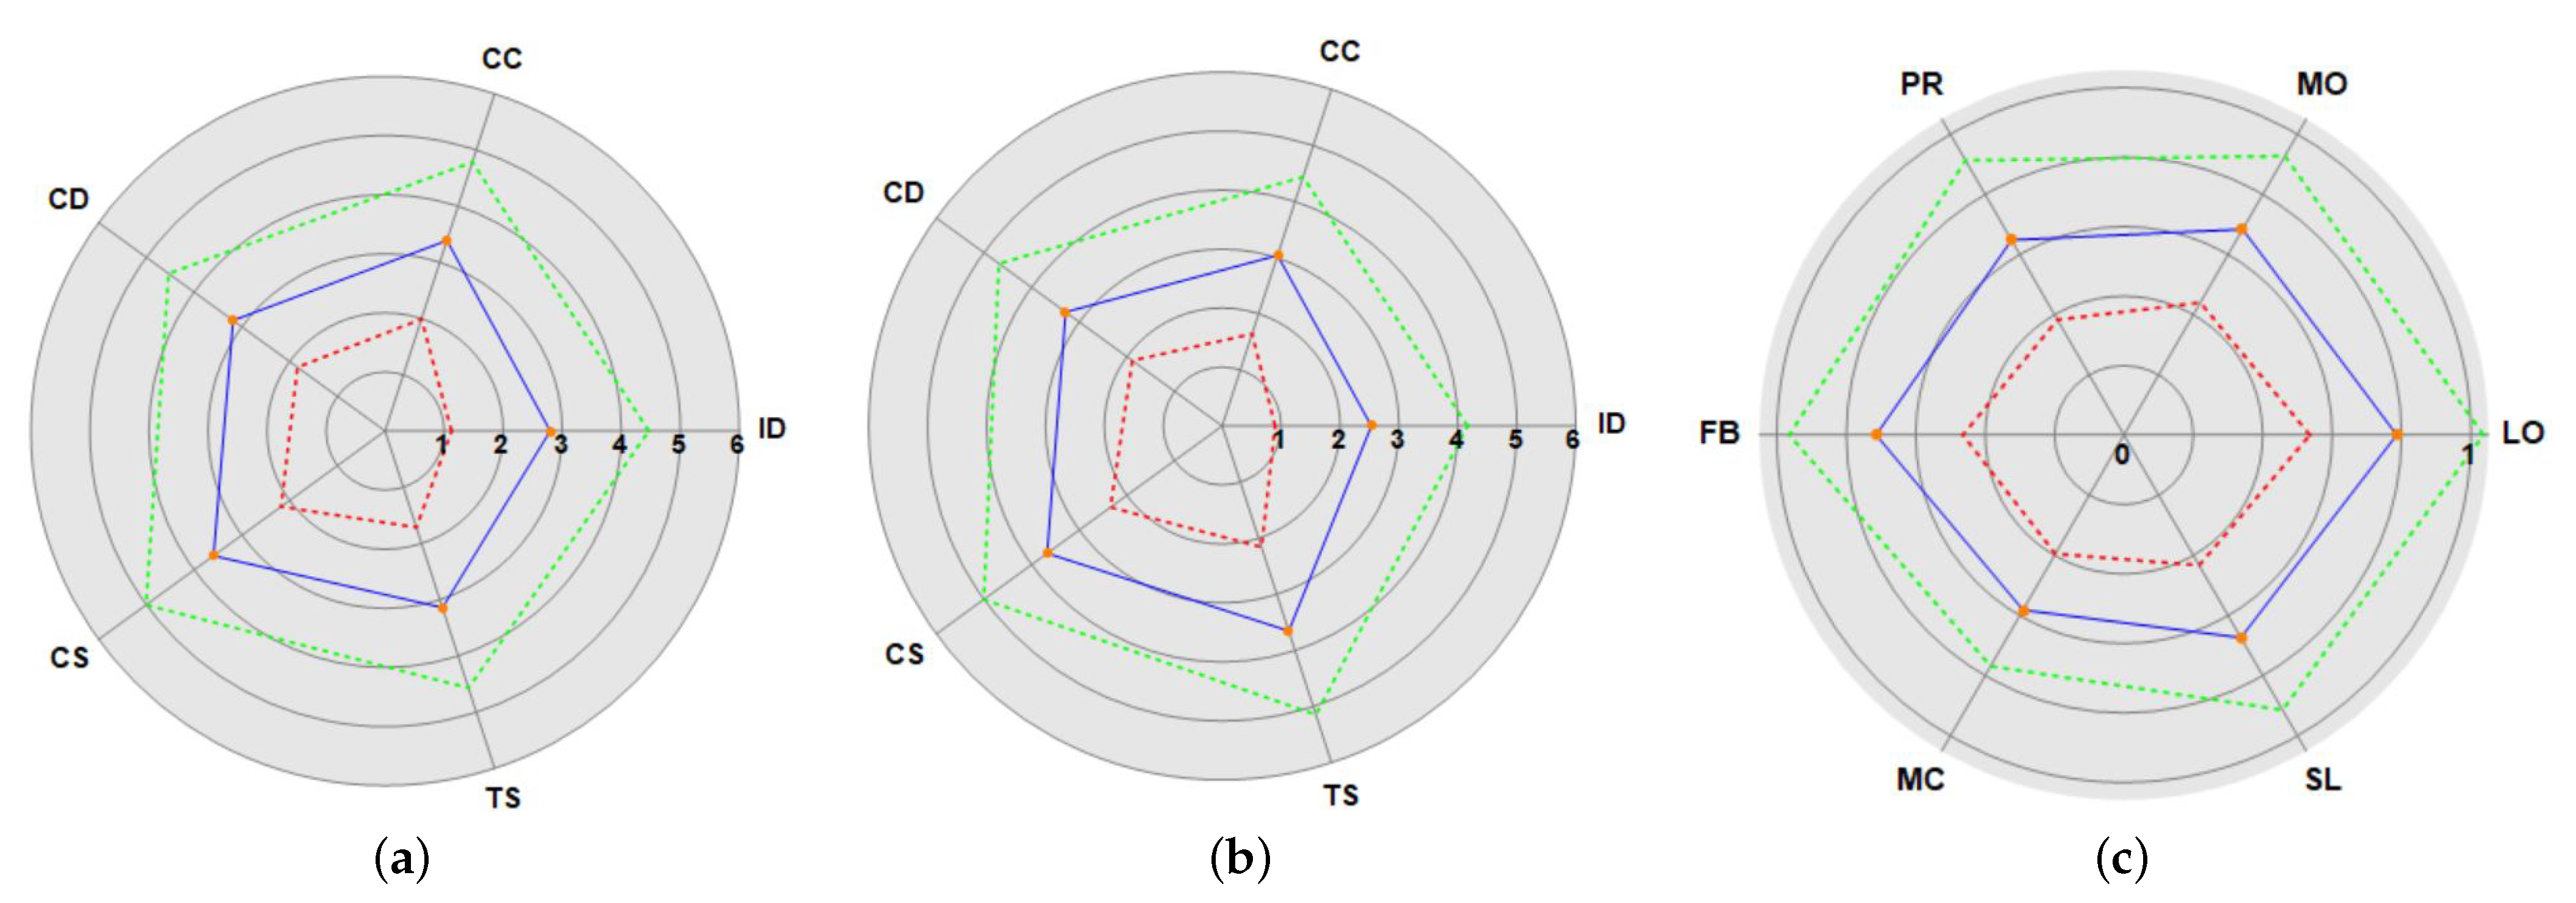
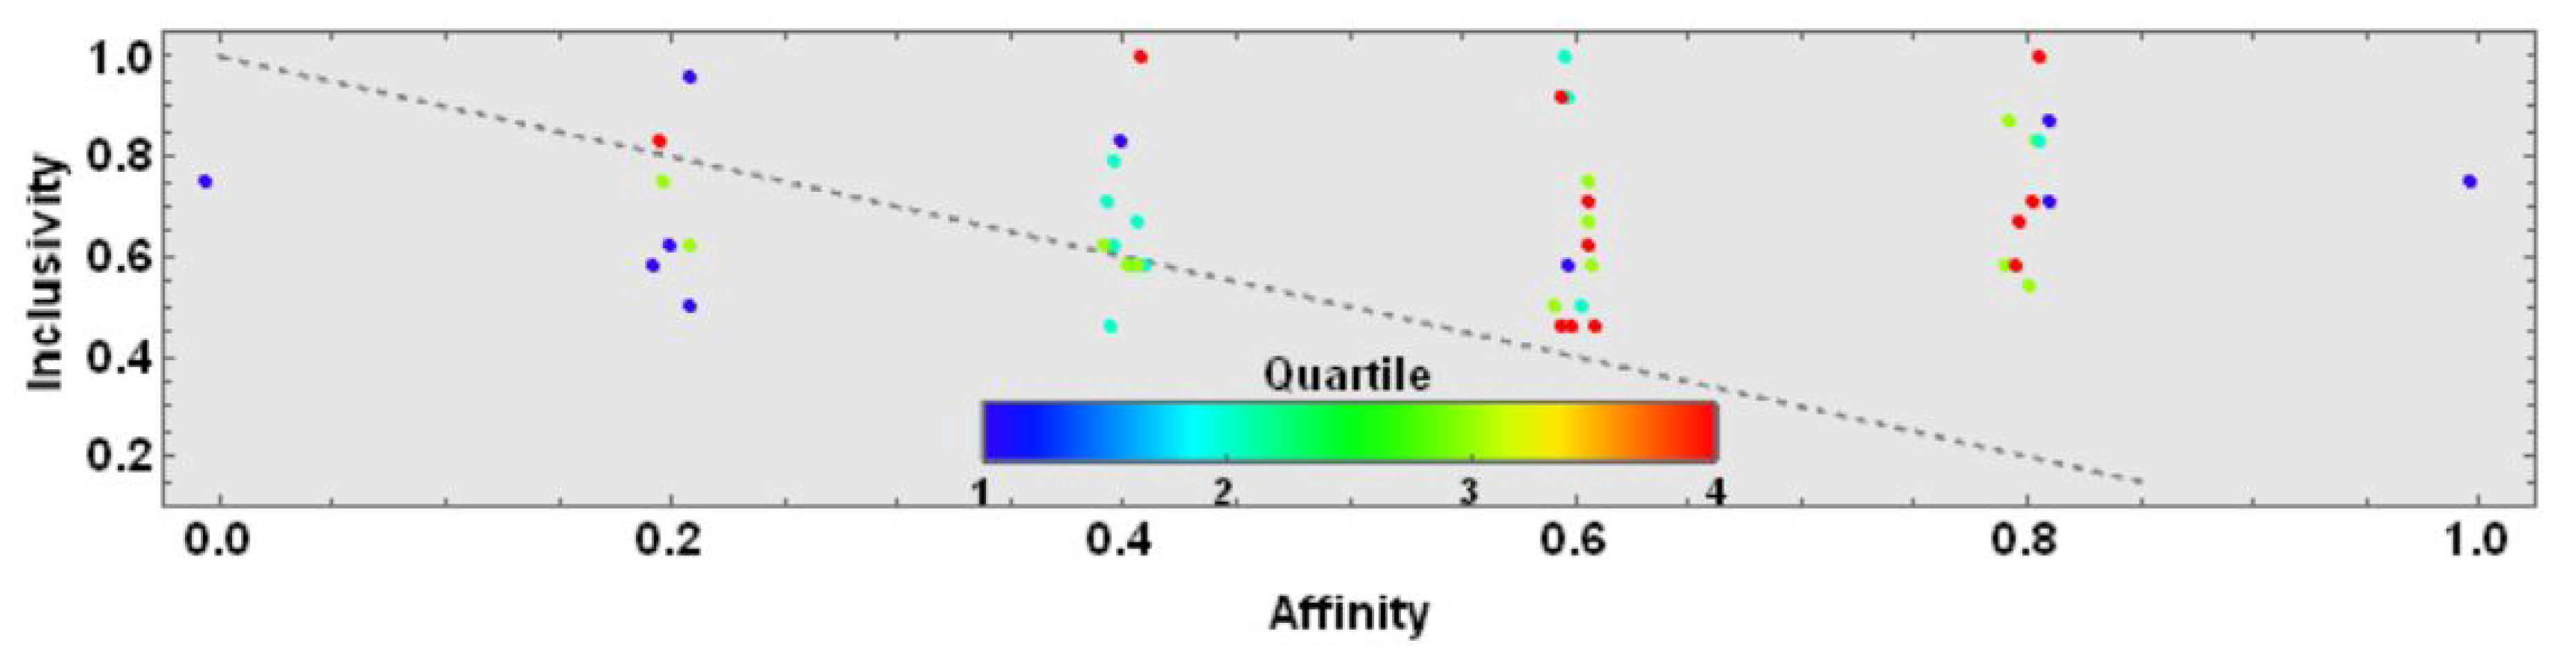
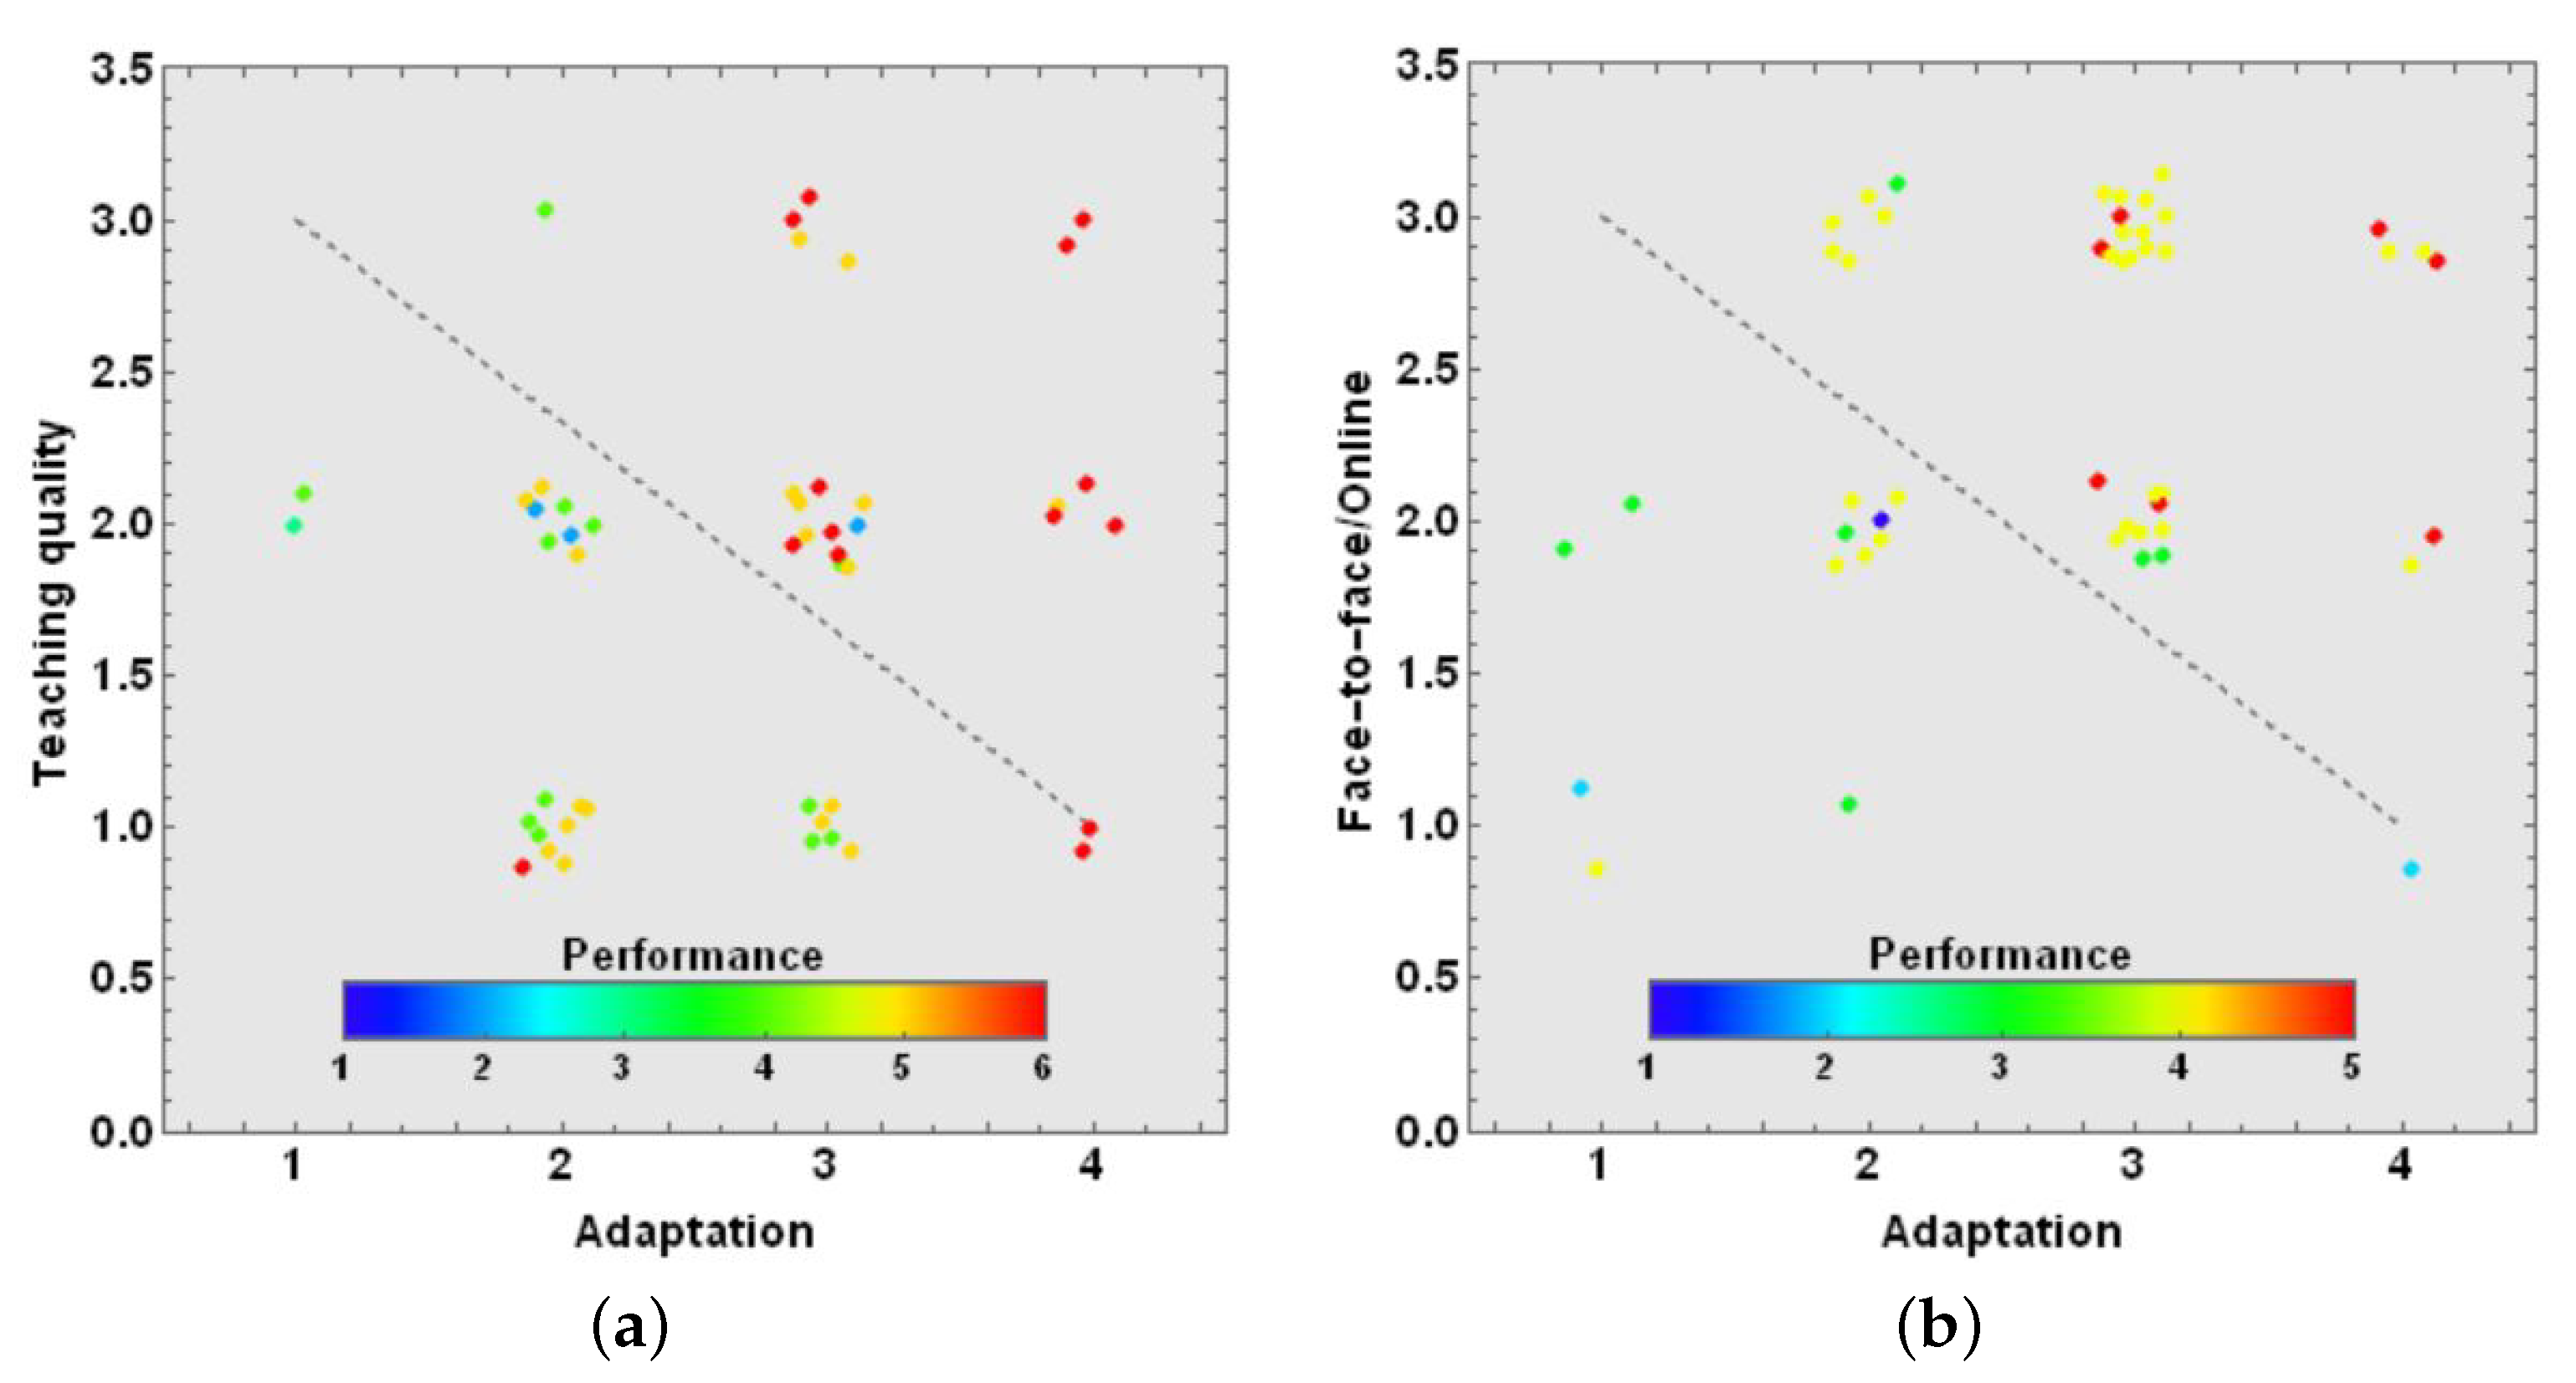
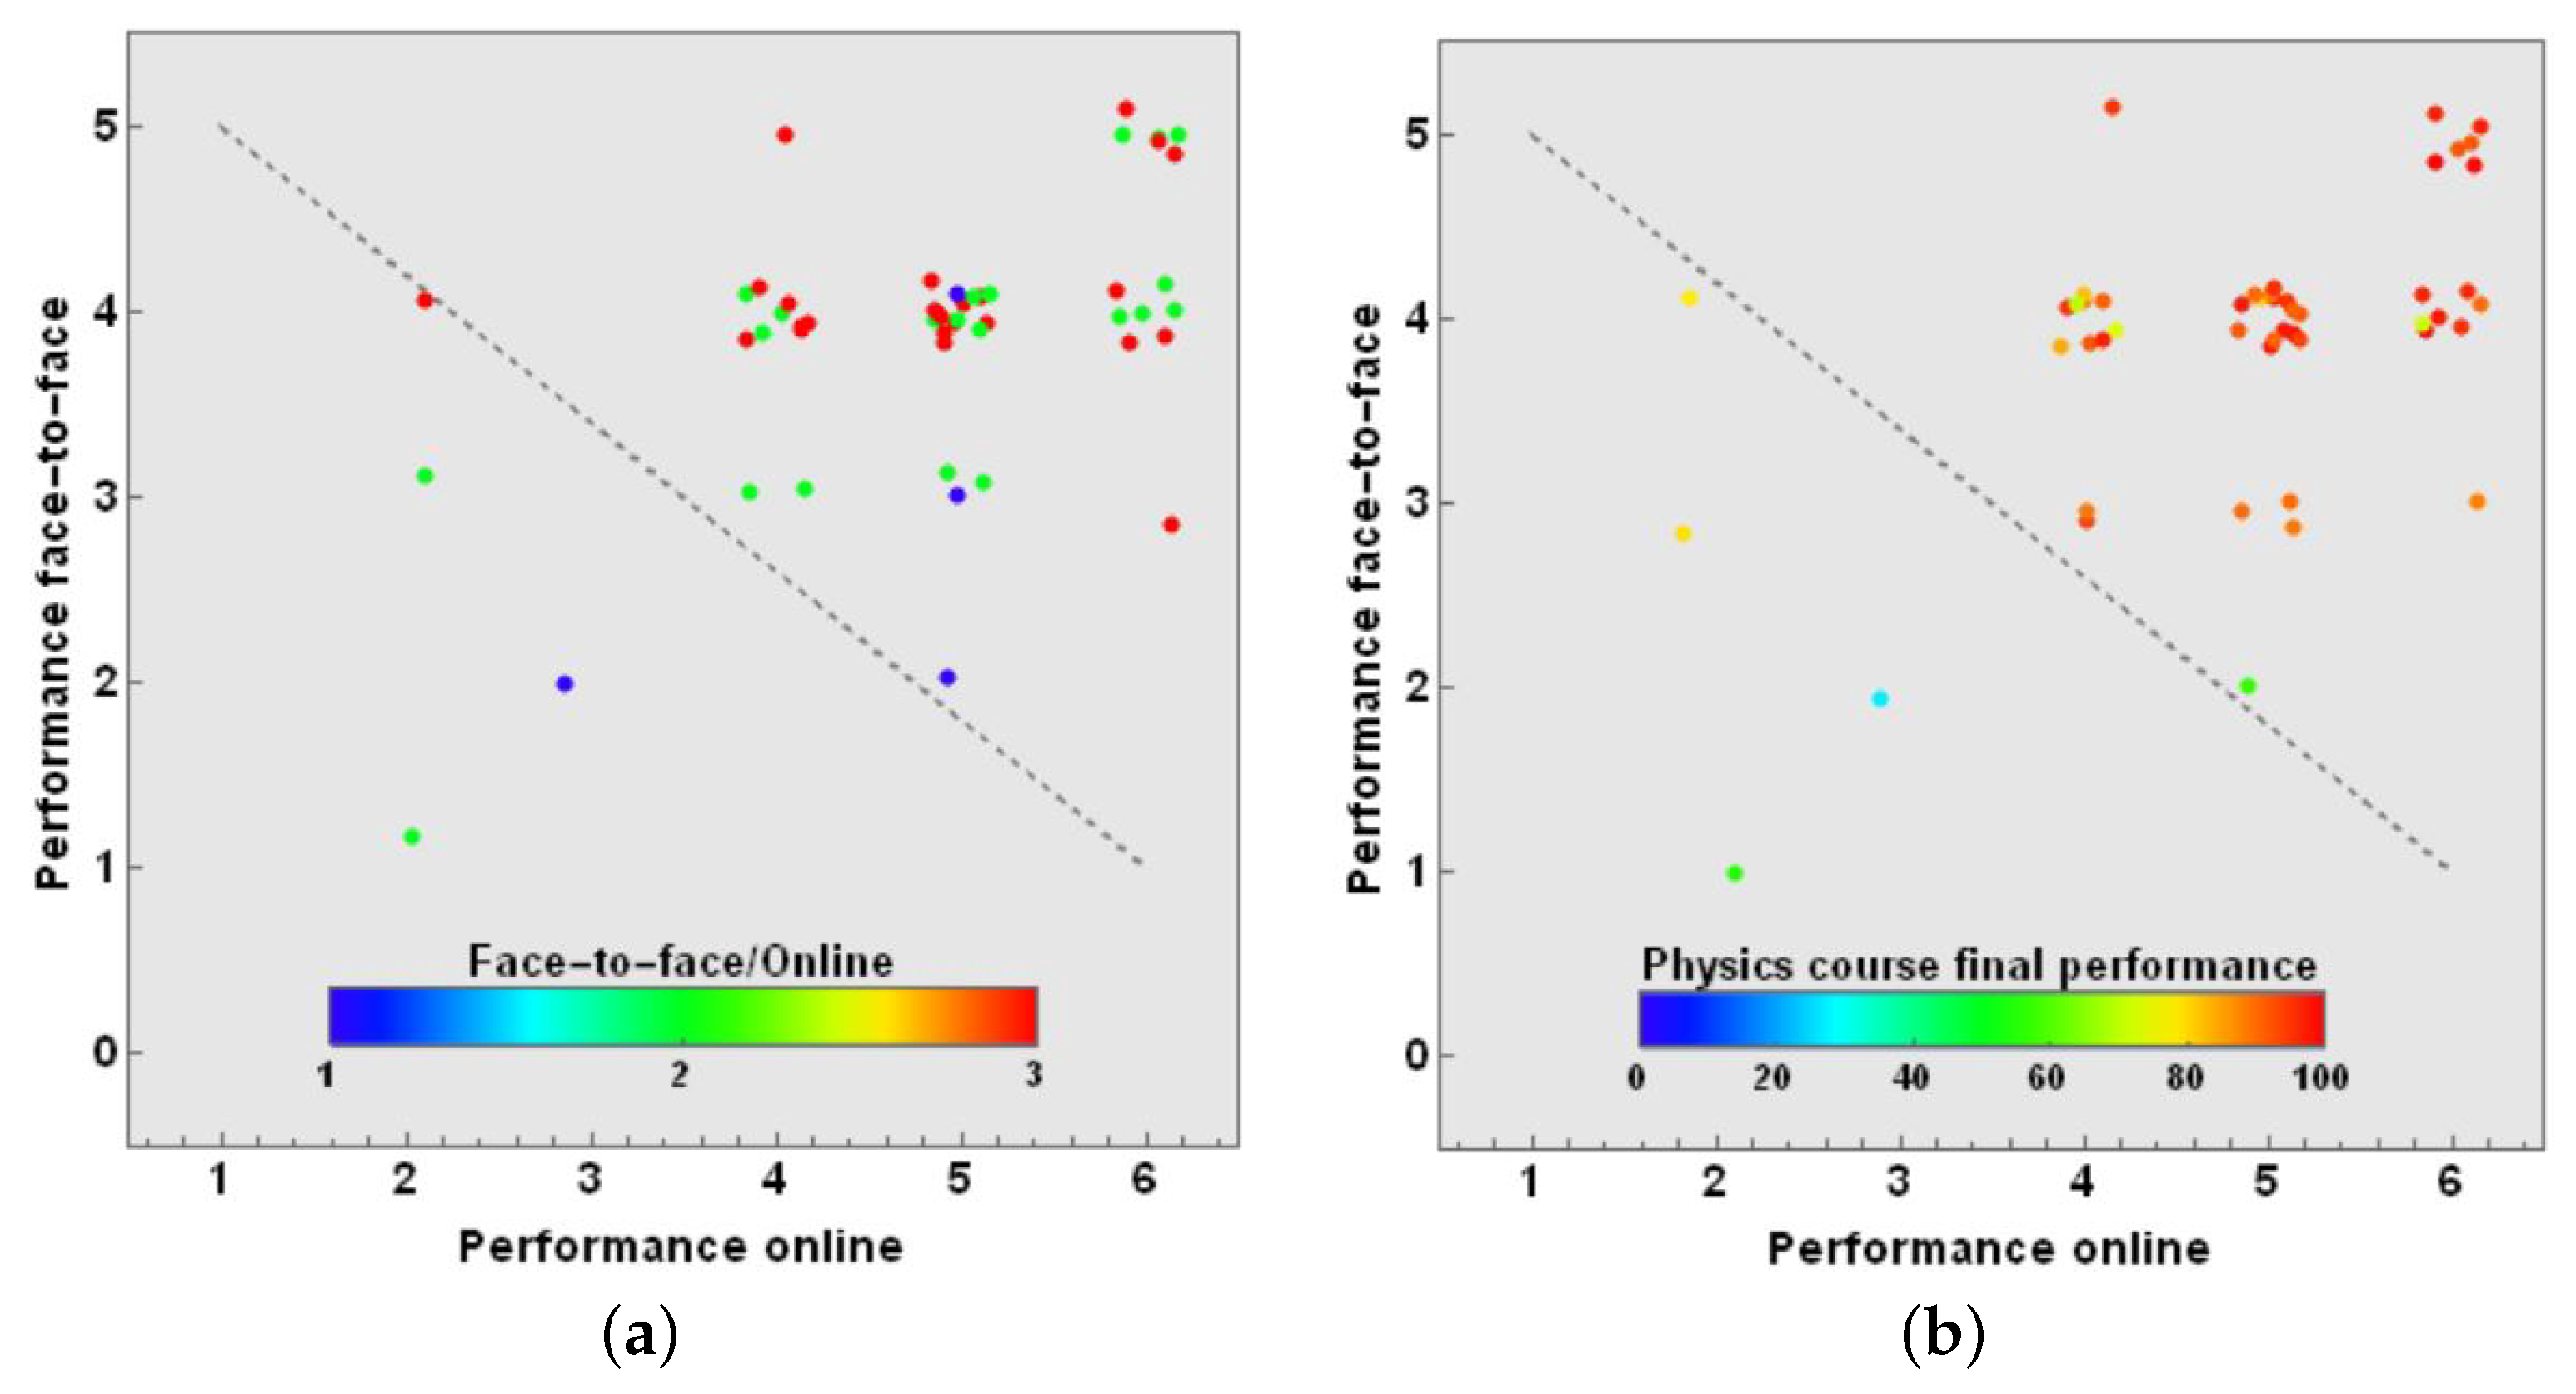
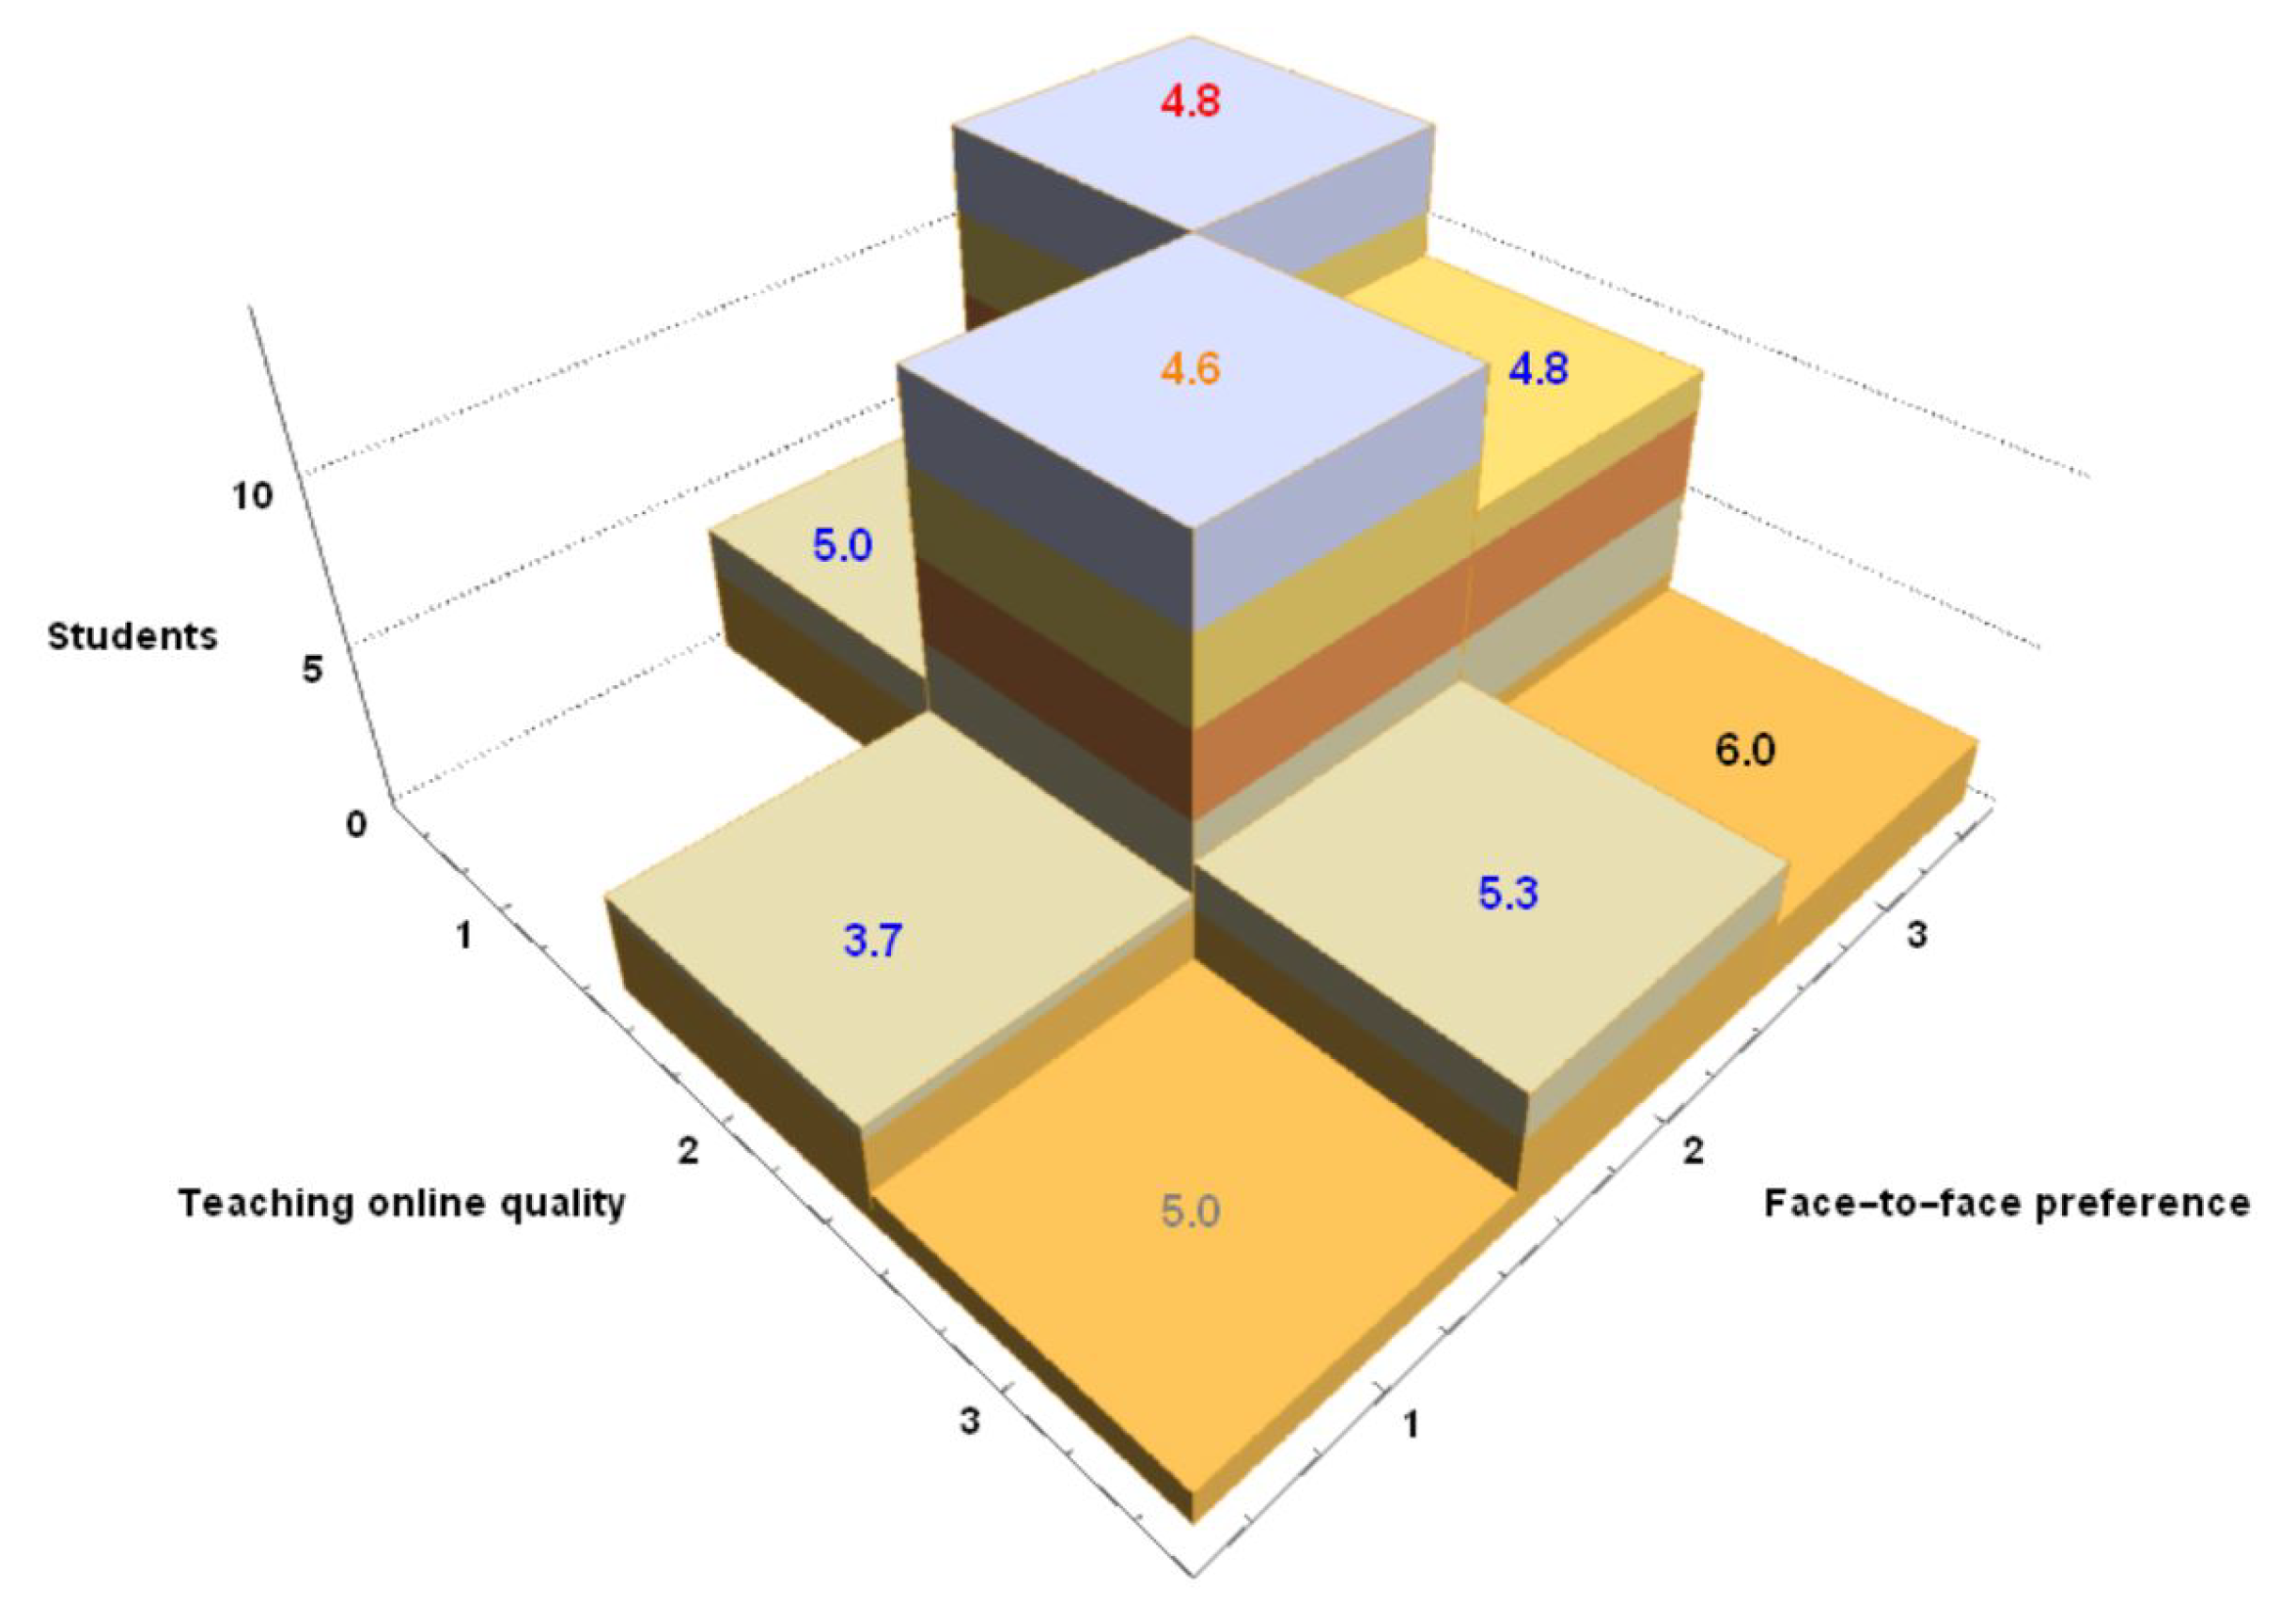
Table A1.
Raw data obtained from each student in the questionnaire in terms of Code labels of each question and Scale numbers. The last column reports the final grade for the physics course during FJ2022-1 for cohort 3.
Table A1.
Raw data obtained from each student in the questionnaire in terms of Code labels of each question and Scale numbers. The last column reports the final grade for the physics course during FJ2022-1 for cohort 3.
| ID | Q1 | Q2 | Q3 | Q4 | Q5 | Q6 | Q7 | Q8 | Q9 | Q10 | Q11 | Q12 | Q13 | Q14 | Q15 | Q16 | Q17 | Q18 | Q19 | Q20 | Q21 | Q22 | Q23 | Q24 | Q25 | Q26 | Q27 | Q28 | Q29 | Q30 | Q31 | Q32 | Q33 | Q34 | Q35 | Q36 | Q37 | Q38 | Grade |
|---|---|---|---|---|---|---|---|---|---|---|---|---|---|---|---|---|---|---|---|---|---|---|---|---|---|---|---|---|---|---|---|---|---|---|---|---|---|---|---|
| 1 | 2 | 1 | 1 | 1 | 2 | 1 | 1 | 2 | 2 | 1 | 2 | 1 | 1 | 1 | 5 | 3 | 4 | 3 | 3 | 5 | 5 | 5 | 5 | 5 | 1 | 1 | 0.75 | 1 | 1 | 1 | 2 | 2 | 3 | 2 | 1 | 4 | 3 | 3 | 78 |
| 2 | 2 | 1 | 1 | 1 | 1 | 2 | 1 | 1 | 2 | 1 | 1 | 2 | 1 | 2 | 1 | 4 | 1 | 5 | 4 | 1 | 5 | 1 | 5 | 2 | 1 | 0.5 | 0.5 | 1 | 0.5 | 0.5 | 2 | 5 | 3 | 2 | 1 | 4 | 3 | 3 | 98 |
| 3 | 1 | 1 | 2 | 1 | 1 | 2 | 2 | 1 | 2 | 1 | 1 | 2 | 2 | 1 | 1 | 3 | 4 | 5 | 2 | 1 | 3 | 2 | 4 | 5 | 1 | 0.5 | 1 | 1 | 0.5 | 1 | 2 | 5 | 2 | 2 | 1 | 4 | 3 | 2 | 98 |
| 4 | 1 | 1 | 2 | 1 | 1 | 2 | 1 | 2 | 1 | 1 | 2 | 1 | 1 | 2 | 1 | 2 | 3 | 4 | 5 | 1 | 2 | 3 | 4 | 5 | 1 | 1 | 1 | 1 | 1 | 1 | 1 | 6 | 4 | 3 | 1 | 4 | 3 | 2 | 98 |
| 5 | 1 | 1 | 1 | 1 | 1 | 2 | 1 | 1 | 2 | 1 | 1 | 1 | 1 | 2 | 2 | 5 | 4 | 3 | 1 | 1 | 2 | 5 | 4 | 3 | 0.5 | 0.5 | 0.25 | 0.5 | 0.5 | 0.5 | 2 | 6 | 2 | 1 | 1 | 4 | 2 | 3 | 99 |
| 6 | 1 | 1 | 1 | 1 | 1 | 1 | 1 | 1 | 1 | 2 | 1 | 1 | 1 | 1 | 4 | 4 | 5 | 5 | 4 | 5 | 5 | 5 | 5 | 5 | 1 | 1 | 0.75 | 1 | 0.5 | 1 | 1 | 5 | 3 | 1 | 1 | 4 | 3 | 3 | 81 |
| 7 | 2 | 1 | 2 | 2 | 1 | 2 | 1 | 1 | 1 | 1 | 2 | 1 | 1 | 1 | 3 | 5 | 2 | 1 | 4 | 4 | 3 | 2 | 1 | 5 | 1 | 1 | 1 | 1 | 1 | 1 | 2 | 5 | 2 | 1 | 1 | 3 | 1 | 2 | 90 |
| 8 | 1 | 1 | 2 | 1 | 1 | 1 | 2 | 1 | 2 | 1 | 2 | 2 | 1 | 2 | 1 | 3 | 5 | 4 | 2 | 1 | 3 | 2 | 5 | 4 | 1 | 0.5 | 0.5 | 0.5 | 0.5 | 0.5 | 2 | 5 | 4 | 2 | 1 | 3 | 2 | 1 | 90 |
| 9 | 1 | 1 | 2 | 1 | 1 | 1 | 1 | 1 | 2 | 1 | 2 | 1 | 1 | 2 | 1 | 4 | 5 | 2 | 3 | 1 | 5 | 2 | 4 | 3 | 0.5 | 0.5 | 0.75 | 1 | 0.5 | 0.5 | 2 | 6 | 3 | 3 | 1 | 5 | 3 | 2 | 99 |
| 10 | 1 | 1 | 2 | 1 | 1 | 1 | 1 | 1 | 2 | 1 | 1 | 2 | 1 | 1 | 1 | 2 | 3 | 5 | 4 | 4 | 3 | 2 | 5 | 1 | 1 | 0.5 | 0.75 | 1 | 0.5 | 0.5 | 2 | 5 | 2 | 1 | 1 | 4 | 3 | 3 | 98 |
| 11 | 1 | 1 | 2 | 1 | 1 | 1 | 1 | 1 | 1 | 2 | 2 | 2 | 1 | 1 | 4 | 5 | 3 | 1 | 2 | 2 | 1 | 3 | 5 | 4 | 1 | 0.5 | 0.5 | 0.5 | 1 | 0.5 | 2 | 5 | 3 | 3 | 1 | 4 | 2 | 2 | 94 |
| 12 | 1 | 1 | 2 | 1 | 1 | 1 | 1 | 1 | 1 | 1 | 1 | 1 | 1 | 2 | 2 | 5 | 1 | 4 | 3 | 3 | 5 | 4 | 1 | 2 | 1 | 0.5 | 0.25 | 0.5 | 0.5 | 0.5 | 2 | 4 | 2 | 3 | 1 | 4 | 2 | 2 | 92 |
| 13 | 1 | 1 | 2 | 1 | 1 | 1 | 2 | 2 | 2 | 2 | 1 | 1 | 1 | 2 | 2 | 3 | 4 | 5 | 1 | 1 | 3 | 5 | 4 | 2 | 1 | 0.5 | 0.5 | 0.5 | 0.5 | 0.5 | 2 | 5 | 2 | 1 | 1 | 3 | 3 | 2 | 89 |
| 14 | 2 | 1 | 1 | 1 | 1 | 1 | 2 | 2 | 1 | 2 | 1 | 1 | 1 | 2 | 1 | 2 | 4 | 3 | 5 | 4 | 3 | 5 | 1 | 2 | 0.5 | 1 | 1 | 0.5 | 0.5 | 1 | 2 | 4 | 2 | 1 | 1 | 4 | 3 | 3 | 96 |
| 15 | 1 | 1 | 1 | 1 | 1 | 1 | 2 | 1 | 2 | 1 | 1 | 2 | 1 | 1 | 1 | 2 | 3 | 4 | 5 | 3 | 2 | 1 | 4 | 5 | 0.5 | 0.5 | 0.5 | 0.5 | 0.5 | 0.5 | 2 | 4 | 3 | 2 | 1 | 4 | 3 | 2 | 91 |
| 16 | 1 | 1 | 2 | 1 | 1 | 1 | 1 | 2 | 2 | 1 | 2 | 2 | 1 | 2 | 1 | 2 | 3 | 5 | 4 | 1 | 3 | 5 | 2 | 4 | 1 | 1 | 0.5 | 1 | 0.5 | 1 | 2 | 5 | 2 | 2 | 1 | 4 | 2 | 3 | 95 |
| 17 | 1 | 1 | 1 | 1 | 1 | 2 | 1 | 2 | 2 | 1 | 2 | 2 | 1 | 2 | 1 | 5 | 2 | 4 | 3 | 5 | 2 | 3 | 4 | 1 | 1 | 1 | 1 | 1 | 1 | 1 | 2 | 5 | 2 | 2 | 1 | 4 | 2 | 3 | 98 |
| 18 | 1 | 1 | 1 | 2 | 1 | 1 | 2 | 1 | 1 | 1 | 1 | 1 | 1 | 2 | 1 | 4 | 5 | 3 | 2 | 4 | 2 | 5 | 1 | 3 | 0.5 | 0.5 | 0.5 | 0.5 | 0.5 | 0.5 | 2 | 4 | 3 | 1 | 1 | 3 | 2 | 2 | 94 |
| 19 | 1 | 1 | 2 | 1 | 1 | 2 | 2 | 1 | 1 | 2 | 1 | 2 | 1 | 2 | 2 | 3 | 4 | 1 | 5 | 1 | 2 | 3 | 4 | 5 | 0.5 | 0.5 | 1 | 0.5 | 0.5 | 0.5 | 2 | 2 | 2 | 2 | 1 | 1 | 2 | 2 | 56 |
| 20 | 1 | 1 | 1 | 1 | 1 | 2 | 2 | 2 | 1 | 1 | 1 | 1 | 2 | 1 | 2 | 5 | 2 | 5 | 3 | 5 | 5 | 5 | 5 | 5 | 1 | 1 | 0.75 | 0.5 | 0.5 | 1 | 2 | 4 | 2 | 2 | 1 | 4 | 2 | 3 | 89 |
| 21 | 1 | 1 | 1 | 1 | 1 | 2 | 1 | 1 | 1 | 1 | 2 | 1 | 1 | 2 | 1 | 4 | 5 | 3 | 2 | 1 | 4 | 2 | 3 | 5 | 1 | 0.5 | 0.75 | 1 | 0.5 | 0.5 | 2 | 6 | 3 | 2 | 1 | 5 | 3 | 3 | 97 |
| 22 | 2 | 1 | 2 | 1 | 1 | 1 | 1 | 1 | 1 | 1 | 2 | 2 | 1 | 2 | 5 | 3 | 2 | 1 | 4 | 1 | 3 | 2 | 4 | 5 | 1 | 1 | 0.5 | 1 | 0.5 | 0.5 | 2 | 6 | 3 | 2 | 1 | 5 | 4 | 3 | 92 |
| 23 | 2 | 1 | 2 | 1 | 1 | 1 | 2 | 1 | 2 | 1 | 1 | 1 | 1 | 1 | 3 | 2 | 1 | 3 | 1 | 1 | 2 | 1 | 3 | 3 | 0.5 | 0.5 | 0.75 | 0.5 | 0.5 | 1 | 2 | 4 | 2 | 1 | 1 | 4 | 3 | 3 | 82 |
| 24 | 1 | 1 | 2 | 1 | 2 | 2 | 1 | 1 | 1 | 1 | 2 | 2 | 2 | 2 | 1 | 2 | 3 | 4 | 5 | 1 | 2 | 3 | 4 | 5 | 0.5 | 0.5 | 0.25 | 0.5 | 0.5 | 0.5 | 2 | 6 | 4 | 3 | 1 | 5 | 4 | 3 | 97 |
| 25 | 2 | 1 | 2 | 1 | 2 | 1 | 2 | 2 | 1 | 1 | 1 | 1 | 1 | 1 | 4 | 3 | 2 | 5 | 1 | 4 | 2 | 5 | 3 | 1 | 1 | 1 | 0.25 | 1 | 0.5 | 0.5 | 1 | 6 | 3 | 3 | 1 | 4 | 4 | 3 | 90 |
| 26 | 1 | 1 | 1 | 1 | 1 | 1 | 2 | 2 | 2 | 1 | 1 | 1 | 1 | 1 | 3 | 5 | 2 | 1 | 4 | 2 | 5 | 1 | 5 | 4 | 0.5 | 0.5 | 0.5 | 1 | 0.5 | 0.5 | 2 | 4 | 2 | 2 | 1 | 4 | 2 | 2 | 73 |
| 27 | 1 | 1 | 1 | 1 | 1 | 1 | 1 | 2 | 1 | 1 | 2 | 1 | 1 | 1 | 1 | 4 | 2 | 5 | 3 | 4 | 2 | 1 | 5 | 3 | 0.5 | 0.5 | 0.5 | 0.5 | 1 | 0.5 | 2 | 6 | 4 | 1 | 1 | 4 | 4 | 3 | 96 |
| 28 | 2 | 1 | 2 | 2 | 2 | 2 | 2 | 1 | 1 | 1 | 1 | 1 | 1 | 1 | 5 | 5 | 3 | 4 | 5 | 4 | 5 | 4 | 4 | 4 | 1 | 0.5 | 0.25 | 1 | 0.5 | 0.5 | 2 | 6 | 4 | 1 | 2 | 5 | 4 | 2 | 92 |
| 29 | 1 | 1 | 2 | 1 | 1 | 2 | 1 | 1 | 2 | 1 | 2 | 2 | 1 | 2 | 5 | 5 | 4 | 4 | 5 | 5 | 5 | 4 | 4 | 5 | 0.5 | 1 | 0.5 | 0.5 | 0.5 | 0.5 | 1 | 6 | 3 | 2 | 1 | 3 | 2 | 3 | 88 |
| 30 | 1 | 1 | 1 | 1 | 1 | 2 | 1 | 1 | 1 | 1 | 2 | 1 | 1 | 1 | 3 | 1 | 5 | 4 | 2 | 2 | 3 | 5 | 4 | 1 | 1 | 1 | 0.75 | 1 | 0.5 | 1 | 2 | 6 | 4 | 2 | 1 | 4 | 2 | 2 | 96 |
| 31 | 1 | 1 | 1 | 1 | 1 | 1 | 1 | 1 | 2 | 2 | 2 | 1 | 1 | 1 | 5 | 4 | 1 | 3 | 2 | 1 | 3 | 2 | 5 | 4 | 1 | 0.5 | 0.5 | 0.5 | 0.5 | 0.5 | 2 | 5 | 3 | 1 | 1 | 4 | 3 | 3 | 92 |
| 32 | 1 | 1 | 1 | 1 | 1 | 1 | 2 | 1 | 2 | 1 | 1 | 2 | 1 | 1 | 5 | 5 | 5 | 5 | 5 | 3 | 5 | 5 | 3 | 5 | 0.5 | 0.5 | 0.25 | 0.5 | 0.5 | 0.5 | 2 | 6 | 3 | 2 | 1 | 4 | 4 | 2 | 97 |
| 33 | 1 | 1 | 1 | 1 | 1 | 1 | 1 | 2 | 1 | 1 | 2 | 1 | 1 | 2 | 5 | 5 | 5 | 5 | 5 | 5 | 5 | 5 | 5 | 5 | 0.5 | 0.5 | 0.5 | 0.5 | 0.5 | 1 | 2 | 5 | 3 | 2 | 1 | 4 | 3 | 2 | 98 |
| 34 | 1 | 1 | 2 | 1 | 1 | 2 | 1 | 1 | 2 | 1 | 2 | 2 | 1 | 2 | 5 | 5 | 5 | 5 | 5 | 5 | 5 | 5 | 5 | 5 | 0.5 | 0.5 | 1 | 0.5 | 0.5 | 0.5 | 2 | 5 | 3 | 2 | 1 | 4 | 3 | 2 | 92 |
| 35 | 1 | 1 | 1 | 1 | 1 | 2 | 2 | 1 | 2 | 1 | 1 | 2 | 1 | 1 | 1 | 3 | 2 | 5 | 4 | 5 | 2 | 4 | 3 | 1 | 0.5 | 0.5 | 0.75 | 0.5 | 1 | 0.5 | 2 | 4 | 2 | 2 | 1 | 3 | 3 | 2 | 89 |
| 36 | 1 | 1 | 2 | 2 | 1 | 1 | 2 | 1 | 2 | 2 | 2 | 2 | 1 | 1 | 5 | 5 | 4 | 2 | 5 | 5 | 5 | 5 | 5 | 5 | 1 | 1 | 1 | 0.5 | 0.5 | 1 | 2 | 6 | 4 | 2 | 1 | 4 | 3 | 2 | 72 |
| 37 | 1 | 1 | 2 | 1 | 1 | 1 | 2 | 1 | 1 | 1 | 2 | 2 | 1 | 1 | 3 | 2 | 4 | 5 | 1 | 2 | 3 | 4 | 5 | 1 | 0.5 | 0.5 | 1 | 0.5 | 0.5 | 0.5 | 1 | 4 | 1 | 2 | 1 | 4 | 2 | 3 | 84 |
| 38 | 1 | 1 | 2 | 2 | 2 | 2 | 2 | 1 | 1 | 1 | 1 | 1 | 1 | 1 | 5 | 1 | 2 | 3 | 4 | 1 | 2 | 4 | 5 | 3 | 1 | 1 | 0.5 | 0.5 | 0.5 | 1 | 2 | 4 | 3 | 1 | 1 | 4 | 3 | 3 | 70 |
| 39 | 1 | 1 | 1 | 1 | 1 | 2 | 2 | 1 | 2 | 1 | 2 | 2 | 1 | 1 | 3 | 1 | 2 | 5 | 4 | 1 | 2 | 3 | 4 | 5 | 0.5 | 0.5 | 0.25 | 0.5 | 0.5 | 0.5 | 2 | 5 | 3 | 3 | 2 | 4 | 1 | 1 | 90 |
| 40 | 1 | 1 | 1 | 1 | 1 | 1 | 1 | 1 | 1 | 1 | 1 | 1 | 2 | 1 | 3 | 3 | 3 | 3 | 3 | 1 | 2 | 3 | 4 | 5 | 1 | 1 | 1 | 0.5 | 0.5 | 0.5 | 1 | 2 | 2 | 2 | 1 | 3 | 1 | 2 | 79 |
| 41 | 2 | 1 | 1 | 2 | 1 | 1 | 1 | 1 | 2 | 1 | 1 | 1 | 2 | 1 | 1 | 3 | 2 | 5 | 4 | 1 | 3 | 2 | 5 | 4 | 1 | 0.5 | 1 | 1 | 1 | 0.5 | 2 | 5 | 3 | 1 | 1 | 4 | 3 | 3 | 88 |
| 42 | 1 | 1 | 1 | 2 | 1 | 1 | 2 | 1 | 1 | 2 | 1 | 1 | 1 | 1 | 3 | 5 | 1 | 4 | 2 | 1 | 2 | 4 | 3 | 5 | 1 | 0.5 | 0.5 | 0.5 | 0.5 | 0.5 | 2 | 4 | 2 | 1 | 1 | 5 | 3 | 3 | 95 |
| 43 | 2 | 1 | 1 | 1 | 1 | 1 | 1 | 1 | 1 | 2 | 1 | 1 | 1 | 1 | 3 | 5 | 4 | 1 | 2 | 1 | 5 | 4 | 2 | 3 | 1 | 1 | 1 | 1 | 0.5 | 1 | 2 | 5 | 2 | 1 | 1 | 4 | 3 | 3 | 91 |
| 44 | 1 | 1 | 1 | 2 | 1 | 1 | 2 | 2 | 1 | 2 | 1 | 2 | 1 | 2 | 5 | 1 | 4 | 1 | 2 | 2 | 2 | 1 | 1 | 2 | 0.5 | 0.5 | 0.5 | 0.5 | 0.5 | 0.5 | 2 | 5 | 3 | 2 | 2 | 2 | 1 | 1 | 57 |
| 45 | 1 | 1 | 1 | 1 | 2 | 2 | 2 | 1 | 1 | 1 | 2 | 2 | 1 | 1 | 5 | 4 | 2 | 3 | 1 | 2 | 1 | 3 | 4 | 5 | 0.5 | 1 | 0.75 | 0.5 | 0.5 | 0.5 | 1 | 5 | 2 | 1 | 1 | 4 | 3 | 3 | 96 |
| 46 | 1 | 1 | 2 | 1 | 1 | 1 | 1 | 2 | 2 | 1 | 2 | 2 | 2 | 2 | 5 | 1 | 4 | 3 | 2 | 4 | 2 | 3 | 1 | 5 | 0.5 | 0.5 | 0.75 | 1 | 0.5 | 1 | 2 | 3 | 1 | 2 | 2 | 2 | 4 | 1 | 27 |
| 47 | 2 | 1 | 2 | 1 | 1 | 2 | 1 | 2 | 2 | 2 | 2 | 2 | 2 | 2 | 1 | 4 | 4 | 5 | 1 | 1 | 1 | 3 | 3 | 3 | 0.5 | 0.5 | 0.25 | 0.5 | 0.5 | 0.5 | 1 | 4 | 3 | 1 | 1 | 4 | 3 | 3 | 97 |
| 48 | 1 | 1 | 1 | 2 | 1 | 1 | 2 | 1 | 1 | 1 | 1 | 2 | 1 | 1 | 1 | 1 | 5 | 5 | 1 | 1 | 1 | 2 | 3 | 1 | 1 | 1 | 1 | 1 | 0.5 | 1 | 2 | 6 | 4 | 2 | 1 | 5 | 3 | 2 | 100 |
| 49 | 1 | 1 | 2 | 1 | 1 | 2 | 2 | 1 | 1 | 1 | 1 | 1 | 1 | 1 | 5 | 3 | 1 | 2 | 4 | 4 | 1 | 3 | 2 | 5 | 1 | 0.5 | 0.5 | 1 | 0.5 | 0.5 | 1 | 5 | 3 | 2 | 1 | 4 | 2 | 2 | 91 |
References
- UNESCO. COVID-19 and Higher Education: Today and Tomorrow; UNESCO: Caracas, Venezuela, 2020. [Google Scholar]
- OECD. School Education During COVID-19: Were Teachers and Students Ready? OECD Publishing: Paris, France, 2020; Available online: http://www.oecd.org/education/Mexico-coronavirus-education-country-note.pdf (accessed on 9 September 2020).
- Green, R.; Duzor, M.; Hannas, C. Generational Catastrophe, Possible as Pandemic Creates Education Crisis: A Report for VOA News. Available online: https://www.voanews.com/covid-19-pandemic/generational-catastrophe-possible-pandemic-creates-education-crisis (accessed on 9 September 2020).
- Daniel, J. Education and the COVID-19 Pandemic. Prospects 2020, 49, 91–96. [Google Scholar] [CrossRef] [PubMed]
- European Commission. Supporting Teacher Competence Development for Better Learning Outcomes; European Commission Education and Training UE: Brussels, Belgium, 2013.
- Delgado, F.; López, C.; Gutiérrez, F. Collegiate Deployment and Assessment of a Mobile Learning Program in Higher Education; Winner Essays of FIMPES prize 2012; FIMPES: México City, México, 2012. [Google Scholar]
- Delgado, F.; Enríquez-Flores, M.; Jaimes-Nájera, A. Lessons in the Use of Technology for Science Education during COVID-19 Age under a Teachers’ Collaboration Cluster. Educ. Sci. 2021, 11, 543. [Google Scholar] [CrossRef]
- Schleicher, A. The Impact of COVID-19 on Education: Insights from Education at a Glance 2020; OECD: Paris, France, 2020; Available online: https://www.oecd.org/education/the-impact-of-covid-19-on-education-insights-education-at-a-glance-2020.pdf (accessed on 9 September 2020).
- Pownall, M.; Harris, R.; Blundell-Birtill, P. Supporting students during the transition to university in COVID-19: Five key considerations and recommendations for educators. Psychol. Learn. Teach. 2021, 21, 3–18. [Google Scholar] [CrossRef]
- ITESM. Tec, UNAM, and Other Universities Working Together Due to COVID-19. Available online: https://tec.mx/en/news/national/institution/tec-unam-and-other-universities-working-together-due-covid-19 (accessed on 1 October 2020).
- Peltonen, M.; Ruohotie, P. Learning Motivation; Otava: Keuruu, Finland, 1992. [Google Scholar]
- Gonzalez, T.; de la Rubia, M.A.; Hincz, K.P.; Comas-Lopez, M.; Subirats, L.; Fort, S.; Sacha, G.M. Influence of COVID-19 confinement on students’ performance in higher education. PLoS ONE 2020, 15, e0239490. [Google Scholar]
- Flores, T.M.J. The use of educational technology during COVID-19 increases the use of MOOCs as a training tool In education. Eur. J. Mol. Clin. Med. 2020, 7, 457–465. [Google Scholar]
- Mishra, P.; Mishra, A.; Chowhan, S. Role of Higher Education in Bridging the Skill Gap. Univers. J. Manag. 2019, 7, 134–139. [Google Scholar] [CrossRef]
- Delgado, F. Teaching Physics for Computer Science Students in Higher Education During the COVID-19 Pandemic: A Fully Internet-Supported Course. Future Internet 2021, 13, 35. [Google Scholar] [CrossRef]
- Ametepe, J.D.; Khan, N. Teaching physics during COVID-19 pandemic: Implementation and report of teaching strategies to support student learning. Phys. Educ. 2021, 56, 065030. [Google Scholar] [CrossRef]
- Schult, J.; Mahler, N.; Fauth, B.; Lindner, M.A. Did students learn less during the COVID-19 pandemic? Reading and mathematics competencies before and after the first pandemic wave. Sch. Eff. Sch. Improv. 2022. [Google Scholar] [CrossRef]
- Bröker, K.; Kastens, U.; Magenheim, J. Competences of Undergraduate Computer Science Students. In KEYCIT 2014; Padeborn University: Paderborn, Germany, 2015; pp. 77–96. [Google Scholar]
- ITESM. Tec Digital Plus Flexible Model. Available online: https://tec.mx/en/plus-digital-flexible-model (accessed on 9 September 2020).
- ITESM. Model Tec 21. Available online: https://tec.mx/en/model-tec21 (accessed on 14 May 2022).
- Delgado, F. Transforming a Blended Learning Course in Numerical Methods into a Flexible Digital Course During the COVID-19 Crisis. Int. J. of Mobile Learn. Org. 2021, 15, 332–353. [Google Scholar] [CrossRef]
- Vergara-Rodríguez, D.; Antón-Sancho, A.; Fernández-Arias, P. Variables Influencing Professors’ Adaptation to Digital Learning Environments during the COVID-19 Pandemic. Int. J. Environ. Res. Public Health 2022, 19, 3732. [Google Scholar] [CrossRef] [PubMed]
- Toto, G.; Limone, P. Motivation, Stress and Impact of Online Teaching on Italian Teachers during COVID-19. Computers 2021, 10, 75. [Google Scholar] [CrossRef]
- Boneh, M.; Feniger-Schaal, R.; Bivas, T.; Danial-Saad, A. Teachers under stress during the COVID-19: Cultural differences. Teach. Teach. 2022, 28, 164–187. [Google Scholar] [CrossRef]
- Antón-Sancho, Á.; Vergara, D.; Fernández-Arias, P. Influence of Country Digitization Level on Digital Pandemic Stress. Behav. Sci. 2022, 12, 203. [Google Scholar] [CrossRef]
- Cordova, M.; Floriani, D.E.; Gonzalez-Perez, M.A.; Hermans, M.; Mingo, S.; Monje-Cueto, F.; Nava-Aguirre, K.M.; Rodriguez, C.A.; Salvaj, E. COVID-19 and higher education: Responding to local demands and the consolidation of e-internationalization in Latin American universities. Acad. Rev. Latinoam. Adm. 2021, 34, 493–509. [Google Scholar] [CrossRef]
- Cordeiro, P.; Maxie, G.; Andy, J. Responses to COVID-19 From Non-State School Leaders in Latin America, Sub-Saharan Africa and, India: A Call for Educational Equity. Front. Educ. 2021, 6, 618323. [Google Scholar] [CrossRef]
- Dziuban, C.; Graham, C.R.; Moskal, P.D.; Norberg, A.; Sicilia, N. Blended learning: The ‘New Normal’ and emerging technologies. Int. J. Educ. Technol. High. Educ. 2018, 15, 3. [Google Scholar] [CrossRef]
- Cagiltay, N.E. Using Learning Style Theory in Engineering Education. Eur. J. Eng. Educ. 2008, 33, 415–424. [Google Scholar] [CrossRef]
- Nixon, E.; Trickey, A.; Christensen, H.; Finn, A.; Thomas, A.; Relton, C.; Montgomery, C.; Hemani, G.; Metz, J.; Walker, T.K.; et al. Contacts and behaviours of university students during the COVID-19 pandemic at the start of the 2020/2021 academic year. Sci. Rep. 2021, 11, 11728. [Google Scholar] [CrossRef]
- Rauschnabel, P.A.; Krey, N.; Babin, B.J.; Ivens, B.S. Brand management in higher education: The University Brand Personality Scale. J. Bus. Res. 2016, 69, 3077–3086. [Google Scholar] [CrossRef]
- Jessee, S.; O’Neill, P.; Dosch, R. Matching student personality types and learning preferences to teaching methodologies. J. Dent. Educ. 2006, 70, 644–651. [Google Scholar] [CrossRef] [PubMed]
- Stewart, B.L.; Goodson, C.E.; Miertschin, S.L. COVID-19 Technology Student Success Challenges: Influence of Tools and Strategies. Comput. Educ. J. 2021, 12, 2. [Google Scholar]
- Pike, G. Students’ personality types, intended majors, and college expectations: Further Evidence Concerning Psychological and Sociological Interpretations of Holland’s Theory. Res. High. Educ. 2006, 47, 801–821. [Google Scholar] [CrossRef]
- Ariani-Dewi, M. The Effect of Online Learning on the Mathematical Reasoning and Communication Ability of Students in the Covid-19 Pandemic Era. EDU-MAT J. Pendidik. Mat. 2021, 9, 1–10. [Google Scholar]
- Ramadhany, N. Analysis of Students’ Mathematical Reasoning Abilities During the COVID-19 Pandemic. In Proceedings of the International Conference on Educational Studies in Mathematics, Makassar, Indonesia, 10 August 2021; pp. 338–342. [Google Scholar]
- Sitanggang, W. Students’ mathematic problem-solving ability using problem-based learning (PBL) method e-learning in the COVID-19 pandemic. Math. Educ. J. 2021, 1, 1–9. [Google Scholar]
- Abdullah, H.; Malago, J.; Arafah, K. The Implementation of Physics Learning through Online Mode during Pandemic Covid-19 Using Metacognitive Knowledge-based Materials. J. Pendidik. IPA Indones. 2021, 10, 220–227. [Google Scholar] [CrossRef]
- Mendoza-Lizcano, S.; Palacios, W.; Medina, B. Influence of COVID-19 confinement on physics learning in engineering and science students. J. Phys. Conf. Ser. 2020, 1671, 012018. [Google Scholar] [CrossRef]
- Usak, M.; Masalimova, A.R.; Cherdymova, E.I.; Shaidullina, A.R. New playmaker in science education: COVID-19. J. Balt. Sci. Educ. 2020, 19, 180–185. [Google Scholar] [CrossRef]
- Collins, A.; Stevens, A.L. A cognitive theory of inquiry teaching. In Instructional-Design Theories and Models: An Overview of the Current Status; Reigeluth, C.M., Ed.; Lawrence Erlbaum Associates: Hillsdale, NL, USA, 1983. [Google Scholar]
- Narayan, R.; Rodriguez, C.; Araujo, J.; Shaqlaih, A.; Moss, G. Constructivism—Constructivist learning theory. In The Handbook of Educational Theories; Irby, B.J., Brown, G., Lara-Alecio, R., Jackson, S., Eds.; Information Age Publishing: Washington, DC, USA, 2013; pp. 169–183. [Google Scholar]
- Watson, J.B. Behaviourism; University of Chicago Press: Chicago, IL, USA, 1966. [Google Scholar]
- Siemens, G. Connectivism: A learning theory for the digital age. Int. J. Instr. Technol. Distance Learn. 2005, 2, 1–7. [Google Scholar]
- Felder, R. Learning and teaching styles. Engr. Educ. 1988, 78, 674–681. [Google Scholar]
- García-Cué, J.L.; Santizo-Rincón, J.A.; Alonso-García, C. Instrumentos de medición de estilos de aprendizaje. Rev. Estilos Aprendiz. 2009, 2, 1–19. [Google Scholar] [CrossRef]
- Pawlowska, D. Student Personality, Classroom Environment, and Student Outcomes: A Person-Environment Fit Analysis; Appalachian State University: Boone, NC, USA, 2011. [Google Scholar]
- Dorn, E.; Hancock, B.; Sarakatsannis, J.; Viruleg, E. COVID-19 and Education: The Lingering Effects of Unfinished Learning; McKinsey & Company: Chicago, IL, USA, 2021. [Google Scholar]
- Al-Qasemi, A.; El-Garbiah, B.; Dor-Haim, P. Teachers’ technological competence and success in online teaching during the COVID-19 crisis: The moderating role of resistance to change. Int. J. Educ. Manag. 2022, 36, 1–13. [Google Scholar]
- Akram, H.; Yingxiu, Y.; Al-Adwan, A.S.; Alkhalifah, A. Technology Integration in Higher Education During COVID-19: An Assessment of Online Teaching Competencies Through Technological Pedagogical Content Knowledge Model. Front. Psychol. 2021, 12, 736522. [Google Scholar] [CrossRef] [PubMed]
- Carretero, S.; Vuorikari, R.; Punie, Y. DigComp 2.1: The Digital Competence Framework for Citizens with Eight Proficiency Levels and Examples of Use; Publications Office of the European Union: Luxembourg, 2017. [Google Scholar]
- Wieman, C.; Gilbert, S. The Teaching Practices Inventory: A New Tool for Characterizing College and University Teaching in Mathematics and Science. CBE-Life Sci. Educ. 2017, 13, 552–569. [Google Scholar] [CrossRef] [PubMed]
- Alamro, A. Training Needs in Light of the Degree of Awareness of Modern Teaching Strategies and Their Application in the Tertiary Level during the COVID-19 Pandemic. Educ. Res. Int. 2021, 2021, 8521514. [Google Scholar] [CrossRef]
- Furey, W. The Stubborn Myth of Learning Styles. Educ. Next 2020, 20, 8–12. [Google Scholar]
- Willingham, D.; Hughes, E.; Dobolyi, D. The Scientific Status of Learning Styles Theories. Teach. Psychol. 2015, 42, 266–271. [Google Scholar] [CrossRef]
- Felder, R. Opinion: Uses, misuses, and validity of learning styles. Adv. Eng. Educ. 2020, 8, 1–16. [Google Scholar]
- Sipps, G.; Alexander, R.; Friedt, L. Item Analysis of the Myers–Briggs Type Indicator. Educ. Psychol. Meas. 2016, 45, 789–796. [Google Scholar] [CrossRef]
- Harvey, R. Reliability and Validity. In MBTI Applications: A Decade of Research on the Myers–Briggs Type Indicator; Hammer, A.L., Ed.; Consulting Psychologists Press: Palo Alto, CA, USA, 1996. [Google Scholar]
- Randall, K.; Isaacson, M.; Ciro, C. Validity and Reliability of the Myers–Briggs Personality Type Indicator. J. Best Pract. Health Prof. Divers. 2017, 10, 1–27. [Google Scholar]
- Balkhi, F.; Nasir, A.; Zehra, A.; Riaz, R. Psychological and Behavioral Response to the Coronavirus (COVID-19) Pandemic. Cureus 2020, 12, e7923. [Google Scholar] [CrossRef]
- King, G.; Murray, C.J.; Salomon, J.A.; Tandon, A. Enhancing the validity and cross-cultural comparability of measurement in survey research. Am. Political Sci. Rev. 2004, 98, 191–207. [Google Scholar] [CrossRef]
- Cohen, J. Statistical Power Analysis for the Behavioral Sciences, 2nd ed.; Erlbaum: Hillsdale, NJ, USA, 1988. [Google Scholar]
- Gelman, A. Analysis of variance? Why it is more important than ever. Ann. Stat. 2005, 33, 1–53. [Google Scholar] [CrossRef]
- Hafstad, G.S.; Augusti, E.M. A lost generation? COVID-19 and adolescent mental health. Lancet Psychiatry 2021, 8, 640–641. [Google Scholar] [CrossRef]
- Tamesberger, D.; Bacher, J. COVID-19 Crisis: How to Avoid a ‘Lost Generation’. Intereconomics 2020, 55, 232–238. [Google Scholar] [CrossRef]
- Lothridge, K.; Fox, J.; Fynan, E. Blended learning: Efficient, timely, and cost-effective. J. Forensic Sci. 2013, 45, 407–416. [Google Scholar] [CrossRef]
Figure 1.
Diagram illustrating the context of the current research report. While some individual student traits relevant to academic life are considered (here, student learning styles and academic personality have been shaped by their histories), the university structure scaffolds their potential academic success. In such an environment, online education during the COVID-19 stages was sustained. For physics courses, a minimum of specific didactic elements must be supported and developed.

Figure 2.
Average grades though time for challenge/course, math, physics, and computing as sections of the physics course (each indicated per the different gray levels for the one-standard deviation arrows in each case, showing the dispersion). Horizontal/Vertical coordinates refer to Exams/Global grades and show their corresponding dispersion arrows. The subperiods correspond to: Pre-pandemic period: (a) AD2019-1, (b) AD2019-2. Pandemic: (c) AD2020-1, (d) AD2020-2, (e) FJ2021-1, (f) FJ2021-2. ‘New Normal’: (g) AD2021-1, (h) AD2021-2 (those under a hybrid model with optional online orientation by decision of each student), (i) FJ2022-1.

Figure 3.
Average grades evolution through each sub-period (indicated with colored points in agreement with the color scale). Each grade section is reported comparing (a) challenge grade/Course grade, (b) math section: Exams/Section, (c) physics section: Exams/Section, and (d) Computation section: Exams/Section. The colors in Figure 3 correspond to each sub-period.

Figure 4.
Students’ learning styles versus Learning styles of the school as perceived by students. (a) Concrete/Abstract, (b) Visual/Verbal, (c) Deductive/Inductive, (d) Active/Reflexive, and (e) Sequential/Global.
Figure 4.
Students’ learning styles versus Learning styles of the school as perceived by students. (a) Concrete/Abstract, (b) Visual/Verbal, (c) Deductive/Inductive, (d) Active/Reflexive, and (e) Sequential/Global.

Figure 5.
(a) Distribution of main learning styles in the group surveyed, (b) Distribution of the primary school learning styles as perceived by students, (c) Distribution of primary personality traits (Extroversion/Introversion, Sensitive/Intuitive, Thinking/Feeling, Judgement/Perception), self-perceived by each student, and (d) Online performance declared (radial) and physics course performance (color) by personality traits.

Figure 6.
(a) Technological competencies (Search for information and data-ID, Communication and Collaboration-CC, Creation of digital content-CD, Computer security-CS, and TroubleshootingTS) self-perceived by each student on a scale of 1–6 (less to more), (b) Technological competencies being perceived by students on their teachers on the same scale, and (c) Main teaching strategies in the school as perceived by students (Learning organization-LO, Motivation-MO, Practice-PR, Feedback-FB, Metacognition-MC, and Social learning-SL).

Figure 7.
The incremental affinity between students and school versus the degree of inclusivity is measured as cumulative perceptions of teaching strategies. Each student is additionally characterized by their final grade quartile of the current physics course.
Figure 7.
The incremental affinity between students and school versus the degree of inclusivity is measured as cumulative perceptions of teaching strategies. Each student is additionally characterized by their final grade quartile of the current physics course.

Figure 8.
(a) Degree of adaptation to the online teaching model during the COVID-19 confinement versus self-perceived online teaching quality, with students characterized by their self-perceived performance in the online teaching model; and (b) Degree of adaptation to the face-to-face teaching model during the ‘New Normal’ versus preference of face-to-face over online teaching, with students again characterized by self-perceived performance in the face-to-face teaching model.

Figure 9.
Comparison of self-perceived performance between the online and face-to-face teaching models, showing in color (a) the preference for face-to-face over online teaching and (b) the final grade on the last face-to-face physics course.
Figure 9.
Comparison of self-perceived performance between the online and face-to-face teaching models, showing in color (a) the preference for face-to-face over online teaching and (b) the final grade on the last face-to-face physics course.

Figure 10.
Frequency comparison of Teaching online quality (Q34) and Face-to-face education preference (Q38), including the Online performance average on the top for students of cohort 3.
Figure 10.
Frequency comparison of Teaching online quality (Q34) and Face-to-face education preference (Q38), including the Online performance average on the top for students of cohort 3.

Table 1.
Groups of students considered in the research from 2019 to 2022. Three cohorts were studied as they transitioned through the pre-pandemic, confinement, and ‘New Normal’ stages. The courses, semester, number of students, and labels are in the table.
Table 1.
Groups of students considered in the research from 2019 to 2022. Three cohorts were studied as they transitioned through the pre-pandemic, confinement, and ‘New Normal’ stages. The courses, semester, number of students, and labels are in the table.
| Cohort | Cohort 1: | Fall 2019 | Cohort 2: | Fall 2020 | Cohort 3: | Fall 2021 | |||
|---|---|---|---|---|---|---|---|---|---|
| Course | Sub-Period | Semester | Studs | Sub-Period | Semester | Studs | Sub-Period | Semester | Studs |
| Kinematics–Dynamics | AD2019-1 | 1 | 51 | AD2020-1 | 1 | 56 | AD2021-1 | 1 | 62 |
| Conservation laws | AD2019-2 | 1 | 49 | AD2020-2 | 1 | 63 | AD2021-2 | 1 | 54 |
| Electricity | - | - | - | FJ2021-1 | 2 | 59 | FJ2022-1 | 2 | 57 |
| Electromagnetism | - | - | - | FJ2021-2 | 2 | 58 | - | - | - |
Table 2.
Two-way ANOVA for exam grades by course section (challenge, Math, Physics, and Computing) and pandemic sub-period.
Table 2.
Two-way ANOVA for exam grades by course section (challenge, Math, Physics, and Computing) and pandemic sub-period.
| D. F. | Sum of Squares | Mean Sq | F-Ratio | p-Value | |
|---|---|---|---|---|---|
| Section | 3 | 101,215.0 | 33,738.2 | 90.0129 | |
| Pandemic sub-period | 8 | 64,844.4 | 8105.54 | 21.6255 | |
| Error | 2020 | 757,126.0 | 374.815 | ||
| Total | 2031 | 923,185.0 |
Table 3.
Two-way ANOVA for Adaptation by Learning style and Pandemic stage.
| D. F. | Sum of Squares | Mean Sq | F-Ratio | p-Value | |
|---|---|---|---|---|---|
| Learning style | 13 | 0.9215 | 0.0709 | 1.9749 | 0.0331 |
| Pandemic stage | 1 | 0.0006 | 0.0006 | 0.0178 | 0.8943 |
| Error | 83 | 2.9791 | 0.0359 | ||
| Total | 97 | 3.9011 |
Table 4.
Two-way ANOVA for Adaptation by Personality trait and Pandemic stage.
| D. F. | Sum of Squares | Mean Sq | F-Ratio | p-Value | |
|---|---|---|---|---|---|
| Personality trait | 10 | 0.5923 | 0.0593 | 1.5397 | 0.1393 |
| Pandemic stage | 1 | 0.0006 | 0.0006 | 0.0166 | 0.8978 |
| Error | 86 | 3.3082 | 0.0385 | ||
| Total | 97 | 3.9011 |
Table 5.
Two-way ANOVA on the normalized performance by Learning style and Pandemic stage.
| D. F. | Sum of Squares | Mean Sq | F-Ratio | p-Value | |
|---|---|---|---|---|---|
| Learning style | 13 | 0.4473 | 0.0344 | 1.0240 | 0.4368 |
| Pandemic stage | 1 | 0.0200 | 0.0200 | 0.5953 | 0.4426 |
| Error | 83 | 2.7886 | 0.0336 | ||
| Total | 97 | 3.2558 |
Table 6.
Two-way ANOVA for the normalized performance by Personality trait and Pandemic stage.
| D. F. | Sum of Squares | Mean Sq | F-Ratio | p-Value | |
|---|---|---|---|---|---|
| Personality trait | 10 | 0.7397 | 0.0740 | 2.5487 | 0.0096 |
| Pandemic stage | 1 | 0.0200 | 0.0200 | 0.6891 | 0.4088 |
| Error | 86 | 2.4961 | 0.0290 | ||
| Total | 97 | 3.2558 |
Publisher’s Note: MDPI stays neutral with regard to jurisdictional claims in published maps and institutional affiliations. |
© 2022 by the author. Licensee MDPI, Basel, Switzerland. This article is an open access article distributed under the terms and conditions of the Creative Commons Attribution (CC BY) license (https://creativecommons.org/licenses/by/4.0/).
Share and Cite
MDPI and ACS Style
Delgado, F. Post-COVID-19 Transition in University Physics Courses: A Case of Study in a Mexican University. Educ. Sci. 2022, 12, 627. https://0-doi-org.brum.beds.ac.uk/10.3390/educsci12090627
AMA Style
Delgado F. Post-COVID-19 Transition in University Physics Courses: A Case of Study in a Mexican University. Education Sciences. 2022; 12(9):627. https://0-doi-org.brum.beds.ac.uk/10.3390/educsci12090627
Chicago/Turabian StyleDelgado, Francisco. 2022. "Post-COVID-19 Transition in University Physics Courses: A Case of Study in a Mexican University" Education Sciences 12, no. 9: 627. https://0-doi-org.brum.beds.ac.uk/10.3390/educsci12090627
Note that from the first issue of 2016, this journal uses article numbers instead of page numbers. See further details here.