
Professional Development and Teacher Job Satisfaction: Evidence from a Multilevel Model

Department of Work and Organisation Studies, Faculty of Economics and Business, Campus Antwerp, KU Leuven, BE-2000 Antwerp, Belgium
Mathematics 2022, 10(1), 51; https://0-doi-org.brum.beds.ac.uk/10.3390/math10010051
Submission received: 30 November 2021
/
Revised: 19 December 2021
/
Accepted: 22 December 2021
/
Published: 24 December 2021
(This article belongs to the Special Issue Economics of Education: Quantitative Methods for Educational Policies)
Abstract
:Numerous studies in different countries find evidence for high rates of teacher turnover, leading to shortages and potential quality issues. Job satisfaction is found to be an important antecedent of turnover. In this study, we investigate the impact of various aspects of professional development for teachers (as well as interactions of these aspects) on job satisfaction. The main goal is to disentangle the interactions between need for and participation in professional development activities, allowing more detailed and precise analyses that may lead to a better substantiated understanding of the mechanisms at work. We use data from the 2018 wave of the OECD’s Teaching and Learning International Survey (TALIS). The hierarchical data structure of teachers nested in schools, nested in regions requires the use of appropriate estimation techniques: multilevel or hierarchical linear modelling (HLM). We find a significant positive relationship between job satisfaction and need for professional development for teaching diversity and special needs, which is (negatively) moderated by the number of professional development activities a teacher had participated in. Another indicator, measuring the need for professional development in subject matter and pedagogy, shows a significant negative relationship with job satisfaction and is (positively) moderated by the amount of professional development.
1. Introduction
It is widely acknowledged that teachers and teacher quality are a crucial factor in the learning process and learning outcomes of students [1,2,3,4,5].
However, in many countries, there is increasing tension in the teacher labor market, leading to shortages of teachers. Inflow in teacher education training is weak, and turnover rates (both of starting teachers and more experienced teachers) are high [6,7,8,9]. A recent overview identifies 35 education systems (countries and/or regions) across Europe with a shortage of teachers [6].
1.1. Teacher Turnover
Teacher turnover and teacher shortages may lead to several negative consequences, e.g., on teacher quality, student learning and performance, school effectiveness, and on educational costs [7,10,11,12,13].
However, it should be acknowledged that teacher turnover does not necessarily have to be harmful, e.g., if the least effective teachers would resign [14], the average quality of those staying could increase. Some studies find evidence for this hypothesis, especially for novice teachers leaving in the first year(s) of their career [15]. Krieg [16] finds that better performing women teachers are less likely to resign [16].
In the literature on teacher turnover, a distinction is made between teacher mobility and teacher migration (i.e., teachers moving from one teaching assignment to another teaching assignment) on the one hand and attrition (i.e., teachers leaving the profession) on the other hand [17,18,19]. The former may lead to temporary shortages in particular schools (due to a certain time that is needed to hire a new teacher to replace the leaving one). The latter could be considered worse, since these teachers leave the profession, leading to more persistent shortages and loss or suboptimal use of human capital.
Ingersoll [7] coined the term ‘revolving door’ to characterize the turnover on the teacher labor market, indicating that a large share of teacher attrition can be attributed to teachers leaving the profession to pursue a career outside education, rather than teachers leaving the profession due to retirement [7].
Teacher attrition rates vary considerably across countries and may also differ depending on gender, ethnicity or race, age group, type of institution (i.e., public vs. private schools), wage, educational level (e.g., primary vs. secondary education), type of contract, qualification, study field, and working conditions [13,17,19,20,21,22].
1.2. Job Satisfaction of Teachers
On a more conceptual level, many studies argue that job satisfaction is an antecedent of turnover [7,8,23,24,25,26,27,28,29,30]. It is, therefore, both from a policy perspective as well as from an academic research perspective, important and relevant to investigate the determinants of job satisfaction, since job satisfaction is a determinant and leading indicator for turnover.
Since there is no single unique definition of the concept of ‘job satisfaction’, many variants and constructs co-exist [8,23,31]. A ‘classic’ definition proposed by Locke [32] is: “job satisfaction is the pleasurable emotional state resulting from the appraisal of one’s job as achieving or facilitating the achievement of one’s job values” [32].
The literature on job satisfaction of teachers reveals several potential predictors of teacher satisfaction: e.g., teacher self-efficacy [28,30,33,34,35,36,37,38,39,40], classroom discipline and school climate [23,27,34,36,37], student engagement, behavior, and achievement [8,23,27,29,30,33,35,36,37,38,39], several stress factors (e.g., workload stress, classroom stress, time stress, etc.) [8,28,29,35,36,37,38,39], professional collaboration, school leadership, and mentorship [8,23,27,28,29,36,39], work conditions and compensation [27,30,37,41], teacher–student relationship [27,37,38,39], and access to (or barriers to access) professional development [23,28,29,30,39,40,41,42].
In addition to these substantive variables, often used control variables to be included are: teacher age, gender, race or minority, teacher experience, type of contract, teaching level, highest qualification, school size, school location (urbanity), average SES of students, number of special needs students, and public vs. private school [8,23,27,28,29,30,35,36,37,38,39,40,41,43,44].
1.3. Professional Development of Teachers
Many studies stress the importance of professional development for teachers [6,45,46,47] and investigate several aspects of it, e.g., the design of effective professional development programs for teachers [48], the satisfaction of teachers with professional development programs [49,50], the impact of professional development of teachers on teachers’ learning and their effectiveness [5,51,52,53], and the impact of professional development on retention [54].
However, relatively little research has been performed on the potential impact of both access to professional development as well as the need for professional development on job satisfaction of teachers. Most studies relating professional development with job satisfaction find a positive impact of professional development on job satisfaction [23,28,29,30,39,40,41,42]. However, Nang Sein and Yan [55] investigated perceptions towards professional development in a very specific setting (i.e., one school in Myanmar) and found no significant relationship between teacher job satisfaction and their perceptions towards professional development [55].
Professional development activities for teachers may include attending (online or in person) courses or seminars, reading professional literature, attending education conferences or workshops, peer and/or self-observation and coaching, participation in a network of teachers, observation visits to and exchanges with other schools, attending a formal qualification program, etc. [6,28,40,48,49,50].
1.4. Research Rationale and Goals
In this paper, we contribute to this literature by carefully investigating the impact of (1) having participated in various professional development activities, (2) the need teachers feel for (additional) professional development, and (3) the interaction of participation and need on job satisfaction. To our best knowledge, this interaction between participation and need has not yet been investigated.
We think it is useful and interesting to explore these (interacting) relationships in depth, both from an academic as well as from a policy and applied point of view; disentangling the interactions allows more detailed and precise analyses and may lead to a better substantiated understanding of the mechanisms at work. In addition, the insights gained could help develop more effective professional development schemes, targeted to specific (heterogeneous) subgroups of teachers with distinct levels of needs.
We hypothesize that the relationship between need for professional development and job satisfaction is moderated by the ability to participate in professional development activities. Consistent with a large body of literature, we expect that higher participation is associated with higher job satisfaction rates [23,28,29,30,39,40,41,42]. Regarding the relationship between need for professional development and job satisfaction and the moderating effect of participation, there is little prior knowledge form earlier literature to directly support a hypothesis. However, we expect that higher need will be associated with lower levels of job satisfaction: if teachers feel they have a high need for professional development, they may face some barriers and difficulties in their teaching process that may result in lower job satisfaction. Regarding the potential moderating effect of participation in professional development activities on the relationship between need and job satisfaction, we expect (given the positive effect of participation on job satisfaction that is found in the literature) that more participation in professional development activities might compensate the hypothesized negative relationship between need and job satisfaction, i.e., we expect positive sign of the interaction effect resulting in the slope becoming less negative with increasing values of participation.
In order to investigate this, we use a large scale international dataset collected by OECD, more specifically, the 2018 version of the Teaching and Learning International Survey (TALIS) [56], to estimate a multilevel model (also known as hierarchical linear model (HLM)) explaining job satisfaction of teachers. In addition to the professional development variables that were already mentioned, we added several other (control) variables that were found to be relevant in the earlier literature on this topic. We find that the number of professional development activities participated in has a positive relationship with job satisfaction. Regarding the need for professional development, two indicators capturing two distinct need aspects were used: the need for professional development for teaching diversity and special needs and need for professional development in subject matter and pedagogy. The former shows a positive relationship with job satisfaction for teachers who did not participate in any professional development activities. This positive relationship becomes less positive (and becomes eventually negative) with increasing values of participation. The latter need indicator reveals an opposite relationship: initially (i.e., with no participation in professional development), we find a negative slope becoming less negative (and eventually becoming positive) with increasing values of participation.
2. Materials and Methods
In order to analyze the relationship between teacher job satisfaction and professional development participation and needs, we will use data from TALIS 2018, which was collected by OECD [56], and estimate a multilevel model.
2.1. Data
Data for this study was obtained from the Teaching and Learning International Survey (TALIS), an international survey specifically targeted to teachers and school principals. To date, three cycles of the survey have been conducted: in 2008, 2013, and 2018. Throughout this study, we will use the most recent 2018 wave, hereafter abbreviated as TALIS 2018.
The main survey of TALIS 2018, focusing on ISCED level 2 (i.e., lower secondary education), was conducted in 31 OECD countries and regions, as well as in 17 non-OECD countries and regions, and includes 9 themes: teachers’ instructional practices, school leadership, teachers’ professional practices, teacher education and initial preparation, teacher feedback and development, school climate, job satisfaction, teacher human resource issues and stakeholder relations, and teacher self-efficacy [57]. To ensure sufficient quality of the data gathered, a two-stage stratified sampling procedure was used, and strict requirements regarding sampling and participation rates were imposed, e.g., a minimum sample of 200 schools per region, a minimum sample of 20 teachers within each participating school, and a participation rate exceeding 75% of the sampled schools [57]. Moreover, after collecting the data, rigorous checks, cleaning, and labeling were performed to ensure consistency of the data. This quality assurance process was implemented at two levels: first, on the national level, several checks were executed to detect inconsistencies, duplicate records, or erroneous data entry. Subsequently, multiple structure, validation, and consistency checks were performed at the overall international OECD-level [57]. In addition to data cleaning, consistency checks, and labelling of the data, OECD also constructed a number of new variables derived from original survey items. The procedures, including various underlying analyses, are described in depth in the TALIS 2018 technical report [58].
For this paper, we restricted the TALIS 2018 data to European countries (in order to avoid excessive heterogeneity due to large differences in educational systems (e.g., European vs. North American vs. Asian systems)). Hence, we initially started with 24 European countries. However, some countries did have missing data for all their respondents on a number of independent variables (e.g., the highest qualification of the teacher or school size): these countries (Bulgaria, Italy, Netherlands, Romania, and Spain) were removed from dataset. In addition, Belgium was split into 2 regions (since competence for educational policy has been transferred to the regional level and the 2 regions participated separately in the TALIS 2018 survey): the Dutch-speaking part and the French-speaking part of the country. Our final sample thus consisted of 20 regions/countries.
In Table 1, some descriptive statistics are presented for all variables used in the forthcoming analyses: for continuous variables, the mean and standard deviation are presented, and for categorical variables, the share of every category was included in the table. Inclusion of these variables is motivated by previous studies investigating various aspects of determinants of job satisfaction: see more elaborate overview in Section 1.2 [8,23,27,28,29,30,33,34,35,36,37,38,39,40,41,43,44]. The share of missing observations is reported in the last column and is rather limited, ranging from 0% to a maximum of 5.3% for employment status.

Table 1.
Descriptions.
| TALIS 2018 Code of Variable | Description of Variable | Mean | S.D. | % Missing |
|---|---|---|---|---|
| t3jobsa * | Dependent variable Teacher job satisfaction | 12.1 | 2.0 | 4.1% |
| Independent variables | ||||
| tt3g01 | Gender | 0.0% | ||
| Women | 73.1% | |||
| Men | 26.9% | |||
| tt3g03 | Highest qualification | 0.2% | ||
| Below ISCED 3 | 0.3% | |||
| ISCED 3 | 1.4% | |||
| ISCED 4 | 0.3% | |||
| ISCED 5 | 4.2% | |||
| ISCED 6 | 36.3% | |||
| ISCED 7 | 56.0% | |||
| ISCED 8 | 1.5% | |||
| Tchagegr | Teacher age group | 0.1% | ||
| Under 25 | 1.7% | |||
| 25–29 | 8.1% | |||
| 30–39 | 24.2% | |||
| 40–49 | 29.8% | |||
| 50–59 | 26.8% | |||
| 60 and above | 9.3% | |||
| tt3g08 | Teaching as first career choice | 0.8% | ||
| Yes | 68.8% | |||
| No | 31.2% | |||
| tt3g09 | Contract type | 0.9% | ||
| Permanent | 85.4% | |||
| Fixed-term > 1 year | 4.7% | |||
| Fixed-term < 1 year | 9.9% | |||
| tt3g10b | Employment status | 5.3% | ||
| Full-time (>90% of FT) | 81.3% | |||
| Part-time (71–90% of FT) | 9.0% | |||
| Part-time (50–70% of FT) | 5.6% | |||
| Part-time (<50% of FT) | 4.1% | |||
| tt3g11b | Years of experience | 17.6 | 11.1 | 1.0% |
| tt3g21a | Having a mentor | 2.6% | ||
| Yes | 5.2% | |||
| No | 94.8% | |||
| tt3g21b | Being a mentor | 2.5% | ||
| Yes | 8.5% | |||
| No | 91.5% | |||
| Constructed by author based on tt3g22a up to tt3g22j: PD_number | Number of prof. dev. activities participated in | 3.8 | 2.1 | 0.0% |
| t3pdiv * | Need for prof. dev. for diversity and special needs | 9.9 | 2.0 | 3.0% |
| t3pdped * | Need for prof. dev. in subject matter and pedagogy | 9.5 | 1.8 | 2.8% |
| tt3g14 | Special needs students | 1.0% | ||
| None | 10.2% | |||
| Some | 84.2% | |||
| Most | 4.3% | |||
| All | 1.3% | |||
| tc3g10 | School location | 3.2% | ||
| Village (up to 3000 people) | 15.2% | |||
| Small town (3001–15,000) | 29.1% | |||
| Town (15,001–100,000) | 31.5% | |||
| City (100,001–1,000,000) | 18.3% | |||
| Large city (>1,000,000) | 6.0% | |||
| tc3g12 | Publicly or privately managed school | 3.1% | ||
| Public | 83.0% | |||
| Private | 17.0% | |||
| Nenrstud | School size | 3.7% | ||
| Under 250 | 19.0% | |||
| 250–499 | 33.2% | |||
| 500–749 | 25.9% | |||
| 750–999 | 12.3% | |||
| 1000 and above | 9.7% | |||
| t3pdeli * | School delinquency and violence | 7.0 | 1.9 | 4.5% |
| t3stud * | Teacher-student relations | 13.3 | 1.8 | 3.6% |
| t3self * | Teacher self-efficacy | 12.7 | 1.8 | 3.3% |
| t3stbeh * | Student behavior stress | 9.2 | 1.9 | 3.7% |
| t3wels * | Workplace well-being and stress | 9.4 | 2.0 | 3.5% |
| t3wload * | Workload stress | 9.2 | 1.9 | 3.7% |
Note: an asterisk (*) attached to a variable name indicates that this variable is a scale variable constructed by OECD by means of confirmatory factor analysis (CFA) on underlying items. Detailed information on the procedure and computation can be found in the TALIS 2018 technical report [58]. Source: made by author, based on TALIS 2018 [56].
In Table 2, we provide some more detailed insight in the key variables of interest, i.e., the dependent variable job satisfaction (t3jobsa) and the independent variables capturing the participation in professional development activities (PD_number) on the one hand and the need for professional development for teaching diversity (t3pdiv) and need for professional development in subject matter and pedagogy (t3pdped) on the other hand. We notice that the variable measuring the number of professional development activities teachers were participating in the 12 months prior to the survey varies considerably across countries, ranging from an average of 2.38 in France to 6.02 in Lithuania (the individual range is from 0 is 10). The other variables clearly show less variation across countries.
Table 2.
Job satisfaction and professional development across regions (mean values per region).
| Country | t3jobsa | PD_Number | t3pdiv | t3pdped |
|---|---|---|---|---|
| Belgium (Dutch) | 12.23 | 3.48 | 9.60 | 9.40 |
| Belgium (French) | 11.92 | 2.51 | 10.27 | 9.55 |
| Austria | 12.08 | 3.84 | 9.91 | 9.49 |
| Croatia | 12.05 | 4.66 | 9.90 | 9.50 |
| Cyprus | 12.05 | 3.37 | 9.88 | 9.48 |
| Czech Republic | 12.09 | 3.81 | 9.89 | 9.48 |
| Denmark | 11.98 | 3.12 | 9.94 | 9.45 |
| Estonia | 12.10 | 4.90 | 9.94 | 9.50 |
| Finland | 12.05 | 3.43 | 9.89 | 9.48 |
| France | 12.00 | 2.38 | 9.95 | 9.48 |
| Hungary | 11.99 | 3.94 | 9.91 | 9.45 |
| Latvia | 12.11 | 5.11 | 9.91 | 9.43 |
| Lithuania | 12.03 | 6.02 | 9.96 | 9.49 |
| Malta | 12.13 | 3.01 | 9.92 | 9.46 |
| Norway | 12.08 | 3.24 | 9.90 | 9.45 |
| Portugal | 12.06 | 2.88 | 9.91 | 9.48 |
| Slovak Republic | 12.06 | 3.38 | 9.85 | 9.45 |
| Slovenia | 12.08 | 4.72 | 9.92 | 9.48 |
| Sweden | 12.14 | 3.74 | 9.92 | 9.43 |
| England (UK) | 12.02 | 3.79 | 9.94 | 9.50 |
Source: made by author, based on TALIS 2018 [56].
2.2. Model
In order to obtain unbiased estimates, it is necessary to account for the multilevel structure of the data: teachers are nested in schools, and schools are nested in regions, violating the assumption that all observations are independent. Because teachers within a school probably share some common characteristics (e.g., local labor market, school policy, student characteristics, etc.), these observations will be non-independent. Failing to account for this non-independence may lead to biased results and invalid statistical inference. In order to overcome this potential fallacy, the use of hierarchical linear modelling (HLM) or multilevel modeling is appropriate [59,60,61,62]. These models specifically account for the (nested) multilevel structure of the data. In this particular dataset, teachers are nested in 3128 schools, and schools are nested in 20 regions. We estimate a model with random intercepts at school (i.e., level 2) and region (i.e., level 3) level and include predictors at teacher and school level (see Section 2.1 for an overview of the variables used).
In order to assess whether the impact of the two variables measuring need for professional development on job satisfaction is moderated by the number of professional development activities teachers participated in, we include the interaction of the two need variables with the number of professional development activities.
3. Results
Table 3 presents the estimation results of our three-level model with random intercepts at region (level 3) and school (level 2) level. The random effects parameters at the bottom of the table indicate that it was appropriate to estimate a multilevel model with three levels: the variance of the level 3 (i.e., region) errors is estimated as 0.026 with standard error 0.007, while the variance of the level 2 (i.e., schools) errors is estimated as 0.364 with standard error 0.038. Sample sizes of the three levels were: 20 regions, 3128 schools, and 49,378 teachers.
Before proceeding with interpreting the estimation results, it is necessary that the assumptions of hierarchical linear modeling are not violated. First, the inherent non-independence of observations in the nested data structure (see Section 2.2) is explicitly accounted for by estimating a multilevel model [59,60,61,62]. Second, the model should be specified substantively correctly (i.e., all relevant variables should be included): all variables included in the model were derived from earlier literature investigating various determinants of job satisfaction (see Section 1.2 and Section 1.3). In addition, the residuals of the model presented in Table 3 were carefully examined and shown to be normally distributed with mean zero. Correlations between level 1 residuals and higher-level residuals were close to zero. Possible heteroscedasticity was accounted for by estimating Huber–White robust standard errors. As an additional robustness check, the model was re-estimated with fixed intercepts (to account for the multilevel structure) instead of random intercepts: parameter estimates of this fixed-effects model did not reveal substantial differences in parameter estimates from the model with random intercepts. Hence, we conclude that the random-effects model in Table 3 is correctly specified.
The first group of variables Table 3 consist of variables capturing individual teacher characteristics. Men are less satisfied than women in the teaching profession, and the highest qualification obtained by the teacher is (as a group) also significant (as indicated by the Chi2 value and the associated p-value). However, none of the separate qualification levels is individually significant at the 5% level. Age group is, as a whole significant, and most of the individual categories are also significant: exploring the coefficients shows an approximately U-shaped form of the impact of age on job satisfaction. Being a teacher although teaching was not their first career choice has a significant negative effect on job satisfaction.
A second group of variables measures different aspects of the current teaching assignment and teacher profession. The type of contract (i.e., a permanent vs. a fixed-term contract) and employment status (i.e., a full-time vs. part-time contracts) are not significant. Years of experience as a teacher is significantly negative, and not having a mentor assigned or not being a mentor is also significantly negative.
A third group of variables focuses on professional development needs and participation in professional development activities in the 12 months prior to the survey. These variables are the key variables of interest in this study. We included three variables: (1) the number of professional development activities the teacher participated in; (2) the need for professional development for diversity and special needs; and (3) the need for professional development in subject matter and pedagogy. In addition, we included an interaction between the number of professional development activities participated in on the one hand and the two need variables on the other hand. Both main effects of the need variables are significant: the need for professional development for diversity and special needs is positively sloped (if the teacher did not participate in any professional development activities), while the need for professional development in subject matter and pedagogy is negatively sloped (if the teacher did not participate in any professional development activities). The interaction term of number of activities with need for professional development for diversity is negative, implying that the positive slope of the main effect (i.e., if there was no participation in professional development activities) becomes less positive if the number of professional development activities participated in increases. The interaction term of number of activities with need for professional development in subject matter is positive, implying that the negative slope of the main effect (i.e., if there was no participation in professional development activities) becomes less negative if the number of professional development activities participated in increases.
A fourth group of variables captures distinct school characteristics. The share of special needs student in a school is (as group) significant. School location is also significant: the individual categories of this variable suggest that job satisfaction decreases with the size of the town the school is located in. Teachers in privately managed schools show higher job satisfaction than teachers working in publicly managed schools. School size is (as group) not significant, and all individual categories of this variable are not significant at the 5% level. A final variable capturing school characteristics measures the degree of school delinquency and violence: a higher degree of school delinquency is associated with lower job satisfaction.
A final group of variables measures teachers’ subjective feelings about a number of job-related issues. Good teacher–student relations and teacher self-efficacy are significantly positively related to job satisfaction, while the three stress variables (student behavior stress, workplace stress, and workload stress) are all negatively related to the degree of job satisfaction.
In the following paragraphs, we further elaborate on the impact of our key variables of interest, i.e., the various aspects of professional development and their impact on job satisfaction of teachers. In Table 3, we already noticed that both main effects of (1) the need for professional development for diversity and special needs (t3pdiv) and (2) the need for professional development in subject matter and pedagogy (t3pdped) were significant: the former having a positive slope and the latter having a negative slope. These main effects can be interpreted as such when the number of professional development activities participated in in the 12 months prior to the survey was equal to zero (the PD_number variable in the interaction terms). Interestingly, both interaction terms have an opposite effect: the first one making the positive slope of t3pdiv less positive with increasing participation in professional development activities, while the second one makes the negative slope of t3pdped less negative with increasing participation in professional development activities.
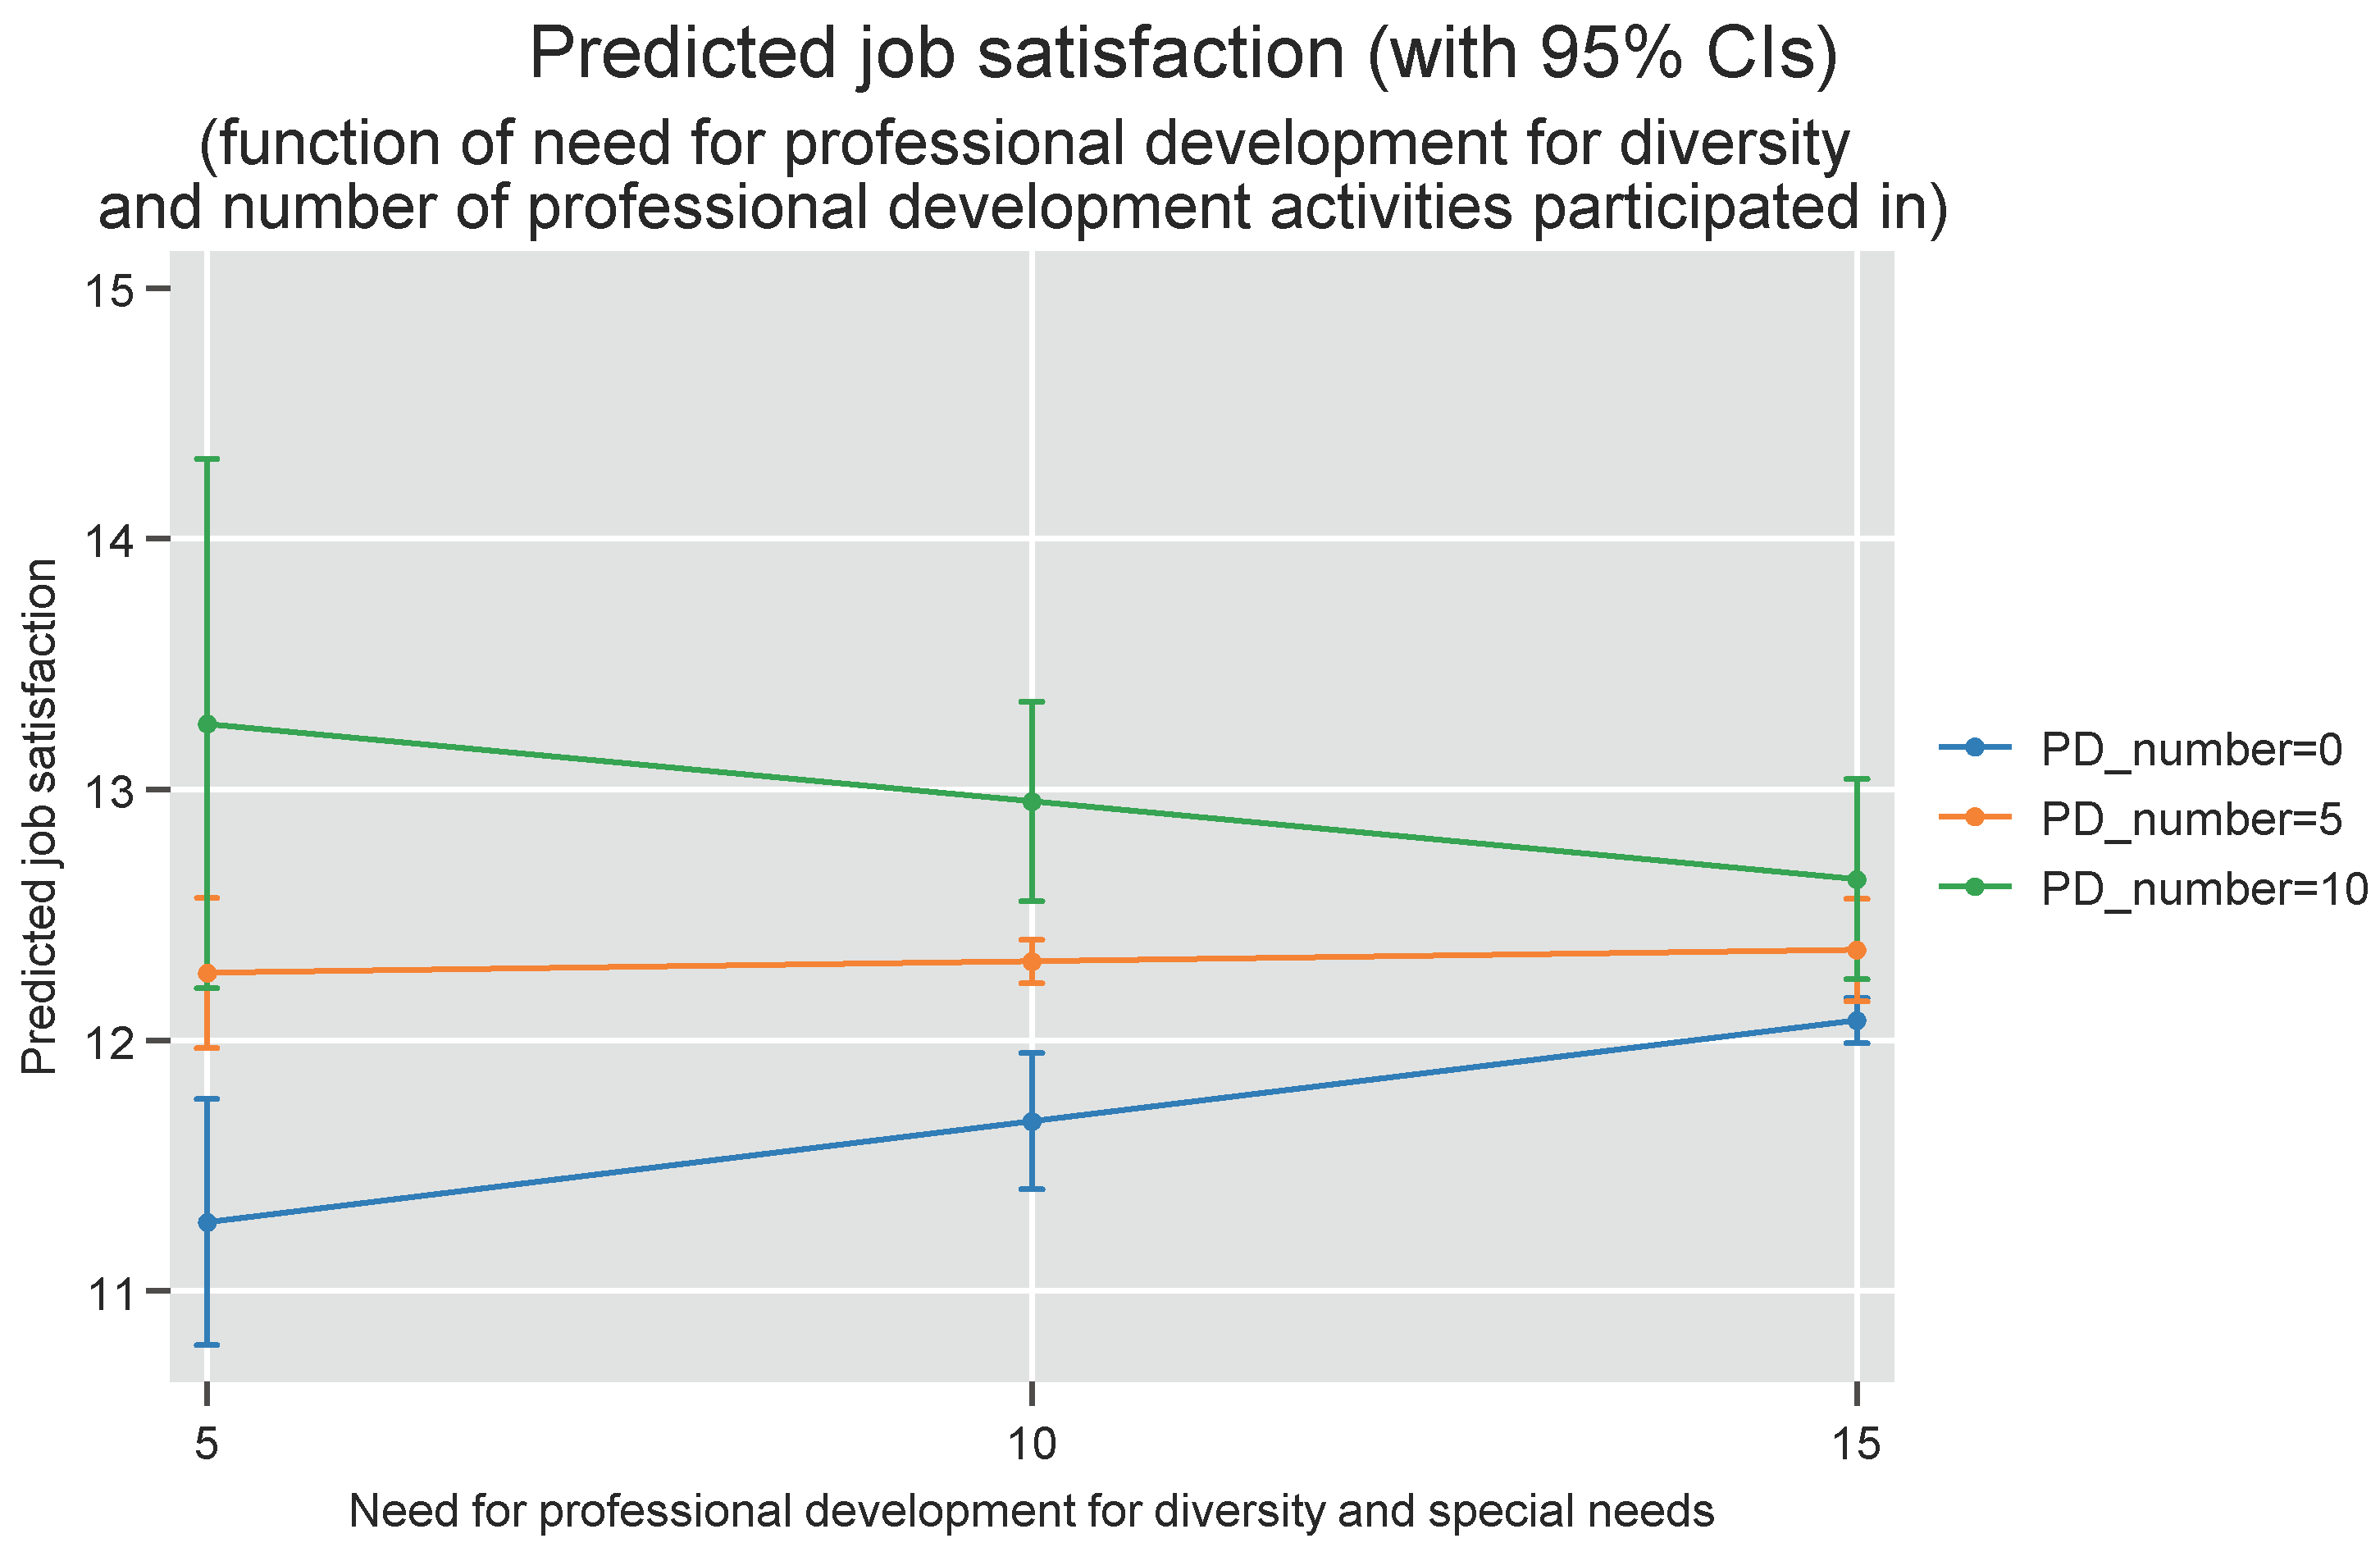
In Figure 1, the (by the model) predicted value of jobs satisfaction is visualized for different values of the need for professional development for diversity and special needs (t3pdiv) and the number of professional development activities participated in (PD_number): the minimum and maximum values of 5 and 15 for t3pdiv and 0 and 10 for PD_number correspond to the respective minimum and maximum values (rounded to the nearest integer) found in the dataset. The blue line in the plot clearly visualizes the positive and significant (see Table 3) slope parameter (0.080) of t3pdiv in absence of participation in professional development activities: teachers who express more need for professional development for diversity and special needs also have higher job satisfaction. The predicted job satisfaction increases from 11.3 (95% CI: 10.8–11.8), when t3pdiv is equal to 5, to 12.1 (95% CI: 12.0–12.2), when t3pdiv is equal to 15. The plot also clearly shows that participating in more professional development activities corresponds with higher predicted job satisfaction. Moreover, the slope of t3pdiv is moderated by PD_number: the initial positive slope becomes less positive and eventually negative with increasing values of PD_number. The slope remains positive until PD_number equals five, and when PD_number is six or greater, the slope becomes negative (not depicted in Figure 1 in order not to overload the graph).
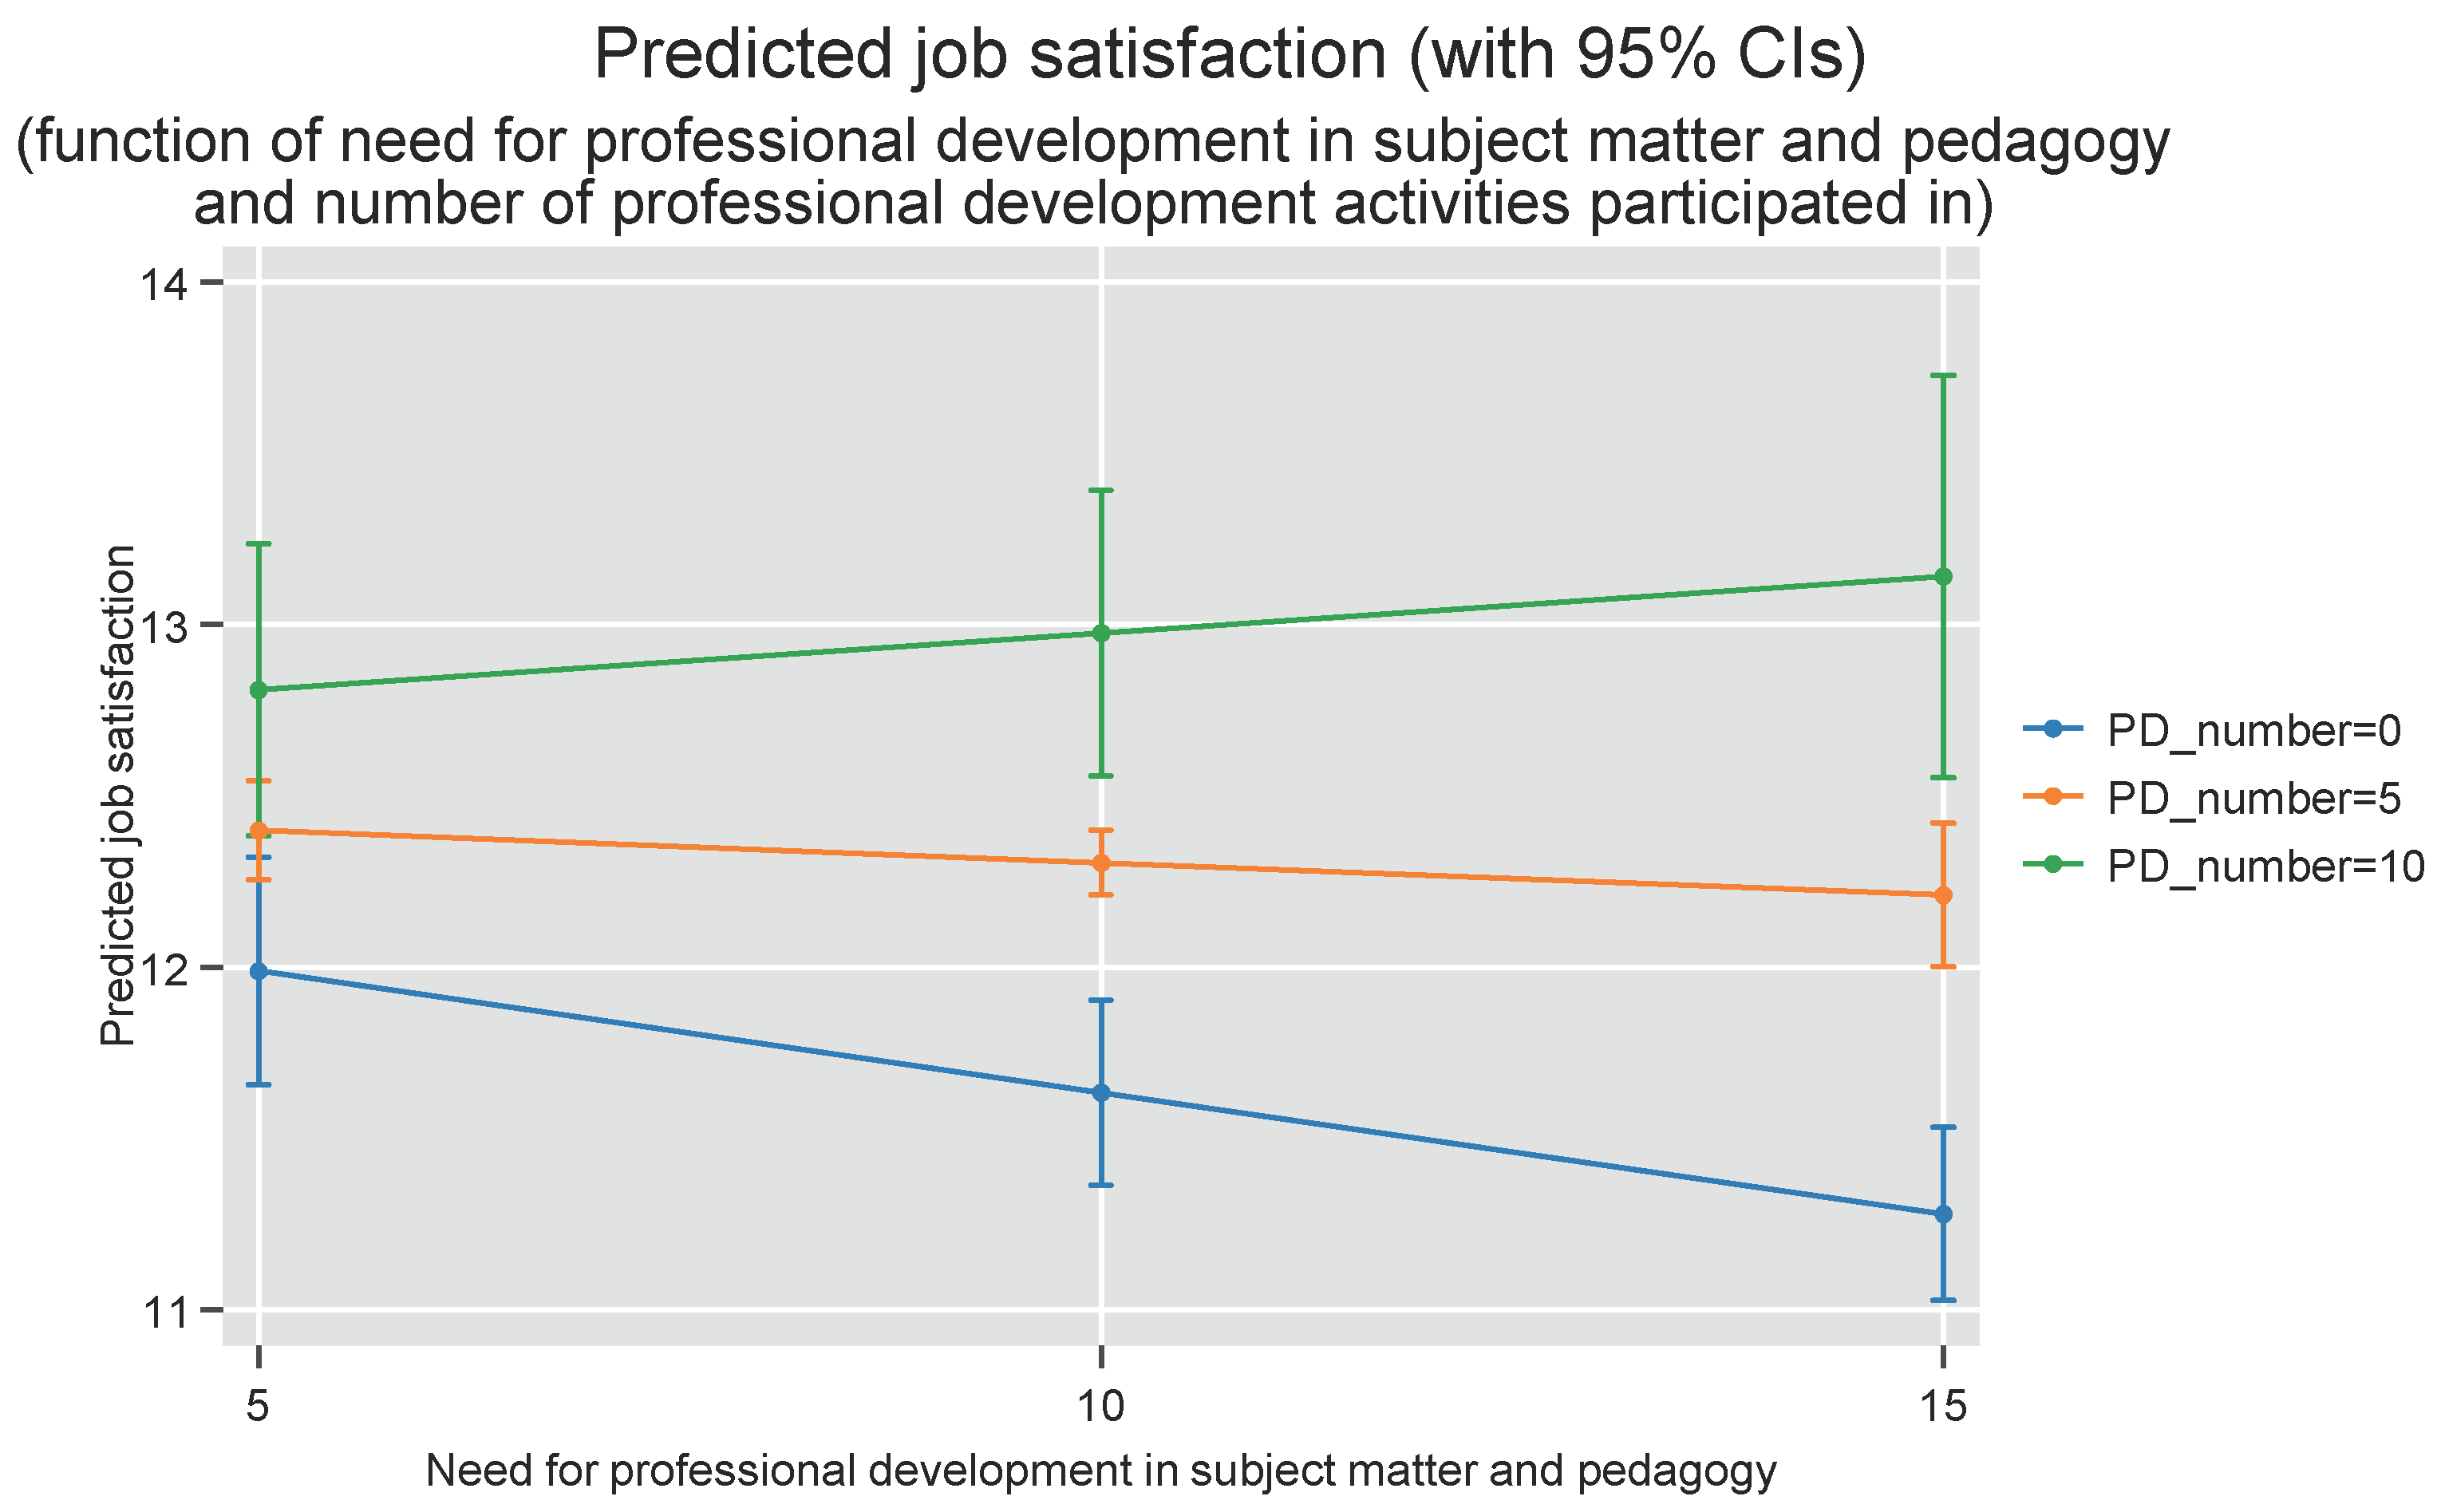
The relationship between the second variable measuring the need for professional development (t3pdped: the need for professional development in subject matter and pedagogy) and predicted job satisfaction is illustrated in Figure 2. The blue line in the plot corresponds to the situation where a teacher did not participate in any professional development activity in the 12 months prior to the study: in this situation, there is a clear negative and significant (see Table 3) slope parameter (−0.071) of t3pdped, i.e., teachers who express to have more need for professional development in subject matter and pedagogy show lower levels of job satisfaction. The predicted job satisfaction score decreases from 12.0 (95% CI: 11.7–12.3), when t3pdped is equal to 5, to 11.3 (95% CI: 11.0–11.5), when t3pdped is equal to 15. Again, participating in more professional development activities is associated with higher predicted job satisfaction. Finally, the moderation effect of PD_number on t3pdped is found to be significant: the slope of t3pdped becomes less negative and eventually turns in to a positive slope with increasing values of PD_number. The slope remains negative until PD_number is equal to six, and when PD_number is seven or greater, the slope becomes positive (not depicted in Figure 2 in order not to overload the graph).
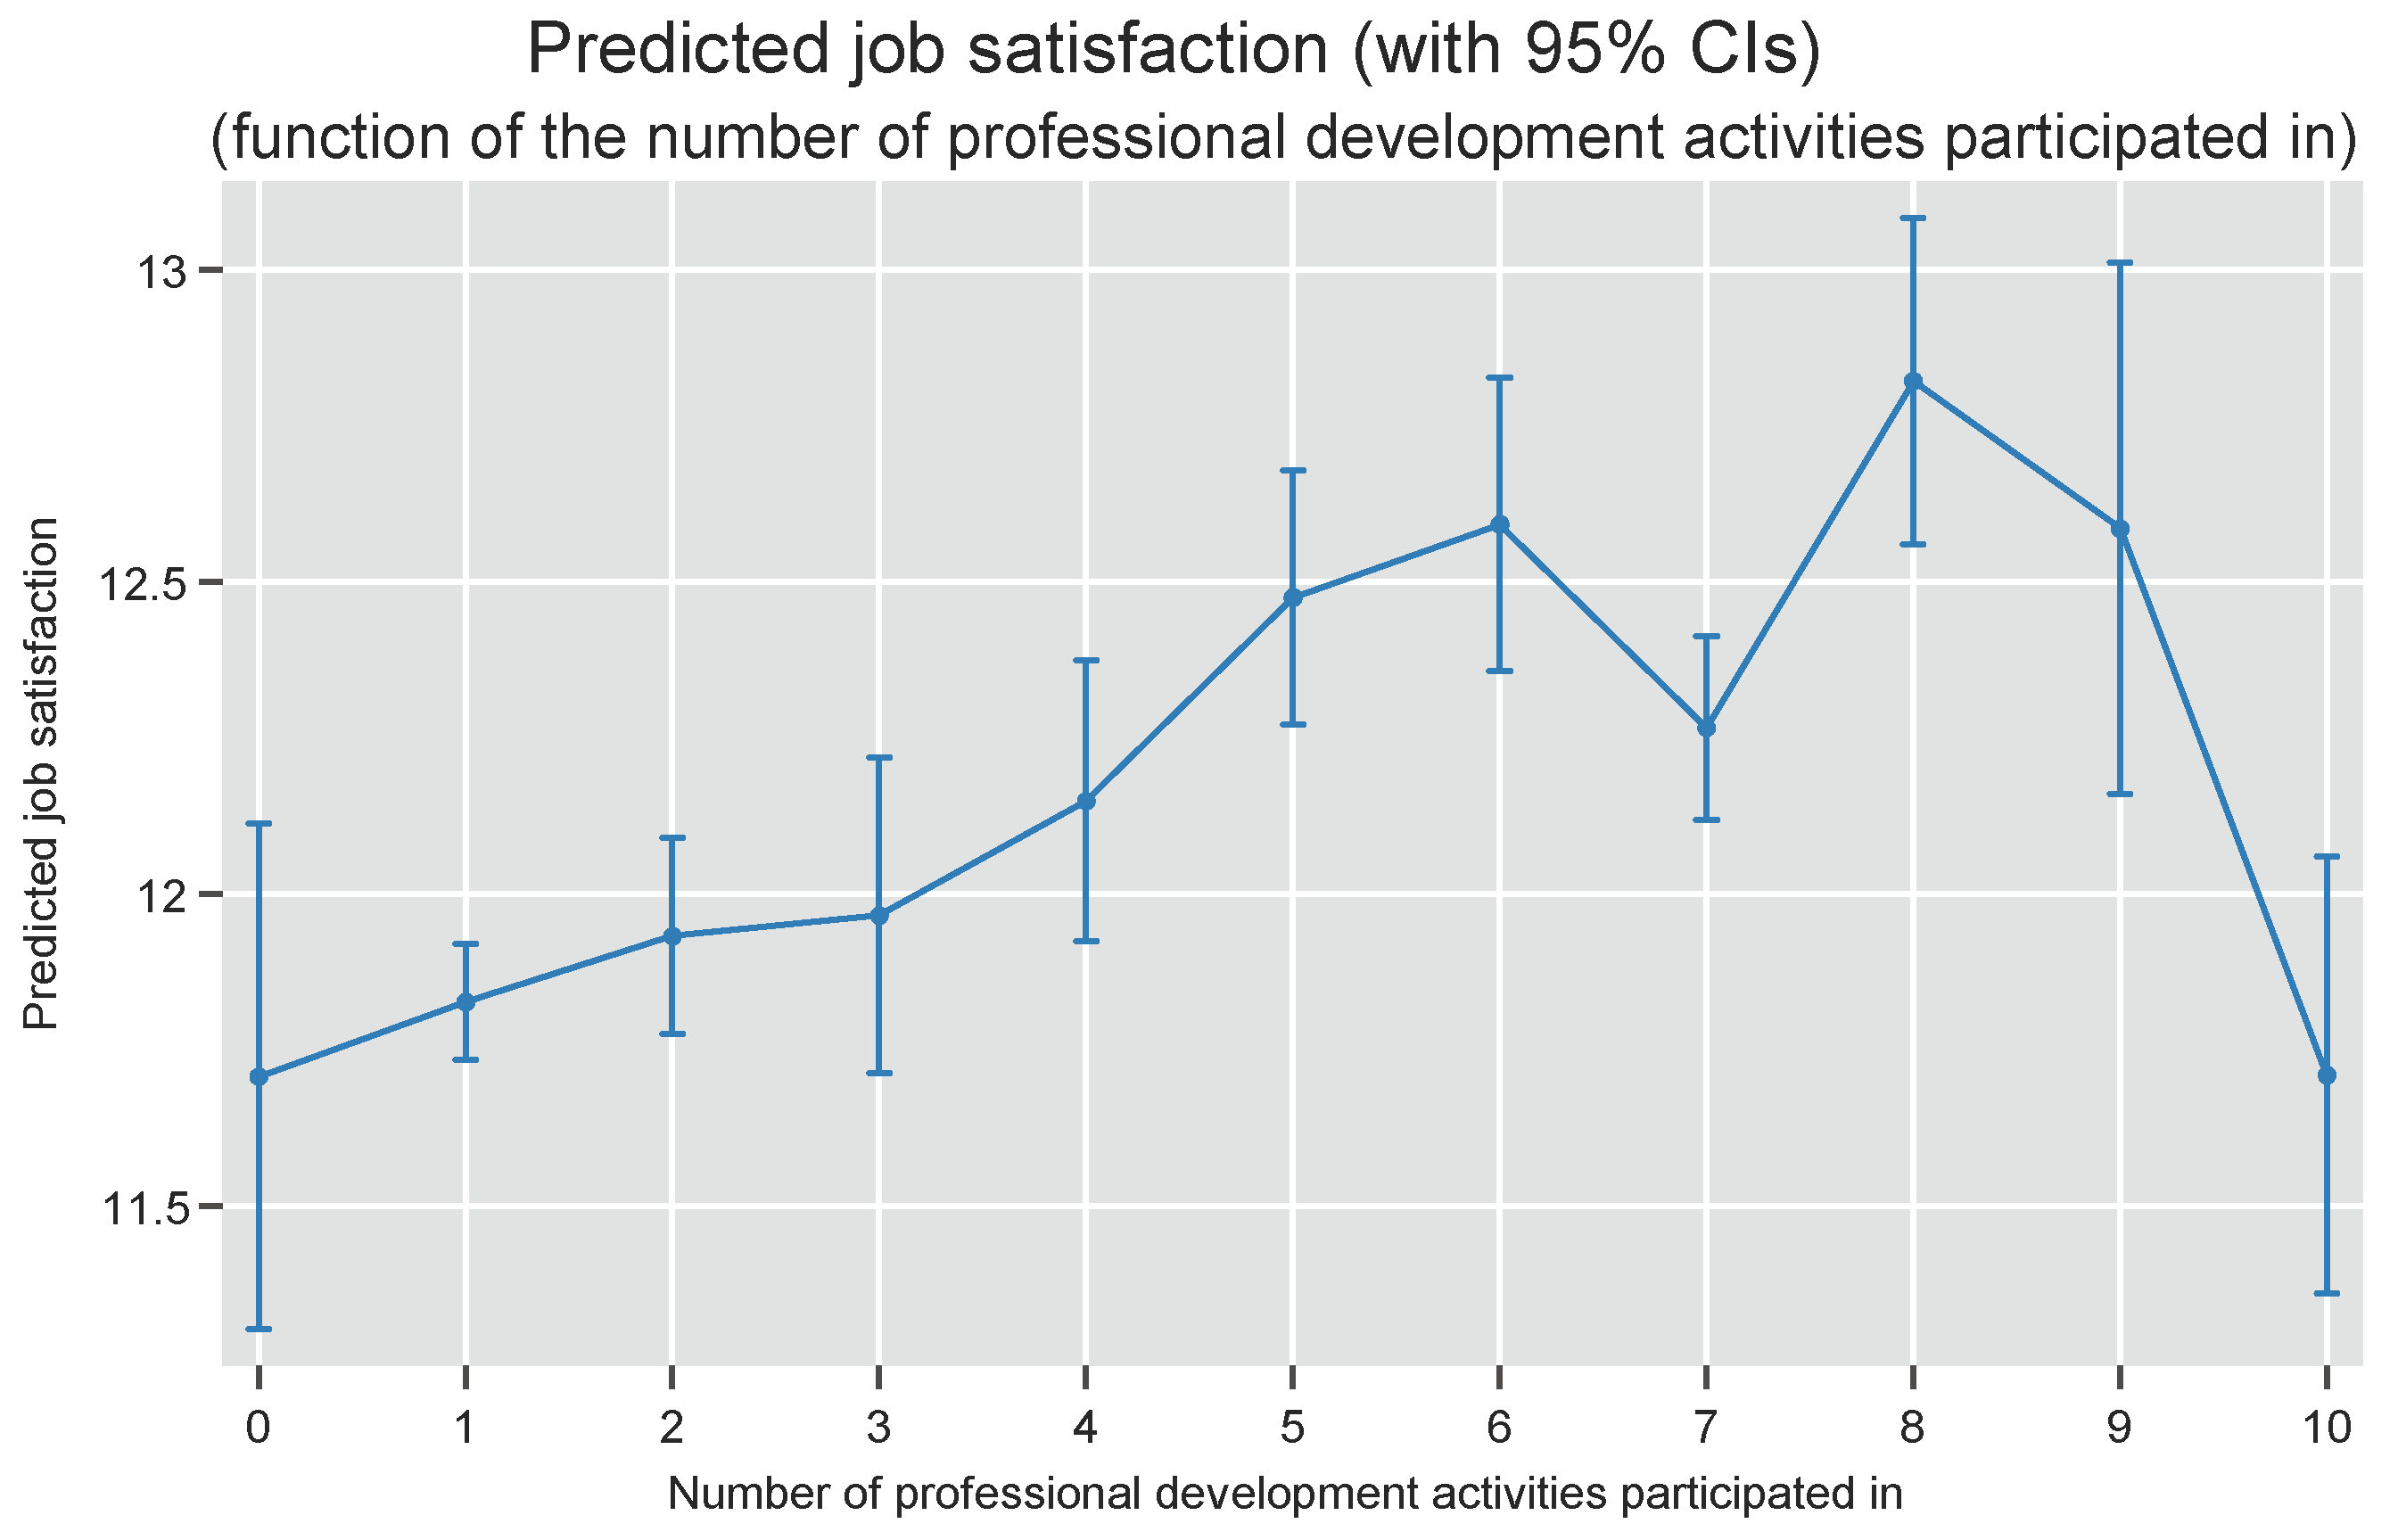
In order to investigate whether the impact of the number of professional development activities a teacher participated in (PD_number) has a linear (strictly increasing) effect on job satisfaction, we re-estimated the model and included PD_number as 10 separate dummies (both as main effect and as moderator on t3pdiv and t3pdped) instead of treating it as a continuous variable, as we did in Table 3. Detailed estimation results of this model are presented in Table A1 in Appendix A.
Figure 3 depicts the relationship between (the individual dummies of) PD_number and predicted job satisfaction: it clearly shows that job satisfaction tends to increase up to eight professional development activities participated in. For 9 and especially 10 activities, job satisfaction decreases, yielding a satisfaction score of 11.7 for 10 activities, which is equal to the satisfaction score for no participation at all.
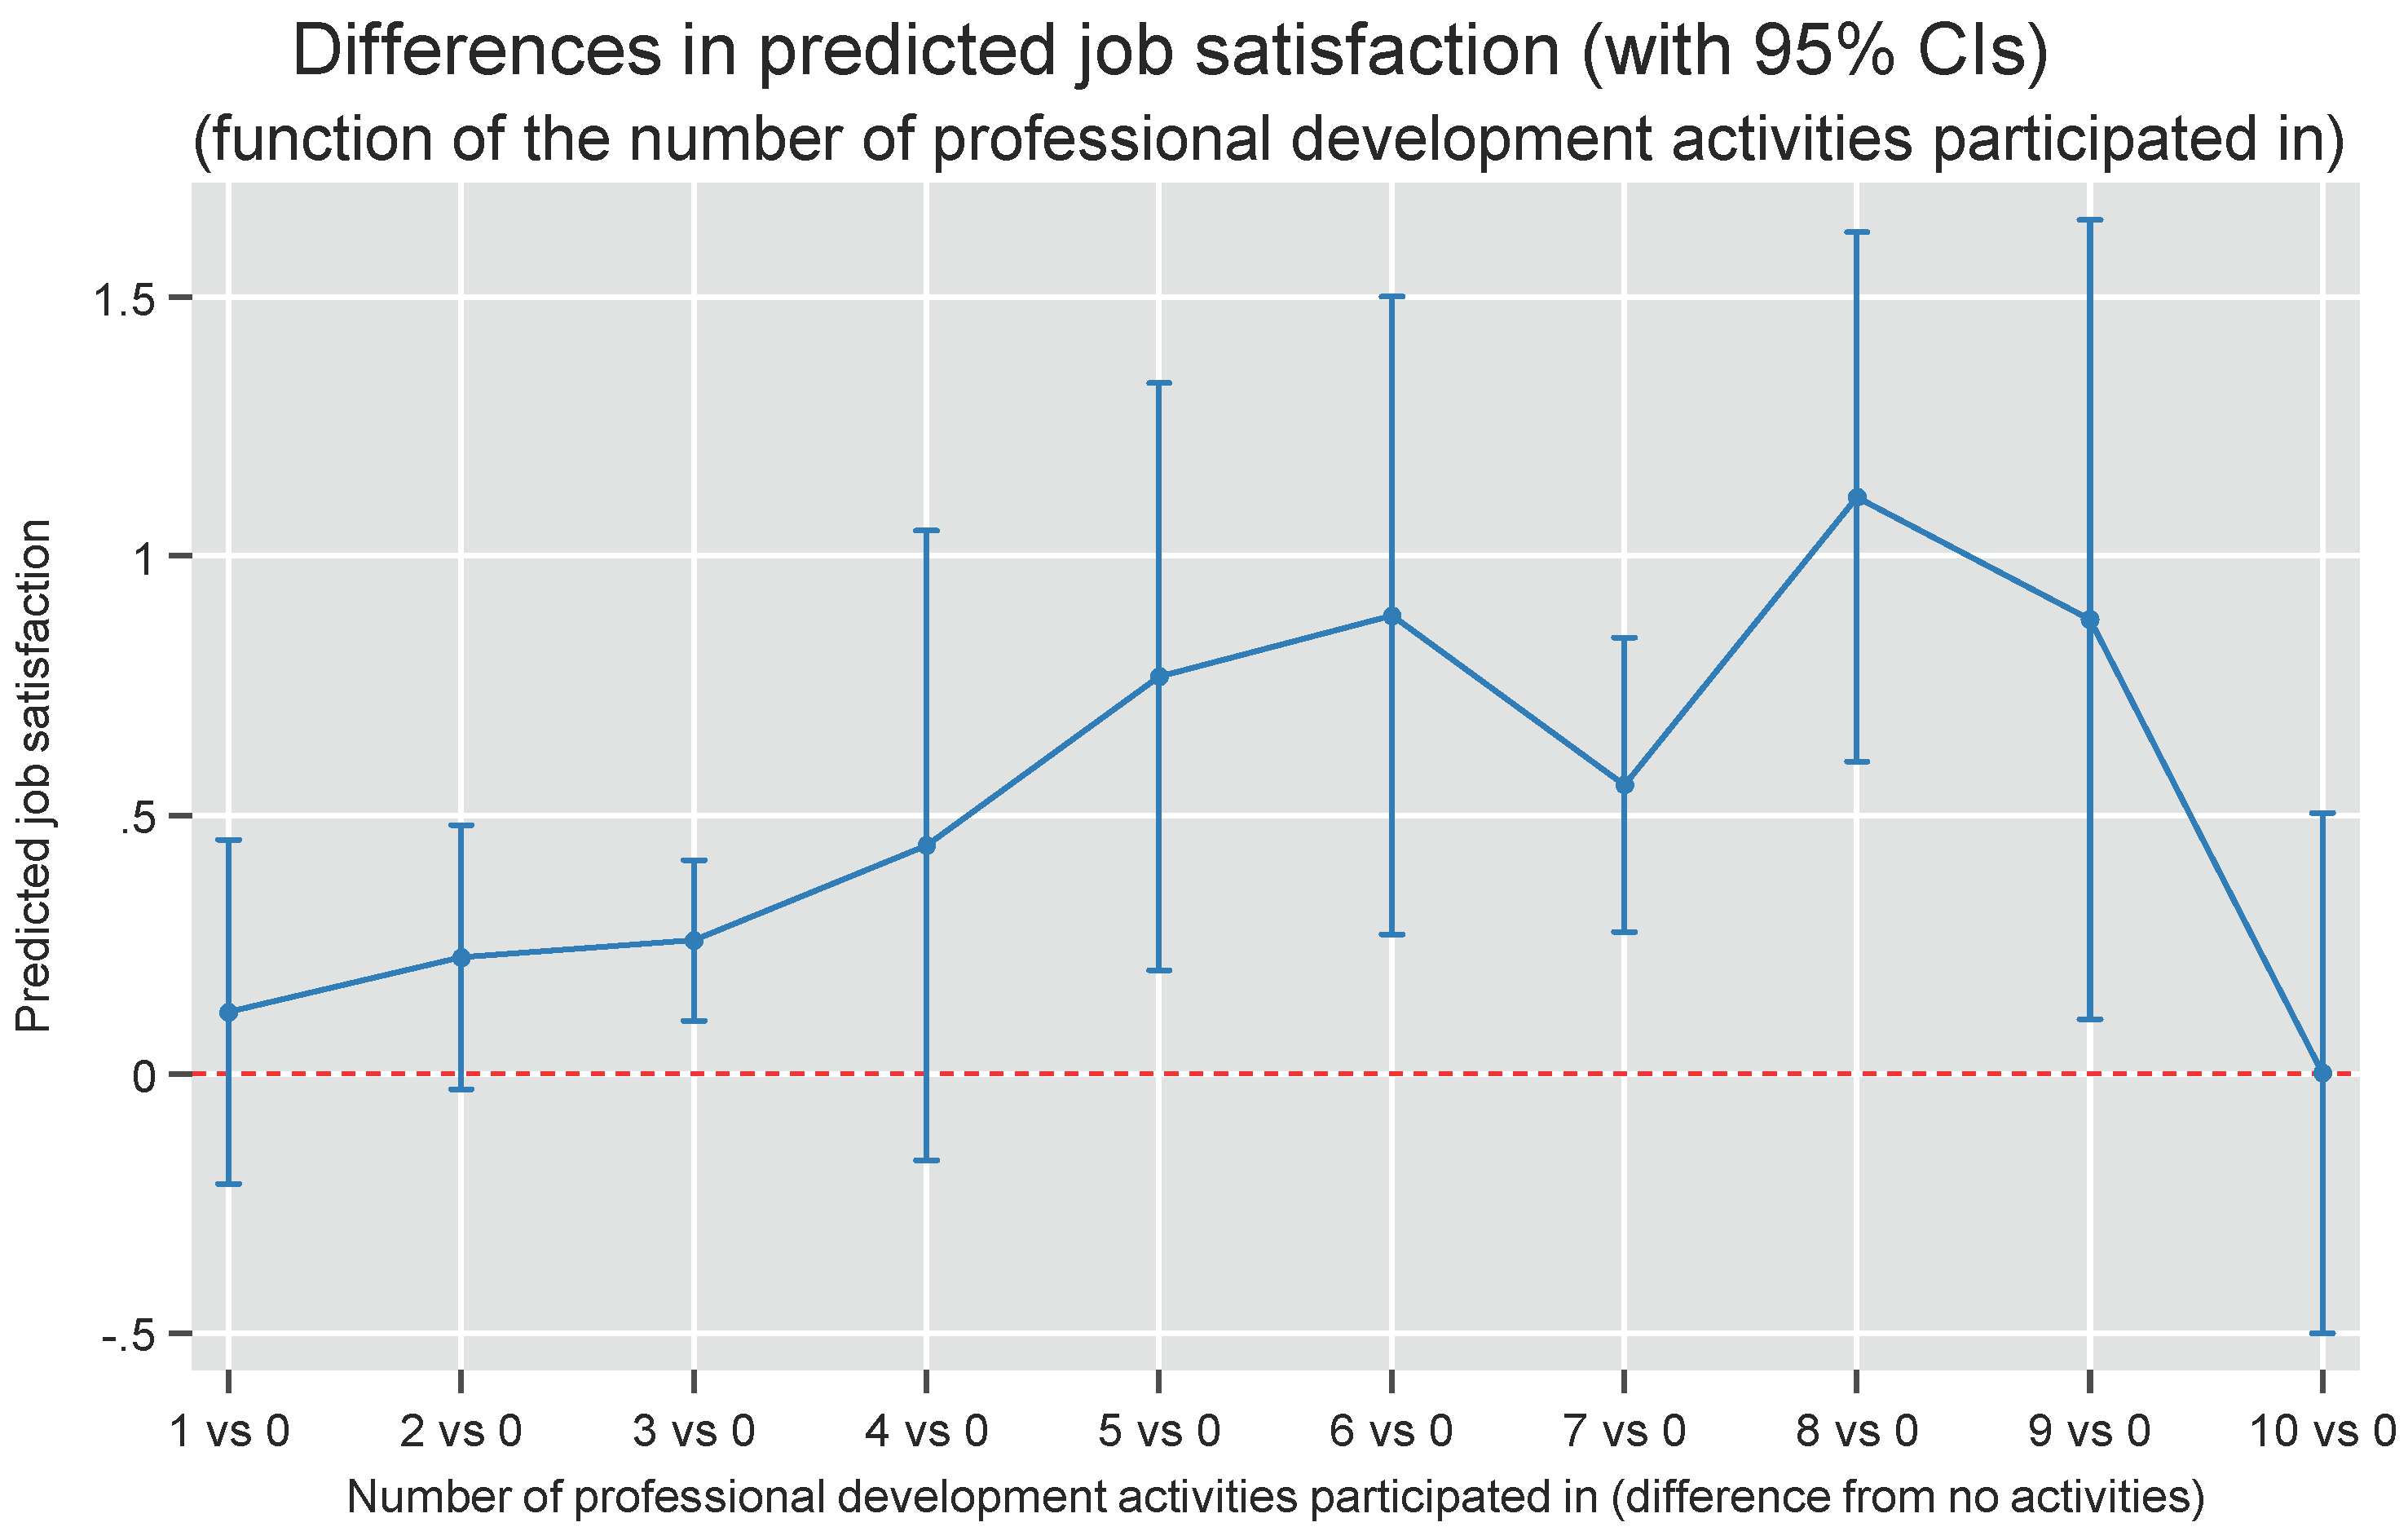
In order to check whether the predicted job satisfaction scores are (significantly) different from the score of 11.7 in case of no participation, differences (as well as 95% confidence intervals) from this reference category were calculated for every number of professional development activities. These differences from the ‘no participation’ category are depicted in Figure 4 it is clear (the 95% confidence intervals do not include zero) that most participation rates between three and nine activities are associated with significantly higher job satisfaction rates than the reference category of no participation.
4. Discussion
Before proceeding, it should be stressed that the data used in this study are cross-sectional and non-experimental, so strict causal inference and hard causal claims are difficult to make; for example, some degree of reversed causality or selection effects (e.g., more satisfied teachers might enroll themselves more in professional development activities than teachers with lower levels of job satisfaction) cannot be ruled out.
In this section, we will primarily focus on the key variables of interest in this study: the need for professional development (for diversity and special needs as well as in subject matter and pedagogy), the number of professional development activities participated in, and their interactions.
However, before focusing on the different aspects of professional development, we first briefly relate the results for the other variables with findings reported in earlier literature on job satisfaction of teachers. We found that most of the control variables we included were significant, e.g., individual teacher and job characteristics (gender, teacher qualification, age, years of experience, and mentorship), which is consistent with earlier literature [23,27,28,30,35,36,39,41,43,44]. In addition, and consistent with earlier studies [23,27,36,37,39,43], we find that a number of school characteristics, such as the share of special needs students, school location, school type, and school delinquency and violence rate, were we also significant. Finally, a number of teacher perceptions that were found to be relevant predictors of job satisfaction in other studies [8,27,28,29,30,33,34,35,36,37,38,39,40] are also significant in our estimate: teacher–student relations and teacher self-efficacy have a positive and significant slope, while student behavior stress and workplace well-being and stress have a negative and significant slope.
Regarding professional development, the finding that (more) participation in professional development activities is associated with higher job satisfaction is in line with other studies investigating the impact of professional development on job satisfaction [23,28,29,30,39,40,41].
Estimated slopes of the need for professional development revealed two different patterns: on the one hand, we find a positive slope for the need for professional development for diversity and special needs (t3pdiv) for teachers that did not participate in professional development activities, becoming negative from six professional development activities participated in (see Figure 1). This finding was contrary to what we expected in advance: we expected increasing values of need to be negatively associated with job satisfaction. On the other hand, the slope for the need for professional development in subject matter and pedagogy (t3pdped) was negative but becoming less negative with increasing participation rates (see Figure 2), as expected.
The opposing effect of the two need variables on job satisfaction is an interesting and puzzling finding: apparently, these two variables capture quite distinct aspects of need for professional development and how these needs relate to job satisfaction.
The following mechanism might explain these findings: teachers who have a high need for professional development in subject matter and pedagogy (t3pdped) may feel they fall short in their core subject matter knowledge or pedagogical skills, and if they are unable to compensate for this by engaging in professional development, this leads to lower job satisfaction. The more professional development activities they participated in, the less negative this relationship becomes: although their need for professional development can still be high, the professional development activities they have participated in managed to increase job satisfaction and can turn the negative relationship into a positive one. This may indicate that, despite high need, having participated in professional development creates some awareness or confidence that makes teachers consider the high need, in combination with the access to professional development, more as an opportunity rather than a threat, resulting in higher job satisfaction. Job satisfaction increases considerably more (after having participated in professional development) for teachers with high needs than for teachers with low needs. This may indicate that professional development activities participated in successfully targeted the correct group of teachers (i.e., the ones with the highest needs).
Regarding the unexpected pattern of need for professional development for diversity and special needs (t3pdiv), it might be that professional development activities teachers participated in were not efficient in reducing uncertainty or inability to deal with diversity and special needs. Job satisfaction of teachers with low needs increased substantially with participation in professional development, while job satisfaction of teachers with high needs only increased slightly with participation in professional development. So, professional development activities seem most effective for those teachers with low needs, leaving teachers with high needs behind.
It should be stressed that the mechanism described above is probably just one of many possible explanations for our findings. The results that can be derived from Table 3 (and the visualization in Figure 1 and Figure 2) do not yet allow to confirm whether the mechanism that was described in the previous two paragraphs is the (only) correct one. Although the suggested mechanism is consistent with the empirical findings, it cannot be ruled out that other mechanisms apply. More specific future research is needed to investigate whether the suggested mechanism may hold or not. One way to do this would be an in-depth analysis of the specific types of professional development activities in which teachers participated in and investigate how these different types relate to needs and job satisfaction. It may also be useful to complement this quantitative analysis with a qualitative research design in order to obtain more detailed interpretations and explanations. If these additional analyses would confirm the mechanisms described above, these findings may be used to carefully design and offer more efficient professional development activities, not only specifically targeting teachers with high versus low needs, but also depending on the type of need. This could lead to superior results regarding increased job satisfaction (and potentially lower turnover rates), compared to a ‘one-size-fits-all’ approach, where all teachers are considered to be identical in their need for professional development (and its relationship with job satisfaction).
Funding
This research received no external funding.
Institutional Review Board Statement
Not applicable.
Informed Consent Statement
Not applicable.
Data Availability Statement
The TALIS 2018 data used in this study are publicly available and can be downloaded in various format from https://www.oecd.org/education/talis/talis-2018-data.htm (accessed on 4 October 2021). The specific file of the database used for the analysis was the ‘STATA_2018_international.zip’ version, which can be retrieved via https://webfs.oecd.org/talis/STATA_2018_international.zip (accessed on 4 October 2021). Data files were downloaded on 4 October 2021.
Conflicts of Interest
The author declares no conflict of interest.
Appendix A
Table A1.
Estimation results from multilevel model with PD_number included as dummy variables.
| Fixed Effects Parameters | Coefficient | S.E. | p-Value | |
|---|---|---|---|---|
| Gender (ref. = women) | −0.295 | 0.111 | 0.008 | |
| Highest qualification (ref. = below ISCED 3) | ||||
| ISCED 3 | 0.191 | 0.302 | 0.526 | |
| ISCED 4 | 0.372 | 0.338 | 0.271 | |
| ISCED 5 | 0.369 | 0.379 | 0.331 | |
| ISCED 6 | 0.123 | 0.375 | 0.742 | |
| ISCED 7 | 0.128 | 0.355 | 0.718 | |
| ISCED 8 | 0.073 | 0.317 | 0.817 | |
| Teacher age group (ref. = under 25) | ||||
| 25–29 | −0.149 | 0.085 | 0.078 | |
| 30–39 | −0.256 | 0.046 | 0.000 | |
| 40–49 | −0.196 | 0.041 | 0.000 | |
| 50–59 | 0.004 | 0.068 | 0.957 | |
| 60 and above | 0.208 | 0.075 | 0.006 | |
| Teaching as first career choice (ref. = yes) | −0.511 | 0.033 | 0.000 | |
| Contract type (ref. = permanent) | ||||
| Fixed-term >1 year | 0.125 | 0.130 | 0.334 | |
| Fixed-term <=1 year | 0.026 | 0.071 | 0.716 | |
| Employment status (ref. = Full-time, i.e., >90% of FT) | ||||
| Part-time (71–90% of FT) | −0.036 | 0.107 | 0.740 | |
| Part-time (50–70% of FT) | −0.052 | 0.187 | 0.780 | |
| Part-time (less than 50% of FT) | −0.159 | 0.205 | 0.439 | |
| Years of experience | −0.020 | 0.003 | 0.000 | |
| Having a mentor (ref. = yes) | −0.259 | 0.029 | 0.000 | |
| Being a mentor (ref. = yes) | −0.247 | 0.116 | 0.033 | |
| Number of prof. dev. activities participated (PD_number) | ||||
| PD_number = 1 | 1.583 | 0.458 | 0.001 | |
| PD_number = 2 | 1.220 | 0.430 | 0.005 | |
| PD_number = 3 | 1.173 | 0.693 | 0.091 | |
| PD_number = 4 | 1.821 | 0.962 | 0.058 | |
| PD_number = 5 | 2.403 | 1.415 | 0.089 | |
| PD_number = 6 | 1.542 | 1.455 | 0.289 | |
| PD_number = 7 | 0.340 | 0.263 | 0.195 | |
| PD_number = 8 | 2.216 | 0.975 | 0.023 | |
| PD_number = 9 | 2.763 | 1.637 | 0.091 | |
| PD_number = 10 | −2.042 | 1.666 | 0.220 | |
| Need for prof. dev. for diversity and special needs (t3pdiv) | 0.123 | 0.098 | 0.208 | |
| Need for prof. dev. in subject matter and pedagogy (t3pdped) | −0.027 | 0.051 | 0.592 | |
| Interaction term PD_number × t3pdiv | ||||
| PD_number = 1 × t3pdiv | −0.071 | 0.098 | 0.471 | |
| PD_number = 2 × t3pdiv | −0.046 | 0.120 | 0.699 | |
| PD_number = 3 × t3pdiv | −0.138 | 0.115 | 0.232 | |
| PD_number = 4 × t3pdiv | −0.105 | 0.114 | 0.357 | |
| PD_number = 5 × t3pdiv | −0.103 | 0.097 | 0.287 | |
| PD_number = 6 × t3pdiv | −0.261 | 0.192 | 0.174 | |
| PD_number = 7 × t3pdiv | −0.017 | 0.117 | 0.886 | |
| PD_number = 8 × t3pdiv | 0.045 | 0.041 | 0.276 | |
| PD_number = 9 × t3pdiv | −0.138 | 0.322 | 0.668 | |
| PD_number = 10 × t3pdiv | 0.140 | 0.274 | 0.608 | |
| Interaction term PD_number × t3pdped | ||||
| PD_number = 1 × t3pdped | −0.080 | 0.081 | 0.319 | |
| PD_number = 2 × t3pdped | −0.056 | 0.102 | 0.582 | |
| PD_number = 3 × t3pdped | 0.047 | 0.057 | 0.410 | |
| PD_number = 4 × t3pdped | −0.036 | 0.063 | 0.569 | |
| PD_number = 5 × t3pdped | −0.065 | 0.035 | 0.060 | |
| PD_number = 6 × t3pdped | 0.203 | 0.085 | 0.017 | |
| PD_number = 7 × t3pdped | 0.040 | 0.158 | 0.798 | |
| PD_number = 8 × t3pdped | −0.163 | 0.098 | 0.098 | |
| PD_number = 9 × t3pdped | −0.054 | 0.243 | 0.823 | |
| PD_number = 10 × t3pdped | 0.069 | 0.157 | 0.660 | |
| Special needs students (ref. = none) | ||||
| Some | −0.026 | 0.034 | 0.441 | |
| Most | −0.196 | 0.047 | 0.000 | |
| All | 0.054 | 0.111 | 0.628 | |
| School location (ref. = village, i.e., <3000 people) | ||||
| Small town (3001 to 15,000 people) | −0.143 | 0.048 | 0.003 | |
| Town (15,001 to 100,000 people) | −0.153 | 0.046 | 0.001 | |
| City (100,001 to 1,000,000 people) | −0.260 | 0.133 | 0.050 | |
| Large city (more than 1,000,000 people) | −0.257 | 0.084 | 0.002 | |
| School type (ref. = public) | 0.197 | 0.082 | 0.016 | |
| School size (ref. = under 250) | ||||
| 250–499 | 0.150 | 0.101 | 0.139 | |
| 500–749 | 0.143 | 0.112 | 0.200 | |
| 750–999 | 0.156 | 0.114 | 0.172 | |
| 1000 and above | 0.218 | 0.118 | 0.064 | |
| School delinquency and violence | −0.036 | 0.009 | 0.000 | |
| Teacher-student relations | 0.196 | 0.013 | 0.000 | |
| Teacher self-efficacy | 0.078 | 0.014 | 0.000 | |
| Student behavior stress | −0.084 | 0.015 | 0.000 | |
| Workplace well-being and stress | −0.398 | 0.007 | 0.000 | |
| Workload stress | −0.052 | 0.029 | 0.077 | |
| Constant | 13.314 | 0.407 | 0.000 | |
| Random-effects parameters | Estimate | S.E. | 95% CI | 95% CI |
| Level 3: intercept variance | 0.026 | 0.007 | 0.015 | 0.043 |
| Level 2: intercept variance | 0.368 | 0.039 | 0.299 | 0.452 |
| Level 1: residual variance | 2.544 | 0.181 | 2.213 | 2.926 |
| Sample size | N | |||
| Sample size level 3 (regions) | 20 | |||
| Sample size level 2 (schools) | 3128 | |||
| Sample size level 1 (teachers) | 49,378 |
Notes: reported standard errors (S.E.) are robust standard errors. In order to account for the sampling design (i.e., different selection probabilities for teachers and schools), in the estimation procedure, observations are weighed using teacher weights and school weights (which are included in the TALIS 2018 database) [56,57,58]. Source: made by author, based on TALIS 2018 [56].
References
- Eide, E.; Goldhaber, D.; Brewer, D. The Teacher Labour Market and Teacher Quality. Oxf. Rev. Econ. Policy 2004, 20, 230–244. [Google Scholar] [CrossRef]
- Hanushek, E.; Kain, J.; Rivkin, S. Teachers, Schools, and Academic Achievement; National Bureau of Economic Research: Cambridge, MA, USA, 1998. [Google Scholar]
- Rockoff, J.E. The Impact of Individual Teachers on Student Achievement: Evidence from Panel Data. Am. Econ. Rev. 2004, 94, 247–252. [Google Scholar] [CrossRef] [Green Version]
- Darling-Hammond, L. Teacher quality and student achievement. A review of state policy evidence. Educ. Policy Anal. Arch. 2000, 8, 1. [Google Scholar] [CrossRef] [Green Version]
- Hattie, J. Visible Learning: A Synthesis of Over 800 Meta-Analyses Relating to Achievement; Routledge: London, UK, 2009. [Google Scholar]
- European Commission; EACEA; Eurydice. Teachers in Europe: Careers, Development and Well-being; Eurydice Report; Publications Office of the European Union: Luxembourg, 2021. [Google Scholar]
- Ingersoll, R.M. Teacher turnover and teacher shortages: An organizational analysis. Am. Educ. Res. J. 2001, 38, 499–534. [Google Scholar] [CrossRef] [Green Version]
- Skaalvik, E.M.; Skaalvik, S. Teacher job satisfaction and motivation to leave the teaching profession: Relations with school context, feeling of belonging, and emotional exhaustion. Teach. Teach. Educ. 2011, 27, 1029–1038. [Google Scholar] [CrossRef]
- Ingersoll, R.M. Misdiagnosing the Teacher Quality Problem. In International Handbook of Teacher Quality and Policy; Akiba, M., LeTendre, G.K., Eds.; Routledge: London, UK, 2017; pp. 79–96. [Google Scholar]
- Carver-Thomas, D.; Darling-Hammond, L. The trouble with teacher turnover: How teacher attrition affects students and schools. Educ. Policy Anal. Arch. 2019, 27, 36. [Google Scholar] [CrossRef] [Green Version]
- Ronfeldt, M.; Loeb, S.; Wyckoff, J. How Teacher Turnover Harms Student Achievement. Am. Educ. Res. J. 2013, 50, 4–36. [Google Scholar] [CrossRef] [Green Version]
- Goldhaber, D.; Cowan, J. Excavating the Teacher Pipeline: Teacher Preparation Programs and Teacher Attrition. J. Teach. Educ. 2014, 65, 449–462. [Google Scholar] [CrossRef]
- Rinke, C.R. Understanding teachers’ careers: Linking professional life to professional path. Educ. Res. Rev. 2008, 3, 1–13. [Google Scholar] [CrossRef]
- Murnane, R.J. Selection and Survival in the Teacher Labor Market. Rev. Econ. Stat. 1984, 66, 513–518. [Google Scholar] [CrossRef]
- Boyd, D.; Grossman, P.; Lankford, H.; Loeb, S.; Wyckoff, J. Who leaves? Teacher Attrition and Student Achievement; National Bureau of Economic Research: Cambridge, MA, USA, 2008. [Google Scholar]
- Krieg, J.M. Teacher quality and attrition. Econ. Educ. Rev. 2006, 25, 13–27. [Google Scholar] [CrossRef]
- Borman, G.D.; Dowling, N.M. Teacher Attrition and Retention: A Meta-Analytic and Narrative Review of the Research. Rev. Educ. Res. 2008, 78, 367–409. [Google Scholar] [CrossRef]
- Lindqvist, P.; Nordänger, U.K.; Carlsson, R. Teacher attrition the first five years—A multifaceted image. Teach. Teach. Educ. 2014, 40, 94–103. [Google Scholar] [CrossRef] [Green Version]
- Grissom, J.A.; Viano, S.L.; Selin, J.L. Understanding Employee Turnover in the Public Sector: Insights from Research on Teacher Mobility. Public Adm. Rev. 2016, 76, 241–251. [Google Scholar] [CrossRef]
- OECD. What proportion of teachers leave the teaching profession? In Education at a Glance 2021; OECD: Paris, France, 2021. [Google Scholar]
- Sutcher, L.; Darling-Hammond, L.; Carver-Thomas, D. Understanding teacher shortages: An analysis of teacher supply and demand in the united states. Educ. Policy Anal. Arch. 2019, 27, 35. [Google Scholar] [CrossRef] [Green Version]
- Sims, S.; Jerrim, J. TALIS 2018: Teacher Working Conditions, Turnover and Attrition; Statistical Working Paper; UK Department for Education: Runcorn, UK, 2020. [Google Scholar]
- Liu, Y.; Bellibas, M.S. School factors that are related to school principals’ job satisfaction and organizational commitment. Int. J. Educ. Res. 2018, 90, 1–19. [Google Scholar] [CrossRef]
- Aydogdu, S.; Asikgil, B. An Empirical Study of the Relationship Among Job Satisfaction, Organizational Commitment and Turnover Intention. Int. Rev. Manag. Mark. 2011, 1, 43–53. [Google Scholar]
- Blömeke, S.; Houang, R.T.; Hsein, F.-J.; Want, T.-T. Effects of Job Motives, Teacher Knowledge and School Context on Beginning Teachers’ Commitment to Stay in the Profession: A Longitudinal Study in Germany, Taiwan and the United States. In International Handbook of Teacher Quality and Policy; Akiba, M., LeTendre, G.K., Eds.; Routledge: London, UK, 2017; pp. 374–387. [Google Scholar]
- Klassen, R.M.; Chiu, M.M. The occupational commitment and intention to quit of practicing and pre-service teachers: Influence of self-efficacy, job stress, and teaching context. Contemp. Educ. Psychol. 2011, 36, 114–129. [Google Scholar] [CrossRef]
- Renzulli, L.A.; Parrott, H.M.; Beattie, I.R. Racial Mismatch and School Type:Teacher Satisfaction and Retention in Charter and Traditional Public Schools. Sociol. Educ. 2011, 84, 23–48. [Google Scholar] [CrossRef] [Green Version]
- Renbarger, R.; Davis, B. Mentors, self-efficacy, or professional development: Which mediate job satisfaction for new teachers? A regression examination. J. Teach. Educ. Educ. 2019, 8, 21–34. [Google Scholar]
- Sims, S. TALIS 2013: Working Conditions, Teacher Job Satisfaction and Retention; UK Department for Education: Runcorn, UK, 2017. [Google Scholar]
- Toropova, A.; Myrberg, E.; Johansson, S. Teacher job satisfaction: The importance of school working conditions and teacher characteristics. Educ. Rev. 2021, 73, 71–97. [Google Scholar] [CrossRef] [Green Version]
- Weiss, H.M. Deconstructing job satisfaction: Separating evaluations, beliefs and affective experiences. Hum. Resour. Manag. Rev. 2002, 12, 173–194. [Google Scholar]
- Locke, E.A. What is job satisfaction? Organ. Behav. Hum. Perform. 1969, 4, 309–336. [Google Scholar] [CrossRef]
- Klassen, R.M.; Bong, M.; Usher, E.L.; Chong, W.H.; Huan, V.S.; Wong, I.Y.F.; Georgiou, T. Exploring the validity of a teachers’ self-efficacy scale in five countries. Contemp. Educ. Psychol. 2009, 34, 67–76. [Google Scholar] [CrossRef]
- Lopes, J.; Oliveira, C. Teacher and school determinants of teacher job satisfaction: A multilevel analysis. Sch. Eff. Sch. Improv. 2020, 31, 641–659. [Google Scholar] [CrossRef]
- Klassen, R.M.; Chiu, M.M. Effects on Teachers’ Self-Efficacy and Job Satisfaction: Teacher Gender, Years of Experience, and Job Stress. J. Educ. Psychol. 2010, 102, 741–756. [Google Scholar] [CrossRef]
- Torres, D.G. Distributed leadership, professional collaboration, and teachers’ job satisfaction in U.S. schools. Teach. Teach. Educ. 2019, 79, 111–123. [Google Scholar] [CrossRef]
- Admiraal, W.; Veldman, I.; Mainhard, T.; van Tartwijk, J. A typology of veteran teachers’ job satisfaction: Their relationships with their students and the nature of their work. Soc. Psychol. Educ. 2019, 22, 337–355. [Google Scholar] [CrossRef]
- Collie, R.J.; Shapka, J.D.; Perry, N.E. School Climate and Social-Emotional Learning: Predicting Teacher Stress, Job Satisfaction, and Teaching Efficacy. J. Educ. Psychol. 2012, 104, 1189–1204. [Google Scholar] [CrossRef] [Green Version]
- Wang, K.; Li, Y.; Luo, W.; Zhang, S. Selected Factors Contributing to Teacher Job Satisfaction: A Quantitative Investigation Using 2013 TALIS Data. Leadersh. Policy Sch. 2020, 19, 512–532. [Google Scholar] [CrossRef]
- Yoon, I.; Kim, M. Dynamic patterns of teachers’ professional development participation and their relations with socio-demographic characteristics, teacher self-efficacy, and job satisfaction. Teach. Teach. Educ. 2022, 109, 103565. [Google Scholar] [CrossRef]
- Liu, X.S.; Ramsey, J. Teachers’ job satisfaction: Analyses of the Teacher Follow-up Survey in the United States for 2000–2001. Teach. Teach. Educ. 2008, 24, 1173–1184. [Google Scholar] [CrossRef]
- Song, K.-O.; Hur, E.-J.; Kwon, B.-Y. Does high-quality professional development make a difference? Evidence from TIMSS. Compare 2018, 48, 954–972. [Google Scholar] [CrossRef]
- Crossman, A.; Harris, P. Job Satisfaction of Secondary School Teachers. Educ. Manag. Adm. Leadersh. 2006, 34, 29–46. [Google Scholar] [CrossRef] [Green Version]
- Saiti, A.; Papadopoulos, Y. School teachers’ job satisfaction and personal characteristics: A quantitative research study in Greece. Int. J. Educ. Manag. 2015, 29, 73–97. [Google Scholar] [CrossRef]
- Creemers, B.; Kyriakides, L.; Antoniou, P. Teacher Professional Development for Improving Quality of Teaching, 1st ed.; Springer: Dordrecht, The Netherlands, 2013. [Google Scholar]
- Tran, L.T.; Le, T.T.T.; Phan, H.L.T.; Pham, A. “Induction and off you go”: Professional development for teachers in transnational education. Oxf. Rev. Educ. 2021, 47, 529–547. [Google Scholar] [CrossRef]
- Schleicher, A. Teaching Excellence through Professional Learning and Policy Reform: Lessons from around the World; OECD Publishing: Paris, France, 2016. [Google Scholar]
- Darling-Hammond, L.; Hyler, M.E.; Gardner, M. Effective Teacher Professional Development; Learning Policy Institute: Palo Alto, CA, USA, 2017. [Google Scholar]
- Nir, A.E.; Bogler, R. The antecedents of teacher satisfaction with professional development programs. Teach. Teach. Educ. 2008, 24, 377–386. [Google Scholar] [CrossRef]
- Avidov-Ungar, O. A model of professional development: Teachers’ perceptions of their professional development. Teach. Teach. Theory Pract. 2016, 22, 653–669. [Google Scholar] [CrossRef]
- Clarke, D.; Hollingsworth, H. Elaborating a model of teacher professional growth. Teach. Teach. Educ. 2002, 18, 947–967. [Google Scholar] [CrossRef]
- Ingvarson, L.; Meiers, M.; Beavis, A. Factors affecting the impact of professional development programs on teachers’ knowledge, practice, student outcomes & efficacy. Educ. Policy Anal. Arch. 2005, 13, 10. [Google Scholar]
- Garet, M.S.; Porter, A.C.; Desimone, L.; Birman, B.F.; Yoon, K.S. What makes professional development effective? Results from a national sample of teachers. Am. Educ. Res. J. 2001, 38, 915–945. [Google Scholar] [CrossRef] [Green Version]
- Latham, N.I.; Wogt, W.P. Do Professional Development Schools Reduce Teacher Attrition?: Evidence from a Longitudinal Study of 1000 Graduates. J. Teach. Educ. 2007, 58, 153–167. [Google Scholar] [CrossRef]
- Nang, S.N.; Yan, Y. The Relationship Study of Teachers’ Perceptions Towards Professional Development and Their Job Satisfaction at Monastic Primary School in Namlan, Hsipaw, Northern Shan State, Myanmar. Sch. Hum. Sci. 2019, 11, 1. [Google Scholar]
- OECD (Ed.) TALIS 2018. Available online: https://www.oecd.org/education/talis/talis-2018-data.htm (accessed on 4 October 2021).
- OECD. TALIS 2018 and TALIS Starting Strong, 2018 User Guide; OECD: Paris, France, 2019; p. 699. [Google Scholar]
- OECD. TALIS 2018 Technical Report; OECD: Paris, France, 2019; p. 496. [Google Scholar]
- Bosker, R.J.; Snijders, T.A.B. Multilevel analysis: An Introduction to Basic and Advanced Multilevel Modeling, 2nd ed.; Sage: London, UK, 2012. [Google Scholar]
- Hox, J.J.; Moerbeek, M.; van de Schoot, R. Multilevel Analysis: Techniques and Applications, 3rd ed.; Routledge: New York, NY, USA, 2018. [Google Scholar]
- Goldstein, H. Multilevel Statistical Models, 4th ed.; Wiley: Hoboken, NJ, USA, 2011. [Google Scholar]
- Rabe-Hesketh, S.; Skrondal, A. Multilevel and Longitudinal Modeling Using Stata, 4th ed.; Stata Press: College Station, TX, USA, 2021; p. 1098. [Google Scholar]
Figure 1.
Predicted job satisfaction as a function of the need for professional development for diversity and special needs and the number of professional development activities participated in.
Figure 1.
Predicted job satisfaction as a function of the need for professional development for diversity and special needs and the number of professional development activities participated in.

Figure 2.
Predicted job satisfaction as a function of the need for professional development in subject matter and pedagogy and the number of professional development activities participated in.
Figure 2.
Predicted job satisfaction as a function of the need for professional development in subject matter and pedagogy and the number of professional development activities participated in.

Figure 3.
Predicted job satisfaction as a function of the number of professional development activities participated in.
Figure 3.
Predicted job satisfaction as a function of the number of professional development activities participated in.

Figure 4.
Differences in predicted job satisfaction as a function of the number of professional development activities participated in, compared to no participation.
Figure 4.
Differences in predicted job satisfaction as a function of the number of professional development activities participated in, compared to no participation.

Table 3.
Estimation results from multilevel model.
| Fixed Effects Parameters | Coefficient | S.E. | p-Value | |
|---|---|---|---|---|
| Gender (ref. = women) | −0.283 | 0.125 | 0.023 | |
| Highest qualification (ref. = below ISCED 3) | Chi2(6) = 379.10 | 0.000 | ||
| ISCED 3 | 0.343 | 0.470 | 0.466 | |
| ISCED 4 | 0.620 | 0.535 | 0.247 | |
| ISCED 5 | 0.557 | 0.594 | 0.349 | |
| ISCED 6 | 0.297 | 0.575 | 0.605 | |
| ISCED 7 | 0.293 | 0.563 | 0.602 | |
| ISCED 8 | 0.226 | 0.516 | 0.662 | |
| Teacherage group (ref. = under 25) | Chi2(5) = 1096.08 | 0.000 | ||
| 25–29 | −0.177 | 0.089 | 0.046 | |
| 30–39 | −0.252 | 0.042 | 0.000 | |
| 40–49 | −0.203 | 0.046 | 0.000 | |
| 50–59 | 0.013 | 0.093 | 0.890 | |
| 60 and above | 0.183 | 0.084 | 0.030 | |
| Teaching as first career choice (ref. = yes) | −0.520 | 0.030 | 0.000 | |
| Contract type (ref. = permanent) | Chi2(2) = 4.13 | 0.127 | ||
| Fixed-term >1 year | 0.099 | 0.112 | 0.377 | |
| Fixed-term <=1 year | 0.025 | 0.084 | 0.763 | |
| Employment status (ref. = Full-time, i.e., >90% of FT) | Chi2(3) = 1.50 | 0.683 | ||
| Part-time (71–90% of FT) | −0.039 | 0.104 | 0.709 | |
| Part-time (50–70% of FT) | −0.056 | 0.211 | 0.789 | |
| Part-time (less than 50% of FT) | −0.140 | 0.185 | 0.449 | |
| Years of experience | −0.020 | 0.003 | 0.000 | |
| Having a mentor (ref. = yes) | −0.285 | 0.043 | 0.000 | |
| Being a mentor (ref. = yes) | −0.244 | 0.114 | 0.033 | |
| Number of prof. dev. activities participated (PD_number) | 0.171 | 0.117 | 0.143 | |
| Need for prof. dev. for diversity and special needs (t3pdiv) | 0.080 | 0.023 | 0.000 | |
| Need for prof. dev. in subject matter and pedagogy (t3pdped) | −0.071 | 0.012 | 0.000 | |
| Interaction term PD_number × t3pdiv | −0.014 | 0.009 | 0.125 | |
| Interaction term PD × t3pdped | 0.010 | 0.003 | 0.002 | |
| Special needs students (ref. = none) | Chi2(3) = 71.74 | 0.000 | ||
| Some | −0.023 | 0.032 | 0.473 | |
| Most | −0.207 | 0.042 | 0.000 | |
| All | 0.069 | 0.156 | 0.660 | |
| School location (ref. = village, i.e., <3000 people) | Chi2(4) = 32.05 | 0.000 | ||
| Small town (3001 to 15,000 people) | −0.142 | 0.052 | 0.006 | |
| Town (15,001 to 100,000 people) | −0.159 | 0.045 | 0.000 | |
| City (100,001 to 1,000,000 people) | −0.263 | 0.133 | 0.047 | |
| Large city (more than 1,000,000 people) | −0.271 | 0.078 | 0.000 | |
| School type (ref. = public) | 0.203 | 0.086 | 0.018 | |
| School size (ref. = under 250) | Chi2(4) = 5.31 | 0.257 | ||
| 250–499 | 0.148 | 0.100 | 0.139 | |
| 500–749 | 0.148 | 0.108 | 0.168 | |
| 750–999 | 0.157 | 0.113 | 0.166 | |
| 1000 and above | 0.219 | 0.114 | 0.054 | |
| School delinquency and violence | −0.034 | 0.009 | 0.000 | |
| Teacher-student relations | 0.197 | 0.013 | 0.000 | |
| Teacher self-efficacy | 0.078 | 0.012 | 0.000 | |
| Student behavior stress | −0.084 | 0.010 | 0.000 | |
| Workplace well-being and stress | −0.397 | 0.006 | 0.000 | |
| Workload stress | −0.050 | 0.027 | 0.062 | |
| Constant | 13.912 | 0.425 | 0.000 | |
| Random-effects parameters | Estimate | S.E. | 95% CI | 95% CI |
| Level 3: intercept variance | 0.026 | 0.007 | 0.016 | 0.043 |
| Level 2: intercept variance | 0.364 | 0.038 | 0.297 | 0.447 |
| Level 1: residual variance | 2.577 | 0.208 | 2.201 | 3.019 |
| Sample size | N | |||
| Sample size level 3 (regions) | 20 | |||
| Sample size level 2 (schools) | 3128 | |||
| Sample size level 1 (teachers) | 49,378 |
Notes: reported standard errors (S.E.) are robust standard errors. In order to account for the sampling design (i.e., different selection probabilities for teachers and schools), in the estimation procedure, observations are weighed using teacher weights and school weights (which are included in the TALIS 2018 database) [56,57,58]. Source: made by author, based on TALIS 2018 [56].
Publisher’s Note: MDPI stays neutral with regard to jurisdictional claims in published maps and institutional affiliations. |
© 2021 by the author. Licensee MDPI, Basel, Switzerland. This article is an open access article distributed under the terms and conditions of the Creative Commons Attribution (CC BY) license (https://creativecommons.org/licenses/by/4.0/).
Share and Cite
MDPI and ACS Style
Smet, M. Professional Development and Teacher Job Satisfaction: Evidence from a Multilevel Model. Mathematics 2022, 10, 51. https://0-doi-org.brum.beds.ac.uk/10.3390/math10010051
AMA Style
Smet M. Professional Development and Teacher Job Satisfaction: Evidence from a Multilevel Model. Mathematics. 2022; 10(1):51. https://0-doi-org.brum.beds.ac.uk/10.3390/math10010051
Chicago/Turabian StyleSmet, Mike. 2022. "Professional Development and Teacher Job Satisfaction: Evidence from a Multilevel Model" Mathematics 10, no. 1: 51. https://0-doi-org.brum.beds.ac.uk/10.3390/math10010051
Note that from the first issue of 2016, this journal uses article numbers instead of page numbers. See further details here.