Article

Measuring the Attractiveness of Cities to Receive Investments in Regional Airport Infrastructure

by
Cláudio Moura Silva
1,*,
Sérgio Ronaldo Granemann
1,
Patricia Guarnieri
2 and
Gladston Luiz Da Silva
3
1
Post-Graduate Program in Transportation, Campus Darcy Ribeiro, University of Brasilia, Brasília 70910-900, Brazil
2
Post-Graduate Program in Management and Post-Graduate Program in Agribusiness, Campus Darcy Ribeiro, University of Brasília, Brasília 70910-900, Brazil
3
Post-Graduate Program in Applied Computing, Campus Darcy Ribeiro, University of Brasília, Brasília 70910-900, Brazil
*
Author to whom correspondence should be addressed.
Submission received: 19 March 2022 / Revised: 25 April 2022 / Accepted: 28 April 2022 / Published: 19 May 2022
(This article belongs to the Topic Multi-Criteria Decision Making)

Abstract

:
The vast Brazilian territory and the accelerated economic growth of the cities of the country’s interior in recent years have created a favourable environment for the expansion of regional aviation. In 2015, the Brazilian Government launched a program of investments in regional airports equipping them to receive commercial flights. However, the economic crisis and the scarcity of resources drive the prioritisation of projects with a greater economic and social return. This article aims to present a multicriteria decision aid (MCDA) model to measure cities’ attractiveness to receive investments in regional airports. The MCDA approach can deal with multiple indicators and different points of view and provide systematised steps for supporting decision-makers. For this purpose, we selected 12 criteria among the evaluation parameters identified in the literature, which led to the construction of the evaluation model and elaborating the ranking of the localities participating in the investment program. This study can contribute scientifically by proposing the use of an MCDA approach to support decisions related to logistics and infrastructure. It can help managers and practitioners provide a structured and systematised model to address decisions related to airport investments.

1. Introduction

Passenger movement in air transport has almost doubled in Brazil in the last decade. It is estimated that it will reach more than 500 million passengers per year [1]. However, this growth was not accompanied by investments in regional airport infrastructure. From the 1990s, the airline industry’s deregulation resulted in increased demand, lower ticket prices, and increased flights and led to the concentration of activities in a smaller number of cities in a system known as hub-and-spoke [2].
The pent-up demand for regional aviation was found in a survey by the Civil Aviation Secretariat (CAS) (2015), which identified 149 municipalities without regular flights, exporting 65,000 passengers per year to airports located in other cities. This amount would be sufficient to occupy two aircraft with 114 seats in the stake, with an index of 85% occupancy daily.
The development of regional aviation falls short of what is desirable, given its high importance for Brazil’s economic and social development [3]. The number per capita in domestic air travel in Brazil reached 0.47 in 2016 [4]. This number is higher than the world average, which stood at 0.28. However, it is still far behind countries with a high level of development and similar territorial dimensions, such as Australia (2.41), the United States (2.08), and Canada (1.27).
However, the growth of regional aviation depends on good airport infrastructure for the safe and economical operation of aircraft. In this context, the Regional Aviation Development Program (RADP) was created in 2015 to implement a network of regional airports to ensure that 96% of the population is 100 km away from the airport with regular flights. At first, 270 locations were selected; however, after successive cuts, this number was reduced until reaching 53 target cities of the program [5].
In turn, the lack of resources to invest in airfield infrastructure was the answer most cited by airport operators in research on the problems that hinder the attraction of regular flights [6]. Furthermore, the lack of adequate airport infrastructure is currently the factor that requires the greatest attention from Brazilian authorities in regional aviation [7]. The authors suggested that new studies deepen the theme, refining the methods employed in their research with other variables.
With the development of a methodology for prioritising public investments in highways using multicriteria analysis, the authors of [8] also recommended that other researchers move forward using these tools to analyse investments in other transport modalities (rail, waterway, and airport).
In addition, some articles dealt with multicriteria analysis involving airports. Sn optimisation model implementing the allocation of slots in the European Union was developed to better accommodate airline slot preferences at coordinated airports [9]. A study in developing countries using the Macbeth method was presented by [10]. Another study proposing a methodology called the airport site selection methodology, providing a more objective decision-making process, combining GIS (geographic information system) and the classic AHP (analytic hierarchy process), was presented by [11].
The identification of the best location for a military airport using multicriteria methods was approached by [12]. The multicriteria methodology proved appropriate for evaluating diverse alternatives to centralise multimodal cargo at a hub airport in Morocco [13]. The application of multicriteria methodology to study issues related to the choice of airport location was presented by [14]. According to [15,16], applying the multicriteria analysis methodology in the airport location selection procedure is essential when evaluating possible alternatives. When measuring the efficiency of airports in the Iberian Peninsula using the multicriteria methodology, the authors of [17] noted that the Macbeth tool proved very promising compared to traditional approaches, since it seemed to be more accurate and easily applicable.
Thus, several other studies presented methodology to, in some way, study Brazilian municipalities or regions concerning the need for investments in regional aviation. However, they differed from this study in many respects, either in the methodology adopted or in the results obtained.
In this sense, the author of [6], on the basis of the number of interstate road trips generated by the municipalities, concluded that using the Moran I index is a good tool for defining areas whose demand would justify the existence of regular flight supply. However, it was pointed out that introducing other variables could make his evaluation model more accurate and complete.
In turn, the authors of [7] proposed an econometric model based on macroeconomic and geographic data, which estimated the potential of air transport demand in the northeast region of Brazil. Although they did not apply the model to all cities of the RADP, those that appeared in both that and this study obtained a similar classification order.
Furthermore, another study presented indicators to measure the potential of air transport demand in municipalities through a decision tree [18]. Of the 15 indicators presented, six coincided with the criteria adopted in this study. This research, however, did not present the application of the method for the hierarchisation of localities.
Additionally, the use of support vector machines to aid in decision making for airport investment purposes was studied in [19]. According to the history of registration of domestic flight destinations and cities’ characteristics with regular flights, a projection of cities suitable for regional aviation and not yet serviced by scheduled flights was made. This study did not create a ranking, but pointed to cities that would be more likely to develop regular aviation.
In this scenario, considering the above-mentioned studies, to the best of our knowledge, there is no study addressing the allocation of resources in airport infrastructure using multicriteria methods. Brazil is a country with several bottlenecks related to distribution logistics and the balanced use of transport modes. The handling of goods occurs primarily via road transport, which is also predominantly responsible for transporting people and cargo around the country. However, the road mode has a high rate of accidents and theft. On the other hand, air transport is considered safe and very agile, being the best option for delivering emergency cargo and high-value products and people. The largest sector contributing to air transport in Brazil is undoubtedly tourism, which was strongly affected by the COVID-19 pandemic. Thus, decisions related to investments in airport infrastructure are essential to guarantee the feasibility of projects and the efficient use of resources.
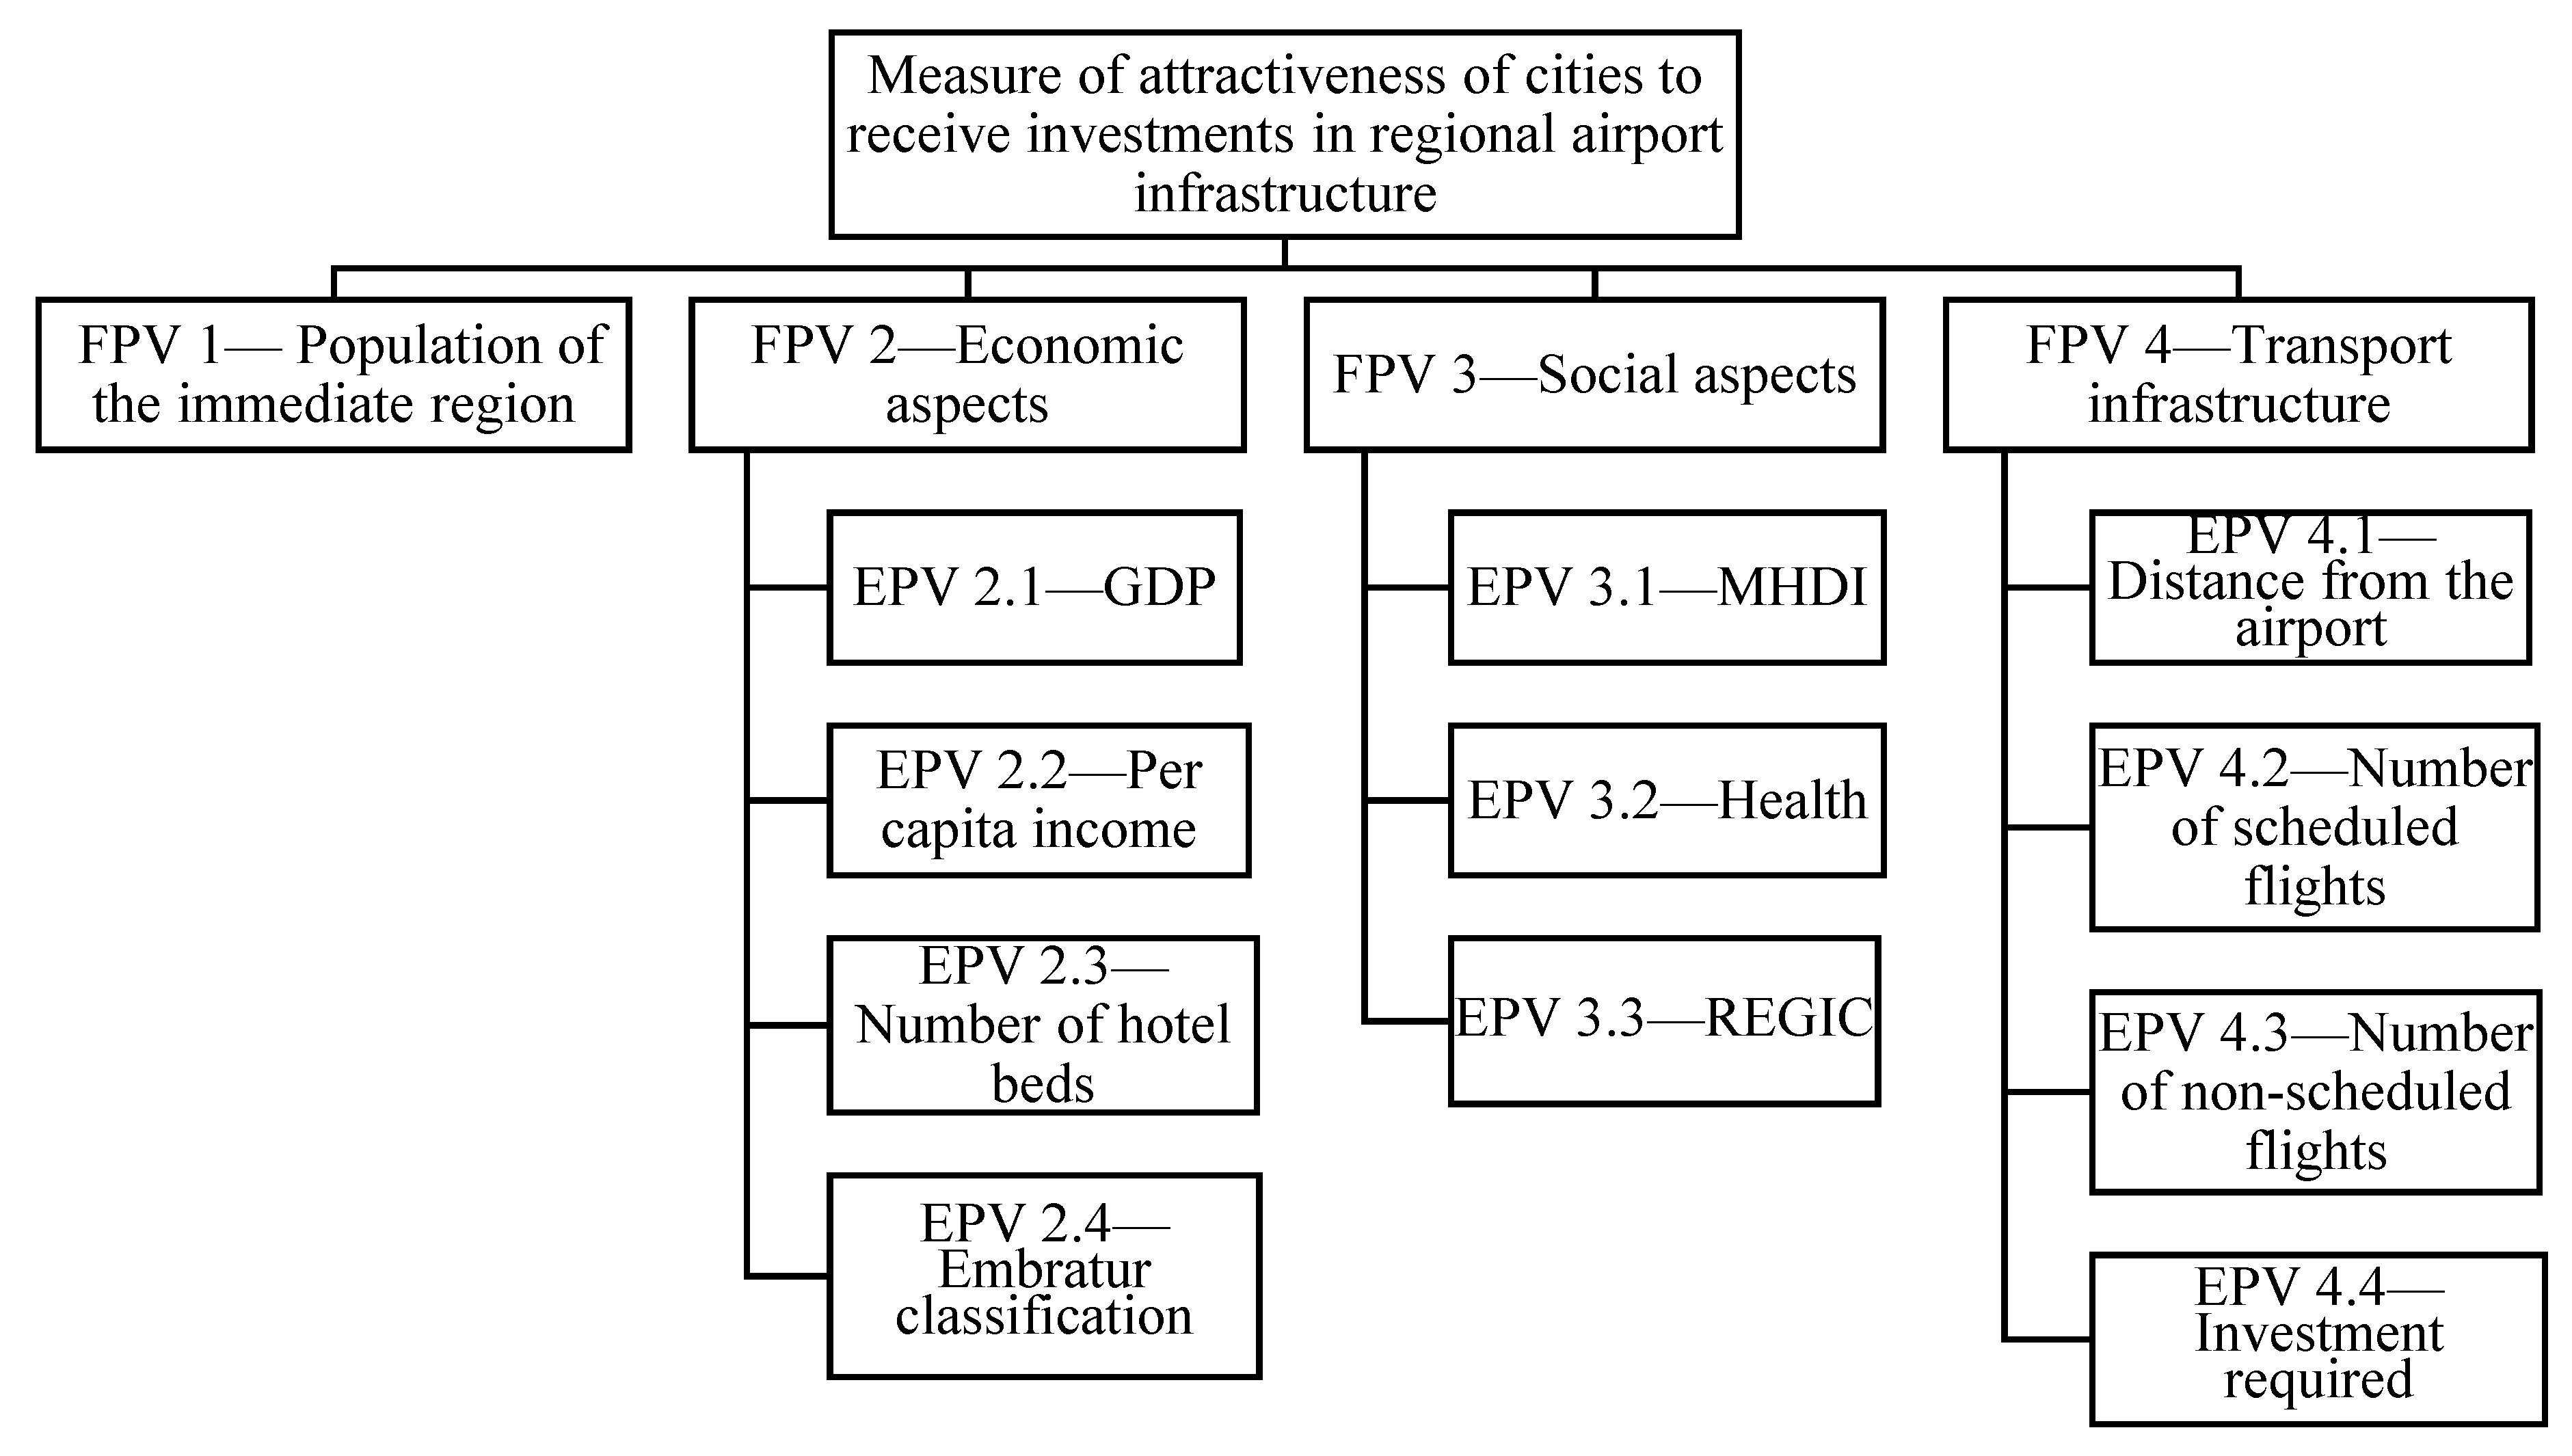
This study aims to cover a possible gap in the literature regarding the allocation of resources in regional airport infrastructure. In this context, this article presents a model to measure the attractiveness of cities to receive investments in regional airports through the multicriteria decision aid (MCDA) approach, specifically using the measuring attractiveness by a categorical-based evaluation technique (Macbeth). In the methods section, we provide a detailed description of multicriteria modelling and the systematised steps of the model. The results may support government agencies and private companies interested in investing in regional air transport. Furthermore, the model used can be adopted for future resource allocation processes to install or expand airport infrastructure.
In the Brazilian public sector, decision making for investments in infrastructure is often based on political criteria without using more structured methodologies to aid decisions. In the case of investments in regional airports, it is essential to consider different technical, operational, economic, and geographic parameters, among others, to define which locations are more attractive to receive investments. Considering that there is no single parameter to guide decision making, MCDA is very helpful. It allows the combination of relevant criteria, each with its weight defined by a group of experts, to arrive at the attractiveness indicator of each candidate location to receive the investment. Creating an MCDA model for this purpose and incorporating important essential parameters to guide choices gives managers greater rationality and a foundation for decision making.
The model allows structuring of the problem anchored in quantitative and qualitative, objective and subjective criteria, enabling the incorporation of economic, political, environmental, operational, and technical points of view, among others. It can also simultaneously analyse a range of alternatives to MCDA methods. It allows the measurement of attractiveness through a numerical indicator without the need for another comparison between the alternatives of evaluated locations.
The model proposal also presents differences in simplifying the structuring of the problem through a matrix of points of view. It also facilitates comparisons between the fundamental points of view and the alternatives of existing locations. It calculates a dimensionless numerical indicator, enabling the ranking of locations according to their attractiveness to receive public investments.
Thus, we emphasise that the results of this study differentiate and complement the other studies addressed in the literature regarding the classification of Brazilian airports, both regarding the methodology employed and concerning the scope of the results.
In addition to the introductory section, this article is composed of six more sections: Section 2, literature review; Section 3, method description; Section 4, application of the method; Section 5, results; Section 6, analysis and discussion of the results; Section 7, final remarks.

2. Literature Review

2.1. Regional Aviation

According to [20], regional aviation terminology is usually attributed to the activity regularly exploited by aircraft with a capacity of fewer than 100 passengers, used in connections with cities with reduced traffic density. In Brazil, Law No. 13097/2015 defines a regional airport as having an annual movement of fewer than 800,000 passengers in the Legal Amazon Region and 600,000 passengers for the other regions.
Regional air transport plays a fundamental role because of its multiplier effect on the economic activity of regions far from large centres, has along with indirect benefits and social effects [21]. As indirect effects, it is possible to mention the generation of employment and income throughout the supply chain and the expenses of workers in the local goods and services sectors [3].
The authors [22] found a strong correlation between the performance of regional airports and the growth of local economies in Australia. They suggested that the state should financially support these airports in bad times of the national economy to stimulate the growth of local economies. The authors of [23] stated that a regional airport can affect local development by attracting new residents, facilitating market access, providing face-to-face meetings, improving productivity, lowering costs, and simplifying the management of enterprise networks.
Experiences in the US and Europe have shown that regional air transport is the fastest-growing segment, promoting better use of airport infrastructure and reducing congestion at airports in large centres [24]. In Brazil, the stimulus to regional aviation is also justified by the need to provide services to isolated locations in the Amazon, the development of inland cities, the promotion of greater population access to air transport, and the tourism industry. On the other hand, the growth of regional aviation depends on airport infrastructure [21].
Segments of economic infrastructure, such as transportation, should be part of a long-term public investment planning strategy [25]. Furthermore, the study also claimed that it is essential to identify which locations should be given priority in face of the increasing scarcity of resources [26]. Additionally, a correct method of locating regional airports is essential to ensure that public resources are invested in facilities that will provide the region’s expected development [26].

2.2. Multicriteria Methodology Applied in Infrastructure Projects

Several studies have pointed to the feasibility and adequacy of the application of MCDA to define investments in the airport sector due to the complexity that a decision to allocate investments of this level requires.
According to [27], MCDA seeks to make the process as neutral, objective, valid, and transparent as possible, without indicating a single and accurate solution to the decision makers, but presenting a set of alternatives to the decision maker. According to [28], in MCDA analysis, it is assumed that there are several alternatives among which the decision-maker has to choose, and each alternative is described for its performance in each of the criteria. The authors of [29] stated that MCDA can be very useful in decision-making processes in public policies since decisions need to be guided by technical, objective, and transparent criteria.
According to [8], the choice and judgment of the criteria performed by the real decision-makers and added to their technical-political feeling will generate results not yet explored in the literature due to the insertion of analyses that translate expectations, emotions, ideologies, and sensations related to both technical and political choices.
The authors of [30] justified using multicriteria analysis to measure logistical performance because it is a method with low mathematical complexity. It can explain the decision-makers’ reality because it has application in the public and private sectors.
Additionally, MCDA is appropriate to support the choice of main airports because it is a complex decision that should consider costs, security, economic viability, and travel time, all with different and varied impacts and implications [31].
One study illustrated the multicriteria method’s application to identify the position/function of each aerodrome within a region served by several airports [32]. The authors also proved that multicriteria analysis is an appropriate instrument for classifying airports in the same geographical area, showing that the strengths of each can be exploited.

2.3. Evaluation Criteria

The methodology for estimating the demand for domestic air transport in Turkey identified that the variables most cited in the literature for this purpose were population, gross domestic product (GDP), distance, travel time, ticket price, GDP per capita, frequency of service, consumer price indices, the volume of imports, jobs, costs, exchange rate, expenses, fuel price, hotel capacity, ground travel time to the airport, number of airlines on a given route, flight offer, and seasonality of the course [33]. Demand is determined by economic and structural factors and the quality of services, such as income from the population and the price of passage [34].
The following variables of demand for air transport were cited by [7]: the average fare, the average yield, the income of users, the region’s GDP served, jobs, distances, the level of supply, and prices of competing services, such as road transport or the option for nearby airports. On the other hand, the authors of [35] listed average income, GDP, population, ticket price, MHDI, the distance between airports, and education as possible variables to estimate passenger demand on regional flights. Public investment in regional airports must consider at least three criteria [36]: population, extraterritoriality (aiming to serve a set of municipalities), and accessibility conditions (to serve municipalities located at least 1 h from the airport).
The generation and attraction of demand should consider the following indicators [18]: total population, urban population, municipal GDP, employment, vehicle fleet, number of companies, number of companies in the second and third sectors, energy consumption, hotel beds, tourism sector revenue, consolidated tourism, regular flights, nonregular flights, interstate bus lines, and car travel. To prioritise airport investments, it is necessary to consider the geographic region of the municipality, population reached, GDP per capita, number of jobs generated in the tourism sector, number of commercial establishments, number of visitors, Embratur classification, existence of regular flights, distance to the nearest airport, and budget expenses of the municipality with transportation [19].
In the study on regional airports developed by [37], the following performance indicators were used: length, width, and resistance of the runway, centrality class (REGIC), municipal GDP, regular flights, tourism centres, destination health, destination business, educational and scientific destinations, standard interstate road lines, total value of imports, total value of exports, industrial value-added GDP, lodging, retail trade, and educational level of the population.
In Brazil, to classify the airport network of the National Air Plan, the authors of [1] used the following indicators: attendance of the population up to 60 min, attendance of the population up to 120 min, population coverage in the Legal Amazon Region, accessibility to tourist destinations, number of regular connections, number of potential standard connections, average travel time to the airport, investment cost per passenger, possible economic sustainability of the airport, potential revenue for the market, and potential contribution to demand.
The criteria presented in Table 1 can be used for more holistic decision making. When we compare these criteria with those used by the public sector in Brazil, it is possible to verify that this list is more comprehensive.

3. Method

The study was developed through exploratory and applied research, aiming to identify the criteria that support selecting locations for the receipt of investments in airport infrastructure and the development of a method for this selection. Multicriteria modelling is applied to rank the best alternatives to be chosen (in this case, the localities for investments in airports). MCDA modelling consists of three distinct but intrinsically correlated stages: (i) structuring of the model; (ii) evaluation of potential actions (alternatives); (iii) analysis of the results. A multicriteria method is recommended when the decision context involves at least two alternatives to be chosen and two criteria, often reflecting different and conflicting points of view. There are several approaches and methods to be used; the choice depends on the rationality of the decision-makers and the particularities of the decision problem. This study used the semantic judgment approach, considered by [27] as the most adequate to help decision-makers define their preferences in evaluating potential actions from a given point of view. The construction of value functions by the method of semantic judgment occurs through the pairwise comparison of the difference in attractiveness between potential actions, as proposed by [38]. Comparisons are made using a semantic ordinal scale, in which the decision-maker expresses the intensity of preference for one action over another [27].
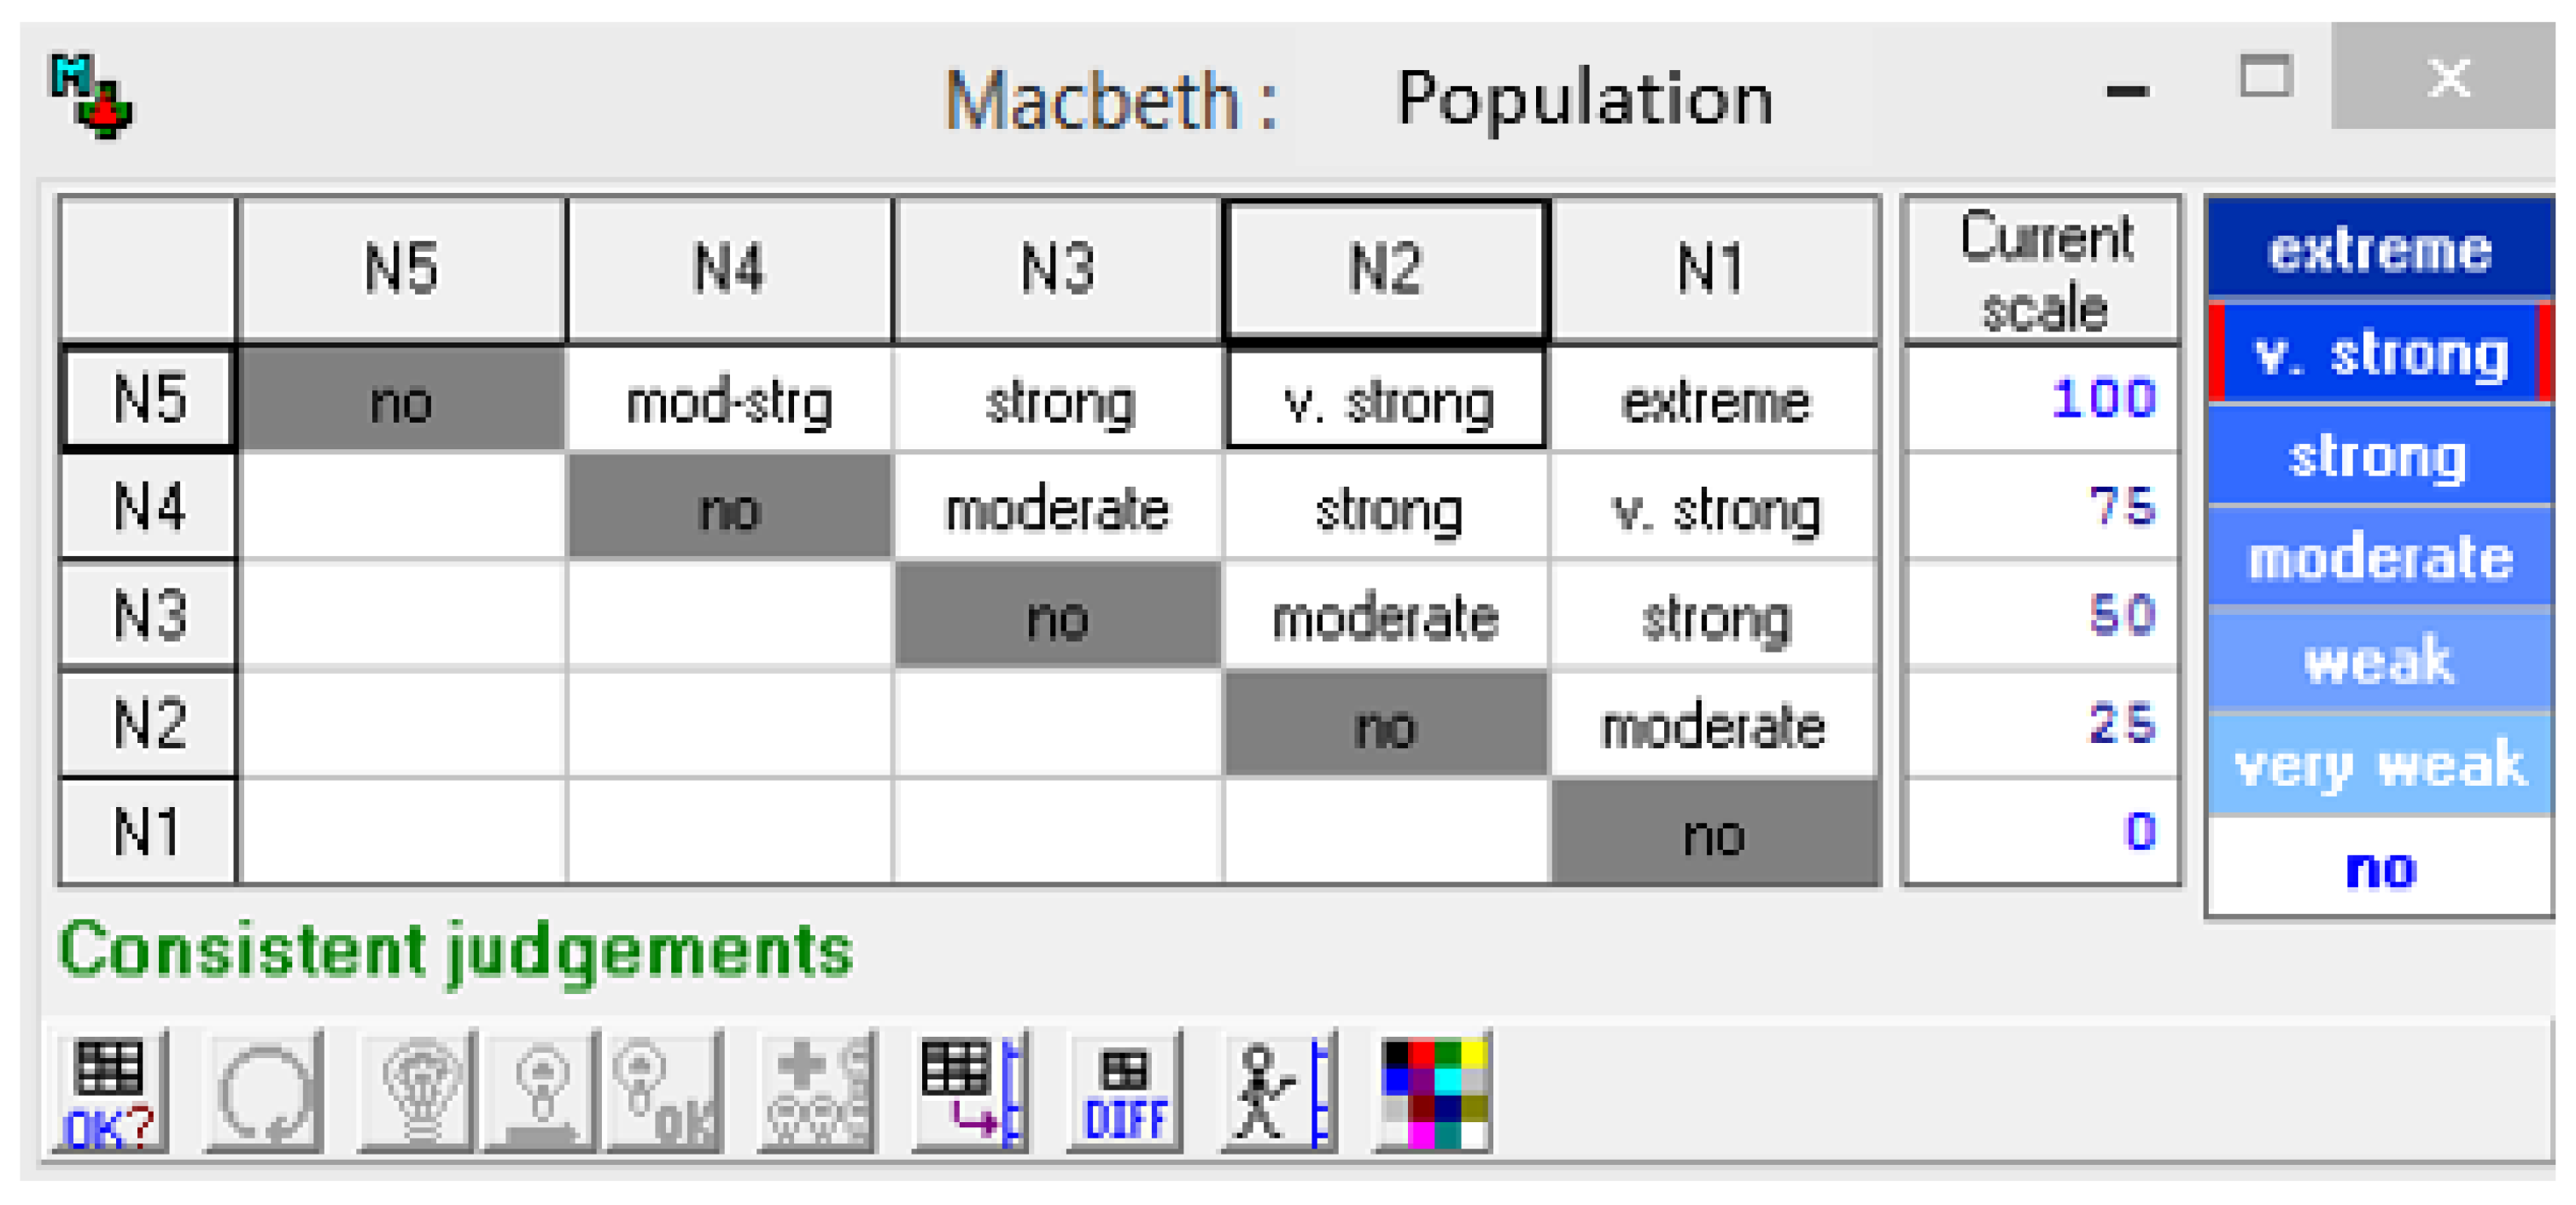
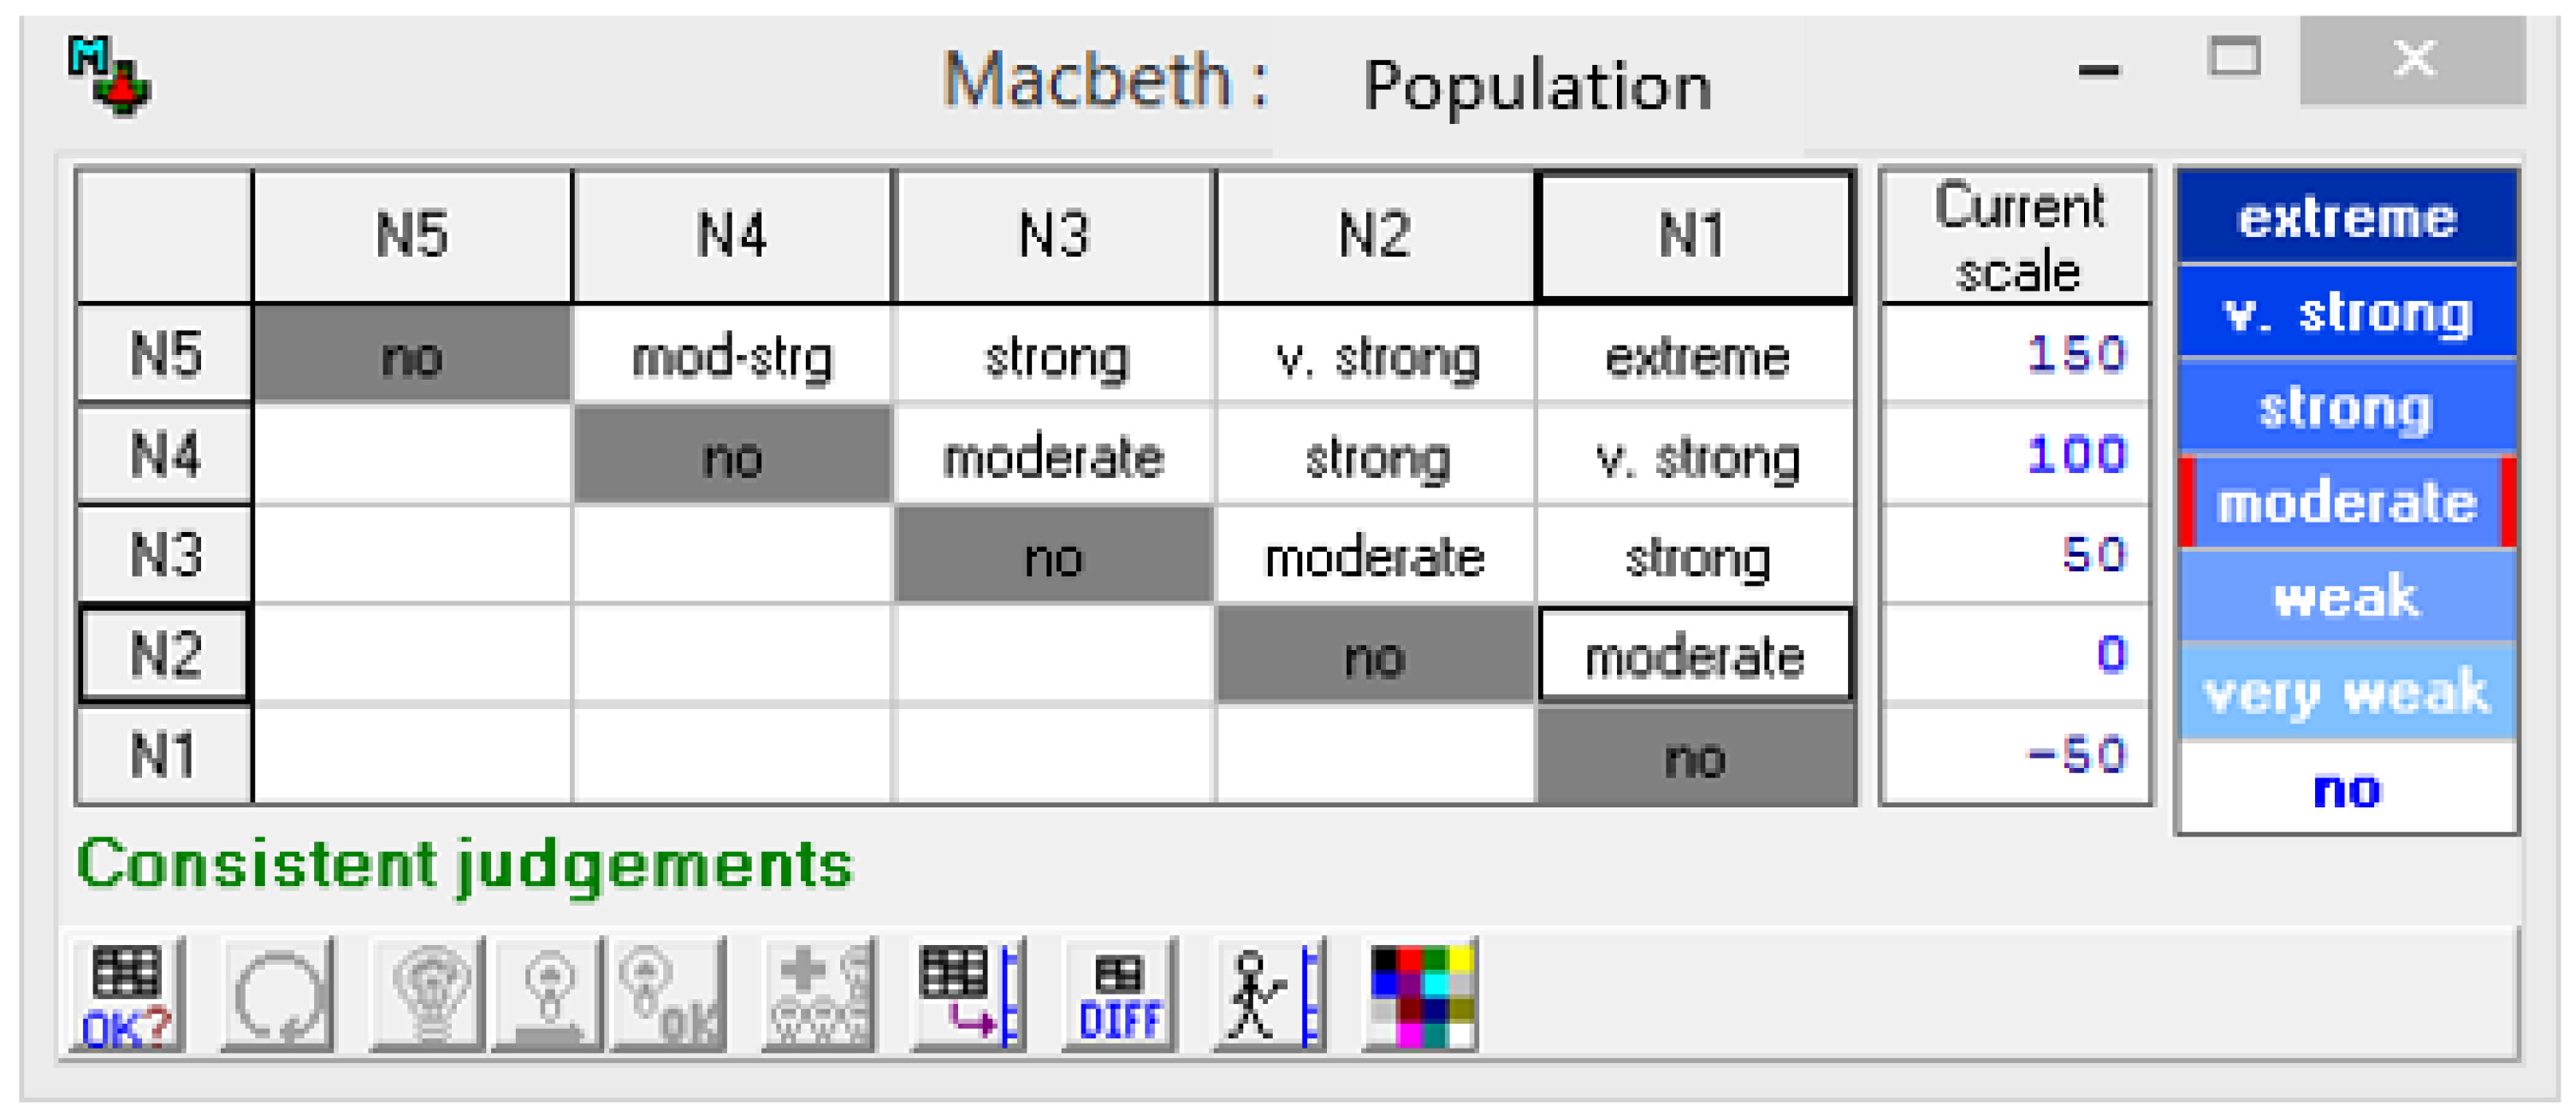
The most used method to construct value functions is the semantic judgment method called measuring attractiveness by a categorical-based evaluation technique (Macbeth). Macbeth uses the semantic judgments of decision-makers to, through linear programming, determine the numerical value that best represents this evaluation. It combines several evaluation criteria into a single composition criterion by assigning weights (replacement rates) to the criteria and sub-criteria presented, always following the decision opinions. According to [39], Macbeth uses a semantic scale of attractiveness differences that facilitates the facilitator/decision-maker dialogue. The decision-maker expresses absolute value judgments of attractiveness difference between only two actions. The differences in attractiveness are then represented by binary relationships that characterise six semantic categories, divided into fundamental and intermediate groups.
Fundamental semantic categories (applicable in cases of hesitation):
  • C2 = {(a,b) ∈ A × A|a P b—the attractiveness difference between a and b is weak};
  • C4 = {(a,b) ∈ A × A|a P b—the attractiveness difference between a and b is strong};
  • C6 = {(a,b) ∈ A × A|a P b—the attractiveness difference between a and b is extreme}.
Intermediate semantic categories (applicable in cases of hesitation):
  • C1 = {(a,b) ∈ A × A|a P b—the attractiveness difference between a and b is negligible or very weak (between null and weak)};
  • C3 = {(a,b) ∈ A × A|a P b—the attractiveness difference between a and b is moderate (between weak and strong)};
  • C5 = {(a,b) ∈ A × A|a P b—the attractiveness difference between a and b is very strong (between strong extreme)}.
The next step is to define replacement rates. According to [40], replacement rates, also known as weights, are parameters that decision-makers deem adequate to aggregate, in a compensatory way, local performances (in the criteria) into a global performance. In this study, the swing weights technique was used to determine replacement rates.
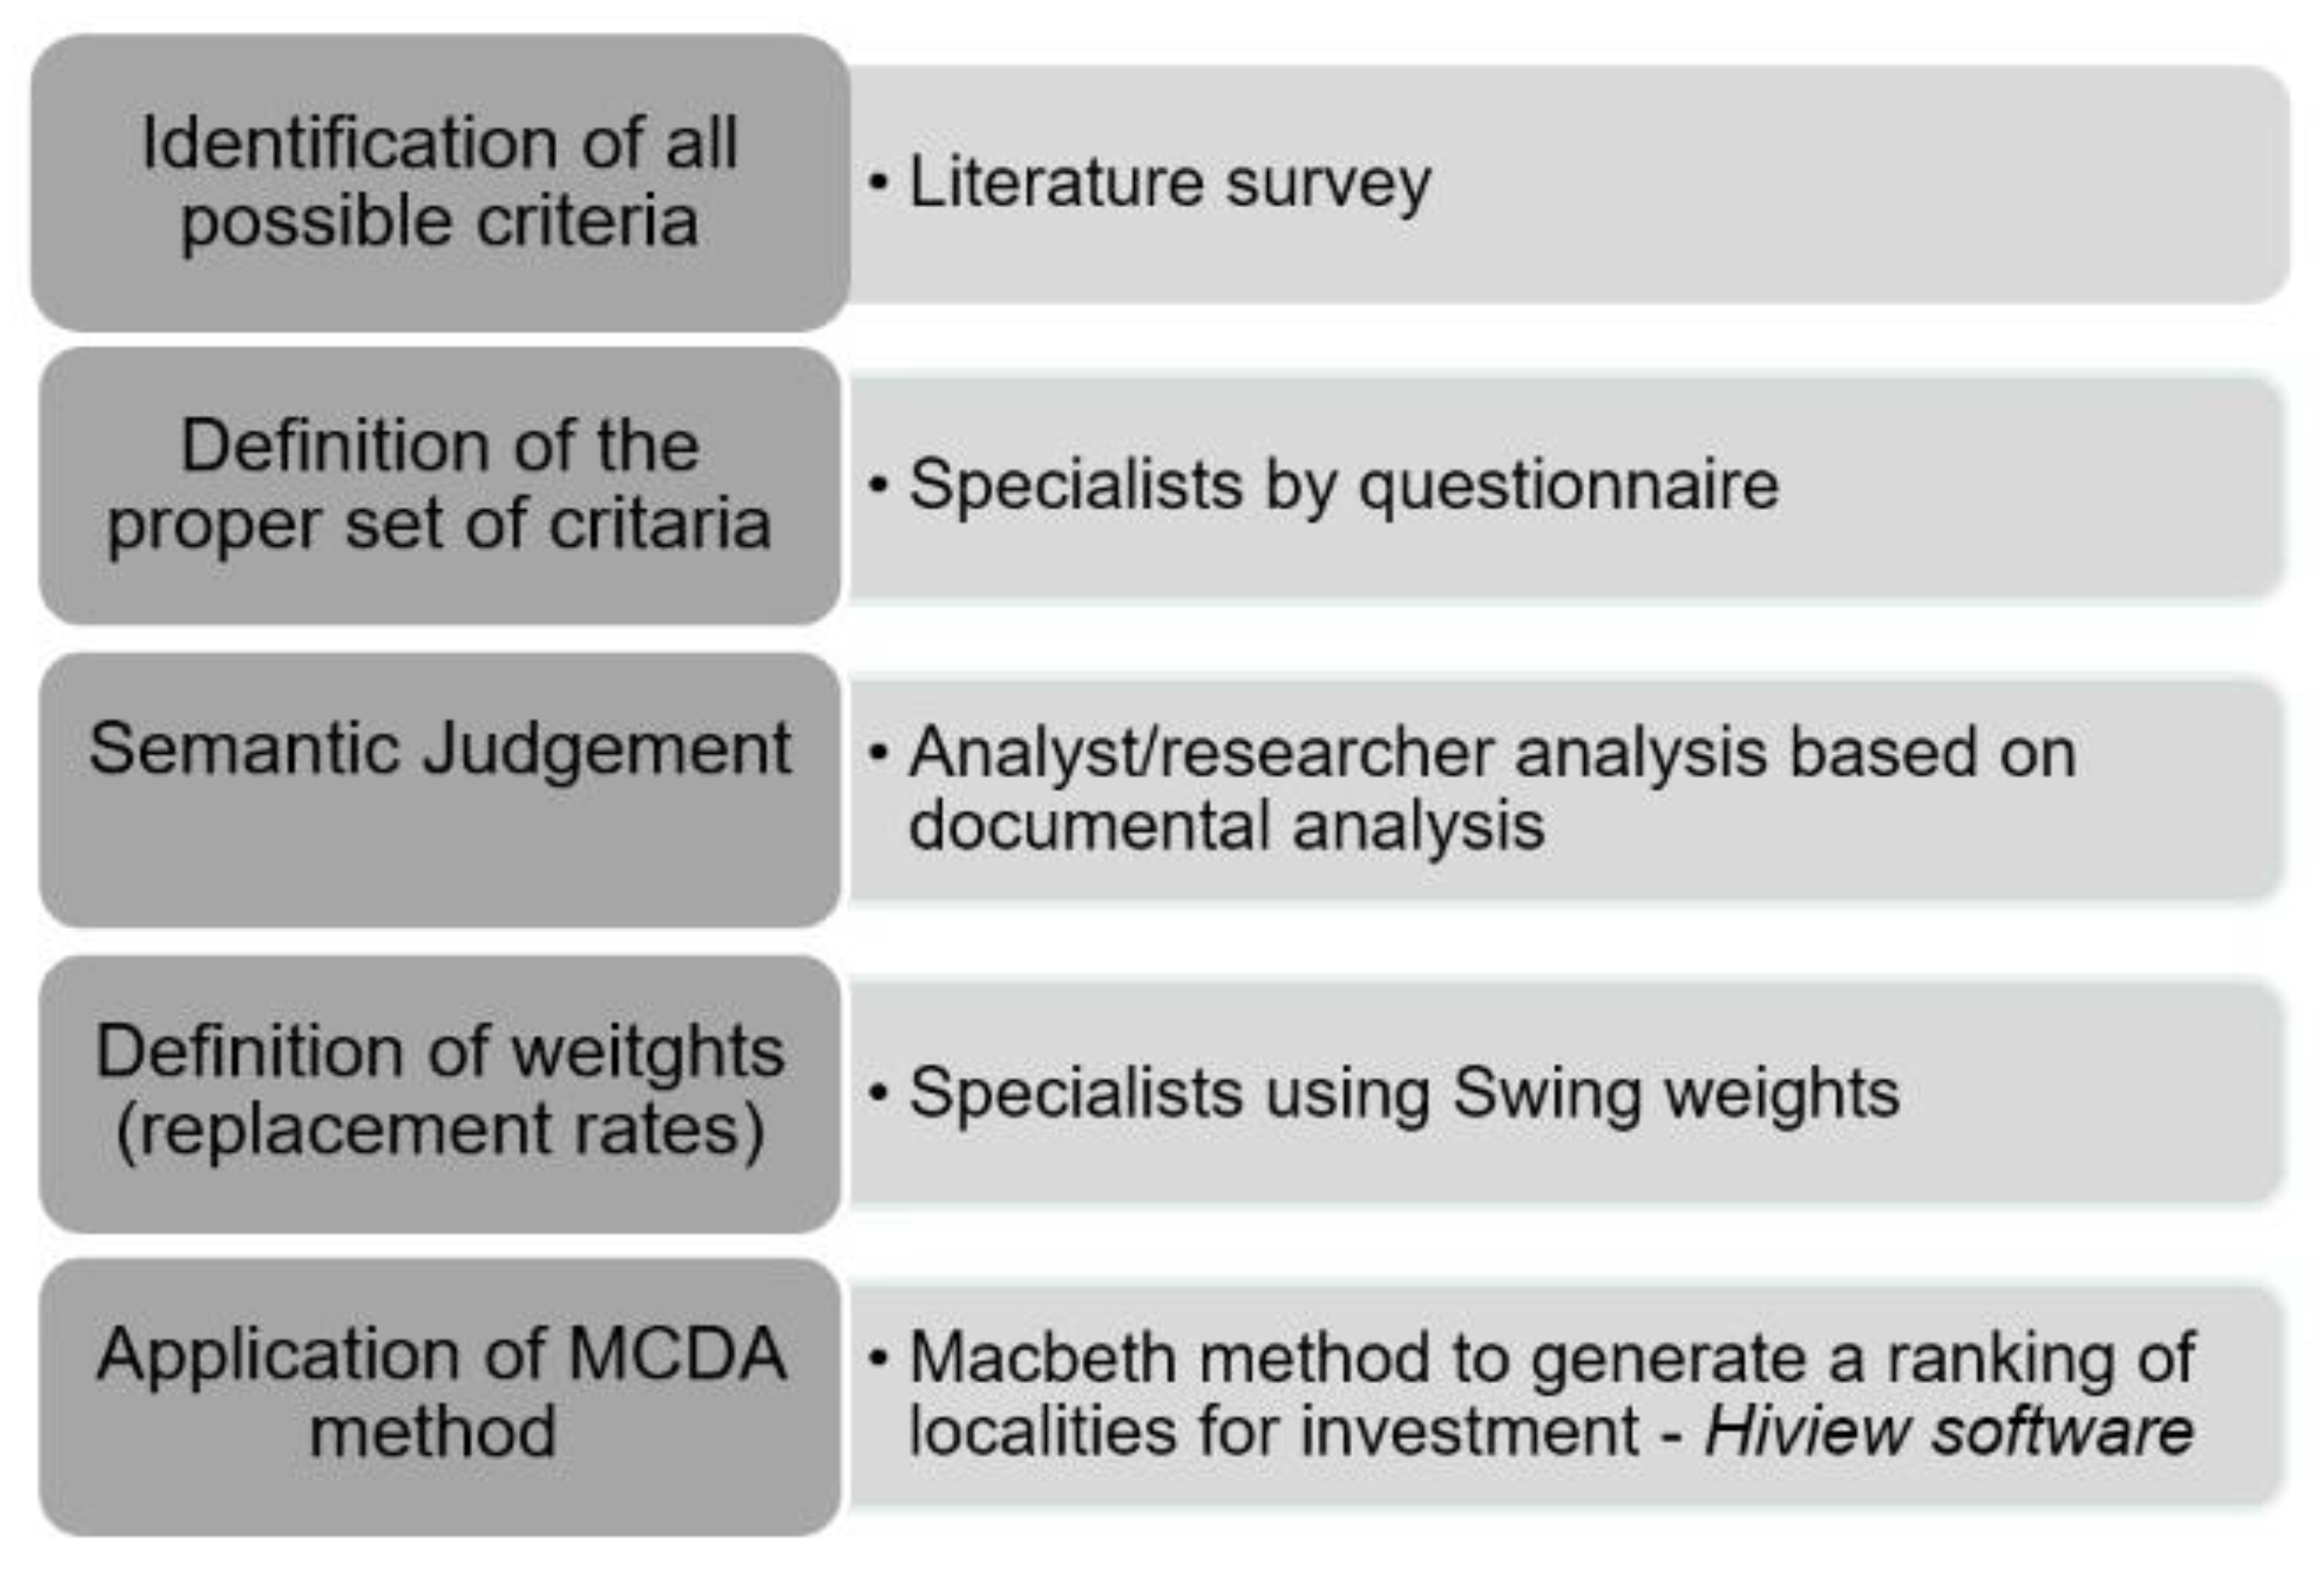
Thus, we carried out the research on the basis of the methodological steps illustrated in Figure 1.
We present the description of each of the steps in the sections below.

3.1. Identification, in the Literature, of the Most Important Criteria for the Definition of Investments in Airports

At this stage, the state of art in regional aviation was verified through searches in articles, monographs, dissertations, theses, technical publications, and applicable legislation. The Web of Science, Scopus, and Google Scholar databases were consulted, emphasising works produced in the last 10 years. At this stage, the criteria that would adhere to the proposed objective were identified, which that, in principle, could be used to evaluate the localities.

3.2. Definition of the Criteria to Be Adopted for the Selection of Localities

On the basis of the literature review, 19 criteria that had greater adherence to the research theme were submitted to evaluate the air sector, and specialists were selected to define the definitive evaluation criteria. A questionnaire was elaborated based on Likert scales for the specialists to assign grades from 1 to 5, where 1 is irrelevant and 5 is very relevant, to choose the definitive criteria for constructing the evaluation model. The questionnaire was preliminarily validated by two technicians with great familiarity with the theme of air transport and postgraduate academic training at the master’s level in transport. We applied the questionnaire to seven specialists from the Brazilian public sector chosen because of their experience with the theme and the hierarchical position in management or strategic advisory roles. They held the positions of Department Director at the Civil Aviation Secretariat (CAS), Coordinator of the CAS, Specialist in Civil Aviation Regulation at the National Civil Aviation Agency (NCAA), Technical Advisor at ‘Empresa de Planejamento e Logística S.A’. (EPL), Advisor to the Minister of Infrastructure, Department Director at the Ministry of Infrastructure, and Legislative Consultant of the Transport Area in the Chamber of Deputies.
According to the specialists’ scores, 12 criteria were selected that obtained a score higher than 2.5 points. The cut-off score corresponds to half of the maximum score that the criterion could achieve when evaluated by the specialists and was obtained by calculating the arithmetic mean of the assigned points.

3.3. Semantic Judgment

In this phase, the locality’s statistical and situational data defined by the Regional Aviation Program were collected for each of the defined criteria in public, recognised, and reliable national databases. The data were ordered and divided into levels to frame the localities. The neutral and good levels were then defined for each of the criteria. Sub-criteria were identified, and semantic judgment of the attractiveness difference of each of these levels was performed using the measuring attractiveness by a categorical-based evaluation technique (Macbeth), as recommended by [41].

3.4. Definition of Weights to Defined Criteria

The seven specialists described in Section 3.2 were again consulted to define the criteria’s weights at this stage. The Roberts matrix [42] was first used to determine the order of relevance of the criteria and sub-criteria. Then, the swing weights methodology was applied, which seeks to capture the specialists’ preferences by balancing the weights of the criteria. Each criterion and sub-criterion’s weight was reached to define the final score of each locality in the overall evaluation of the model.

3.5. Application of the MCDA Methodology to Build the Ranking of Priority Locations to Receive Investments

In this last step, the substitution rate (weight) was applied for each criterion under evaluation, using the Hiview software [40], which allowed assigning weights to each of the views evaluated. Thus, each city’s score was obtained in each of the criteria and sub-criteria, yielding a final score, enabling the elaboration of the ranking in order of classification of the localities.

4. Application of the Method

The method was applied following systematised steps: (i) evaluation of elements (family of points of view); (ii) construction of the value tree; (iii) evaluation of impact levels; (iv) definition of the value function; (v) transformation of scales of value functions; (vi) definition of replacement rates; (vii) conduction of the sensitivity analysis. The steps are detailed in the sections below.

4.1. Evaluation Elements

On the basis of the opinion of the experts, four axes of evaluation were defined, composed of 12 criteria and sub-criteria, which constituted the family of points of view. Due to the complexity of measuring fundamental points of view (FPVs), most of them were decomposed into elementary points of view (EPVs). The boiling axis after the decomposition of FPVs into EPVs is detailed below.
  • FPV 1—Population of the immediate region: immediate regions replace the old microregions and are structured from nearby urban centres to meet the population’s immediate needs.
  • FPV 2—Economic aspects
    EPV 2.1—Gross domestic product (GDP) aims to measure a given region’s economic activity, representing the sum of all goods and services produced.
    EPV 2.2—Per capita income assesses residents’ average income and may indicate the locality’s degree of economic development.
    EPV 2.3—Number of hotel beds provides data regarding the movement of people residing in other locations and who access the territory of the immediate region’s municipalities.
    EPV 2.4—Consolidated tourism in the headquarters municipality (classification of the Brazilian tourism company Embratur) shows the municipality’s relevance in the national tourist scenario.
  • FPV 3—Social aspects
    EPV 3.1—MHDI of the city headquarters is indicative of the standard of living of the inhabitants of the locality.
    EPV 3.2—Health describes the number of visits from the Unified Health System (UHS) for non-resident citizens in the municipality, which may indicate that the municipality is a health destination.
    EPV 3.3—Hierarchy of urban centres (REGIC—IBGE) classifies cities at hierarchical levels according to their region and country influence.
  • FPV 4—Transport infrastructure
    EPV 4.1—Distance from the nearest airport to the city headquarters considers the distance between the municipality evaluated and the closest class II airport (movement between 200,000 and 1,000,000 passengers per year).
    EPV 4.2—Number of scheduled flights indicates a particular infrastructure for receiving aircraft, although inadequate.
    EPV 4.3—Number of non-scheduled flights may indicate the potential for installing regular lines.
    EPV 4.4—Investment required is the amount needed to install or improve airport infrastructure to operate regular commercial flights in the locality.

4.2. Value Tree

On the basis of the evaluation model’s basic structure, a value tree was constructed, which allows visualising all fundamental aspects of the problem [41]. It corresponds to an arborescent diagram composed of the label by four FPVs (criteria) and 11 EPVs (sub-criteria), whose representation is illustrated in Figure 2.
The next stage in structuring the model consisted of constructing the descriptors (ordinal scale), i.e., the identification of a set of impact levels, ordered in terms of preference, according to the values of decision-makers. These levels of impact represent, in an unambiguous way, the possible performances of an action [39]. For each descriptor, two anchor levels were identified—neutral and good—representing the limits that meet decision-makers’ expectations.

4.3. Impact Levels

For this study, five levels of impact were defined for each descriptor. Table 2, Table 3, Table 4 and Table 5 show the reference levels for the descriptors. The column percentage of cities shows the percentage of cities classified in each level concerning the total of cities studied.

4.4. Value Functions

The value function is the mathematical representation of the preference intensity (attractiveness difference) between the impact levels of a descriptor. Using the semantic judgment method called Macbeth, value functions were constructed for the model. Figure 3 shows the value functions of FPV 1—population of the immediate region.

4.5. Transforming the Scales of Value Functions

The descriptor value function scales were transformed to the model, such that the good level was anchored at a score of 100 and the neutral level was anchored at a score of 0 (zero). Thus, descriptors higher than a good level had scores greater than 100, while descriptors with a level below neutral had negative scores. The numerical values resulting from this transformation are called anchor functions [28]. This transformation took place through linear transformation, using the Macbeth program. Figure 4 shows the anchoring functions of PV1—population of the immediate region.

4.6. Replacement Rates

For the definition of the replacement rates of EPVs and FPVs, the Roberts matrix [43] was first used by the specialists to evaluate a criterion (FPV) or a sub-criterion (EPV) before ordering it relative to the others. Table 6 shows the application of the matrix for the ordering preference of FPVs. According to the preferences of the decision-maker, the sum of each line indicates the ordering of the actions [40].
After using the Roberts matrix [42], the swing weights system was applied to determine the weights of the criteria and sub-criteria. Each specialist awarded a score of 100 to the most relevant criterion or sub-criterion (an item that received a higher score during application of the Roberts matrix) and awarded a proportional score to the remainder compared to the most relevant criterion or sub-criterion. The means obtained by each FPV and EPV were then calculated. Table 7 shows the FPV scores.
After assigning the points, normalisation of the values was performed, whereby the participation of each EPV or FPV was relativised with respect to the sum of points of the EPVs and FPVs, as shown in Table 8.

4.7. Sensitivity Analysis

To test the model’s reliability, sensitivity analysis was performed, increasing or decreasing the weight of the criteria by 10% to verify the impact on the evaluation of potential actions. Thus, the model can be considered robust if there is no substantial change in the result [40]. To facilitate the interpretation of the graph, sensitivity assessments were made by region. As can be seen in the north region chart (Figure 5), the viewpoint “economic aspects” had a weight of 34 in the general evaluation of cities; however, a 10% decrease (30.6) or increase (37.4) in this weight did not result in substantial change in the classification of cities according to this criterion. This shows that the proposed model can be considered robust.

5. Results

The calculation of each locality’s points was obtained through the Hiview software, adding the score obtained for each point of view multiplied by the respective weight, as can be seen in Table 9, where the composition of the scores of the cities of Maringá/PR and Maraã/AM are listed.
Table 10 shows the results of the measure of the attractiveness of cities to receive investments in regional airport infrastructure. It should be emphasised that, among the list of 53 locations listed in the RADP, six airport sites were granted to the private sector in 2019. For this reason, this ranking shows the evaluation of the remaining 47 locations.
Table 11 presents the number of cities by region according to their position in the attractiveness ranking. It was verified that 55% of the cities classified in the first 10 positions were in the south region, which, added to the 27% located in the southeast region, constituted 82% of cities. On the other hand, 100% of the cities classified in the last 10 ranking positions were in the north and northeast regions. Such results indicate a deviation from the hypothesis of dissociation or independence between position in the ranking of attractiveness and regions of the country, as confirmed by the chi-square likelihood ratio test (G2 = 31.9, p-value = 0.014) and the correlation coefficient, whose value of 0.61 indicates a moderate level of association between ranking and regions.

Investment Required by the Locality

Table 12 shows the ranking of cities with respect to the resources needed to construct or expand airport infrastructure, according to data provided by the CAS.

6. Analysis and Discussion of Results

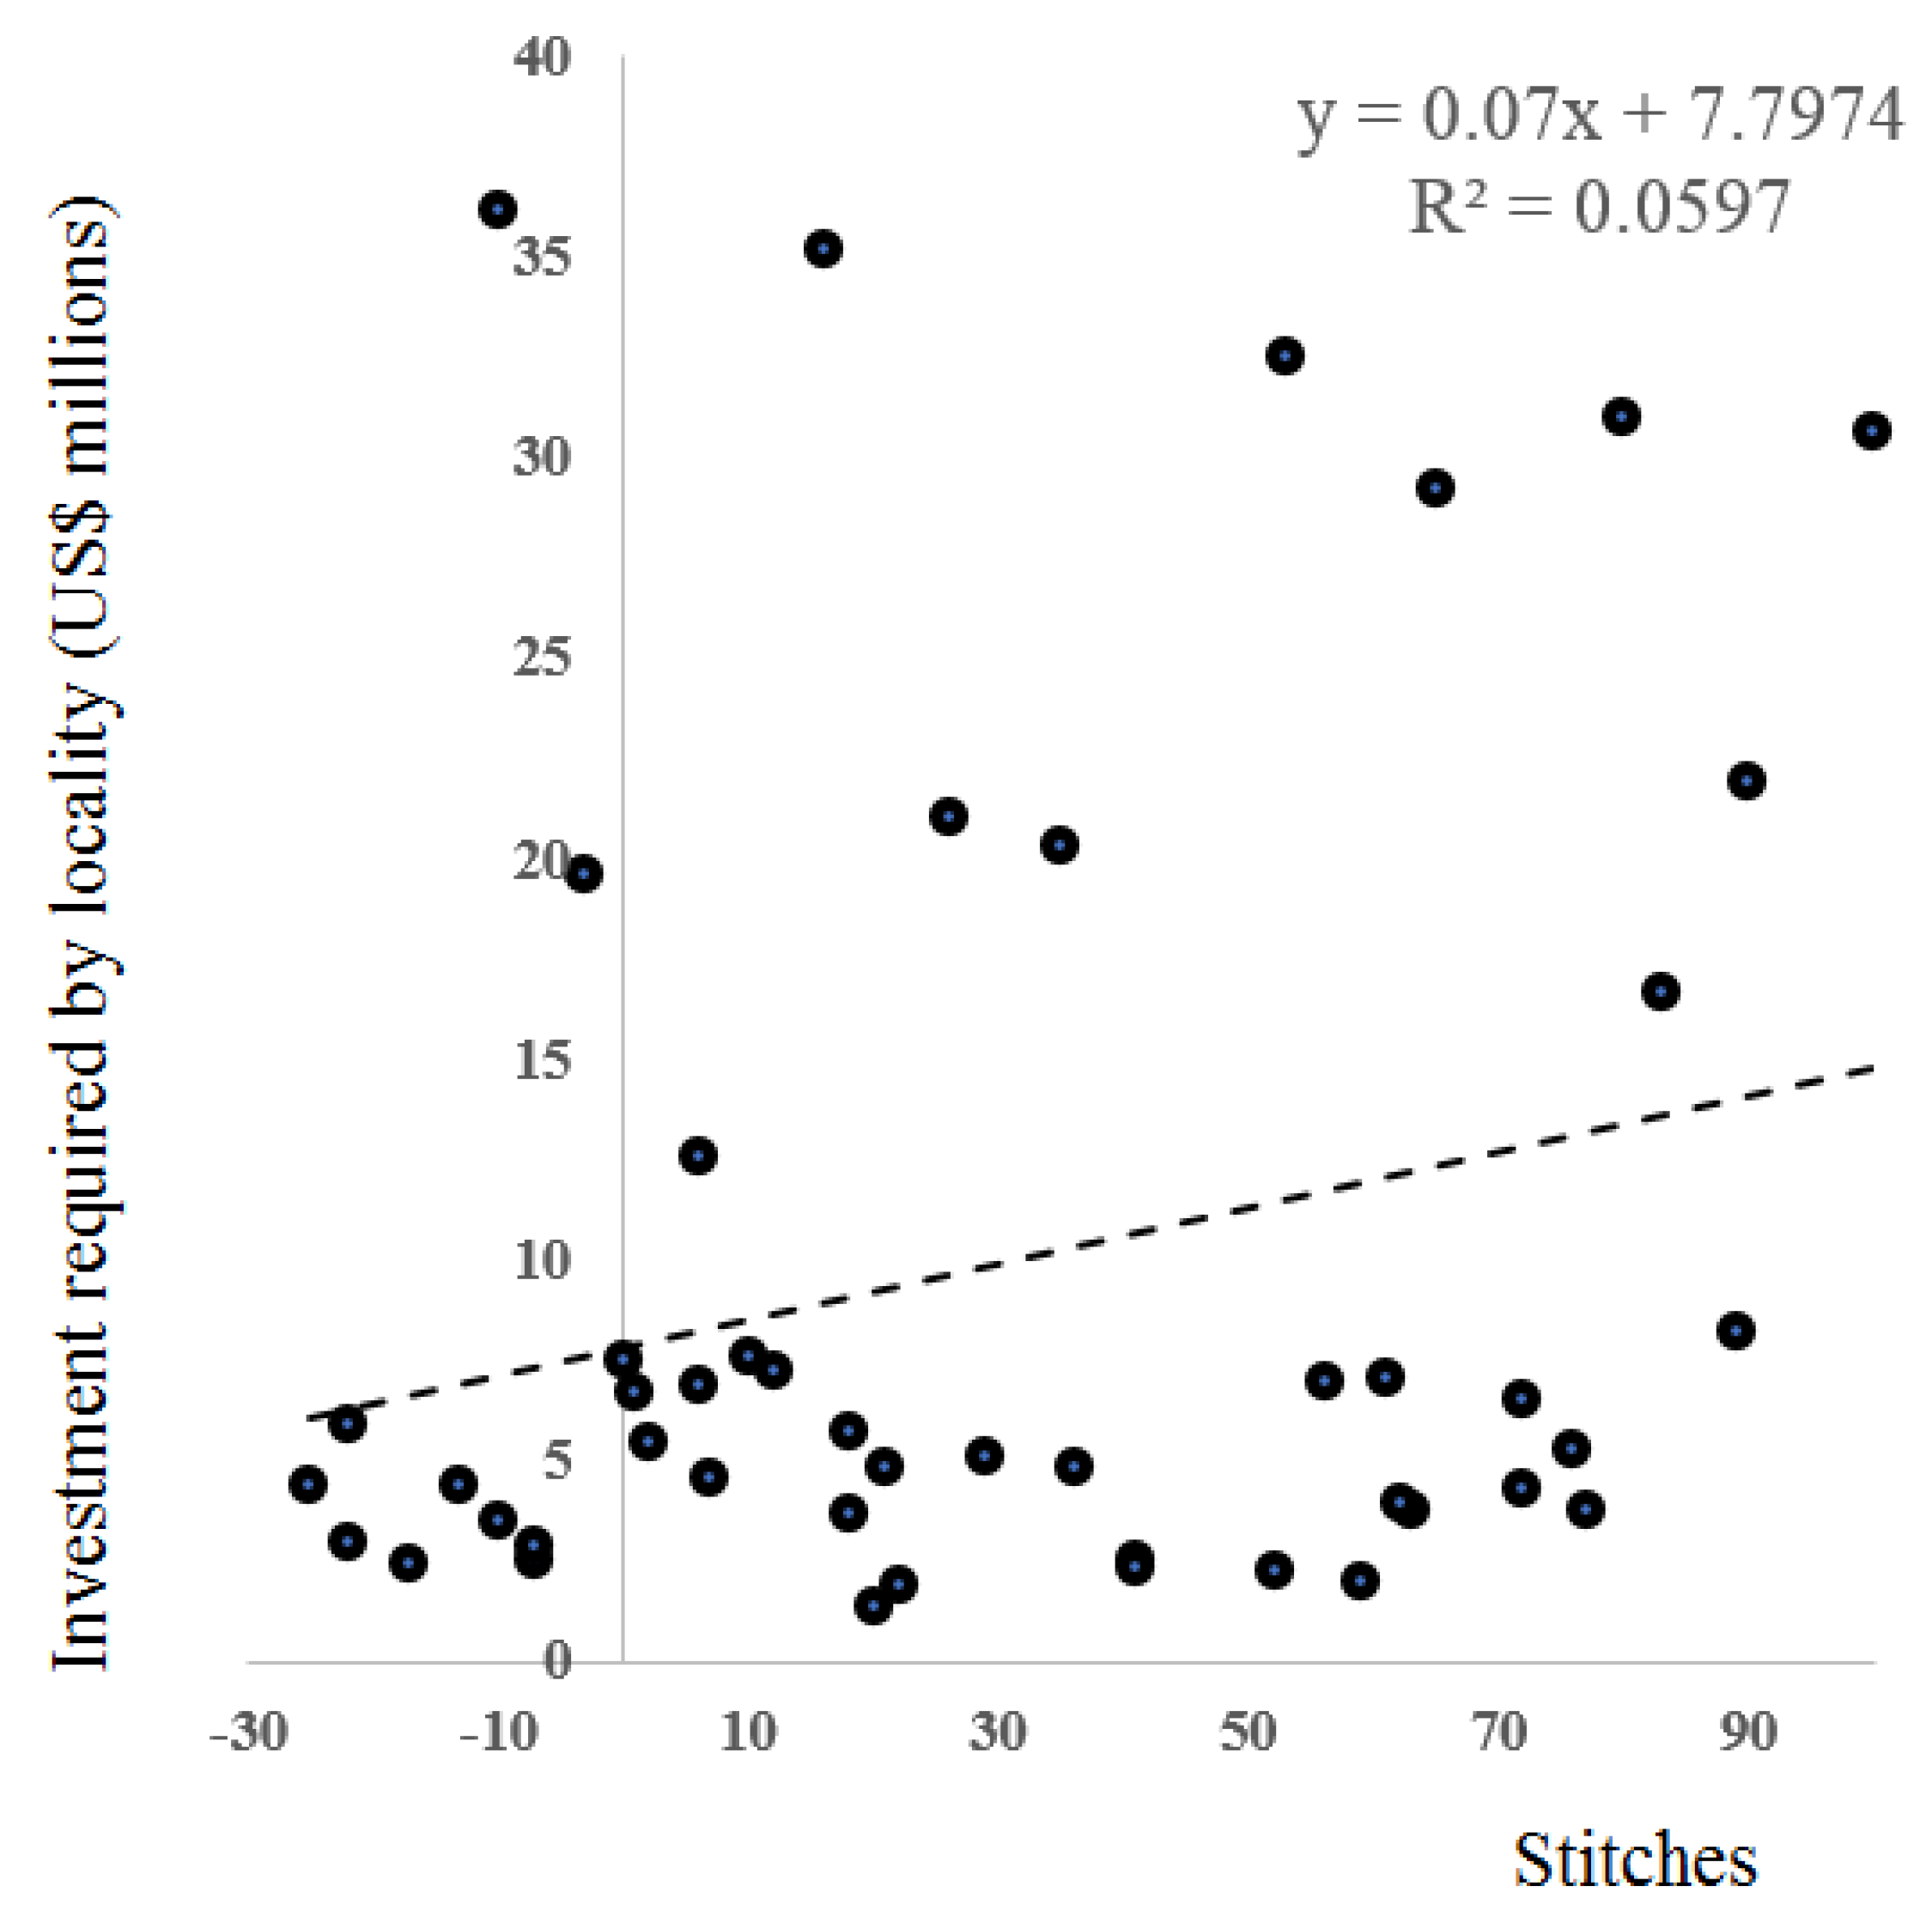
Figure 6 shows the relationship between the airport’s attractiveness and the amount of planned investment.
The data relating to investment as a function of attractiveness presented in Graph 1 indicate that attractiveness is insufficient to explain the variation in investments projected for airports, given the observed dispersion. The trend line (dashed line) reveals a slight slope, indicating a growth of around 0.07 million USD in the level of investment through the growth of one unit of attractiveness.
In addition, it is possible to observe that most of the investment levels in airports were below 10 million USD. In a few airports, investment levels were above 30 million USD, with emphasis on two airports, Fernando de Noronha and Aracati (Table 12), with low levels of attractiveness but high amounts of investment.
Forty-seven locations included under the RADP were evaluated, since six airport sites were granted to the private sector in 2019 from the list of 53 locations included in the program.
Although the general ranking of the attractiveness of cities had a certain predominance of municipalities in the south and southeast regions, in the first half of the ranking, municipalities from all country regions were observed. The data show that even the most populated Brazilian regions still lack regional air transport infrastructure investment.
The overall ranking highlights several locations that already have some type of regular flight infrastructure. However, a locality already having regular flights does not mean that the infrastructure is satisfactory. In many cases, trips are made on small or medium-sized aircraft due to airport infrastructure restrictions. Therefore, airport infrastructure improvement is necessary for the expansion of services, either for the receipt of aircraft appropriate to the existing demand or for improving safety and comfort conditions.
Analysing the data presented in Table 12, it can be verified that the investments needed to meet the 10 best-ranked locations add up to 157.22 million USD. To build or improve the airport infrastructure of the 20 best locations, 225.26 million USD would be required. Lastly, with about 270 million USD, it would be possible to serve half of the cities selected under the RADP.
Several studies cited in the literature review presented a methodology for, in some way, classifying Brazilian municipalities or regions concerning the need for investments in regional aviation.
On the basis of the number of interstate road trips generated by the municipalities, it was concluded that the use of the Moran I index is a good planning tool to define areas where there would be demand for scheduled flights [6]. However, the author suggested that other variables could make the model more accurate in choosing locations with the potential to receive these flights. The authors of [7] estimated the air transport demand in regional markets, proposing an econometric model. Despite not applying the econometric model to all the cities included in the PDAR, the cities that appeared in that study obtained a similar ranking order to the present findings.
Indicators to measure the potential for air transport demand in municipalities through a decision tree were presented by [18]. Of the 15 indicators presented in the study [18], six coincide with the criteria adopted in our study. The article, however, did not apply the developed method to a ranking of locations with a view to the installation of airport sites.
Although the use of support vector machines as a tool for decision making regarding public investments in airports was studied by [19], a ranking was not proposed; however, the cities that, according to the statistical model adopted, would be more likely to develop regular aviation were highlighted. Thus, the results of our study advance the knowledge generated by previous studies, concerning both the methodology used and the scope of the results.

7. Final Considerations

This study aimed to develop a model to measure the attractiveness of cities to receive investments in regional airports through the multicriteria decision aid (MCDA) approach. We conducted a review of previous studies, which pointed to the need for further studies with this objective.
To achieve the objectives, 12 variables were used, chosen from the bibliographic framework consulted and defined through consultation with air transport specialists linked to federal government agencies. The MCDA methodology proved to be entirely adequate for elaborating the ranking of locations according to their attractiveness.
Given the scarcity of public resources, the results obtained can contribute to the decision-making process regarding the prioritisation of investments in the regional airport sector. The findings are limited to the results obtained by applying the multicriteria method with a compensatory approach, where advantages and disadvantages of various criteria are contrasted. If other non-compensatory methods are used, i.e., an outranking approach, where there are no trade-off relationships between the criteria but prevalence or subordination relationships, the results could differ.
This study contributes to the current knowledge in that it proposes a methodology of easy applicability to measure the attractiveness of cities to receive investments in regional airport infrastructure in Brazil. The study also contributes methodologically by using a tool to support the decision-making process, built with the perception of experts in the air sector, to solve a concrete problem of the need to prioritise investments in regional airports.
The results obtained can be used by decision-makers to guide the direction of investment of public resources to improve the coverage of regional air transport. The participation of high-ranking experts in the hierarchy of federal decision-making power makes this study’s practical contribution even more relevant to the government and society.
The results found in technical studies demonstrate that the decision aid methodologies are beneficial for public managers in decision making. This prevents decisions based solely on political criteria, which are subjective. The developed model provides managers with a systematised application tool.
The model’s applicability in other countries may be limited, as it would be necessary to establish similar transport infrastructure conditions to Brazil. For example, in Brazil, there are many bottlenecks related to distribution logistics and the supply of rail transport between locations. The predominant mode of transport to ensure the exchange of goods and people between localities is via the road network. Another factor is the huge geographic size of Brazil, which brings together different regions with large populations and with poor access to traditional modes of transport. Considering the transport infrastructure in other countries, the model can be adapted to cover different and specific criteria. Thus, with adaptations, it is possible to apply the same model while considering the particularities of the countries.
Lastly, it is worth highlighting the opportunity to execute new research on the subject, incorporating variables that may reflect the level of institutional and financial support of the local government for the installation or expansion of airports. Moreover, considering that this study used the compensatory approach for the evaluation of the problem, it would be interesting to apply a multicriteria methodology using a non-compensatory approach, with an outranking method, with the objective of comparing the results obtained in both approaches.

Author Contributions

C.M.S. Original draft. C.M.S. Writing. C.M.S. Data collection. C.M.S., P.G. and S.R.G. Data analysis. P.G., G.L.d.S. and S.R.G. Writing review. P.G. English review. All authors have read and agreed to the published version of the manuscript.

Funding

This research received no external funding.

Institutional Review Board Statement

Not applicable.

Informed Consent Statement

Not applicable.

Data Availability Statement

Not applicable.

Conflicts of Interest

The authors declare no conflict of interest.

References

  1. Ministério dos Transportes, Portos e Aviação Civil. Plano Aeroviário Nacional; Ministério dos Transportes, Portos e Aviação Civil: Brasília, Brazil, 2018.
  2. Leurquin, P.; Avelar, M.M. Os desafios jurídicos e econômicos da aviação regional no Brasil. Rev. Bras. Políticas Públicas 2016, 6, 203–220. [Google Scholar] [CrossRef] [Green Version]
  3. Turolla, F.A.; de Lima, M.F.F.; Ohira, T.H. Políticas públicas para a melhoria da competitividade da aviação regional brasileira. J. Transp. Lit. 2011, 5, 188–231. [Google Scholar]
  4. ABEAR. Panorama 2016–O Setor Aéreo em Dados e Análises. 2016. Available online: https://abear.com.br/wp-content/uploads/2019/03/Panorama_2016.pdf?utm_source=Site%20Panorama (accessed on 3 November 2019).
  5. SAC. Secretaria de Aviação Civil. Governo Vai Investir em 176 Aeroportos da Aviação Regional. Brasília, 24 de Agosto de 2016. 2017. Available online: https://www.gov.br/infraestrutura/pt-br/assuntos/noticias/ultimas-noticias/governo-vai-investir-em-176-aeroportos-da-aviacao-regional711 (accessed on 22 August 2019).
  6. Freire, L.L.A. Flexibilização de Requisitos de Salvamento e Combate a Incêndio em Aeródromos como Mecanismo de Fomento à Aviação é Possível? Master’s Thesis, Faculdade de Tecnologia, Departamento de Engenharia Civil e Ambiental, Universidade de Brasília, Brasília, Brazil, 2016. [Google Scholar]
  7. Sampaio, A.P.A.; Andrade, M.O.; Dourado, A.B.F. Estimativa de Demanda de Transporte Aéreo em Mercados Regionais do Nordeste. In Proceedings of the Anais do XXX Congresso ANPET, Rio de Janeiro, Brazil, 16–18 November 2016. [Google Scholar]
  8. Bianco, G.L. Metodologia Para Auxiliar a Tomada De Decisão Gerencial Na Priorização De Investimentos Públicos Em Rodovias Utilizando-Se da Análise Multicritério. Master’s Thesis, Faculdade de Tecnologia, Departamento de Engenharia Civil e Ambiental, Universidade de Brasília, Brasília, Brazil, 2016. [Google Scholar]
  9. Zografos, K.G.; Salouras, Y.; Madas, M.A. Dealing with the efficient allocation of scarce resources at congested airports. Transp. Res. Part C Emerg. Technol. 2012, 21, 244–256. [Google Scholar] [CrossRef]
  10. Pishdar, M.; Ghasemzadeh, F.; Antuchevičienė, J. A mixed interval type-2 fuzzy best-worst MACBETH approach to choose hub airport in developing countries: Case of Iranian passenger airports. Transport 2019, 34, 639–651. [Google Scholar] [CrossRef] [Green Version]
  11. Alves, C.J.P.; da Silva, E.J.; Müller, C.; Borille, G.M.R.; Guterres, M.X.; Arraut, E.M.; dos Santos, R.J. Towards an objective decision-making framework for regional airport site selection. J. Air Transp. Manag. 2020, 89, 101888. [Google Scholar] [CrossRef]
  12. Sennaroglu, B.; Celebi, G.V. A military airport location selection by AHP integrated PROMETHEE and VIKOR methods. Transp. Res. Part D Transp. Environ. 2018, 59, 160–173. [Google Scholar] [CrossRef]
  13. Menou, A.; Benalloua, A.; Lahdelmab, R.; Salminen, P. Decision support for centralising cargo at a Moroccan airport hub using stochastic multicriteria acceptability analysis. Eur. J. Oper. Res. 2013, 204, 621–629. [Google Scholar] [CrossRef]
  14. Merkisz-Guranowska, A.; Bieńczak, M.; Kiciński, M.; Zmuda-Trzebiatowski, P. Location of airports-selected quantitative methods. LogForum 2016, 12, 283–295. [Google Scholar] [CrossRef]
  15. Kazda, A.; Caves, R. Airport Site Selection and Runway System Orientation, Airport Design and Operation; Emerald Group Publishing Limited: Bingley, UK, 2010; pp. 45–72. [Google Scholar]
  16. Silva, J.A.; Gonçalves, J.M.; Correia, M.; Marreiros, S. Airport planning process. The case of the new Lisbon airport. Finisterra 2015, 99, 63–79. [Google Scholar]
  17. Baltazar, M.E.; Jardim, J.; Alves, P.; Silva, J. Air Transport Performance and Efficiency: MCDA vs. DEA Approaches. Procedia–Soc. Behav. Sci. 2013, 111, 790–799. [Google Scholar] [CrossRef] [Green Version]
  18. Torres, R.R.; Portugal, L.S.; Santos, M.P.S. Aeroportos Regionais: Organização dos indicadores do potencial de geração e atração de demanda em municípios. In Proceedings of the Anais do XXIX Congresso ANPET, Ouro Preto, Brazil, 2015. [Google Scholar]
  19. Paula, R.O. Máquinas de Suporte Vetorial como Instrumento de Priorização de Investimentos Aplicado ao Programa de Investimento em Logística—Aeroportos. Master’s Thesis, Faculdade de Administração, Contabilidade e Economia, Universidade de Brasília, Brasília, Brazil, 2016. [Google Scholar]
  20. Bettini, H. Um retrato da aviação regional no Brasil. J. Transp. Lit. 2007, 1, 46–65. [Google Scholar]
  21. Oliveira Filho, J.A. Infraestrutura Aeroportuária e o Desenvolvimento Regional–o Caso do Estado da Paraíba. Master’s Thesis, Universidade Estadual da Paraíba, João Pessoa, Brazil, 2011. [Google Scholar]
  22. Baker, D.; Merkert, R.; Kamruzzaman, M. Regional aviation and economic growth: Cointegration and causality analysis in Australia. J. Transp. Geogr. 2015, 43, 140–150. [Google Scholar] [CrossRef]
  23. Tveter, E. The effect of airports on regional development: Evidence from the construction of regional airports in Norway. Res. Transp. Econ. 2013, 63, 50–58. [Google Scholar] [CrossRef]
  24. Nakayama, D.S. Condições Competitivas da Aviação Comercial Brasileira: Um Estudo da Aviação Regional. Bachelor’s Thesis, Universidade Federal de Santa Catarina, Florianópolis, Brazil, 2011. [Google Scholar]
  25. Araújo, M.P.; Guilhoto, J.J.M. Infraestrutura de Transporte: Uma Análise Através de Modelos Aplicados de Equilíbrio Geral Inter-Regional. SSRN-Elsevier. 2008. Available online: https://papers.ssrn.com/sol3/Delivery.cfm/SSRN_ID1862212_code339729.pdf?abstractid=1862212&mirid=1 (accessed on 14 November 2019).
  26. Redondi, R.; Malighetti, P.; Paleari, S. European connectivity: The role played by small airports. J. Transp. Geogr. 2013, 29, 86–94. [Google Scholar] [CrossRef]
  27. Quirino, M.G. Incorporação das Relações de Subordinação na Matriz de Ordenação—Roberts em MCDA Quando os Axiomas de Assimetria e Transitividade Negativa São Violados. Ph.D. Thesis, Universidade Federal de Santa Catarina, Florianópolis, Brazil, 2002. [Google Scholar]
  28. Stewart, T.J. Relationships between data envelopment analysis and multicriteria decision analysis. J. Oper. Res. Soc. 1996, 47, 654–665. [Google Scholar] [CrossRef]
  29. Jannuzzi, P.M.; Miranda, W.L.; Silva, D.S.G. Análise multicritério e tomada de decisão em políticas públicas: Aspectos metodológicos, aplicativo operacional e aplicações. Inf. Pública 2009, 11, 69–87. [Google Scholar]
  30. Santana, W.C. Proposta de Modelo de Desenvolvimento de Sistema de Medição de Desempenho Logístico. Master’s Thesis, Departamento de Engenharia Industrial, Pontifícia Universidade Católica do Rio de Janeiro, Rio de Janeiro, Brazil, 2004. [Google Scholar]
  31. Ssamula, B. Exploring multicriteria decision analysis method as a tool to choose regional airport hubs within Africa. Int. J. Sustain. Dev. Plan. 2010, 5, 83. [Google Scholar] [CrossRef] [Green Version]
  32. Postorino, M.N.; Praticò, F.G. An application of the Multi-Criteria Decision-Making analysis to a regional multi-airport system. Res. Transp. Bus. Manag. 2012, 4, 44–52. [Google Scholar] [CrossRef]
  33. Sivrikaya, O.; Tunç, E. Demand Forecasting for Domestic Air Transportation in Turkey. Open Transp. J. 2013, 7, 20–26. [Google Scholar] [CrossRef]
  34. Rochel, J.J.B. Factores Determinantes de la Demanda de Transporte Aéreo y Modelos de Previsión. Bol. Econ. Rev. ICE–Inf. Comer. Esp. 2000, 2652, 41–48. [Google Scholar]
  35. Freitas, A.P. Análise Econométrica da Demanda de Passageiros em Rotas Aéreas Regionais Comerciais no Brasil. Bachelor’s Thesis, Universidade Federal do Pampa, Bagé, Brazil, 2016. [Google Scholar]
  36. Prazeres, D.L.; Ferreira, J.E.T. Aeroportos Regionais: Critérios Mínimos para se Identificar Infraestruturas Prioritárias a Receber Investimentos de Fundos Federais e Estaduais. XI SITRAER, Brazil. 2012. Available online: https://www.academia.edu/4496786/AEROPORTOS_REGIONAIS_Crit%C3%A9rios_m%C3%ADnimos_para_se_identificar_infraestruturas_priorit%C3%A1rias_a_receber_investimentos_de_fundos_federais_e_estaduais_Dorieldo_Luiz_dos_Prazeres (accessed on 11 November 2019).
  37. Urban Systems. Aeroportos Regionais: Potencial de Desenvolvimento Econômico. 2014. Available online: https://conteudo.urbansystems.com.br/rar-usb_14 (accessed on 1 September 2019).
  38. Beinat, E. Multiattribute value functions for environmental management. In Tinbergen Institute Research Series; Tinbergen Institute: Amsterdam, The Netherlands, 1995. [Google Scholar]
  39. Bana e Costa, C.A.; Silva, F.N. Concepção de uma “Boa” Alternativa de Ligação Ferroviária ao Porto de Lisboa: Uma aplicação da metodologia MCDA e à negociação. Investig. Oper. 1994, 14, 115–131. [Google Scholar]
  40. Ensslin, L.; Montibeller, G.N.; Noronha, S.M. Apoio à Decisão: Metodologias para Estruturação de Problemas e Avaliação Multicritério de Alternativas; Editora Insular: Florianópolis, Brazil, 2001. [Google Scholar]
  41. Bana e Costa, C.A.; Corte, J.M.; Vansnick, J.C. M-MACBETH–Measuring Attractiveness by a Categorical Based Evaluation Technique. In Guia do Utilizador; 2005; Available online: http://www.m-macbeth.com/ (accessed on 19 April 2020).
  42. Roberts, F. Measurement Theory. In Encyclopedia of Mathematics and Its Applications; Addison-Wesley Publishing Company: New York, NY, USA, 1979. [Google Scholar]
  43. Silva, C.M. Atratividade de Cidades para Receber Investimentos em Infraestrutura Aeroportuária Regional. Master’s Thesis, Departamento de Engenharia Civil e Ambiental, Universidade de Brasília, Brasília, Brazil, 2020. [Google Scholar]
Figure 1. Methodological steps.
Mathematics 10 01734 g001
Figure 2. Tree of points of view (Source: [43]).
Mathematics 10 01734 g002
Figure 3. Value functions of FPV 1—population of the immediate region.
Mathematics 10 01734 g003
Figure 4. Anchoring functions of FPV 1—population of the immediate region.
Mathematics 10 01734 g004
Figure 5. FPV 2 sensitivity analysis.
Mathematics 10 01734 g005
Figure 6. Plot of investment against value. Source: research data.
Mathematics 10 01734 g006
Table 1. Criteria for regional airport investments and their respective studies.
ReferencePopulationGDP per CapitaDistanceVehicle Fleet and Number of CompaniesTicket Price and Travel TimeInvestmentQuality and Supply of ServicesJobsCompeting Services of TransportGeographic RegionAccessibility ConditionsEducationTourism and Equipment
[33]xxx xx x
[34] xxx
[7] x xx xx
[35]x x x x x
[36]x x
[18]xx x xxx x
[19]x x x xx x x
[37]xx x x x
[1]xx xx xxx
The criteria marked with “x” are included in the study referenced in column 1.
Table 2. Descriptors of FPV 1—population of the immediate region.
Impact LevelsReference LevelsDescription (Inhabitants)Percentage of Cities
N5
  • From 1,000,000
5%
N4Good
  • 600,000|1,000,000
11%
N3
  • 400,000|600,000
23%
N2Neutral
  • 200,000|400,000
32%
N1
  • Below 200,000
29%
Table 3. Descriptors of FPV 2—economic aspects.
Impact LevelsReference LevelsDescription (Value)Percentage of Cities
Descriptors of EPV 2.1—GDP (USD = 5.49 BRL as at 22 April 2021 was used in all tables)
N5
  • from US$3.64 billion
13%
N4Good
  • 1.82 billion USD|3.64 billion USD
26%
N3
  • 0.73 billion USD|1.82 billion USD
21%
N2Neutral
  • 0.36 billion USD|0.73 billion USD
23%
N1
  • below 0.36 billion USD
17%
Descriptors of EPV 2.2—Per capita income
N5
  • From 2186 USD
15%
N4Good
  • 1749 USD|2186 USD
15%
N3
  • 1311 USD|1749 USD
23%
N2Neutral
  • 874 USD|1311 USD
25%
N1
  • below 874 USD
22%
Descriptors of EPV 2.3—Number of hotel beds
N5
  • from 5000
14%
N4Good
  • 3000|5000
21%
N3
  • 2000|3000
21%
N2Neutral
  • 1000|2000
21%
N1
  • below 1000
23%
Descriptors of EPV 2.4—Embratur classification
N5
  • A
11%
N4Good
  • B
64%
N3
  • C
7%
N2Neutral
  • D
1%
N1
  • Unrated
17%
Table 4. Descriptors of FPV 3—social aspects.
Impact LevelsReference LevelsDescription (Index)Percentage of Cities
Descriptors of EPV 3.1—MHDI
N5
  • from 0.80
5%
N4Good
  • 0.75|0.80
27%
N3
  • 0.70|0.75
27%
N2
  • 0.60|0.70
24%
N1Neutral
  • below 0.60
17%
Descriptors of EPV 3.2—Health
N5Good
  • from 1.80
11%
N4
  • 1.50|1.80
21%
N3Neutral
  • 1.30|1.50
20%
N2
  • 1.00|1.30
21%
N1
  • below 1.00
27%
Descriptors of EPV 3.3—REGIC
N5
  • Capital regional B
13%
N4Good
  • Capital regional C
23%
N3
  • Regional Centre A
17%
N2Neutral
  • Regional Centre B
19%
N1
  • Unrated
28%
Table 5. Descriptors of FPV 4—transport infrastructure.
Impact LevelsReference LevelsDescription (Travel time)Percentage of Cities
Descriptors of EPV 4.1—Distance from the airport
N5
  • from 10 h
15%
N4Good
  • 6 h|10 h
23%
N3
  • 4 h|6 h
22%
N2Neutral
  • 2 h 30 m|4 h
23%
N1
  • below 2 h 30 m
17%
Descriptors of EPV 4.2—Number of scheduled flights
N5
  • from R $200,000
17%
N4Good
  • 40,000|200,000
15%
N3
  • 10,000|40,000
21%
N2Neutral
  • 400|10,000
11%
N1
  • 0|400
36%
Descriptor of EPV 4.3—Number of non-scheduled flights
N5Good
  • from 10,000
13%
N4
  • 4000|10,000
15%
N3Neutral
  • 500|4000
11%
N2
  • 19|500
21%
N1
  • 0|19
40%
Descriptor of EPV 4.4—Investment required (USD)
N5
  • Below 2.73 million
17%
N4Good
  • 2.73 million|4.55 million
21%
N3
  • 4.55 million|7.29 million
30%
N2Neutral
  • 7.29 million|18.21 million
11%
N1
  • Over 18.21 million
21%
Table 6. Roberts matrix—ordering of FPVs.
FPV 1FPV 2FPV 3FPV 4SumOrder
FPV1-0112Second
FPV21-113First
FPV300-00Fourth
FPV4001-1Third
Table 7. Points obtained by the criteria (FPVs).
CriterionNote
FPV 182
FPV 292
FPV 337
FPV 463
Sum274
Table 8. Relative participation of each PVF and PVE.
Fundamental Point of ViewRelative ParticipationReplacement Rate (Weights)
FPV substitution rates (criteria)
FPV 1—Population 82/274 × 100 = 3030%
FPV 2—Economic aspects92/274 × 100 = 3434%
FPV 3—Social aspects37/274 × 100 = 1414%
FPV 4—Transport infrastructure63/274 × 100 = 2222%
Sum = 100100%
FPV 2 EPV substitution rates (sub-criteria)
EPV 2.1—GDP85/257 × 100 = 3333%
EPV 2.2—Per capita income 76/257 × 100 = 3030%
EPV 2.3—Number of hotel beds 39/257 × 100 = 1515%
EPV 2.4—Consolidated tourism 57/257 × 100 = 2222%
Sum = 100100%
FPV 3 EPV substitution rates (sub-criteria)
EPV 3.1—IDHM61/199 × 100 = 3131%
EPV 3.2—Health50/199 × 100 = 2525%
EPV 3.3—REGIC88/199 × 100 = 4444%
Sum = 100100%
FPV 4 EPV substitution rates (sub-criteria)
EPV 4.1—Distance to nearest airport82/247 × 100 = 3333%
EPV 4.2—Number of scheduled flights47/247 × 100 = 1919%
EPV 4.3—Number of non-scheduled flights37/247 × 100 = 1515%
EPV 4.4—Investment required81/247 × 100 = 3333%
Sum = 100100%
Table 9. Methodology for calculating locality scoring.
Scores (PV Note × Weight = PV Score)
ViewsMaringáMaraã
FPV 1100 × 0.30 = 30.0−50 × 0.30 = −15.0
FPV 2119 × 0.34 = 40.6−51 × 0.34 = −17.3
EPV 2.1150 × 11.2 = 16.8−50 × 11.2 = −5.6
EPV 2.2125 × 10.2 = 12.8−25 × 10.2 = −2.6
EPV 2.3133 × 5.1 = 6.8−49 × 5.1 = −2.5
EPV 2.4 56 × 7.5 = 4.2−88 × 7.5 = −6.6
FPV 3120 × 0.13 = 15.6−47 × 0.13 = −6.1
EPV 3.1133 × 4.0 = 5.30 × 4.0 = 0
EPV 3.250 × 3.3 = 1.7100 × 3.3 = −3.3
EPV 3.3150 × 5.7 = 8.6−50 × 5.7 = −2.8
FPV 460 × 0.23 = 13.857 × 0.23 = 13.1
EPV 4.1100 × 7.6 = 7.6140 × 7.6 = 10.6
EPV 4.2150 × 4.4 = 6.6−50 × 4.4 = −2.2
EPV 4.3100 × 3.5 = 3.5−83 × 3.5 = −2.9
EPV 4.4−50 × 7.6 = −3.8100 × 7.6 = 7.6
Final Score=100.00=−25.3
Table 10. General ranking.
OrderLocalityUFValueOrderLocalityUFValue
1stMaringáPR10023rdLinharesES21
2ndGuarujá/SantosSP9024thSanto ÂngeloRS20
3rdSorocabaSP8925thSerra TalhadaPE18
4thCaxias do SulRS8325thBrevesPA18
5thChapecóSC8026thFernando de NoronhaPE16
6thVitória da ConquistaBA7727thItaitubaPA12
7thPonta GrossaPR7628thJericoacoaraCE10
8thDivinópolisMG7229thVilhenaRO7
8thCascavelPR7230thCaldas NovasGO6
9thImperatrizMA6530thBarra do GarçasMT6
10thPasso FundoRS6331stPatosPB2
11thBarreirasBA6232ndParagominasPA1
12thDouradosMS6133rdPicosPI0
13thPatos de MinasMG5934thGurupiTO−3
14thGovernador ValadaresMG5635thMarechal ThaumaturgoAC−7
15thMarabáPA5335thCoariAM−7
16thMossoróRN5236thMaragogiAL−10
17thCorreia PintoSC4136thAracatiCE−10
17thAraguaínaTO4137thBom JesusPI−13
18thTeixeira de FreitasBA3638thBoca do AcreAM−17
19thParauapebas-CarajásPA3539thLábreaAM−22
20thAngra dos ReisRJ2939thBarreirinhasMA−22
21stCacoalRO2640thMaraãAM−25
22ndBalsasMA22
Table 11. Number of cities by region according to position in the ranking.
Classification North Northeast Southeast SouthCentral–West
1st to 10th 02360
11th to 20th33311
21st to 30th44112
31st to 40th67000
Total1316783
Table 12. Investment required by locality (million USD).
OrderLocalityUFInvestment RequiredOrderLocalityUFInvestment Required
1stMaringáPR30.6223rdLinharesES4.81
2ndGuarujá/SantosSP21.8824thSanto ÂngeloRS1.38
3rdSorocabaSP8.1825thSerra TalhadaPE3.66
4thCaxias do SulRS16.6525thBrevesPA5.74
5thChapecóSC30.9726thFer. de NoronhaPE35.14
6thVit. da ConquistaBA3.7327thItaitubaPA7.21
7thPonta GrossaPR5.2528thJericoacoaraCE7.60
8thDivinópolisMG6.5029thVilhenaRO4.59
8thCascavelPR4.3230thCaldas NovasGO6.90
9thImperatrizMA29.1630thBarra do GarçasMT12.53
10thPasso FundoRS3.7931stPatosPB5.41
11thBarreirasBA3.9232ndParagominasPA6.70
12thDouradosMS7.0133rdPicosPI7.49
13thPatos de MinasMG1.9934thGurupiTO19.62
14thGov. ValadaresMG6.9635thMar. ThaumaturgoAC2.51
15thMarabáPA32.4635thCoariAM2.90
16thMossoróRN2.2636thMaragogiAL3.44
17thCorreia PintoSC2.5136thAracatiCE36.17
17thAraguaínaTO2.3337thBom JesusPI4.37
18thTeixeira de FreitasBA4.8338thBoca do AcreAM2.42
19thParauapebas-CarajásPA20.2939thLábreaAM5.88
20thAngra dos ReisRJ5.0539thBarreirinhasMA2.93
21stCacoalRO20.9840thMaraãAM4.35
22ndBalsasMA1.89
Publisher’s Note: MDPI stays neutral with regard to jurisdictional claims in published maps and institutional affiliations.

