Article

Estimating the Time Reproduction Number in Kupang City Indonesia, 2016–2020, and Assessing the Effects of Vaccination and Different Wolbachia Strains on Dengue Transmission Dynamics

by
Meksianis Z. Ndii
1,*,
Lazarus Kalvein Beay
2,3,
Nursanti Anggriani
4,
Karolina N. Nukul
1 and
Bertha S. Djahi
5
1
Department of Mathematics, Faculty of Sciences and Engineering, University of Nusa Cendana, Kupang 85001, Nusa Tenggara Timur, Indonesia
2
Department of Education and Culture, Provincial Government of Moluccas, Ambon 97125, North Maluku, Indonesia
3
Postdoctoral Program, Department of Mathematics, Universitas Padjadjaran, Jln. Raya Bandung-Sumedang Km. 21 Jatinangor, Kab. Sumedang 45363, Jawa Barat, Indonesia
4
Department of Mathematics, Universitas Padjadjaran, Jln. Raya Bandung-Sumedang Km. 21 Jatinangor, Kab. Sumedang 45363, Jawa Barat, Indonesia
5
Department of Computer Sciences, Faculty of Science and Engineering, University of Nusa Cendana, Kupang 85001, Nusa Tenggara Timur, Indonesia
*
Author to whom correspondence should be addressed.
Submission received: 15 May 2022 / Revised: 9 June 2022 / Accepted: 14 June 2022 / Published: 15 June 2022
(This article belongs to the Special Issue Epidemic Models: Track and Control)

Abstract

:
The use of a vaccine and Wolbachia bacterium have been proposed as new strategies against dengue. However, the performance of Wolbachia in reducing dengue incidence may depend on the Wolbachia strains. Therefore, in this paper, the performance of two Wolbachia strains which are WMel and WAu, in combination with the vaccine, has been assessed by using an age-dependent mathematical model. An effective reproduction number has been calculated using the Extended Kalman Filter (EKF) algorithm. The results revealed that the time reproduction number varies overtime with the highest one being around 2.75. Moreover, it has also found that use of the vaccine and Wolbachia possibly leads to dengue elimination. Furthermore, vaccination on one group only reduces dengue incidence in that group but dengue infection in the other group is still high. Furthermore, the performance of the WAu strain is better than the WMel strain in reducing dengue incidence. However, both strains can still be used for dengue elimination strategies depending on the level of loss of Wolbachia infections in both strains.
MSC:
92B05; 34H05

1. Introduction

The risk of being infected by dengue is higher in tropical and sub-tropical areas where dengue is endemic. It has been estimated that around 105 million infections happen annually with 51 million febrile disease cases [1]. Dengue is caused by four distinct serotypes where being infected by one of the serotypes provides longlife immunity to that serotype but gives a higher chance to get more severe forms of dengue in secondary infection. As there are no effective strategies against all dengue serotypes, the risk for obtaining the severe dengue is possible [2,3,4]. Furthermore, the importation of dengue makes it possible for dengue to spread worldwide easily [5].
Although a number of strategies have been implemented, they were found to be less effective. The current proposed strategies are the use of a vaccine and Wolbachia [6]. The development of a dengue vaccine is underway and its efficacy ranges between 64% and 80% depending on serotypes [7,8,9]. A higher reduction in dengue incidence can be obtained when vaccinating individuals aged 9–45 years [2,4]. Moreover, the risk for secondary infections is higher when vaccinating sero-negative individuals [2,4]. Furthermore, the use of Wolbachia bacterium is a promising strategy [10]. Research found that Wolbachia can reduce the dengue incidence by up to 80% particularly in areas with low to moderate transmission levels [11,12]. A Wolbachia is a bacterium that can reduce the level of virus in the mosquito’s body [13], which reduces the possibility for transmitting the virus when they bite susceptible humans. Furthermore, Wolbachia reduces blood-feeding success in Aedes aegypti [14] and hence minimizes the probability of a successful bite. On the other hand, the use of a dengue vaccine can reduce the dengue transmission in higher transmission regions. The combination of both a vaccine and Wolbachia can significantly reduce the number of dengue infections.
To understand the performance of Wolbachia and the vaccine in reducing dengue infections, various mathematical models have been formulated and studied [15,16,17,18]. A review on dengue modeling for the last 10 years can be found in [19]. Research mostly studied the effects of Wolbachia and the vaccine on dengue transmission dynamics independently and little research has been conducted to assess the effects of the implementation of both strategies simultaneously. Salgado et al. [16] used the dynamic optimization approach to understand the effects of Wolbachia on dengue transmission dynamics and found that the release of Wolbachia can significantly reduce the number of dengue incidence. Ogunlade et al. [18] formulated a mathematical model to study the performance of WAu on dengue transmission dynamics. The results showed that the use of WAu is good at reducing dengue incidence. Shim [20] studied the effects of vaccination on dengue transmission dynamics and found that optimal vaccination rates potentially increase with a higher proportion of seropositive individuals which leads to a higher impact of vaccination. Ndii et al. [4] also studied the effects of vaccination and found vaccinating seropositive individuals provides better reduction in dengue transmission. Not many mathematical models have been formulated to study the effects of both strategies simultaneously. Dorrigati et al. [6] suggested that the use of vaccination and Wolbachia potentially results in a higher reduction in dengue incidence. Several mathematical models have been formulated and studied the use of both strategies simultaneously. Ndii et al. [15] studied the effects of using vaccination and Wolbachia simultaneously and found that the use of the vaccine can potentially reduce the number of dengue infections if the vaccine efficacy is high, otherwise the use of Wolbachia is sufficient [15]. Junsawang [21] performed numerical simulations of a combination of the use of Wolbachia and the vaccine, where the focus was on numerical properties of the model.
The findings have suggested that different Wolbachia strains provide distinct biological characteristics, which potentially leads to their performance in reducing dengue transmission. Several Wolbachia strains that have been used in the field trials are WAu and WMel. These strains give different biological effects on mosquitoes. The characteristics of these two Wolbachia strains are the following [22,23,24,25]. First, WAu has high viral blockage and WMel has only medium. Second, maternal transmission is high in both strains. Third, loss of Wolbachia infections is low in WAu strains and high in WMel. Furthermore, the fitness cost is medium in both strains. WAu has no cytoplasmic incompatibility effects while WMel has cytoplasmic incompatibility. Different biological effects of these strains would provide different performance in reducing dengue incidence. Hence, investigating the effects of different Wolbachia strains in combination with vaccination is of great importance. To the best of our knowledge, no mathematical model has been formulated to study the effects of different Wolbachia strains in combination with vaccination, which is the focus of this work.
In this paper, we formulate a deterministic mathematical model to assess the effects of vaccination and different Wolbachia strains on dengue transmission dynamics. We estimate the effective reproduction number using the Extended Kalman Filter (EKF) algorithm against data of dengue incidence from Kupang-city Indonesia. We employ an optimal control theory to assess the optimal control strategies to result in a higher reduction in dengue incidence, the influential parameters are also determined to gain insights on factors governing the dengue transmission dynamics.

2. Formulation of Mathematical Model

2.1. Modeling Framework for Mosquito Population

For the mosquito population dynamics, we modify the model by Ndii et al. [11] to include the possibility of loss of Wolbachia infections and no effects of cytoplasmic incompatibility. The mosquito population consists of non-Wolbachia and Wolbachia-carrying mosquitoes. The eggs, larvae and pupae are grouped into one compartment called aquatic. The population of adult mosquitoes is divided into male and female mosquitoes. A n , M n , F n , A w , M w , F w are the aquatic, male and female mosquitoes where the subscripts n and w are to differentiate between non-Wolbachia and Wolbachia-carrying mosquitoes. The model is then governed by the following system of differential equations
d A n d t = ρ n F n ( M n + ϕ M w ) P 1 A n + A w K ( γ n + μ n a ) A n , d M n d t = ϵ n γ n A n + ϵ n w ( 1 α ) γ w A w + γ w M w μ n M n , d F n d t = ( 1 ϵ n ) γ n A n + ( 1 ϵ n w ) ( 1 α ) τ w A w + γ w F w μ w M w , d A w d t = ρ w F w ( M n + M w ) P 1 A n + A w K ( τ w + μ w a ) A w , d M w d t = ϵ w α τ w A w γ w M w μ w M w , d F w d t = ( 1 ϵ w ) α τ w A w γ w F w μ w F w .
where the P = M n + F n + M w + F w is the total mosquito population, γ w is the rate of loss of Wolbachia infections and ϕ is to denote the effects of Cytoplasmic Incompatibility (CI) where ϕ = 1 means there is an effect of CI and ϕ = 0 means no CI effect. The ratio between male and female mosquitoes is approximately 1:1 and hence we set ϵ n = ϵ w = ϵ n w = 1 / 2 . We then obtain the following Equation:
d A n d t = ρ n F n ( F n + ϕ F w ) 2 ( F n + F w ) 1 ( A n + A w ) K ( γ n + μ n a ) A n , d F n d t = γ n 2 A n + ( 1 α ) τ w 2 A w + γ w F w μ n F n , d A w d t = ρ w F w 2 1 ( A n + A w ) K ( τ w + μ w a ) A w , d F w d t = α τ w 2 A w γ w F w μ w F w .
In the absence of loss of Wolbachia infections and the existence of cytoplasmic incompatibility, the dynamics of mosquito population can be found in Ndii et al. [26].

2.2. Modeling Framework for Host-Vector Involving Wolbachia and Vaccination

In this section, we formulate a deterministic host-vector mathematical model involving Wolbachia and the vaccine, where the vector population is governed by Equation (2). We divided human population into disjoint compartments. The human population comprises susceptible child and adult individuals ( S c and S a , respectively), infected child and adult individuals ( I c and I a , respectively), and recovered child and adult individuals ( R c and R a , respectively). The mosquito population is divided into aquatic mosquitoes ( A n and A w ), susceptible ( S n and S w ) and infected ( I n and I w ) groups, where subscript n and w is to represent non-Wolbachia and Wolbachia-carrying mosquitoes.
Let α h be the progression rate from child to adult and the value of α = 1 / T , where T is the age at which individuals in the child class move to the adult class. The parameters ϵ 1 and ϵ 2 are vaccine efficacy on child and adult individuals. The parameters v 1 and v 2 are the vaccination rate, the γ is the recovery rate. Λ is the recruitment rates of humans. The susceptible individuals are infected after being bitten by infectious non-Wolbachia and Wolbachia carrying mosquitoes at a rate of β h n and β h w , respectively. Furthermore, the vaccinated individuals move to the recovered class. After a certain period, the recovered individuals move to the susceptible class. The model is given by the following system of differential equation.
d S c d t = Λ α h S c β h n I n N h S c β h w I w N h S c μ h S c ϵ 1 v 1 S c + q 1 R c , d S a d t = α h S c β h n I n N h S a β h w I w N h S a ϵ 2 v 2 S a μ h S a + q 2 R a , d I c d t = β h n I n N h S c + β h w I w N h S c ( γ + μ h ) I c , d I a d t = β h n I n N h S a + β h w I w N h S a ( γ + μ h ) I a , d R c d t = γ I c + ϵ 1 v 1 S c ( μ h + q 1 ) R c , d R a d t = γ I a + ϵ 2 v 2 S a ( μ h + q 2 ) R a , d A n d t = ρ n ( F n 2 + ϕ F n F w ) 2 ( F n + F w ) 1 ( A n + A w ) K ( τ n + μ n a ) A n , d S n d t = τ n A n 2 + ( 1 α ) τ w A w 2 + γ w S w β n ( I c + I a ) N h S n μ n S n , d I n d t = β n ( I c + I a ) N h S n μ n I n , d A w d t = ρ w F w 2 1 ( A n + A w ) K ( τ w + μ w a ) A w , d S w d t = τ w 2 α A w γ w S w β w ( I c + I a ) N h S w μ w S w , d I w d t = β w ( I c + I a ) N h S w μ w I w .
with non-negative initial conditions S c ( 0 ) 0 , S a ( 0 ) 0 , I c ( 0 ) 0 , I a ( 0 ) 0 , R c ( 0 ) 0 , R a ( 0 ) 0 , A n 0 , S n ( 0 ) 0 , I n ( 0 ) 0 , A w 0 , S w ( 0 ) 0 , I w ( 0 ) 0 and N h = S c + S a + I c + I a + R c + R a . We can verify that the solutions of the Model (3) with non-negative initial conditions remain non-negative. F n = S n + I n and F w = S w + I w .

3. Basic Reproduction Number

The basic reproduction number is generated using the concept of the next generation matrix [27]. We construct the transmission and transition matrices. The transmission matrix, T and the transition matrix, Σ are
T = 0 0 β h n S c * N h β h w S c * N h 0 0 β h n S a * N h β h w S a * N h β n S n * N h β n S n * N h 0 0 β w S w * N h β w S w * N h 0 0 Σ = ( γ + μ h ) 0 0 0 0 ( γ + μ h ) 0 0 0 0 μ n 0 0 0 0 μ w ,
where S c * and S a * are the number of child and adult susceptible individuals at disease free equilibrium.
We then take the inverse of the transition matrix Σ 1 and obtain
Σ 1 = 1 ( γ + μ h ) 0 0 0 0 1 ( γ + μ h ) 0 0 0 1 μ n 0 0 0 0 1 μ w .
The next generation matrix is obtained by T Σ 1 and hence
T Σ 1 = 0 0 β h n S c * μ h N h β h w S c * μ w N h 0 0 β h n S a * μ h N h β h w S a * μ w N h β n S n * N h ( γ + μ h ) β n S n * N h ( γ + μ h ) 0 0 β w S w * N h ( γ + μ h ) β w S w * N h ( γ + μ h ) 0 0 .
The reproduction number is the spectral radius of the next generation matrix. We obtain the reproduction number, R 0 , as
R 0 v w = ( S c * + S a * ) ( S n * β h n β n μ w + S w * β h w β w μ n ) μ n μ w ( γ + μ h ) N h 2 ,
It is clear that in the absence of vaccination, S c * + S a * = N h and therefore the basic reproduction number in the absence of vaccination is
R 0 w = ( S n * β h n β n μ w + S w * β h w β w μ n ) μ n μ w ( γ + μ h ) N h .
In the presence of vaccination, the ( S c * + S a * ) < N h , R 0 v w < R 0 w .

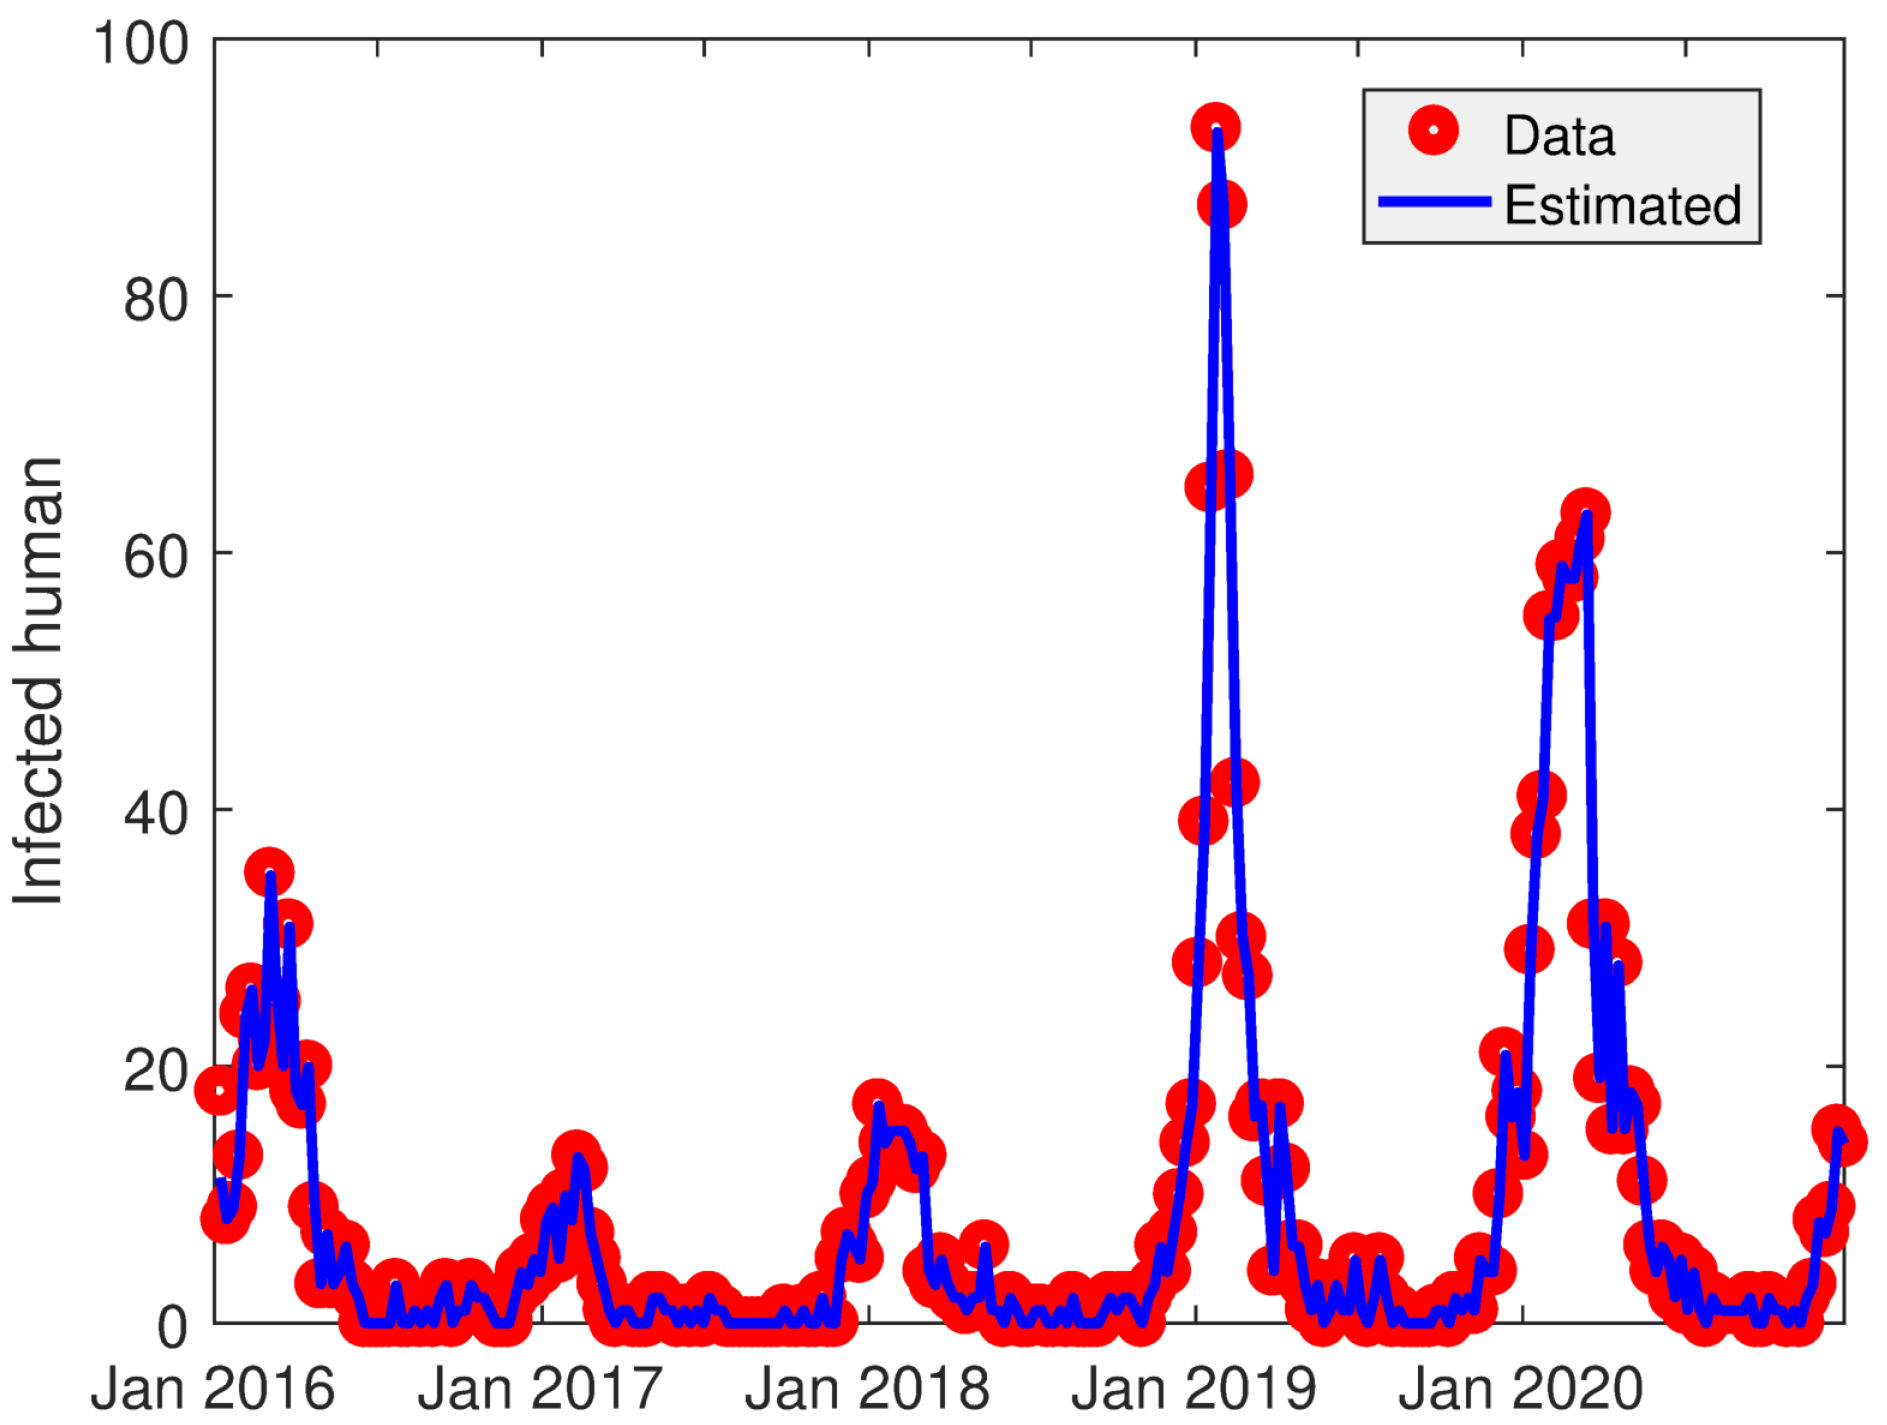
4. Parameter Estimation

4.1. Data

In this study, weekly dengue data from Kupang city since January 2016 to December 2020 has been used to estimate the reproduction number and the transmission rate. The data is given in Figure 1. This is secondary data that has been obtained from the Health Office of Kupang City, Indonesia. The Health Office has collected the data from all Public Health Centers in Kupang city. It can be seen that the highest incidence occurred in 2019 and dengue epidemic has happened annually. Furthermore, the number of infected mosquitoes is set to be three times the number of infected humans.

4.2. Mathematical Model for Parameter Estimation

For this purpose, as the dengue data is for situation in the absence of Wolbachia and vaccination, we estimate using the model in the absence of Wolbachia and vaccination. Hence the Model (3) has been reduced to
d S h d t = Λ β h n I n N h S h μ h S h , d I h d t = β h n I n N h S h ( γ + μ h ) I h , d R h d t = γ I h μ h R h , d A n d t = ρ n F n 2 1 A n K ( τ n + μ n a ) A n , d S n d t = τ n A n 2 β n I h N h S n μ n S n , d I n d t = β n I h N h S n μ n I n .
Using the Next Generation Approach, we had the basic reproduction number of Model (8) is
R 0 = β h n β n S n * N h μ n ( γ + μ h ) .
Model (8) is discretized using the forward Euler method and, together with Extended Kalman Filter, is used to estimate the transmission rate and the time-varying effective reproduction number for dengue in Kupang city, Indonesia.

4.3. Discrete Time Stochastic Augmented Model

A discrete time stochastic augmented model is constructed. We set the transmission rate β h n = β n and denoted by β . We discretize Model (8) using forward Euler and augmenting the transmission rate β as a state variable and hence we obtained the following discrete-time stochastic augmented model:
S h ( k + 1 ) = S h ( k ) + Λ β ( k ) I n ( k ) N h S h ( k ) Δ t μ h S h ( k ) Δ t + ω 1 ( k ) , I h ( k + 1 ) = I h ( k ) + β ( k ) I n ( k ) N h S h ( k ) Δ t γ I h ( k ) Δ t μ h I h ( k ) Δ t + ω 2 ( k ) , R h ( k + 1 ) = R h ( k ) + γ R h ( k ) Δ t μ h R h ( k ) Δ t + ω 3 ( k ) , A n ( k + 1 ) = A n ( k ) + ρ n F n ( k ) 2 1 A n ( k ) K Δ t τ n + μ n a A n ( k ) Δ t + ω 4 ( k ) , S n ( k + 1 ) = S n ( k ) + τ n 2 A n ( k ) Δ t β ( k ) S n ( k ) I h ( k ) N h Δ t μ n S n ( k ) Δ t + ω 5 ( k ) , I n ( k + 1 ) = I n ( k ) + β ( k ) S n ( k ) I h ( k ) N h Δ t μ n I n ( k ) Δ t + ω 6 ( k ) , β ( k + 1 ) = β ( k ) Δ t + ω 7 ( k )
where Δ t is the time step and F n ( k ) = S n ( k ) + I n ( k ) . We add noise
ω ( k ) = ω 1 ( k ) , ω 2 ( k ) , ω 3 ( k ) , ω 4 ( k ) , ω 5 ( k ) , ω 6 ( k ) , ω 7 ( k )
to model uncertainty.

4.4. Extended Kalman Filter

The Extended Kalman Filter has been used to estimate the parameter values and the reproduction number [28,29,30]. We estimate the reproduction number by applying the Extended Kalman Filter (EKF) to the discrete-time stochastic augmented compartmental as given in Model (9). Let us define
x ( k ) = S h ( k ) , I h ( k ) , R h ( k ) , A n ( k ) , S n ( k ) , I n ( k ) T .
Model (9) can be written as
x ( k + 1 ) = f ( x ( k ) ) + ω ( k )
where f is the right hand side of Model (9). Denote x ^ as the estimate of x ( k ) from the EKF. We set the Jacobian of f at the estimate of x ( k ) which is given as
J ( x ^ ( k ) ) = J 11 ( x ^ ( k ) ) 0 0 0 0 J 16 ( x ^ ( k ) ) J 17 ( x ^ ( k ) ) J 21 ( x ^ ( k ) ) J 22 ( x ^ ( k ) ) 0 0 0 J 26 ( x ^ ( k ) ) J 27 ( x ^ ( k ) ) 0 0 J 33 ( x ^ ( k ) ) 0 0 0 0 0 0 0 J 44 ( x ^ ( k ) ) J 45 ( x ^ ( k ) ) J 46 ( x ^ ( k ) ) 0 0 J 52 ( x ^ ( k ) ) 0 J 54 ( x ^ ( k ) ) J 55 ( x ^ ( k ) ) 0 J 57 ( x ^ ( k ) ) 0 J 62 ( x ^ ( k ) ) 0 0 J 65 ( x ^ ( k ) ) J 66 ( x ^ ( k ) ) J 67 ( x ^ ( k ) ) 0 0 0 0 0 0 1
where
J 11 ( x ^ ( k ) ) = 1 β ( k ) I n ( k ) N h Δ t μ h Δ t , J 16 ( x ^ ( k ) ) = β ( k ) S h ( k ) N h Δ t , J 17 ( x ^ ( k ) ) = I n ( k ) S h ( k ) N h , J 21 ( x ^ ( k ) ) = β ( k ) I n ( k ) N h Δ t , J 22 ( x ^ ( k ) ) = 1 ( γ + μ h ) Δ t , J 26 ( x ^ ( k ) ) = β ( k ) S h ( k ) N h Δ t , J 27 ( x ^ ( k ) ) = I n ( k ) S h ( k ) N h Δ t , J 33 ( x ^ ( k ) ) = 1 + γ Δ t μ h Δ t , J 44 ( x ^ ( k ) ) = 1 ρ n ( S n ( k ) + I n ( k ) ) 2 K Δ t ( τ n + μ n a ) Δ t , J 45 ( x ^ ( k ) ) = ρ n 2 Δ t ρ n A n ( k ) 2 K Δ t , J 46 ( x ^ ( k ) ) = ρ n 2 Δ t ρ n A n ( k ) 2 K Δ t , J 52 ( x ^ ( k ) ) = β ( k ) S n ( k ) N h Δ t , J 54 ( x ^ ( k ) ) = τ n 2 Δ t , J 55 ( x ^ ( k ) ) = 1 β ( k ) I h ( k ) N h Δ t μ n Δ t , J 57 ( x ^ ( k ) ) = S n ( k ) I h ( k ) N h Δ t , J 62 ( x ^ ( k ) ) = β ( k ) S n ( k ) N h Δ t , J 65 ( x ^ ( k ) ) = β ( k ) I h ( k ) N h Δ t , J 66 ( x ^ ( k ) ) = 1 μ n Δ t , J 67 ( x ^ ( k ) ) = S n ( k ) I h ( k ) N h Δ t .
In the EKF algorithm, there are two tuning parameters which are the process covariance matrix Q f and observation covariance matrix R f . Note that the tuning parameters are chosen such that the Relative Root Mean Square Error (RRMSE) between the data and the estimated data is sufficiently small. The RRMSE for each variable is defined as
R R M S E = 1 N w j = 1 N w X j X j ^ 2 2 X j 2 2 ,
where N w is the number of weeks observed and X i S h , I h , I n and X ^ i S h ^ , I h ^ , I n ^ .

4.5. Estimation of Reproduction Number

In the estimation of time reproduction number, we have estimated the transmission rate and used its value to calculate the time reproduction number. The other parameters values are obtained from the literature and given in Table 1. The plot of the reported data and the simulations is given in Figure 2. It showed that the EKF algorithm estimates the reported data well. Furthermore, the transmission rate and the effective reproduction number are given in Figure 3 where they vary overtime depending on reported data. The highest effective reproduction number has been occurred in 2019 where the R t is higher than 2.5. It is consistent with the estimate of basic reproduction number by Ndii et al. [31] which estimated using the early growth rate method. It indicates that a single infectious individual may generate around two newly infected individuals. Furthermore, the transmission rate fluctuates between 0 and 2.3 week 1 with average transmission rate is around 0.4417 week 1 .

5. Sensitivity Analysis

To understand parameters governing the dynamics of dengue transmission in the presence of vaccination and Wolbachia bacterium, a global sensitivity analysis has been performed. We use Latin Hypercube Sampling (LHS) in conjuction with Partial Rank Correlation Coefficient (PRCC) Multivariate analysis to determine the influential parameters. The output of interest is the reproduction number.
Figure 4 showed the results of sensitivity analysis to determine the most influential parameters on the reproduction numbers. It showed that the β h n , S c , S n , β n are the influential parameters and have a positive relationship, which imply the possibility of an increase in the reproduction number when these parameter values increase. Note that the susceptible non-Wolbachia mosquitoes ( S n ) also govern the dynamics, and hence, we then explore the effects of parameters on the susceptible non-Wolbachia mosquitoes. For this, we measure against an increasing number of susceptible non-Wolbachia mosquitoes which is the solution of
d C S n d t = τ n A n 2 + ( 1 α ) τ w A w 2 + γ w S w .
We found that the population of susceptible mosquitoes is affected by the parameters τ n , μ n and μ n a as given in Figure 5. The loss of Wolbachia infections ( γ w ) and the maturation rate of Wolbachia ( τ w ) affect in the early period only.

6. Numerical Simulations in the Absence and Presence of Wolbachia

6.1. Numerical Simulations in the Absence of Vaccination

In the numerical simulations, we perform two vaccinations in combination with two different strains of Wolbachia which are WMel and WAlb. We simulate the solutions of the model in the presence of vaccination with different Wolbachia strains. Furthermore, we simulate the model with constant and time-dependent controls. In our simulation, we use the values as given in Table 1 and the transmission rate used is the mean of the estimated values given in Figure 3.
Figure 6 shows that if the loss of infection is high, the number of dengue infection is similar to that in the absence of Wolbachia. This indicates that the use of WMel strain is possible if the loss of infection is not high. This means that a loss of Wolbachia infections affects the performance of Wolbachia in reducing dengue transmission. Hence, the use of WMel may be less effective in comparison to WAu strains.
Figure 7 shows that the performace of the WAu strain is better than WMel. Interestingly, with the same values of loss of Wolbachia infection, WAu still performs better than WMel. This is caused by the effects of CI on WMel. Furthermore, an increase in the loss of Wolbachia infections results in a higher number of dengue incidence. Results suggest that the use of WAu is better in reducing the number of dengue incidence.

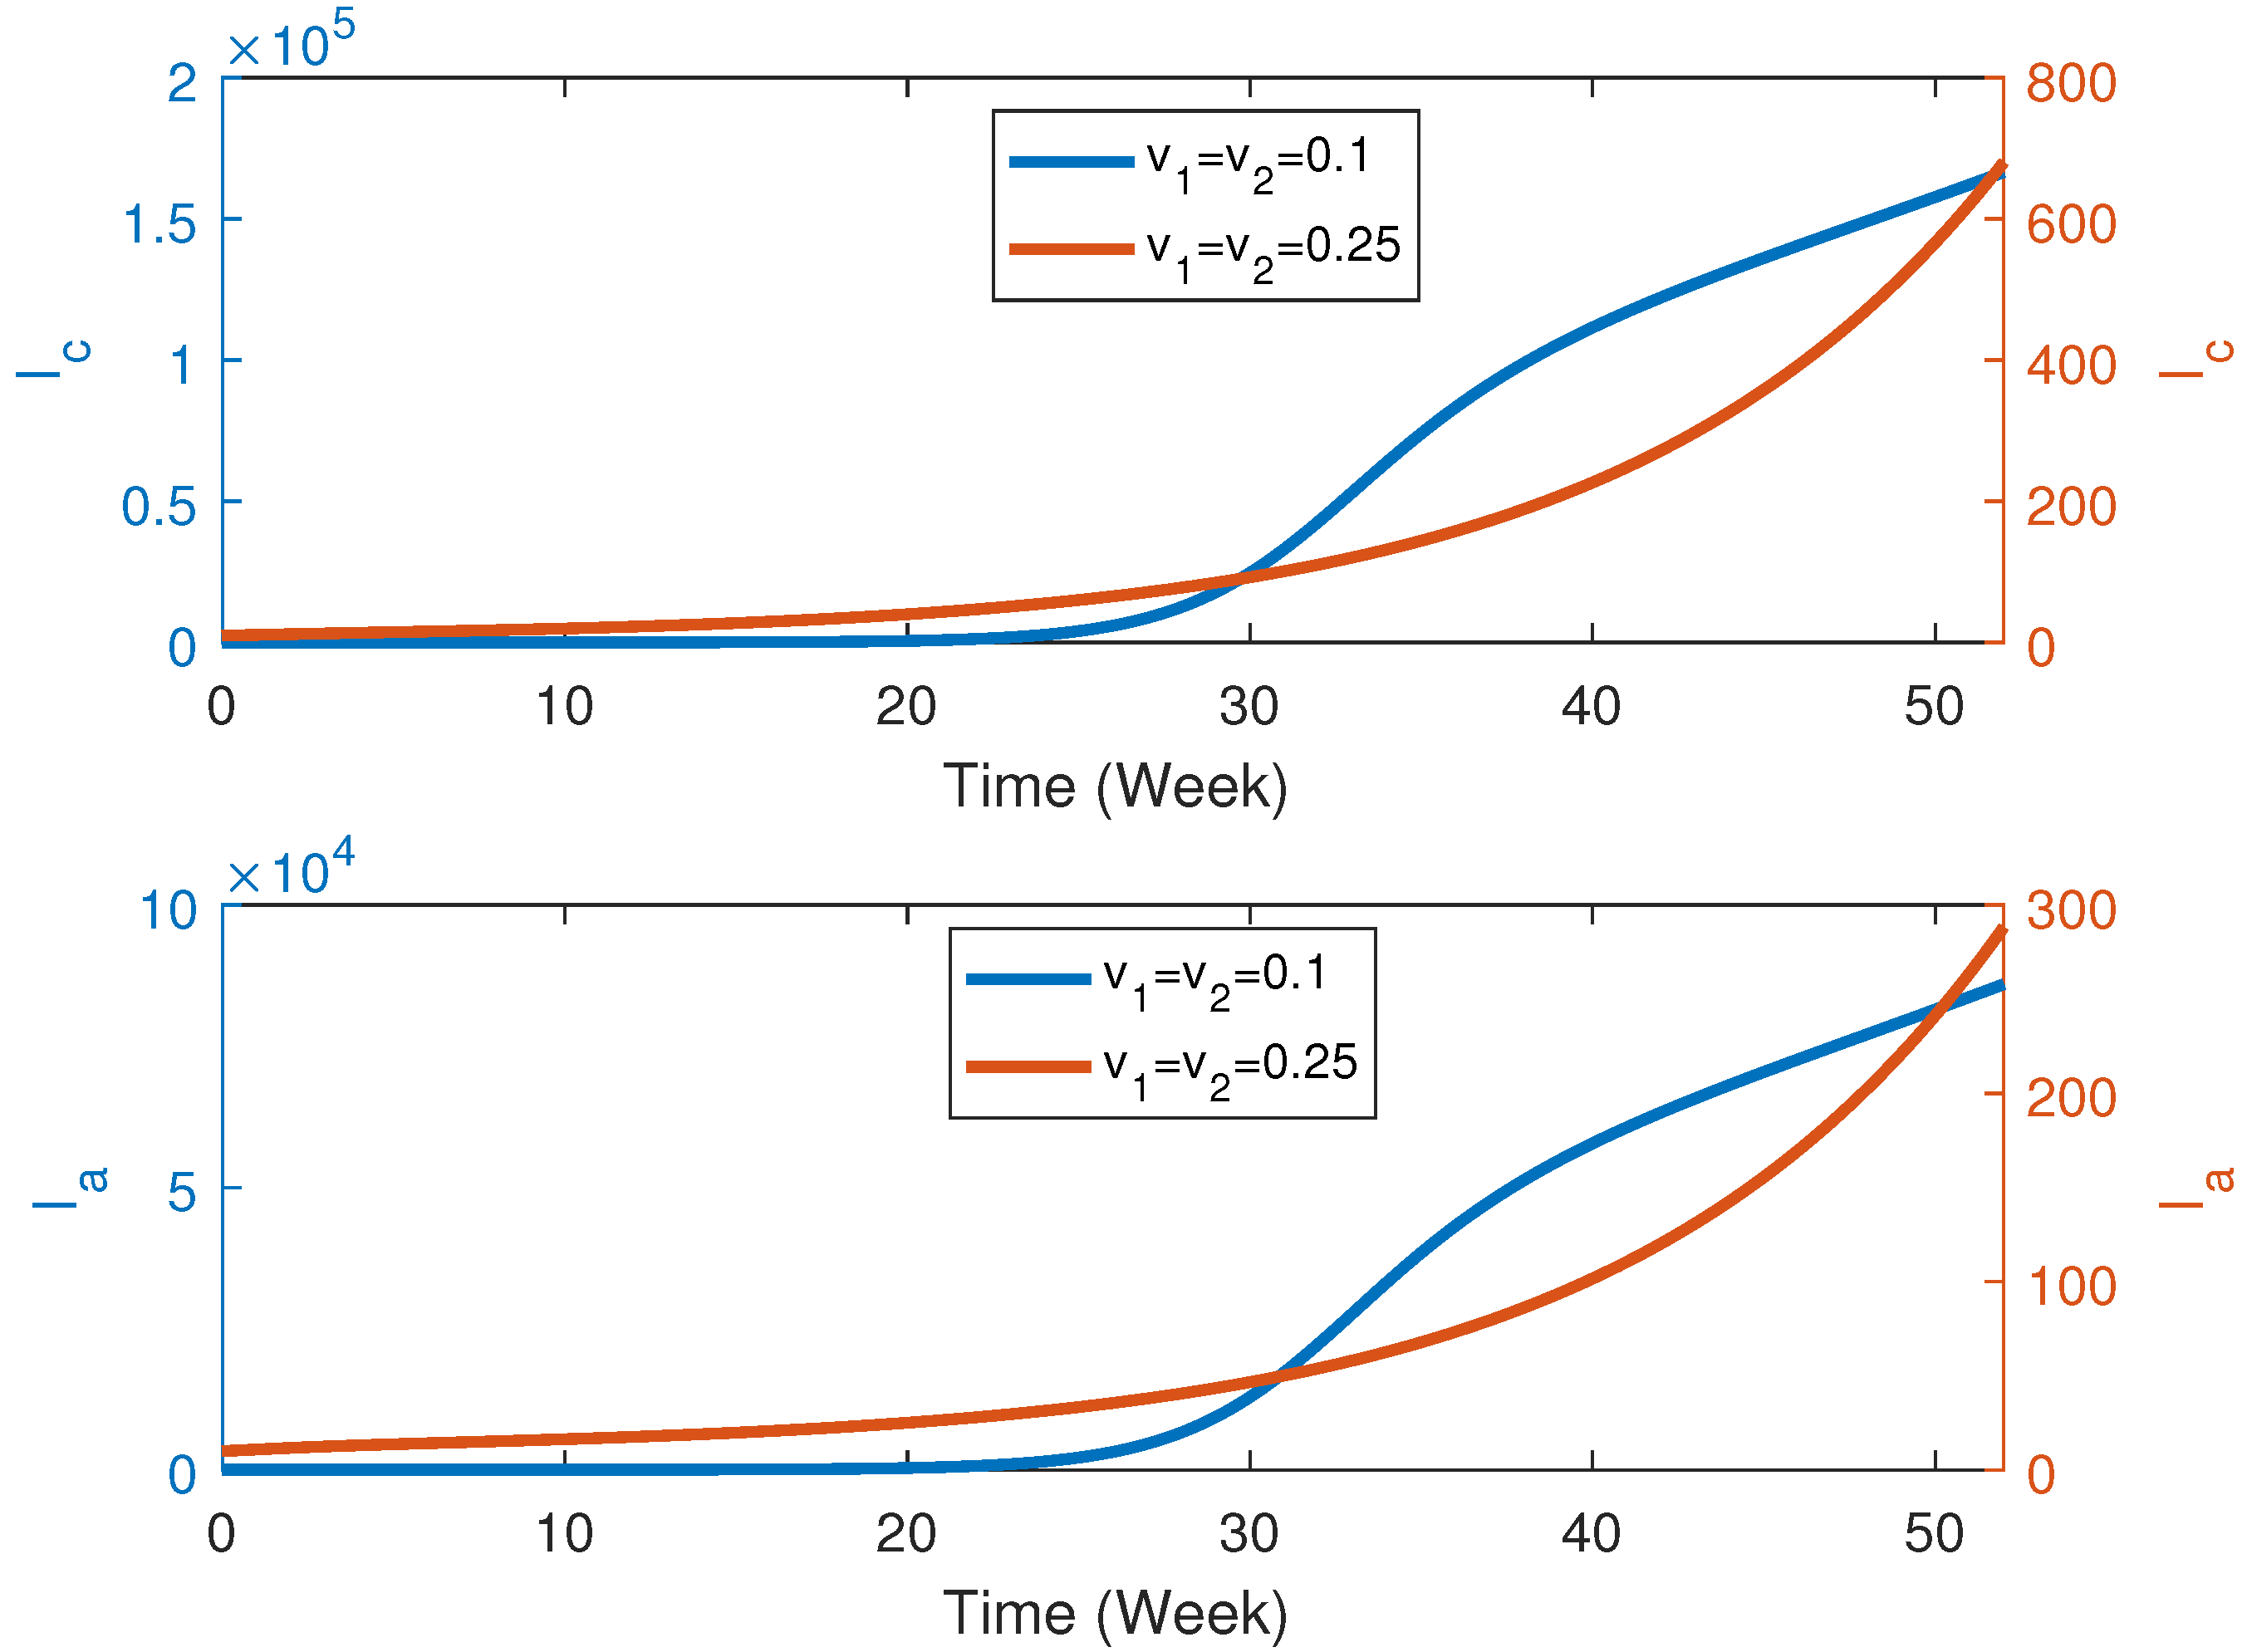
6.2. Numerical Simulation in the Presence of Vaccination

In this section, we simulate the presence of vaccination for two different Wolbachia strains. As in the previous section, the performance of WAu is better than WMel. Here, we investigate the effects of vaccination in the presence of Wolbachia. We use an optimal control approach for this.

6.3. Numerical Solution for Dengue Transmission Dynamics with Vaccination with Wolbachia

In this section, numerical solutions of the model in the presence of vaccination and Wolbachia are presented. The results showed that WAu performs better than WMel in reducing dengue incidence and hence in the presence of vaccination, we simulate using the WMel parameter values as used in simulating Figure 7. We consider different vaccination rates.
Figure 8 shows that if the vaccination rate is low, the number of dengue infections is high. To reduce dengue incidence, a higher vaccination rate should be applied. This implies that if a vaccine efficacy and the rate of vaccination is higher in combination with Wolbachia bacterium, dengue elimination is possible.

7. Optimal Control Approach

Numerical simulation showed that the loss of Wolbachia infection governs the dynamics of dengue transmission. When the values of loss Wolbachia infection increases, the number of dengue incidence increases (see Figure 6). Furthermore, the loss of Wolbachia infection is influenced by temperature particularly for WMel strain. To account for this phenomena, in the optimal control analysis, we consider a seasonal loss of Wolbachia infections, and hence, we set the loss of Wolbachia infection rate by the following sinusoidal function
γ w ( t ) = γ w 0 1 + η sin ( ω t )
where the γ w 0 is the average loss of Wolbachia infections, η the strength of seasonality. When analysing the effects of WAu strain, the values of γ w = 0.28 and ϕ = 0 . Furthermore, the vaccination acts as a control variable. Let ϵ 1 v 1 and ϵ 2 v 2 be u 1 and u 2 , respectively.
We aim to minimize the number of human infections with minimal cost. The objective functional is defined as
J ( u 1 , u 2 ) = 0 t f ( A 1 ( I c + I a ) + A 2 ( u 1 2 + u 2 2 ) ) d t
where A 1 , A 2 are the balancing coefficient and T f is the final time of interest. We use the quadratic objective as can be found in [32,33,34]. The Hamiltonian functional is defined as
H = ( A 1 ( I c + I a ) + A 2 ( u 1 2 + u 2 2 ) ) + λ i d X d t
where X = S c , S a , I a , I c , R a , R c , A n , S n , I n , A w , S w , I w and i = 1 , , 12 .

7.1. The Existence and Characterization of Optimal Control

In this section, we present the existence and characterization of the optimal control.
Theorem 1.
There exists an optimal control u = ( u 1 , u 2 ) with a corresponding state solutions such that
min u 1 , u 2 U J ( u 1 , u 2 ) = J ( u 1 * , u 2 * )
Proof. 
This theorem is proved based on the results in Flemming and Risher [35] and Lukes [36]. We state the following properties A1–A4:
A1.
The solution of the model with non-negative initial conditions and the associated control function in U is non-empty.
A2.
The control set U is convex and closed.
A3.
The dengue model can be expressed as a linear function of u 1 , u 2 with time and state dependent coefficients.
A4.
There exists constant m 1 > 0 , m 2 > 0 and p > 1 such that the integrand in (12) is convex and satisfy
H ( S a , I a , I c , u 1 , u 2 ) m 1 ( i = 1 2 | u i | 2 ) p 2 m 2 .
The condition A1 and A2 is fulfilled as the state variables and control variables are non-empty and bounded. Condition 3 is met due to the linear dependence of the state system on controls u 1 and u 2 The algorithm to show this can be seen in [37]. Condition A4 can be verified by writing the following
( A 1 ( I c + I a ) + A 2 ( u 1 2 + u 2 2 ) ) A 2 ( u 1 2 + u 2 2 ) A 2 ( u 1 2 + u 2 2 ) m 2 , m 1 ( u 1 2 + u 2 2 ) p / 2 m 2
Hence, A4 is verified. Therefore, there exists an optimal control u 1 , u 2 which minimizes J ( u 1 , u 2 ) . □
Theorem 2.
Given the optimal control ( u 1 * , u 2 * ) and the corresponding state trajectories, there exists an adjoit vector function that satisfy
d λ i d t = H x i
where i = 1 , 2 , , 12 and x i = ( S c , S a , I c , I a , R c , R a , A n , S n , I n , A w , S w , I w ) . Furthermore, u 1 * and u 2 * are characterized by
u 1 * ( t ) = min max S c ( λ 1 λ 5 ) 2 A 2 , 0 , u 1 m a x , u 2 * ( t ) = min max S a ( λ 2 λ 6 ) 2 A 2 , 0 , u 2 m a x ,
Proof. 
By taking the partial derivative of the Hamiltonian functional with respect to state variables, we then obtain the following adjoint variables.
d λ 1 d t = λ 1 α h β h n I n N h β h w I w N h μ h u 1 λ 2 α h λ 3 β h n I n N h + β h w I w N h λ 5 u 1 , d λ 2 d t = λ 2 β h n I n N h β h w I w N h μ h u 2 λ 4 β h n I n N h + β h w I w N h λ 6 u 2 , d λ 3 d t = A 1 λ 3 ( γ μ h ) λ 5 γ + β n S n N h ( λ 8 λ 9 ) + β w S w N h ( λ 11 λ 12 ) , d λ 4 d t = A 1 λ 4 ( γ μ h ) λ 6 γ + β n S n N h ( λ 8 λ 9 ) + β w S w N h ( λ 11 λ 12 ) , d λ 5 d t = λ 1 q 1 λ 5 ( μ h q 1 ) , d λ 6 d t = λ 2 q 2 λ 6 ( μ h q 2 ) , d λ 7 d t = λ 7 ρ n F n 2 + ϕ F n F w 2 K ( F n + F w ) τ n μ n a λ 8 τ n 2 + λ 10 ρ w F w 2 K , d λ 8 d t = λ 8 β n ( I c + I a ) N h μ n λ 9 β n ( I c + I a ) N h , d λ 9 d t = λ 1 β h n S c N h + λ 2 β h n S a N h λ 3 β h n S c N h λ 4 β h n S a N h + λ 9 μ n , d λ 10 d t = λ 7 ρ n F n 2 + ϕ F n F w 2 K ( F n + F w ) λ 8 ( 1 α ) τ w 2 λ 10 ρ w F w 2 K τ w μ w a λ 11 τ w α 2 , d λ 11 d t = λ 8 γ w ( t ) λ 11 β w ( I c + I a ) N h μ w γ w ( t ) λ 12 β w ( I c + I a ) N h , d λ 12 d t = β h w S c N h λ 1 λ 3 + β h w S a N h λ 2 λ 4 + λ 12 μ w .
with the transversality condition λ i ( t f ) = 0 , where i = 1 , 2 , 3 , , 12 . We then take the derivative with respect to u 1 and u 2 to obtain
u 1 = S c ( λ 1 λ 5 ) 2 A 2 a n d u 2 = S a ( λ 2 λ 6 ) 2 A 2
Using the bounds we obtain the characterization of control as given in Equation (14). □

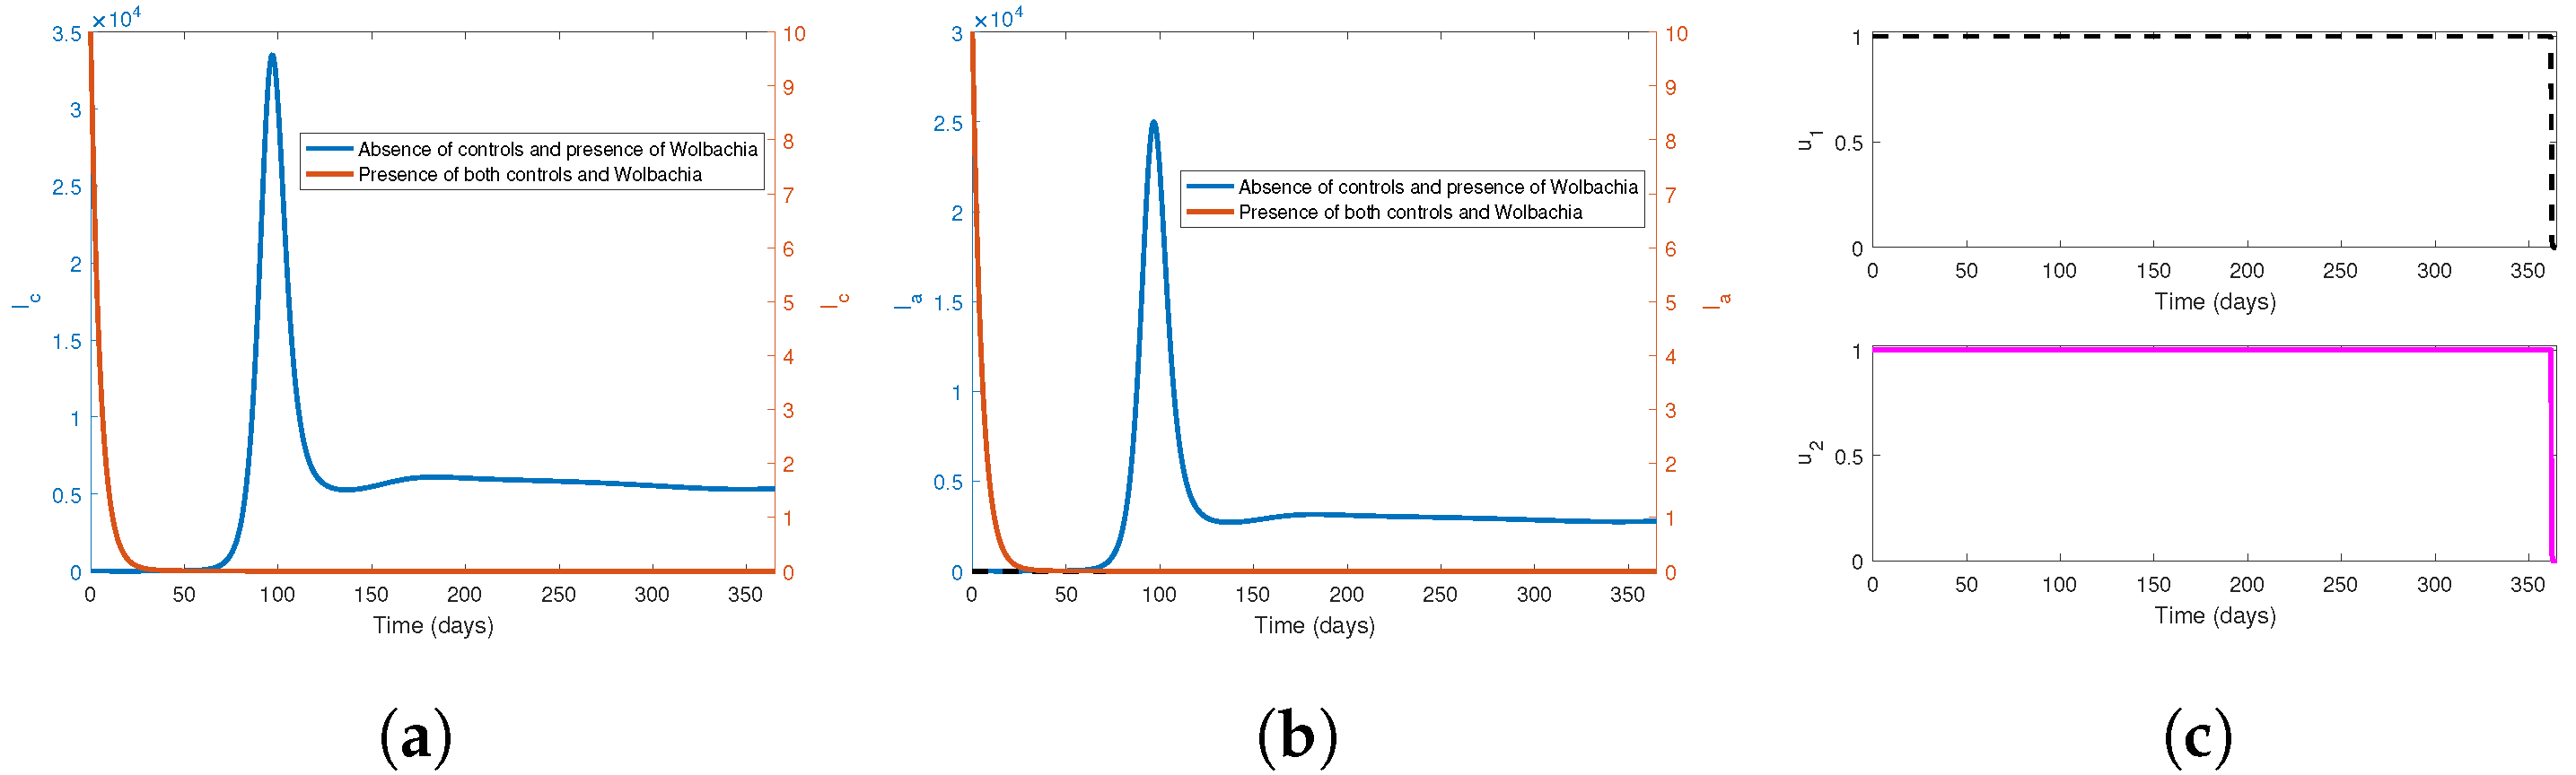
7.2. Numerical Simulations of Optimal Control

In this section, we present numerical simulations of the optimal control. The parameter values used are given in Table 1 and the balancing coefficients are A 1 = A 2 = 1 . We consider two cases which are vaccination of child individuals only and vaccination of adult individuals only, vaccination both child and adult individuals.
Figure 9 shows the infected individuals with the implementation of vaccination on children only ( u 1 0 and u 2 = 0 ). It reveals that the implementation of u 1 only can reduce the number of infected children. Dengue infections on adult individuals are still high. Furthermore, the implementation of u 1 should be at highest level for the entire period.
Figure 10 shows that the number of infected adult individuals is reduced in the implementation of u 2 control only and the number of infected children remains high. The control on u 2 is not at the highest level in the early period but then it goes to highest level after around 100 days.
Figure 11 shows that the implementation of vaccination on both child and adult individuals in combination with Wolbachia could possibly eliminate the dengue infections. Furthermore, a highest vaccination rate on children and adult should be implemented to obtain optimal results.
The implementation of vaccination on one group of individuals only cannot eradicate the diseases. It can reduce dengue infections for that group only. Overall, to obtain the optimal results, the vaccination should be implemented in both groups and in combination with the use of Wolbachia.

8. Discussion and Conclusions

In this paper, a mathematical model in the presence of Wolbachia and vaccination has been formulated. The model is studied to examine the performance of both strategies in reducing dengue transmission. We estimate the effective reproduction number using the Extended Kalman Filter algorithm against data of dengue infections from Kupang city, Indonesia. A global sensitivity analysis has been performed to determine the influential parameters. An optimal control approach has been performed to assess the optimal reduction in dengue with minimal cost. The contributions of this paper are the following. The first contribution is the estimation of the time reproduction number in Kupang-city Indonesia. To the best of our knowledge, this is the first work to estimate the time reproduction number in Kupang-city, Indonesia. The second is scientific knowledge regarding the effects of vaccination and the use of WMel and WAu Wolbachia strain in reducing dengue transmission dynamics.
The results show that the Extended Kalman Filter algorithm estimates the reported data well. It reveals that the effective reproduction number fluctuates over time with the highest R t of of around 2.6 occurs in 2019. This means that a single infectious individual can generate two to three newly infectious individuals. The estimate is consistent with estimates of R 0 using early growth rate methods [31]. The results of the effective reproduction number are similar to the previously estimated R 0 for different areas such as Cali, Colombia [38], Pakistan [39], and East Java, Indonesia [40]. Furthermore, non-Wolbachia mosquito-related and the transmission parameters are the more influential and govern the dynamics of dengue transmission. This implies that these factors need to be carefully managed to design better actions for reducing dengue incidence. The performance of WAu in reducing dengue is better than WMel. Furthermore, when the rate of loss of Wolbachia infections is high, the implementation of Wolbachia cannot perform well in reducing dengue incidence. The results from the optimal control approach suggest the implementation of vaccination on both groups in the presence of Wolbachia could potentially eliminate the dengue. The implementation of vaccination in certain groups only can reduce the dengue infections in that group only.
Given that the loss of Wolbachia infections affects the performance of Wolbachia in reducing the dengue transmission dynamics, an appropriate use of Wolbachia strains for the dengue elimination strategy is required. For areas with relatively stable temperature over years, the use of either the WMel or WAu strain is appropriate. For areas with strong fluctuations in temperature, the use of the WAu strain is possibly more appropriate. However, both strains can potentially reduce the number of dengue infections. Furthermore, the administration of the vaccine on a single group only, either child or adult, can only reduce the number of infections in that group. However, further research needs to be conducted to understand the effects of temperature and antibody-dependent enhancement on the effects with the implementation of vaccination and different Wolbachia strains. This may add new insights into the use of both strategies. In conclusion, the integrated strategies by using Wolbachia and the vaccine should be implemented in order to possibly reach dengue elimination.

Author Contributions

Methodology and conceptualization, writing original draft, M.Z.N.; writing—editing and review, N.A.; software, B.S.D.; formal analysis, L.K.B.; data curation K.N.N. All authors have read and agreed to the published version of the manuscript.

Funding

The author acknowledges funding from Ministry of Education and Culture, Research, and Technology of Indonesia through Penelitian Dasar 2021–2023.

Institutional Review Board Statement

Not applicable.

Informed Consent Statement

Not applicable.

Data Availability Statement

The data is available upon request.

Conflicts of Interest

The authors declare no conflict of interest.

References

  1. Cattarino, L.; Rodriguez-Barraquer, I.; Imai, N.; Cummings, D.A.T.; Ferguson, N.M. Mapping global variation in dengue transmission intensity. Sci. Transl. Med. 2020, 12, eaax4144. [Google Scholar] [CrossRef] [PubMed]
  2. Aguiar, M.; Stollenwerk, N.; Halstead, S.B. The Impact of the Newly Licensed Dengue Vaccine in Endemic Countries. PLoS Negl. Trop. Dis. 2016, 10, e0005179. [Google Scholar] [CrossRef] [PubMed] [Green Version]
  3. Aguiar, M.; Stollenwerk, N.; Halstead, S.B. The risks behind Dengvaxia recommendation. Lancet Infect. Dis. 2016, 16, 882–883. [Google Scholar] [CrossRef]
  4. Ndii, M.Z.; Mage, A.R.; Messakh, J.J.; Djahi, B.S. Optimal vaccination strategy for dengue transmission in Kupang city, Indonesia. Heliyon 2020, 6, e05345. [Google Scholar] [CrossRef] [PubMed]
  5. Napoli, C.; Salcuni, P.; Pompa, M.G.; Declich, S.; Rizzo, C. Estimated Imported Infections of Chikungunya and Dengue in Italy, 2008 to 2011. J. Travel Med. 2012, 19, 294–297. [Google Scholar] [CrossRef] [PubMed] [Green Version]
  6. Dorigatti, I.; McCormack, C.; Nedjati-Gilani, G.; Ferguson, N.M. Using Wolbachia for Dengue Control: Insights from Modelling. Trends Parasitol. 2018, 34, 102–113. [Google Scholar] [CrossRef]
  7. Biswal, S.; Reynales, H.; Saez-Llorens, X.; Lopez, P.; Borja-Tabora, C.; Kosalaraksa, P.; Sirivichayakul, C.; Watanaveeradej, V.; Rivera, L.; Espinoza, F.; et al. Efficacy of a Tetravalent Dengue Vaccine in Healthy Children and Adolescents. N. Engl. J. Med. 2019, 381, 2009–2019. [Google Scholar] [CrossRef]
  8. Biswal, S.; Borja-Tabora, C.; Martinez Vargas, L.; Velásquez, H.; Theresa Alera, M.; Sierra, V.; Johana Rodriguez-Arenales, E.; Yu, D.; Wickramasinghe, V.P.; Duarte Moreira, E.; et al. Efficacy of a tetravalent dengue vaccine in healthy children aged 4–16 years: A randomised, placebo-controlled, phase 3 trial. Lancet 2020, 395, 1423–1433. [Google Scholar] [CrossRef]
  9. Villar, L.; Dayan, G.H.; Arredondo-García, J.L.; Rivera, D.M.; Cunha, R.; Deseda, C.; Reynales, H.; Costa, M.S.; Morales-Ramírez, J.O.; Carrasquilla, G.; et al. Efficacy of a Tetravalent Dengue Vaccine in Children in Latin America. N. Engl. J. Med. 2015, 372, 113–123. [Google Scholar] [CrossRef]
  10. Pagendam, D.E.; Trewin, B.J.; Snoad, N.; Ritchie, S.A.; Hoffmann, A.A.; Staunton, K.M.; Paton, C.; Beebe, N. Modelling the Wolbachia incompatible insect technique: Strategies for effective mosquito population elimination. BMC Biol. 2020, 18, 161. [Google Scholar] [CrossRef]
  11. Ndii, M.Z.; Hickson, R.; Allingham, D.; Mercer, G. Modelling the transmission dynamics of dengue in the presence of Wolbachia. Math. Biosci. 2015, 262, 157–166. [Google Scholar] [CrossRef] [PubMed]
  12. Ferguson, N.M.; Hue Kien, D.T.; Clapham, H.; Aguas, R.; Trung, V.T.; Bich Chau, T.N.; Popovici, J.; Ryan, P.A.; O’Neill, S.L.; McGraw, E.A.; et al. Modeling the impact on virus transmission of Wolbachia-mediated blocking of dengue virus infection of Aedes aegypti. Sci. Transl. Med. 2015, 7, 279ra37. [Google Scholar] [CrossRef] [PubMed] [Green Version]
  13. Beebe, N.W.; Pagendam, D.; Trewin, B.J.; Boomer, A.; Bradford, M.; Ford, A.; Liddington, C.; Bondarenco, A.; Barro, P.J.D.; Gilchrist, J.; et al. Releasing incompatible males drives strong suppression across populations of wild and Wolbachia-carrying Aedes aegypti in Australia. Proc. Natl. Acad. Sci. USA 2021, 118, e2106828118. [Google Scholar] [CrossRef] [PubMed]
  14. Turley, A.P.; Moreira, L.A.; O’Neill, S.L.; McGraw, E.A. Wolbachia Infection Reduces Blood–Feeding Success in the Dengue Fever Mosquito, Aedes aegypti. PLoS Negl. Trop. Dis. 2009, 3, e516. [Google Scholar] [CrossRef]
  15. Ndii, M.Z. Modelling the Use of Vaccine and Wolbachia on Dengue Transmission Dynamics. Trop. Med. Infect. Dis. 2020, 5, 78. [Google Scholar] [CrossRef]
  16. Cardona-Salgado, D.; Campo-Duarte, D.E.; Sepulveda-Salcedo, L.S.; Vasilieva, O. Wolbachia-based biocontrol for dengue reduction using dynamic optimization approach. Appl. Math. Modell. 2020, 82, 125–149. [Google Scholar] [CrossRef]
  17. Zhang, H.; Lui, R. Releasing Wolbachia-infected Aedes aegypti to prevent the spread of dengue virus: A mathematical study. Infect. Dis. Modell. 2020, 5, 142–160. [Google Scholar] [CrossRef]
  18. Ogunlade, S.T.; Adekunle, A.I.; Meehan, M.T.; Rojas, D.P.; McBryde, E.S. Modeling the potential of wAu-Wolbachia strain invasion in mosquitoes to control Aedes-borne arboviral infections. Sci. Rep. 2020, 10, 16812. [Google Scholar] [CrossRef]
  19. Aguiar, M.; Anam, V.; Blyuss, K.B.; Estadilla, C.D.S.; Guerrero, B.V.; Knopoff, D.; Kooi, B.W.; Srivastav, A.K.; Steindorf, V.; Stollenwerk, N. Mathematical models for dengue fever epidemiology: A 10-year systematic review. Phys. Life Rev. 2022, 40, 65–92. [Google Scholar] [CrossRef]
  20. Shim, E. Optimal dengue vaccination strategies of seropositive individuals. Math. Biosci. Eng. 2019, 16, 1171–1189. [Google Scholar] [CrossRef]
  21. Junsawang, P.; Zuhra, S.; Sabir, Z.; Raja, M.A.Z.; Shoaib, M.; Botmart, T.; Weera, W. Numerical Simulations of Vaccination and Wolbachia on Dengue Transmission Dynamics in the Nonlinear Model. IEEE Access 2022, 10, 31116–31144. [Google Scholar] [CrossRef]
  22. Ant, T.H.; Herd, C.S.; Geoghegan, V.; Hoffmann, A.A.; Sinkins, S.P. The Wolbachia strain wAu provides highly efficient virus transmission blocking in Aedes aegypti. PLoS Pathogens 2018, 14, e1006815. [Google Scholar] [CrossRef] [PubMed]
  23. van den Hurk, A.F.; Hall-Mendelin, S.; Pyke, A.T.; Frentiu, F.D.; McElroy, K.; Day, A.; Higgs, S.; O’Neill, S.L. Impact of Wolbachia on Infection with Chikungunya and Yellow Fever Viruses in the Mosquito Vector Aedes aegypti. PLoS Negl. Trop. Dis. 2012, 6, 1892. [Google Scholar] [CrossRef] [PubMed] [Green Version]
  24. Walker, T.; Johnson, P.H.; Moreira, L.A.; Iturbe-Ormaetxe, I.; Frentiu, F.D.; McMeniman, C.J.; Leong, Y.S.; Dong, Y.; Axford, J.; Kriesner, P.; et al. The WMel Wolbachia strain blocks dengue and invades caged Aedes aegypti populations. Nature 2011, 476, 450–453. [Google Scholar] [CrossRef]
  25. Hussain, M.; Lu, G.; Torres, S.; Edmonds, J.H.; Kay, B.H.; Khromykh, A.A.; Asgari, S. Effect of Wolbachia on Replication of West Nile Virus in a Mosquito Cell Line and Adult Mosquitoes. J. Virol. 2013, 87, 851–858. [Google Scholar] [CrossRef] [Green Version]
  26. Ndii, M.Z.; Hickson, R.I.; Mercer, G.N. Modelling the introduction of Wolbachia into Aedes aegypti to reduce dengue transmission. ANZIAM J. 2012, 53, 213–227. [Google Scholar]
  27. Diekmann, O.; Heesterbeek, J.A.P.; Roberts, M.G. The construction of next-generation matrices for compartmental epidemic models. J. R. Soc. Interface 2010, 7, 873–885. [Google Scholar] [CrossRef] [Green Version]
  28. Hasan, A.; Nasution, Y. A compartmental epidemic model incorporating probable cases to model COVID-19 outbreak in regions with limited testing capacity. ISA Trans. 2021, 124, 157–163. [Google Scholar] [CrossRef]
  29. Yi, C.; Cohnstaedt, L.W.; Scoglio, C.M. SEIR-SEI-EnKF: A New Model for Estimating and Forecasting Dengue Outbreak Dynamics. IEEE Access 2021, 9, 156758–156767. [Google Scholar] [CrossRef]
  30. Hasan, A.; Susanto, H.; Tjahjono, V.; Kusdiantara, R.; Putri, E.; Nuraini, N.; Hadisoemarto, P. A new estimation method for COVID-19 time-varying reproduction number using active cases. Sci. Rep. 2022, 12, 6675. [Google Scholar] [CrossRef]
  31. Ndii, M.Z.; Anggriani, N.; Messakh, J.J.; Djahi, B.S. Estimating the reproduction number and designing the integrated strategies against dengue. Results Phys. 2021, 27, 104473. [Google Scholar] [CrossRef]
  32. Herdicho, F.F.; Chukwu, W.; Tasman, H. An optimal control of malaria transmission model with mosquito seasonal factor. Results Phys. 2021, 25, 104238. [Google Scholar] [CrossRef]
  33. Abidemi, A.; Aziz, N.A.B. Optimal control strategies for dengue fever spread in Johor, Malaysia. Comput. Methods Programs Biomed. 2020, 196, 105585. [Google Scholar] [CrossRef] [PubMed]
  34. Olaniyi, S.; Mukamuri, M.; Okosun, K.; Adepoju, O. Mathematical analysis of a social hierarchy-structured model for malaria transmission dynamics. Results Phys. 2022, 34, 104991. [Google Scholar] [CrossRef]
  35. Fleming, W.; Rishel, R. Deterministic and Stochastic Optimal Control; Stochastic Modelling and Applied Probability; Springer: New York, NY, USA, 2012. [Google Scholar]
  36. Lukes, D. Differential Equations: Classical to Controlled; Number v. 162 in Differential Equations: Classical to Controlled; Academic Press: Cambridge, MA, USA, 1982. [Google Scholar]
  37. Abidemi, A.; Olaniyi, S.; Adepoju, O.A. An Explicit Note on the Existence Theorem of Optimal Control Problem. J. Phys. Conf. Ser. 2022, 2199, 012021. [Google Scholar] [CrossRef]
  38. Sepulveda, L.S.; Vasilieva, O. Optimal control approach to dengue reduction and prevention in Cali, Colombia. Math. Methods Appl. Sci. 2016, 39, 5475–5496. [Google Scholar] [CrossRef]
  39. Khan, A.; Hassan, M.; Imran, M. Estimating the basic reproduction number for single-strain dengue fever epidemics. Infect. Dis. Poverty 2014, 3, 12. [Google Scholar] [CrossRef] [Green Version]
  40. Khan, M.A.; Fatmawati. Dengue infection modeling and its optimal control analysis in East Java, Indonesia. Heliyon 2021, 7, e06023. [Google Scholar] [CrossRef]
Figure 1. Weekly dengue data for infected individuals from January 2016 to December 2020 in Kupang city, Indonesia.
Mathematics 10 02075 g001
Figure 2. Plot of data vs. estimation.
Mathematics 10 02075 g002
Figure 3. Plot of data reproduction number and transmission rate. The blue is the data, the solid red line is the reproduction number and dashed black line is the transmission rate over time.
Mathematics 10 02075 g003
Figure 4. PRCC indices of Reproduction Number in the presence of vaccination and Wolbachia.
Mathematics 10 02075 g004
Figure 5. PRCC indices when measured against an increasing number of susceptible non-Wolbachia mosquito population in the presence of vaccination and Wolbachia.
Mathematics 10 02075 g005
Figure 6. Simulation of the total infection at the end of week 156 when varying the rate of loss of Wolbachia infection (week 1 ) in comparison with infection in the absence of Wolbachia. We use the WAu parameter values.
Mathematics 10 02075 g006
Figure 7. Simulation of infected individuals in the presence of different Wolbachia strain and absence of vaccination.
Mathematics 10 02075 g007
Figure 8. Simulation of infected individuals in the presence of vaccination and Wolbachia bacterium. We use the WAu parameter values. The vaccine efficacy is ϵ 1 = 0.5 and ϵ 2 = 0.55 .
Mathematics 10 02075 g008
Figure 9. Plots (a,b) are the plot of infected child and adult individuals, respectively. Plot (c) is the control profile.
Mathematics 10 02075 g009
Figure 10. Plots (a,b) are the plot of infected child and adult individuals, respectively. Plot (c) is the control profile.
Mathematics 10 02075 g010
Figure 11. Plots (a,b) are the plot of infected children and adult individuals, respectively. Plot (c) is the control profile.
Mathematics 10 02075 g011
Table 1. Parameter values and descriptions.
ParameterDescriptionValueUnit
Λ Recruitment rate of human 402 , 286 65 × 52 week 1
μ Natural Death Rate 1 65 × 52 week 1
α h Progression rate from child to adult 1 / 26 week 1
β h n Transmission rate from Non-W to human 0.4417 week 1
β h w Transmission rate from W to human0.2098week 1
q 1 Progression rate from recovered child to susceptible child 1 / ( 6 × 52 ) week 1
q 2 Progression rate from recovered adult to susceptible adult 1 / ( 12 × 52 ) week 1
γ Recovery rate7/5week 1
ρ N Reproduction rate of non-W mosquitoes8.75week 1
τ N Maturation rate of non-W mosquitoes2week 1
μ n a Death rate of aquatic non-W mosquitoes1/2week 1
α Maternal transmission0.9n/a
β n Transmission rate from human to Non-W mosquitoes 0.4417 week 1
ρ w Reproductive rate of W-mosquitoes 15.75 week 1
τ w Maturation rate of W-mosquitoes2week 1
γ w Loss of Wolbachia infections 0.28 week 1
μ n Death rate of adult non-W mosquitoes1/2week 1
μ w Death rate of adult W mosquitoes0.45week 1
Publisher’s Note: MDPI stays neutral with regard to jurisdictional claims in published maps and institutional affiliations.

