1. Introduction
With the aid of smart terminals, such as mobile phones and tablets, social entertainment and experience-sharing through online media have become important channels for information dissemination in people’s daily lives [
1,
2]. Citing the 48th report issued by the China Internet Network Information Center, until June 2021, the number of Internet users in China had exceeded 1 billion, the average weekly time spent on the web was 26.9 h per person, and the Internet penetration rate reached 71.6% [
3]. To prevent and control the spread of the epidemic, the implementation of protective isolation measures and home-office policies further stimulated persons’ usage frequency of social media. Social networks represented by WeChat, Blogs, Twitter, and online communities have increased the joy and convenience of daily life for the public but have also become the distribution center of information dissemination. In the era of “We Media”, the research on information dissemination of social networks is one of the academic hot spots [
4,
5,
6,
7,
8].
The existing research on the effect and regular patterns of information dissemination in the social network can be roughly divided into three categories: (1) Information dissemination based on social network structure. Mathematical models are proposed based on the structure or distribution, network connection strength, or density of social networks [
9,
10,
11]. Empirical research using Sina Weibo [
12] shows that the popularity of content is well reflected in the structural diversity of early adopters. Kumar and Sinha [
13] pointed out that the speed and intensity of information dissemination depend on the network topology and the initialization of network parameters; the node is the source of motivation, and information dissemination can gain expansion effects through network propagation [
14]. Henry et al. [
15] study mathematical models on information diffusion and summarize the influence on information flow by network structure, number, and distribution of linked network communities. (2) State and characteristics of network user groups. Wang and Zhu [
16] pointed out that users’ social influence often enhances social media information dissemination inequality, and the corresponding social influence threshold model was developed. Wang et al. [
7] explored virtual community reward systems’ influence and operation mechanism on sharing knowledge (explicit and implicit). Riquelme et al. [
17] proposed a new centrality metric (MilestonesRank) to identify opinion leaders in social media. Firdaus et al. [
18] studied the forwarding behavior and forwarding prediction of social network users and analyzed the information diffusion mechanism of online social networks. Ozer et al. present a multidimensional shape-based time-series clustering algorithm that could uncover meaningful clusters of popularity behaviors in real-world GitHub and Twitter datasets [
19]. (3) Information dissemination analysis based on data characteristics. Foroozani and Ebrahimi [
20] introduced an information diffusion model of social networks, and the densities of adjacent affected users were simulated from the perspectives of time and space for different types and scales of diffusions. Hnings et al. [
21] and Fan et al. [
22] studied the influence of different attribute features (such as tweet content information and Twitter users) on the speed and scale of information dissemination. Zhang et al. [
23] confirmed the richness and reliability of information sources to positively impact information sharing and transmission. Li et al. [
24] took the panel data of Sina Weibo as an example to explore the relationship between content characteristics, information source characteristics, and online interaction behaviors of microblog users.
To sum up, social networks have made revolutionary contributions to information sharing and dissemination. Considering social media’s profound and lasting impact on real society, end-users expect to know about all aspects of social life through the network sooner or later. Extracting useful or valuable information from the huge amount of online data to help anticipate, track, and solve issues (e.g., preventing natural hazards, estimating project funding, optimizing marketing campaigns) has become the critical expectation of researchers.
2. CBR Approach for Postings-Popularity Prediction in the Brand Automobile Community
2.1. CBR Approach and Application in Various Fields
Case-Based Reasoning (CBR) is an important knowledge reasoning technique in the AI field [
25], which is used to support decision makers in finding ideal solutions. The CBR methodology is to simulate human thinking and reasoning, which solves the current problem by referring to historical experience. Specifically, by searching for historical cases similar to the new problem, the relevant knowledge of historical cases is successfully adopted to solve the new one. Certain principles or thresholds should be satisfied while retrieving and extracting historical cases. Finally, the solution of the fast, practical target case will be achieved, which is an important advantage of the CBR approach, such as the successful application in the fields of crisis prediction or emergency decisions [
26,
27,
28], aided manufacturing [
29,
30], intelligent diagnosis [
31,
32,
33], and expert intelligence [
34,
35].
The point of research and applications of the CBR include: Firstly, CBR research mainly focuses on the construction of case expression systems and similarity measures algorithms. According to the characteristics of heterogeneous information in the cases with a concealing property, Wu et al. [
25] constructed a similar case extraction and amount estimation method based on a multi-dimensional characteristic system. Chang et al. [
36] developed a novel CBR framework, including a collaborative filtering mechanism and a semantic-based case retrieval agent. Zhu et al. [
28] studied data characteristics of urban floods. Based on the case similarity measurement of classification filtration, punctiform similarity, interval similarity, and entropy weight method, a four-layer model was proposed. Zhang et al. provided a hybrid similarity algorithm to assist law enforcement officers in finding the hidden property of judgment debtors and analyzed the characteristics of judgment debtors based on the hesitant fuzzy linguistic clustering method [
37,
38]. Zhang et al. explored the application of hesitant fuzzy linguistic term sets in evaluation information and analyzed the application of the interval type-2 fuzzy TOPSIS (IT2-FTOPSIS) method in risk evaluation [
39,
40]. He et al. [
41] developed a hidden property evaluation model based on the probabilistic linguistic three-way multi-attribute decision-making (PL3W-MADM) method. Cai et al. selected the best performing k-nearest neighbor (KNN) as the evaluation function and developed a similarity calculation method based on normalized Euclidean distance [
33]. Jin et al. [
42] employed fuzzy similarity measurement (SM), numeric SM, textual SM, and interval SM to calculate the similarities between input variables and corresponding experimental values in visual prostheses research. Secondly, prediction research based on CBR has been applied in various fields. By introducing the concept of context into the CBR system, Zhang et al. [
43] developed a predicting method of broadcasting ratings with historical data. Wei et al. [
44] proposed a new traffic emission prediction model by combining the CBR with interval-valued intuitionistic fuzzy sets. Hui et al. [
45] proposed hybridizing principles of CBR for business failure prediction based on datasets collected from normal economic and financial crisis environments.
It can be seen from the above that the CBR approach has been popularized in many fields, but it has not been widely applied in the field of social networks. At present, no suitable method based on the CBR has been offered to deal with the problem of online-information dissemination, and a set of feasible social-media network case feature systems and similarity measure calculations have not been constructed. However, the methodology of the CBR conforms to human thinking and reasoning logic, which supports decision makers in finding solutions to solve new problems by extracting a group of similar historical cases. Moreover, the CBR approach has unique advantages in solving complex decision-making problems. According to the needs of practical applications, the attribute features of different data types could be dealt with satisfactorily on the CBR approach, such as symbols, crisp numbers, interval numbers, and fuzzy language variables. Based on these attribute features, the historical and target cases could successfully be expressed by the mathematical method and calculated similarity measure between them.
On the basis of these features, the CBR approach is suitable for application and promotion in complex scenes. Therefore, this paper will differ from previous research methods on social network information. From the view of imitating the human reasoning and thinking process, this paper plans to analyze and solve the target object problem by extracting similar historical case sets, from which the particular history knowledge was obtained as a reference [
37,
44]. We plan to have a case study on the brand automobile discussion site. Each posting in the online automobile community will be considered an independent case. The CBR approach will be explored to analyze and predict the popularity of postings in online communities.
2.2. The Framework of the CBR-Based Popularity Prediction of Community Postings
The online automobile-community brand is a typical social media with the same complex environment and community characteristics, including: (1) The online automobile community is in an interactive and real-time changing network environment. Massive data arises from user interactions in the network community. As time goes on, the amount of data from online communities is not only overwhelmingly large, but in real-time, which makes the online information difficult to track and process. (2) The data from the network is generally rich in information and complex in structure, including simple features that can be observed directly. However, online data is composed of high-dimensional and variable length content, such as histories of posting messages or comments. (3) There are always some regulations such as “Recommendation” or “Page Topping”, which are common in social media. By pushing notifications or adjusting messages’ position on the site page, “Recommendation” and “Page Topping” generally mean that a part of the messages will get more chances in social network communities. These operation mechanisms of the network community support some messages to gain excess returns, and the social platform usually recognizes such messages. Moreover, “network effects” such as the Matthew effect and the information competition in the process of network information dissemination will lead to extreme events and excess returns.
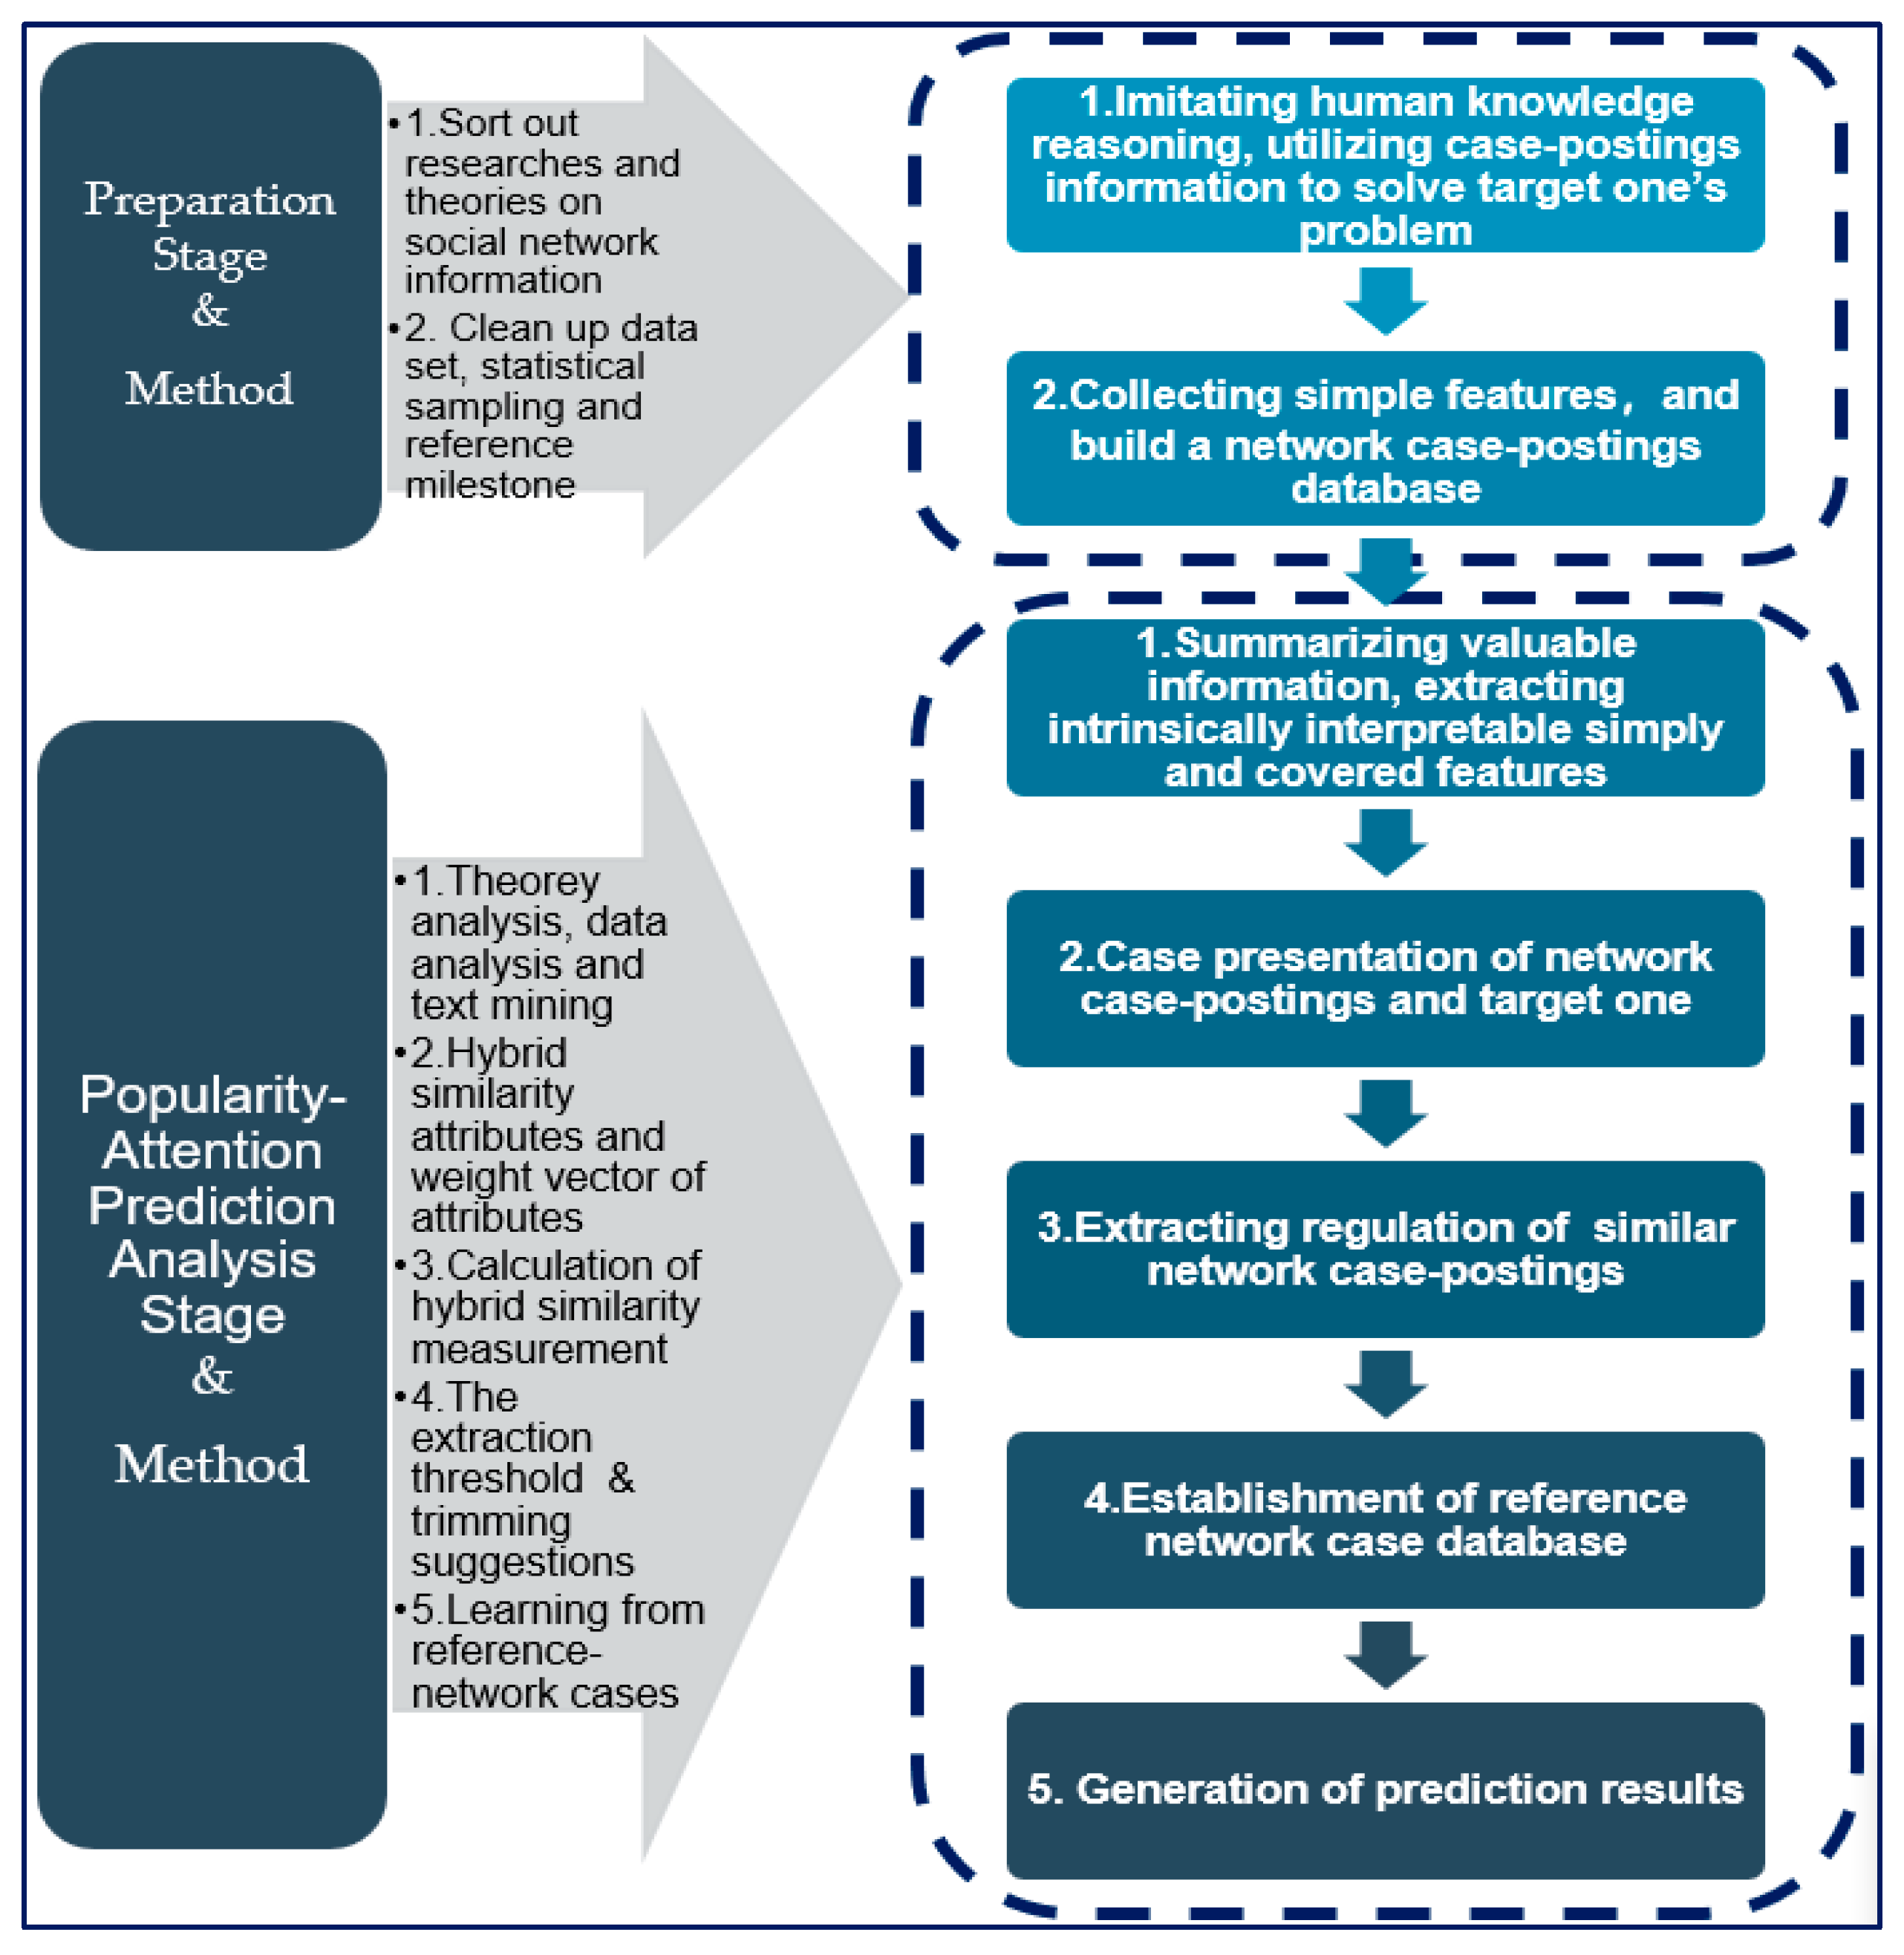
All of the above make network data noisy, hard to quantify, and difficult to extract directly from the Web. It is a challenge to extract valuable information from noisy network data and convert it to a set of quantifiable features or usable attribute features. According to the above challenges, this paper proposes a CBR method for the popularity prediction of community postings, which is suitable for the social network environment, as follows:
- (1)
Sort out the existing research and theories on information sharing and dissemination of social media. From the perspective of the AI domain imitating human knowledge reasoning, we explore the utilization of information of case-posting in the network community to solve the problem of the target one.
- (2)
Clean up and preprocess the net data packages and collect directly observable information features (hereinafter referred to as simple features) to prepare for the subsequent qualitative and quantitative work.
- (3)
Build a network case-postings database using statistical sampling combined with the reference milestone method.
- (4)
Summarize and discuss valuable information about the popularity of postings in the online community.
- (5)
Extract intrinsically interpretable features from internet information, including simple features and information features (covered features), which require data analysis and text mining technology, hereinafter referred to as covered features. Convert those features into attribute characteristics or hybrid attribute features of different data types, such as clear numbers, interval numbers, and fuzzy language variables.
- (6)
Case presentation of historical network case postings and the target posting.
- (7)
Calculation of the hybrid similarity measure under each attribute feature represented by different types of data between online case-postings and the target-posting, and calculation of overall hybrid similarity between cases.
- (8)
Setting the extraction threshold of similar network case postings, trimming suggestions of extreme network postings, and establishing a reference network case database.
- (9)
Generation of prediction results.
As shown in
Figure 1, the left part of the framework is related to theoretical methods, and the right part of the frame is the specific process. The research framework consists of two parts: the preparation phase and the analysis phase to predict the popularity attention of the target posting.
Exploratory work of this paper: we propose a CBR method for posting popularity predictions in social networks (hereinafter referred to as CBR & AM). Compared with the previous methods, this paper explores it from the perspective of the AI domain, imitating human knowledge reasoning and making full use of the historical case information and experience in the social network to solve the target objects’ problem. Empirical research of the online automobile community and calculation results of examples show that the CBR approach has unique advantages in solving problems related to social network information, especially when dealing with noisy data in social networks. Based on various attribute features of different types of data, such as clear numbers, interval numbers, fuzzy language variables, and clear symbols, it is convenient for network information with complex construction to represent, in the form of the case, as well as hybrid similarity calculations between cases, etc. The hybrid similarity calculation and case-formalization of network information are very helpful for retrieving and extracting historical cases with a practical reference value from massive network information. The outstanding case representation and the concise algorithm will effectively support decision makers to find more reasonable solutions to current problems by fully drawing on historical experience and knowledge.
On the other hand, compared with the existing CBR methods, from the perspective of promoting the application of the CBR approach, this paper provides an idea of how to summarize useful information to deal with target problems from overwhelming and complex information. Furthermore, the interpretable features are mined from high-dimensional data with complex structures and utilized to construct a case-representation system, not just the features suitable for constructing a case system. Specifically, based on the theory and research of social networks, useful information would be successfully distinguished from the huge and noisy online data. Then, meaningful information is converted into a set of quantifiable features (including simple features and covered features) with the help of computer data mining and text analysis technology. Faced with the complex and changeable community environment, a network case-postings database suitable for the dynamic internet environment is constructed based on statistical sampling combined with milestones. Furthermore, we provide a new CBR-extraction rule based on typical case extraction regulations to reduce the special influence caused by “network effects” (mentioned above), which could be more helpful for selecting from network cases. Then, suggestions are offered for how many extreme case postings should be trimmed appropriately. All the above work helps to expand the application scenarios of the CBR approach, especially in the network environment. It greatly improves the algorithm quality and efficiency of the CBR approach.
2.3. Introduction of Background and Data Mining Analysis
2.3.1. Introduction of Background
The data package of more than 300,000 original records is taken as the research sample from the Magotan-Automobile social community in 2016 (1 January 2016 to 30 December 2016), website:
https://club.autohome.com.cn/bbs/forum-c-496-1.html (accessed on 30 July 2022), and as of 30 December, the registered users of the Magotan-Automobile social community were about 100,000. This automobile network community is a Chinese online social community where users communicate, share, and spread information by creating postings, replying to postings, and clicking and browsing postings, similar to Facebook status updates or tweets on Twitter. The sample data package is obtained from individual postings, and each main posting could be regarded as an independent event.
The sample data package was cleaned up and transformed, resulting in a dataset of more than 27,000 posting records, from which we could directly obtain: (1) Simple features, such as user registered name (referred to as Username, abbreviated as US), number of user postings (Posting_number, PN), number of user responses to others (Reply-to_number, RT), number of user postings recommended by the community (Recommendation Postings_number, RE), user registration time (Member Time, MT), the time when the user published the posting (Posting Time, PT), the number of posting hits (Posting-Hit_number, PH), the number of replies to the posting (Posting-Reply_number, PR). (2) High-dimensional and variable length data, e.g., posting title text corpus (Posting-Title Corpus, TC), posting body text corpus (Posting-Body Corpus, BC).
Wu et al. [
46] point out that the influence of social networks is related to many factors, which can only be reflected through the interaction between people. Network users make contact by publishing postings, sharing information, offering comments, and other means, and it is generally accepted that influence is linked to the dissemination of opinions. Different forms of social media influence have different manifestations. Hu et al. [
5] put forward that users tend to watch videos with a large number of hits and browse postings that everyone likes to browse, which reflects social influence. Then, the information dissemination effect of video media can be measured by the amount of video viewing. For Sina Weibo, the popularity of Weibo is the sum of forwarding volume and replies. For postings from Tianya Forum, the number of replies to a posting is a measure of popularity. Based on the online automobile community background and sample dataset, the more the popularity or obtained attention of a posting in the community, the more clicks and replies to the posting, which means the influence of the posting is greater. Therefore, popularity (hereinafter referred to as attention) is understood as the sum of PH (the number of hits) and PR (the number of replies) of the posting, which can be used to measure the communication influence of a posting in the community; thus, the popularity of a posting in the community is named as Postings_attention (PA), which is defined as follows:
2.3.2. Construction of Network Post Cases Database
Based on the reasoning thinking of the CBR approach, with the help of referring to the attention of similar historical postings in the network community, we try to evaluate the amount of attention to the target posting. However, the amount of attention to a posting can vary greatly over time. The vast majority of online postings will generally experience a period of browsing and replying until almost no one pays attention, and only a very few postings can maintain the ability to gain attention over time. Based on Twitter research, F. Riquelme et al. recognize the influence change of “specific topics” understood as “trend topics”; it is important to note that the trending topics do not last forever, nor disappear to never return [
17]. The empirical results showed that the influence of topics changes over time; it was found that 73% of the trending topics were only one day long, 15% lasted two days, and 5% three days, but some isolated cases of topics remained intermittent for more than 10 days and even longer [
17]. Moreover, D. Henry et al. studied the information dissemination of the media, determining that the mechanism of communities to which a user belongs encourages information to reach volume peaks between 30 and 40-day intervals [
15]. Therefore, the feature of Posting Time (PT) that is more than 45 days is taken as a milestone for reference in the paper. The measure of the milestone that we proposed is based on the relatively stable network state of the reference object at that time.
Furthermore, the scale of network data is huge, and only a one-year scale of network data is collected as the sample set. There are still tens of thousands of records after the sample dataset is cleaned and preprocessed. The statistical sampling method will be combined to economically and efficiently construct the network case database. To ensure that the sampled records are sufficiently representative, the sampling method of stratified sampling (also known as type sampling) is adopted, which is one of the most common sampling techniques utilized in practical work. Before sampling, the N sampling units of the population are divided into k layers (classes) according to a certain mark and then conducted random sampling independently in each layer. The samples drawn in this way are called stratified sampling. Stratified sampling can make full use of the information about the population for stratification. Its sampling effect is usually better than simple random sampling, and its representativeness is also better, which can improve the accuracy of estimators [
47]. To sum up, the process of building a network-posting case database is as follows:
- (1)
Let P represent the dataset of more than 27,000 posting records from the network community. The records of
P are divided into 12 groups according to the month of the records posting time, then:
- (2)
Random sampling was carried out in each group
. Each group sampled
n = 100 records and finally obtained a sample dataset with a total sample of 1200 records. The sample dataset name
Pyear is as follows:
To meet expectations and effectiveness, the qualified sample size should reach 400 [
48]. For community or national research with a single theme, it is recommended to select 400 to 2500 samples. Ren [
49] point out that for community or national research with a single theme, it is recommended to select 400 to 2500 samples.
- (3)
The postings that have been published for more than 45 days are extracted from as the network posting cases database, and the number of postings in the network posting cases database is named as :
Let represent the network posting cases database, , , where represents the nth posting record.
Let C represent the text corpus set of , there is , satisfying , and the corresponding posting-title text corpus set is TC satisfying , the corresponding posting-body text corpus set is BC satisfying ; thus, C is the combination of TC and BC.
Let
represent the total number of entries after the word segmentation of
C, there is
,
, satisfying
, where
is the corresponding number of entries after word segmentation of
TC, and
is the corresponding number of entries after word segmentation of
BC, then satisfying:
Let
represents the total number of professional terms after word segmentation of
C, there is
,
, satisfying
, where
is the corresponding number of professional terms after word segmentation of
TC, and
is the corresponding number of professional terms after word segmentation of
BC, then satisfying:
2.3.3. Attribute Features Extraction Based on Data Mining Technology
Communication of the online automobile community is mainly in written form rather than face-to-face sharing. The characteristics of postings of the online community are filled with freeness and personalization. The corpus text of postings is characterized by colloquial language, which often contains a lot of unlisted words such as regional dialects, networks, or popular social terms. According to the professional background and brand characteristics of the Magotan-Automobile online community, the community postings contain a large number of car brand appellations or abbreviations and professional terms of the automobile industry. Therefore, there is a huge demand for correctly identifying professional terms and unlisted words. Moreover, some empirical researchers have extracted information features such as theme, emotion, length, and expressions from the dataset of social media such as Twitter. The empirical results show that these features are of remarkable value for related research [
21,
22], exploring how to use computer algorithms to extract information [
50,
51].
Text mining or “knowledge discovery” refers to the process of extracting useful, meaningful, and important information from unstructured text [
52]. Text-mining technology originated in the computer science literature to derive insights from user-generated content. Moreover, advances in computer natural language technology and the maturity of text mining technology have enabled researchers to mine intrinsically interpretable information from the overwhelming user-generated written content on the web [
52,
53,
54]. Even simple language processing or textual analysis programs (e.g., professional word statistics and word count) can conduct objective quantitative research on large corpora of written content, then mined information will be converted into a set of quantifiable attributes or similarity features between postings. After analyzing and mining a large amount of user-generated written information, it is possible to pull insights into users’ thoughts or shed light on a host of psychological processes and know about the users’ knowledge boundaries to a certain extent [
55,
56,
57].
Therefore, this chapter will use data analysis and text mining technology to analyze the network datasets and provide more approaches and opportunities for studying network information. Based on Python 3.7, this paper develops a data mining program with data processing, text mining, and word statistics functions for the Chinese automobile professional community. Python is an open source software and invented by van Rossum G at the end of 1989, and its developer is the Python Software Foundation (Wilmington, DE, USA). Python has rich standard libraries and also supports calling various powerful third-party libraries (such as “Chinese Stop Thesaurus”, “Automotive Specialty Thesaurus”, etc.) [
58].
(1) Preprocessing of the original corpus. There are a large number of meaningless words on the Internet, which search engines have considered unnecessary stop words [
59], such as punctuation marks “//, (),
$”, or mood auxiliary words and turning connectives “of, yet, hey, still, or)”. Therefore, before starting the data analysis, the “Chinese Stop Thesaurus” constructed in this paper is needed to filter and delete meaningless words, punctuation marks, and symbol patterns to obtain a plain text corpus dataset, which is convenient to improve the accuracy and applicability of text word segmentation and semantic analysis.
(2) Text corpus word segmentation processing. In processing Chinese Web text information, such as information retrieval, information extraction, and the establishment of Library and information keywords, word segmentation is required for text information [
60,
61]. This third-party word segmentation library jieba is called to segment the text. The basic library of the jieba thesaurus has rich entries. The dynamic programming method is adopted to find the maximum probability path, and the maximum segmentation combination based on word frequency is found. It uses the Viterbi algorithm and HMM model for unlisted words based on Chinese character-forming ability [
62]. Jieba also supports the custom dictionary. We customize the “Magotan Automobile-Profession Thesaurus”, which includes terms related to the automotive industry and disciplines, such as gearbox, wheel hub, airbag, decorative light, and reversing, and including the brand models, car configuration, and nicknames of the Magotan series that often appear in the context of the Magotan Automobile-community, such as Magotan, Magotan B8, b7, B8330 noble, Caesar Gold, Dynaudio. Moreover, we construct the “Auto-community User Thesaurus”, which adds hot words and buzzwords from the online community based on the “Magotan Automobile-Profession Thesaurus”, such as UAE Grand Prix, one-day tour, and travel strategy. After loading the customized “Auto-community User Thesaurus” and “Magotan Automobile-Profession Thesaurus”, the program can not only effectively deal with ambiguous words and unlisted words, but also greatly improve the accuracy of word segmentation and recognition efficiency.
(3) Statistics. Automatically count the length of the original text corpus, the length after data analysis, and the total number of words of the text corpus after word segmentation. Then, call “Magotan Automobile-Profession Thesaurus” to identify the automotive and industry-related professional words in the text automatically and count the number of professional words. See
Table 1 and Postings—Title Corpus with punctuation and spaces. Text length is measured in bytes.
(4) Frequency analysis. In this paper, the frequency of entries of the posting text corpus (i.e., Postings—Title Corpus and Postings-Body Corpus) is counted. Please refer to
Appendix A for the word frequency analysis results. In
Appendix A, the frequency proportion (%) is the proportion of the occurrence times of the entry in all entries. The higher the proportion, the more times the entry appears in the entire corpus. If the entry belongs to the vocabulary of “Magotan Automobile-Profession Thesaurus”, then
Y/N = 1, otherwise,
Y/N = 0. Rank the top 30 high-frequency words in descending order, and the word frequency of the last ranked feature words converges to 1. ① From the perspective of the top 30 high-frequency words, taking “Magotan” as an example, “Magotan” accounts for 34% of the total number of words in the title entries, and the top 30 words in the title entries account for 76.6% of the total number of words in the title entries. Among them, the top 30 words in the body entries account for 58.1% of the total number of words in the body entries, and the top 30 high-frequency words account for more than 50% of the total number of words in the title entries and the body entries. ② The first-ranked and second-ranked entries in the title and body entries are highly consistent, which are “Maggotan” and “pick up the car”. “Maggotan” is the first-ranked, accounting for 34% of the title entries and 11.9% of the body entries. The second-ranked entry “pick up the car” is also closely related to “Maggotan”, which indicates that the topics related to “Maggotan” are highly recognizable in the community. User perception of the community theme is consistent with the image cognition setting by the community. From the side, it also reflects that the information in the community is always closely related to the community topic.
To sum up, the data analysis and text mining process are shown in
Figure 2. After traversing each posting, the program could filter and segment the text corpus, automatically calculate the text length, count the number of entries, and extract customized professional entries. The postings after the program processing are shown in
Table 1.
2.4. Attribute Features Analysis of the Posting Popularity
As mentioned in the introduction, scholars have carried out a lot of theoretical exploration and empirical research of social network information. Combined with the existing research results and the work of data analysis and text mining in
Section 3.2.2, we will summarize valuable information about posting popularity in online communities and extract interpretable attribute features from summarized information.
(1) Member since (MS). The registered member duration MS (unit: day) is the time difference between the user registration time (MT) and the sample collection time on 30 December 2016. The earlier a user becomes a member, the more senior the user is, which indicates that the user has been involved in activities of the community for a longer time and gets more chances to join in cognitive processes that can transform into beneficial information. Albert and Thomas [
63] point out that people engage in brand communities to connect with like-minded others. Furthermore, previous studies [
64,
65,
66] have indicated that social media affordances significantly influence user behavior and usage, and those with an old account are more likely to rebroadcast information than users with a recent account [
15]. Agichtein et al. [
50] utilized the length of user registration time as one of the characteristic indicators when establishing the model. Wasko and Faraj [
67] believed that the length of time an individual becomes a member of a professional association represents their professional experience in the industry, and the level of personal expertise could be assessed (from novice = 1 to expert = 5) by their expertise score in the area.
To sum up, we evaluate the user’s community experience level according to the length of registered members (from novice members = 0–6 months, junior members = 6–18 months, intermediate members = 18–36 months, senior members = 36–60 months, diamond members more than 60 months).
(2) Recommended Postings_number (RP). According to the community institutions of the Maggotan-Automobile online community, if the user’s postings are judged by the community to meet the standards of essence postings: original content, smooth sentences, and clear logic, they will be honored as “essence”. High-quality (beneficial) things might be easier to discuss and attract more users [
66]. From the perspective of motivation, Lee and Suzuki [
6] confirmed that reputation is one of the motivations for information sharing. However, valuable contributions can improve users’ reputations in the industry [
67]. Henry et al. [
15] observe, for instance, that on Twitter, celebrities receive more messages posted by others. Many other relevant studies have adopted the characteristics of similar honors or diamonds as research indicators [
51,
68,
69].
According to the community’s certification standards of “Recommended Postings”, it not only requires the positive performance of members in the community, but also puts forward requirements for the content quality and writing specifications of postings. In fact, postings that could be recommended as “Recommended Postings” account for a very small percentage of the total number of postings. The proportion of “Recommended Postings” in the sample set of this research accounts for about 2.59%. Other studies have also shown a similar situation. For example, Agarwal et al. [
70] counted the influential articles on blog sites in empirical research, and such articles accounted for only 4.1% of all articles. From the perspective of user groups, the majority of users obtained the number of “Recommended Postings” is 0, accounting for about 87.8% of the total. Users who have the experience of the “Recommended Postings” also showed a significant trend of centralization. Therefore, there is no actual interpretive significance of the real situation by directly utilizing the number of “Recommended Postings” as an attribute feature. Referring to the above method of evaluating user’s community experience, we evaluate the community honor level of users according to the number of “Recommended Postings” that have been obtained (from ordinary members = 0, Junior Elite = 1–2, Intermediate Elite = 3–5, Senior Elite = 6–19, Diamond Member more than 60 months).
(3) Posting_number (PN). Posting means sharing information or communicating actively, indicating that users are strongly willing to participate in community communication. Jonah [
14] pointed out that similar behaviors above will promote the acquisition of information, and talking and sharing with others serves a bonding function [
71]. Moreover, users who pay more attention to their personal social influence (such as reputation) are more inclined to actively publish their opinions. Posting opinions is an effective way to gain attention, expand influence, and improve their status. Lee and Suzuki [
6] showed that the amount of one’s information shared a month ago increases by one unit, and the probability of information sharing and inquiry increase by 5% and 1%, respectively. Yang et al. [
72] and Jonah [
14] pointed out that sharing (posting) is one of the factors to measure opinion leaders, and the source of information is closely related to popularity [
5].
(4) Reply-to_number (RT). Replying to others’ postings is (users) interaction behaviors about the information posted by others. More responses to others’ postings mean that users pay more attention and effort to others. It is a reciprocal behavior that is important in promoting information exchange [
6]. Furthermore, users’ active participation in community interaction activities will increase their social presence in the community and increase their self-enhancement concerns. When users publish postings, this may seduce them into feeling they are not writing just to themselves but writing online for everyone to see [
14]. The replying behavior also reflects the user’s interaction attribute features. Li et al. [
4] regarded the interactive attribute features or interaction relationships of users as the reference for discovering network opinion leaders. Other relevant researchers also take the interactive attribute feature as one of the characteristics of building models [
5,
50,
51,
72].
(5) Activity_Frequency (AF). With the increase in user behaviors in online communities, the connection between the user and others will be closer. Thus, the users have a certain influence on others. Li et al. [
64] point out that the frequency of users’ posting is correlated with their influence on social media after summarizing the number of users’ monthly posts. Through the observation of Twitter, some features of users, such as activity degree, affect the message diffusion in terms of volume and speed. Messages posted by highly active users spread more quickly than other users [
15,
46]. Ozer et al. [
19] discovered patterns of online popularity with the Twitter dataset. The pattern of the steady temporal behaviors is popular (the group of persons who show steady periodic activities is the cluster of popularity). Adrien et al. [
73] considered social interaction frequency to detect popular topics the members produce. Other relevant researchers utilize interaction frequency (or activity degree), and user interaction attributes as the characteristics of the information dissemination model and the algorithm for mining the opinion leaders [
74].
Based on this research background and the above researchers’ work, “Activity_Frequency” is understood as the users’ frequency of interaction-activity in the community of registered members. Activity_Frequency is defined as follows:
(6) Length_Corpus (LC). “Rich” information can often get more attention in network information competition. The richness of information is one of the indicators to evaluate the influence of online media [
72]. Hu et al. [
5] point out that the length of a blog is positively related to its persuasiveness and its popularity. Hnings et al. [
21] regarded corpus length as one of the characteristics that significantly influenced Tweet diffusion. The length of a tweet is positively correlated with the information diffusion value. Moreover, from the perspective of perception, when a posting contains a large amount of information (i.e., long length), it can effectively improve contextual certainty, which helps users extract the main point of information and disseminate information. Jeon et al. [
68] proved that text length and vocabulary size are positively correlated with the information load and susceptibility, and Korfiatis et al. [
75] found that online review length was not only positively correlated but also significantly affected the perceived usefulness of a review. Based on the previous data mining work, the length of the original corpus of the post title is successfully obtained, and the feature is named Length_Title (LT) (unit: Bytes). The length of the original corpus of the post-body is named Length_body (LB) (unit: Bytes).
(7) Richness Performance_Title (RPT). Stefan et al. [
76] understand content richness as how much information is available. Content richness is regarded as one standard of information services related to media-for-monitoring or media-for-searching. In the propagation model, high-quality content highly correlates with external links [
68]. Practically, useful content has social exchange value. Empirical evidence also suggests that useful information is more likely to be passed on, which could be shared because it makes the sharer seem smart and helpful [
14,
56]. Moreover, written content generated by users is also a primary resource for analyzing users’ writing styles and abilities. Empirical research on online product reviews shows that a review might be received by interested buyers, which is associated with its readability [
75]. Agichtein et al. [
69] analyze the text of large community Q&A portals. The web text uses too many punctuation marks or irregular arrangement spacing, which will be marked as low-quality text, just like common low-quality practice writing text. Wang et al. [
77] studied Chinese online written text and found that word ratio could reflect whether there are spelling errors and grammatical problems in writing, and empirical evidence shows the level of writing expression will impact the credibility and authority of opinion leaders.
According to the interface layout of the auto-community, the postings are arranged and displayed in the form of titles. Therefore, including the information carried by postings, the title of postings also has the function of guiding the community information (similar to the hashtag in the hot search). The quality of the posting title content would play a more critical role in its gains. Based on the word ratio of Chinese online written text [
77] and the understanding of Content richness [
76], the Richness Performance_Title (RPT) is understood to be the proportion of useful information in the title original corpus. The length of the title’s useful information is named length_TitleContent (LTC) (unit: Bytes), and the length of the title original corpus is LT (unit: Bytes) (See
Table 1). Thus, “Richness Performance_Title (RPT)” is defined as follows:
(8) Posting Topic_Centrality (PTC). Generally, users’ actual knowledge often does not match their expected level. When faced with complex or professional products, people usually tend to accept suggestions from experts. Opinion leaders in network media not only have professional knowledge, but the content they publish is always adapted to their online environment [
64,
72]. Analyzing the term frequency from the content of messages produced by online members is one of the ways to detect popular topics. The hashtag in generated content is one of the key features affecting information dissemination and building prediction models [
73,
74]. Furthermore, in automobile-themed communities, auto-related content has a significant influence on the dissemination and popularity of information. On the individual level, one reason people engage in brand communities is to connect with like-minded others. The prevalence of different topics varied with the surroundings, e.g., food was always discussed in restaurants [
14,
15,
22]. After studying the information search [
21], it was found that in a given situation, corresponding issues and particular keywords are more resonant and attractive in society as a whole, and the more particular words in media coverage, the more users will search for corresponding content (similar to push-cueing).
According to the data-mining work in
Section 3.2.2, 80.0% of the top 30 high-frequency words in the title entries of the posting were identified as the professional entries of the Magotan Auto community, and the proportion of the body entries of postings is 70.0%. Berger and Milkman [
56] quantified emotionality as the percentage of words classified as either positive or negative in an article. Based on this research background and the above research results, the more particular entries related to the Magotan Auto community and the automobile industry, the more corresponding information the posting carries, and the more resonant to the given posting environment. On the single posting level, the higher the proportion of particular entries related to the given background, the closer the posting is related to the popular topics in the community, which means the posting has more chance of gaining eyeballs and becoming more popular in the community. Thus, the posting title of Topic_Centrality named “Title Topic_Centrality” (TTC) and the posting body of Topic_Centrality named “Body Topic_Centrality” (BTC) are defined as follows:
To sum up, through the above theoretical analysis, we successfully pick the attribute features that can explain the popularity of online community postings. Some of the attribute features can be obtained directly, which are referred to as simple attribute features. The others need to conduct quantificational calculations combined with data-mining technology, which is referred to as covered attribute features. All attribute features are shown in
Table 2 below. Linguistic terms of fuzzy linguistic variables and their corresponding triangular fuzzy numbers are shown in
Table 3 below.
3. Construction of Network Posting Cases Characteristic System
3.1. Case Presentation of Network Posting Cases and the Target Posting
According to
Table 2, a set of intrinsically interpretable attributes A
1–A
10 have been successfully extracted from the network data package. In the CBR-based approach, the network post cases are presented as “Case = {Network posting cases-description, Popularity of network case postings}.”
Case: according to the above section, there is , and respectively represent the set of the network post cases and the target posting, where represents the nth posting case, . The popularity of the target posting is unknown, which needs to be solved by the proposed method.
It should be noted that when building the network case posting database in
Section 2.3.2, a Posting_Time (PT) of more than 45 days is taken as a reference milestone (milestone ≥ 45 days). Therefore, the popularity of the target case is described as how much revenue the target posting will gain after publishing more than 45 days.
Network posting cases-description: Let , , be the collection of the attribute features of network case-postings, community case-postings, and the target posting, where , , , respectively, represent the mth attribute of network posting-cases, community case-postings, and the target posting, . Let be the weight vector of the attribute features of network case postings, where is the weight of the mth attribute feature of network posting cases.
Moreover, the attribute values of the target posting and the attribute of community posting cases can be described with fuzzy linguistic variables and crisp numbers. Thus, in order to distinguish subsets of two kinds of data types of the attribute set of the network case postings: let the fuzzy linguistic variable attribute set be and crisp number attribute set be , respectively, the corresponding subscript sets are , , satisfying .
The popularity of network case postings: According to Formula (1), the popularity of a posting in the community is defined as Postings_attention (PA), which is crisp numbers (milestone ≥ 45 days). Let be the PA of network case-postings, where represents the nth PA of the network case-posting, represents the PA of the target posting, which should be forecasted in the research.
Thus, the representation of the network posting cases
and the target posting
is shown in
Table 4.
3.2. Extraction of Similar Network Posting Cases
3.2.1. Hybrid Similarity Measure between the Network Posting Cases and the Target Posting
According to
Table 2, the values of attributes (
A1–
A10) are composed of crisp numbers and fuzzy linguistic variables. Referring to the hybrid similarity calculation method of the attribute feature value introduced by Zhang et al. [
37], the hybrid similarity measures of the network case posting and the target posting in this paper are as follows:
(1) Fuzzy linguistic variables
According to the previous definition and
Table 3 and
Table 4, when the attribute feature values are fuzzy linguistic variables,
. Suppose that
respectively are the attribute feature values of the network posting cases
, and the target posting
, where the corresponding fuzzy triangular numbers of
are
,
, respectively. If Formulas (6) and (7) from Zhang et al. [
37] are referred to, then the different degree
between
and the target post
is as follows:
where
,
. Under attribute
, similarity measure
is:
(2) Crisp numbers
According to the previous definition and
Table 3 and
Table 4, when the attribute feature values are crisp numbers,
. Suppose that
respectively are the attribute feature values of the network posting cases
, and the target posting
represented by the crisp number. If Formulas (2) and (3) from Zhang et al. [
37] are referred to, then the different degree
between
and the target posting
is as follows:
where
,
. Under attribute
, the similarity measure
is:
(3) The hybrid similarity measure between the network posting cases and the target posting
According to the above Equations (10)–(13), the similarity measure
of attribute
between the network posting cases
and the target posting
can be obtained, satisfying
. Based on the weighted KNN strategy [
25], the overall similarity measure between two cases is defined as the weighted sum of the similarity measure of each attribute feature.
Suppose that
is the hybrid similarity measure between the network posting cases
and the target posting
. Thus, the calculation formula of the hybrid similarity measure is as follows:
where satisfying
, and
. Obviously,
and the larger the value of
, the higher the overall similarity between
and the target posting
.
3.2.2. Extracting Rules of Similar Network Posting Cases
(1) Setting similarity threshold between the network posting cases and the target one
According to the hybrid similarity measure between cases, similar community postings can be extracted. For a specific network posting, the larger the value of the mixed similarity measure between it and the target posting, the higher its referential value to the target one. For the target posting, the smaller the value of the hybrid similarity measure, the more historical cases might be drawn.
Therefore, it is necessary to set a reasonable hybrid similarity threshold to obtain a group of appropriate similar case-postings from the large-scale database efficiently. Zhang et al. [
37] introduced the similarity threshold based on the simple minority principle. The simple minority principle believes that the few cases with the highest similarity (about 1/3 of the highest similarity) have a strong reference value. Let
τ be the similarity threshold. If Formula (9) from Zhang et al. [
37] is referred to, then the calculation formula of
is defined as follows:
where
,
.
(2) Extraction of Similar Network Posting Cases
When
, it means that the group of community postings has a high similarity with the target posting, which has a high value of reference. Thus, such a group of community postings should be extracted as case postings. On the basis of the principle and Formula (15), all the network posting cases
greater than or equal to the similarity threshold
are extracted, and set
of the above extracted cases is constructed as follows:
where
,
being the subscript set of similar network posting cases providing a worthy value of reference. Then,
,
, where
represents the
ith of
,
.
(3) Trimming suggestions of extreme network posting cases
Empirical research on social networks shows that about 4.1% of articles on blog sites can obtain the vast majority of attention on the website [
70], information dissemination in social networks is unequal, and there is a Matthew effect in the process of dissemination [
16]. Similarly, when analyzing the community sample data package, we find that about 2.59% of postings in the auto community are not only recognized by the community but also successfully gained a lot of attention. Such a situation may be related to the institutional construction of the auto community. Postings recognized by the community might often be placed in the most prominent position on the community page, or they are strongly “recommended” to users by the community, so they have more chances to gain attention.
According to the actual application scenarios, relevant researchers have adopted experts’ opinions as the basis for judging the similarity threshold [
25,
78]. Combined with the auto community’s research background and sample data, we propose trimming suggestions for extreme online cases. Suppose the number of recommended trimming extreme cases of one end is
(one end: extreme obtained attention, or extreme lack of attention due to network effects), which is defined as follows:
where
, and
is an empirical parameter.
(4) Formation of referring similar posting cases dataset
In accordance with
Table 2 and
Table 4, the corresponding attention of
is
, thus the corresponding attention of
is
. According to the value of
from big to small, sort the set
again to obtain a new set. Let such new set be
,
, where
represents the n
th item of the set
, abbreviated as
y(
n), satisfying
y(
n) >
y(
n + 1), where the corresponding posting of
y(
n) is
P(
n). Let the set
be sorted in the order of the items of
P(
n), satisfying the n
th item of
P(
n) before the (
n + 1)th item. In this way, a new set
is constructed as
, where the trimming number is
according to Formula (17). Suppose the set of similar posting cases is
, which is constructed as follows:
where
,
being the subscript set of
, which is sorted in the order of value of corresponding
after extreme postings of two ends trimmed.
3.3. Generation of Forecast Results for Popularity
Although the information in the network community changes in real-time, the reference milestone (≥45 days) has been adopted, by which the community postings chosen could be considered in a relatively stable online state (i.e., the number of clicks and replies of the posting is relatively stable), some isolated network postings that continue to receive additional gains due to special situations will be trimmed as extreme cases. Feng et al. [
78] studied the project cost estimation based on the CBR method and finally estimated the experimental case cost by taking the average cost of the three most similar historical cases as the fuzzy reasoning prediction value. Referring to this method and Equations (16)–(18), suppose the corresponding attention of
is
. Thus, the calculation formula provided as the attention prediction of the target posting is as follows:
where
.
To sum up, the analysis process of popularity prediction based on the CBR approach is as follows:
Step 1: Referring to
Table 2,
Table 3 and
Table 4, based on the hybrid similarity attributes value of fuzzy linguistic variables and Crisp numbers, the network posting cases
and the target posting
are presented in cases.
Step 2: According to
Table 3 and Formulas (10)–(13), calculate the similarity measure
of each attribute
between the network posting cases and the target posting.
Step 3: According to Formula (14), calculate the hybrid similarity measure between the network posting cases and the target posting.
Step 4: According to Formulas (15) and (16), set the similarity threshold τ between the network posting cases and the target one, determine the extraction rules of similar network case postings, and form a similar case posting database .
Step 5: According to Formulas (17) and (18) construct a similar posting case with more reference significance for the social network environment. Propose trimming suggestions for extreme online postings, clarify the number of extreme online postings trimmed of one end , determine the trimming rules for extreme postings, and form the similar posting-cased based on the similar case posting database in the above step.
Step 6: In accordance with Formula (19), the mean value of the attention obtained by postings is taken as the expected forecast result of the popularity of (milestone ≥ 45 days).
4. Case Study
Step (1): According to
Section 2.3.2, a sample database P of the network auto-community is constructed, and the number of sample records of database
P is 1200. Based on the reference milestone (≥45 days), the postings published for more than 45 days were extracted from database
P to form a new database, which is named the network posting cases
PCBR. The number of samples of
PCBR is recorded as
n45, in this example
n45 = 487. The descriptive statistics of database
P and the network posting cases
PCBR are shown in
Table 5 below.
In
Table 5, the maximum value of PA of database
P is 545,372, the minimum value is 49, and the average value is 3803.68, which shows the existence of extreme cases in the network situation. Moreover, the minimum PA value of database
P and PA’s value of the network posting cases
PCBR are 49 and 68, respectively, which are very close, indicating that it is suitable for the posting to take 45 days as the reference milestone for its stable network state.
Based on the work of
Section 2.3, a set of intrinsically interpretable attributes A
1–A
10 has been successfully extracted, and their corresponding meanings, data type, and each property in this paper, which are all shown in
Table 2, along with linguistic terms of fuzzy linguistic variables are shown in
Table 3. However, in light of the theoretical and empirical research results, there are no differences between each attribute in explaining attention. Therefore, the weight vector of network case posting attributes based on the popularity is set as
. Let the target posting be
P01, and Attributes
Am are normalized, variable
Y represents the PA (Postings_attention) of the posting. Then, the information on the attributes of the network posting cases
PnCBR, the target posting
P01, and
Y are shown in
Table 6.
Step (2): According to
Table 3 and Formulas (10)–(13), the similarity measure
of each attribute between the network posting cases
PCBRn and the target posting
P01 can be calculated and using Formula (14), we can calculate the hybrid similarity measure
sim(
P0,
PCBRn) between
PCBRn and the target posting
P01. Then, a new database of network postings named
Pτ is created that has sorted order from big to small by the value of
sim(
PCBRn,
P01). The information of
Piτ, the value of
sim (
Piτ,
P01), and the value of the corresponding variable
Y are all shown in
Table 7.
Step (3): According to Equations (15) and (16), calculate the similarity threshold
τ between the network posting cases and the target one,
τ = 0.870 of this example.
As shown in
Table 7, the max value of the hybrid similarity measure
sim(
Piτ,
P01) between
Piτ and the target posting
P01,
sim (
Pτ1,
P01) = 0.993, the min is
sim(
Pτ487,
P01) = 0.624.
Guided by extracting rules and the similarity threshold τ, all the network postings of Piτ whose corresponding value of sim (Piτ, P01) is greater than or equal to should be extracted, forming a similar case posting database. Thus, until posting case Pτ375, of which the sim (Pτ375, P01) is equal to 0.870, all previous posting cases Pτ1–Pτ375 meet the extraction requirements of this example. In this way, the network posting cases Pτ1–Pτ375 are successfully extracted and form a similar case postings database with vital reference significance; let the similar case postings database be , . Where Nτ = 375 of this example according to Equation (16).
Figure 3 shows the frequency distribution of the value of
sim(
Piτ,
P01) between the network posting cases
PCBR of 487 records and
P01, and the value of
sim(
Piτ,
P01) ranges from 0.993 to 0.624. The
y-axis is the corresponding number of posting cases for each interval value of
sim(
Piτ,
P01). As shown in
Figure 3, there are 375 posting cases that satisfy the conditions of extracting rules and the similarity threshold
τ.
Step (4): According to step (3), a similar case posting database
of this example has been obtained. Using Equation (17), the number of extreme cases of unilateral trimming
Ne = int (
μNτ). Based on the data mining analysis of this research sample collection and the relevant empirical research mentioned above,
μ = 2%, then
Ne = 7 of this example. Using Equation (18) and following the trimming suggestions of extreme online cases, let the set
be sorted in the order of the corresponding value of
Y from big to small; in this way, a new set
could be formed. Due to
Ne = 7, the recommended trimming of extreme cases of one end are
, another end of the trimmed cases is
. The attributes of the trimmed posting cases, the corresponding value of
sim (
Pnrank,
P01), and the corresponding value of
Y are all shown in
Table 8.
As shown in
Table 8, the hybrid similarity measure
sim(
Pnrank,
P01) between the trimmed posting cases and the target posting
P01 ranges from 0.974 to 0.872. Although the hybrid similarity measure
sim(
Pnrank,
P01) between the above cases all meet the extracting rules (≥
τ 0.87), where the largest value of corresponding
Y of the trimmed posting cases (hereinafter referred to as
Y(rank
n))
Y(rank1) = 545,372, the minimum is
Y(rank375) = 68, obviously, there is a tremendous distance between
Y(rank1) and
Y(rank375). Moreover, the overall value of
Y(rank1)–
Y(rank7) is significantly larger. On the other hand, the overall value of
Y(rank369)–
Y(rank375) is significantly smaller.
As shown in
Figure 4, the
x-axis is the all hybrid similarity measure
sim (
Pnrank,
P01) between the posting cases of
Pnrank and
P01 before trimming, and the
y-axis (value =
Y/1000) is the value of the corresponding
Y of
Pnrank. From the distribution of posting cases of
Pnrank on the
x-axis, it could be pointed out that the hybrid similarity measures between
Prank375 and
P01,
Prank1, and
P01 all meet the extracting rules, indicating that both
Prank375 and
Prank1 are similar to
P01. However,
Y(rank1) is not only greatly spaced from
Y(rank375), but also the distribution of
Y(rank1) in
Figure 4 is in a significant discrete situation far from other posting cases. Similarly, the distribution of
Y(rank2) = 52,342 also shows a relatively discrete state.
From
Table 8 and
Figure 4, it can be clearly seen that the Matthew effect is caused by information competition and the community incentive effect by the network community institution, collectively referred to as network effects. Network effects not only exist in social media but also affect earnings (here refers to the attention gained) of network postings. The network effect can simultaneously impose two significant opposite effects on earnings, even if these online postings are similar to attribute features. Therefore, when applying the CBR method in the network environment, the influence of the network and background situation on the case should not be ignored.
As shown in
Figure 5, the figure shows the posting cases after the extreme cases of both ends are eliminated, where
Y(rank8) = 20,441 is the maximum, and its corresponding
sim (
Prank8,
P01) is 0.925. In addition,
Y(rank117) = 1297, and its corresponding
sim (
Prank117,
P01) is 0.993, which is the largest of all hybrid similarity measures. The space between
Y(rank8) and
Y(rank117) of
Figure 5 is much closer than the distance between
Y(rank1) and
Y(rank375) in
Figure 4. Therefore, when the muster
Pnrank has finished trimming extreme cases of both ends, the blue dots’ distribution, compared with the distribution in
Figure 4, is relatively uniform and more concentrated in
Figure 5. If we draw a red regression line in the concentration area of blue dots, the blue dots could be found to evenly distribute over the upper and lower sides of the red regression line.
To sum up, when analyzing and evaluating cases of the social network, it is very reasonable and necessary to trim extreme cases which satisfy the case extraction rules but are impacted by the network effect. After the similar network posting cases Pτ are trimmed, the referring similar posting cases Pτrefer are formed according to Formula (19).
Step (5): Using Formula (19), the calculation of the attention as a forecast result of the target posting
P01 is as follows:
Referring to the above Steps (1)–(5), including
P01, we created 10 examples
P01–
P010 in all, which are shown in
Table 9 below. Where features
A1–
A10 are attributes of example target postings,
τ(
i) is the similarity threshold between the network posting cases and the target postings
P01–
P010,
Y0 is the forecast result of attention obtained by the target posting, PA is the actual attention gained when the example target posting is in a relatively stable network-state (milestone ≥ 45 days). Error is the percentage error between the predicted result and the actual value of the attention obtained by the example posting in this paper, Error = (PA −
Y0)/PA.
As shown in
Table 9, Attributes
A1–
A10 of example postings
P01–
P010 are different, which indicates that these 10 target postings are independent examples. According to Equation (15), the setting of the similarity threshold
τ is based on the principle of a simple majority, by which one-third of historical cases with the highest similarity to the target object will be extracted. Therefore, the larger the value of similarity threshold
τ is, the higher the similarity between the extracted case and the target one. On the other hand, the target one has a higher reference significance of the extracted cases. In
Table 9, the corresponding
τ value of
P05 is
τ(5) = 0.885, and the corresponding percentage error Error = 1.02% indicates that for the example target posting
P05, the network cases extracted from the network posting cases
PCBR have more reference significance. Thus, the error of the prediction result is smaller. On the other hand,
τ(9) = 0.813, and the corresponding percentage error is −3.16%, which indicates that the network postings extracted from
PCBR are less similar to example
P09 than the example
P05. Therefore, the error of this prediction result relatively increases a little. However, the error of the prediction results of all 10 examples is not more than
compared with the attention actually obtained by target postings of the auto community.
5. Conclusions
To solve the related problems of information dissemination on social media, we propose a CBR & AM (a method of Case-Based Reasoning and Attribute Features Mining for Popularity Prediction in Social Network) based on the research background of the automobile network community. The case postings of vital reference significance are carefully identified from massive information in the online community Drawing on the knowledge of historical case postings of the auto community, we evaluate the number of public views that target postings might gain when they have been kept in a relatively stable network state. This paper has successfully explored a new method to deal with noisy network information and predict the popularity of social network information, which provides an effective way to implement early management of network expectations. We have carried out the following work.
- (1)
The construction of a network posting cases database. Preprocess the auto community data package, collect sufficient data samples, and extract basic indicators and simple features. By adopting the sampling method based on mathematical statistics and setting reference milestones for extracting optimal cases, the network posting cases database is constructed according to the social network environment.
- (2)
Proposing the idea of intrinsically interpretable attribute features of network postings. Based on existing theoretical exploration and empirical research of social network information, the idea of attribute features with explanatory capability to postings’ popularity has been proposed. Combined with computer data mining and text analysis technology, valuable information about the popularity of postings in the community is extracted, and related attribute features are mined successfully, including directly observable features called simple features and features requiring data analysis and text mining technology called hidden features.
- (3)
Construction of the CBR case-presentation system. Based on interpretable attribute features of different data types, CBR presentation of network case postings and the target posting has been provided. Combined with related research on the CBR approach and the research background, this work has successfully offered a hybrid similarity measure between the network posting cases and the target posting and the extraction rules of similar network posting cases as well.
- (4)
Trimming suggestions of extreme cases and formation of referring similar posting-cases dataset. Drawn from the existing empirical research work on the social network and combined with the data analysis of the auto community dataset, the view that network effects have an expected impact on information earnings (earnings here refer to the popularity by postings gained) has been proposed according to the actual situation of postings’ earnings in the auto community. Trimming suggestions and corresponding parameters are offered to deal with extreme cases caused by network effects. Finally, the referring similar posting cases base has been successfully formed, which might bring actual reference value for the CBR application to the network environment.
- (5)
Case study and demonstration. A case is used to completely demonstrate the entire process of the CBR & AM method, from establishing the network posting cases database to generating the prediction results of the target object. Moreover, 10 independent cases are adapted to compare the forecast results with the actual popularity obtained by cases, respectively. In the process of demonstration and analysis, the detailed data and chart analysis are used to show the rationality of the reference milestone (≥45 days), the existence of network effects, two significant influences imposed by network effects, and the comparative analysis of network extreme cases before and after trimming. In this way, the CBR & AM method proposed has verified the application in the network environment and the advantage of the algorithm.
The application value of this research: the number of views obtained by the online posts commonly reflects the attitudes of the public. In the network community, it could represent the interest of the community users in issues. To the shopping websites, it could reflect consumers’ willingness to buy products. On the news websites, it could indicate the appeal of news to the public. In fact, it is used for feedback on the operation performance of websites or businesses. Meanwhile, the expansion effect of the network often leads the public to follow the trend, which might finally result in the Internet celebrity phenomenon. Thus, this research could offer intelligent suggestions of reference for both consumers and enterprises; moreover, from the perspective of users, according to the characteristics and environmental background of users’ published content, this research can infer whether the content has the potential to be recommended, which is helpful to identify potential opinion leaders or Internet celebrities in the network. Thus, this is also very meaningful for the characterization of the portrait of network users.
The inadequacies and further improvements of this paper: first, if conditions are available, the sample data collected for the construction of the network case base should be dynamically updated over time during the application process so that the case samples can keep synchronizing with the time changes of social media. Secondly, the attribute features adopted for CBR presentation are the features that have the explanatory capability for postings’ popularity in the community. In the future, the influence of these features on the popularity of postings will be further explored to distinguish the weight of attribute features, and this work will be helpful in dealing with the problem from primarily a qualitative analysis to a quantitative analysis. Third, due to the widespread existence of the network effect and social media “recommendation” institutions, some network postings can reap excess earnings, while others fall in another extreme situation (they are quickly submerged in information competition). Thus, the prediction of attention of network postings in this research is not applicable to the forecast of special cases, but the prediction results can be used to evaluate whether postings have a certain potential, such as the potential to be worthy of recommendation, or be judged of no capability to arouse others’ interest. Finally, some experience parameters applied in this research, such as the value of μ, are derived from the results of the sample data analysis. Once the environment of the social network changes, parameters may need corresponding adjustments. In the future, we will try to formulate algorithms or rules without experience parameters.


