
Application of GeoGebra in the Teaching of Descriptive Geometry: Sections of Solids


1
Department of Construction Design, Faculty of Engineering and Technology, Pedagogical University of Maputo, Maputo 4040, Mozambique
2
University of Trás-os-Montes e Alto Douro, 5000-801 Vila Real, Portugal
3
EES-INEGI/LAETA, University of Trás-os-Montes e Alto Douro, 5000-801 Vila Real, Portugal
4
CIDTFF—Research Centre on Didactics and Technology in the Education of Trainers, 3810-193 Aveiro, Portugal
*
Author to whom correspondence should be addressed.
Mathematics 2022, 10(17), 3034; https://0-doi-org.brum.beds.ac.uk/10.3390/math10173034
Submission received: 2 July 2022
/
Revised: 2 August 2022
/
Accepted: 4 August 2022
/
Published: 23 August 2022
(This article belongs to the Special Issue Didactics and Technology in Mathematical Education)
Abstract
:Technologies came to revolutionize the teaching of technical design; they brought resources that enabled 3D and 2D graphic simulation. The objective of this research is to understand how the implementation of the dynamic software GeoGebra on the topic of cylindrical sections can improve 3D spatial visualization in students because of the challenges in understanding the 3D representations and transporting them to the 2D sheet. This is a quasi-experimental case study in a mixed qualitative and quantitative approach which was conducted in a grade 12 class on the subject of descriptive geometry. The instruments used were a pre-test, post-test and Santa Barbara Solids Test. The students of the experimental group used GeoGebra and obtained better results in the post-test than the students in the control group, which suggests an improvement in learning; however, the Santa Barbara Solids Test results showed that the difficulties in visualizing views of the projected solids in a two-dimensional plane persisted. This study is also intended to test software in a classroom with students who have never experienced a 3D technology in their educational practices and direct future research in the complex content of descriptive geometry with the help of software.
MSC:
97G80; 97G101. Introduction
Information and Communication Technologies (ICTs) have boosted modern forms of learning in technical areas, allowing for perfect 3D graphic representation in color with multiple advantages, of which the similarity to reality, the rapid execution of exercises, interactivity, visualization of 2D and 3D representations of the same solid and the low cost for project implementation stand out. In a study by Garganté et al. [1] (p. 11), they state that:
proposes a taxonomy of ICT affordances that includes categories such as information accessibility and immediacy, fast information exchange, diversity of learning experiences, extensive communication and collaboration technologies, reflection by means of written discourse analysis, and multimodal or non-linear access to information.
These classifications generally reflect the applicability of ICT in everyday life in any scientific area. In the teaching of technical drawing (TD), specifically in the subject of descriptive geometry (DG), the taxonomies of ICT have huge relevance because they allow the representation of abstract theoretical content in 2D and 3D graphic experiments. The students classify DG as a subject with complex content, and it is difficult for them to spatially visualize the shape of the solid in 3D, conjugate the same solid in 3D to rotate mentally and transport to the sheet in 2D. For Wahab et al. [2] (p. 1006), “the difficulty in learning geometry is not unique to Malaysian students, but it rather takes place globally”. The same authors add that the difficulty for students is connecting the 2D image to 3D. These difficulties are presented in the literature by numerous authors [3,4,5,6,7,8,9,10,11,12,13,14,15]. Before the technological revolution, this entire learning process was exhausting for DG teacher mediation because teaching was traditional/manual and used chalk, a blackboard, rulers, set squares, protractors and compasses. The exercises used to take hours to solve and some of the concepts remained abstract. The traditional model did not drive clear, fast and collaborative learning. The limited experiences in geometry did not provide opportunities for students to develop their visual spatial skills, thus preventing the development of thinking when learning geometry [16]. Currently, ICT allows for the use of Technological Resources (TRs) that enhance educational practices with dynamic 3D experiences. Creating an opening for future changes in the school curriculum in relation to the time and the number of exercises of practical classes (if they are simulated in TRs) makes room for more experiences in less time. These facilities that technology brings to the classroom do not replace teacher mediation in the teaching and learning process, especially in learning the most complex content of DG. In this context, the educational system must have teachers who are prepared to respond to these new demands and train their students in these key skills [17]. Thus, this study presents the research question: How can the dynamic software GeoGebra promote spatial visualization in the study of descriptive geometry?
The GeoGebra feature was conceived and developed by Markus Hohenwarter in 2001 to be used in a classroom. The spatial visualization promoted by the dynamic software GeoGebra can facilitate the solving of DG problems. For Baranová and Katrenicová [8] (p. 22), “in our concept, the spatial ability is the skill in solving visually assigned problem in mind. The branch of geometry which allows the representation of 3D objects in two dimensions is Descriptive geometry”. The promotion of spatial visualization skills can be developed through repetitive simulations. These simulations provide instructors and teachers with a means to facilitate learning that leads to increased student achievement [18] in an interactive way due to the simplicity of graphical construction of the DG elements that the software enables. DG is a technical area that spatially studies the relationships of 3D and 2D shapes by perceiving details accurately in any position [19]. It is also a method for studying 3D geometry through 2D images. It provides insight into the structure and metric properties of spatial objects and processes [7]. DG is the basic topic for the training of engineers, architects and designers.
1.1. Technological Resources
The technology is composed of TRs, which are electronic and multimedia devices that have quickly brought development in 3D representation in engineering. 3D technology is developing and progressing rapidly, and these developments are also notable in the field of education and have brought significant innovations to the classroom environment [20]. Currently, teachers of DG have several mechanisms to assist the mediation of complex and long content in a simple and fast way for all student levels. Technologies provide fast and accurate engineering designs at all levels, enabling fast but quality learning in an interactive and collaborative way [11]. For Lamb et al. [18] (p. 158), “specifically, policy makers often assume that all technology formats such as software, computers, tablets, and other technologies are equally effective at reaching students in the classroom”. In all of the TRs mentioned above, the dynamic software GeoGebra can be installed. Kramarenko et al. [21] (p. 706) state that this software is:
available in multiple languages. Using GeoGebra a teacher can create interactive materials to solve the main tasks of teaching Geometry—the development of spatial imagination, practical understanding and logical thinking. GeoGebra can be used both in standalone and online modes on mobile Internet.
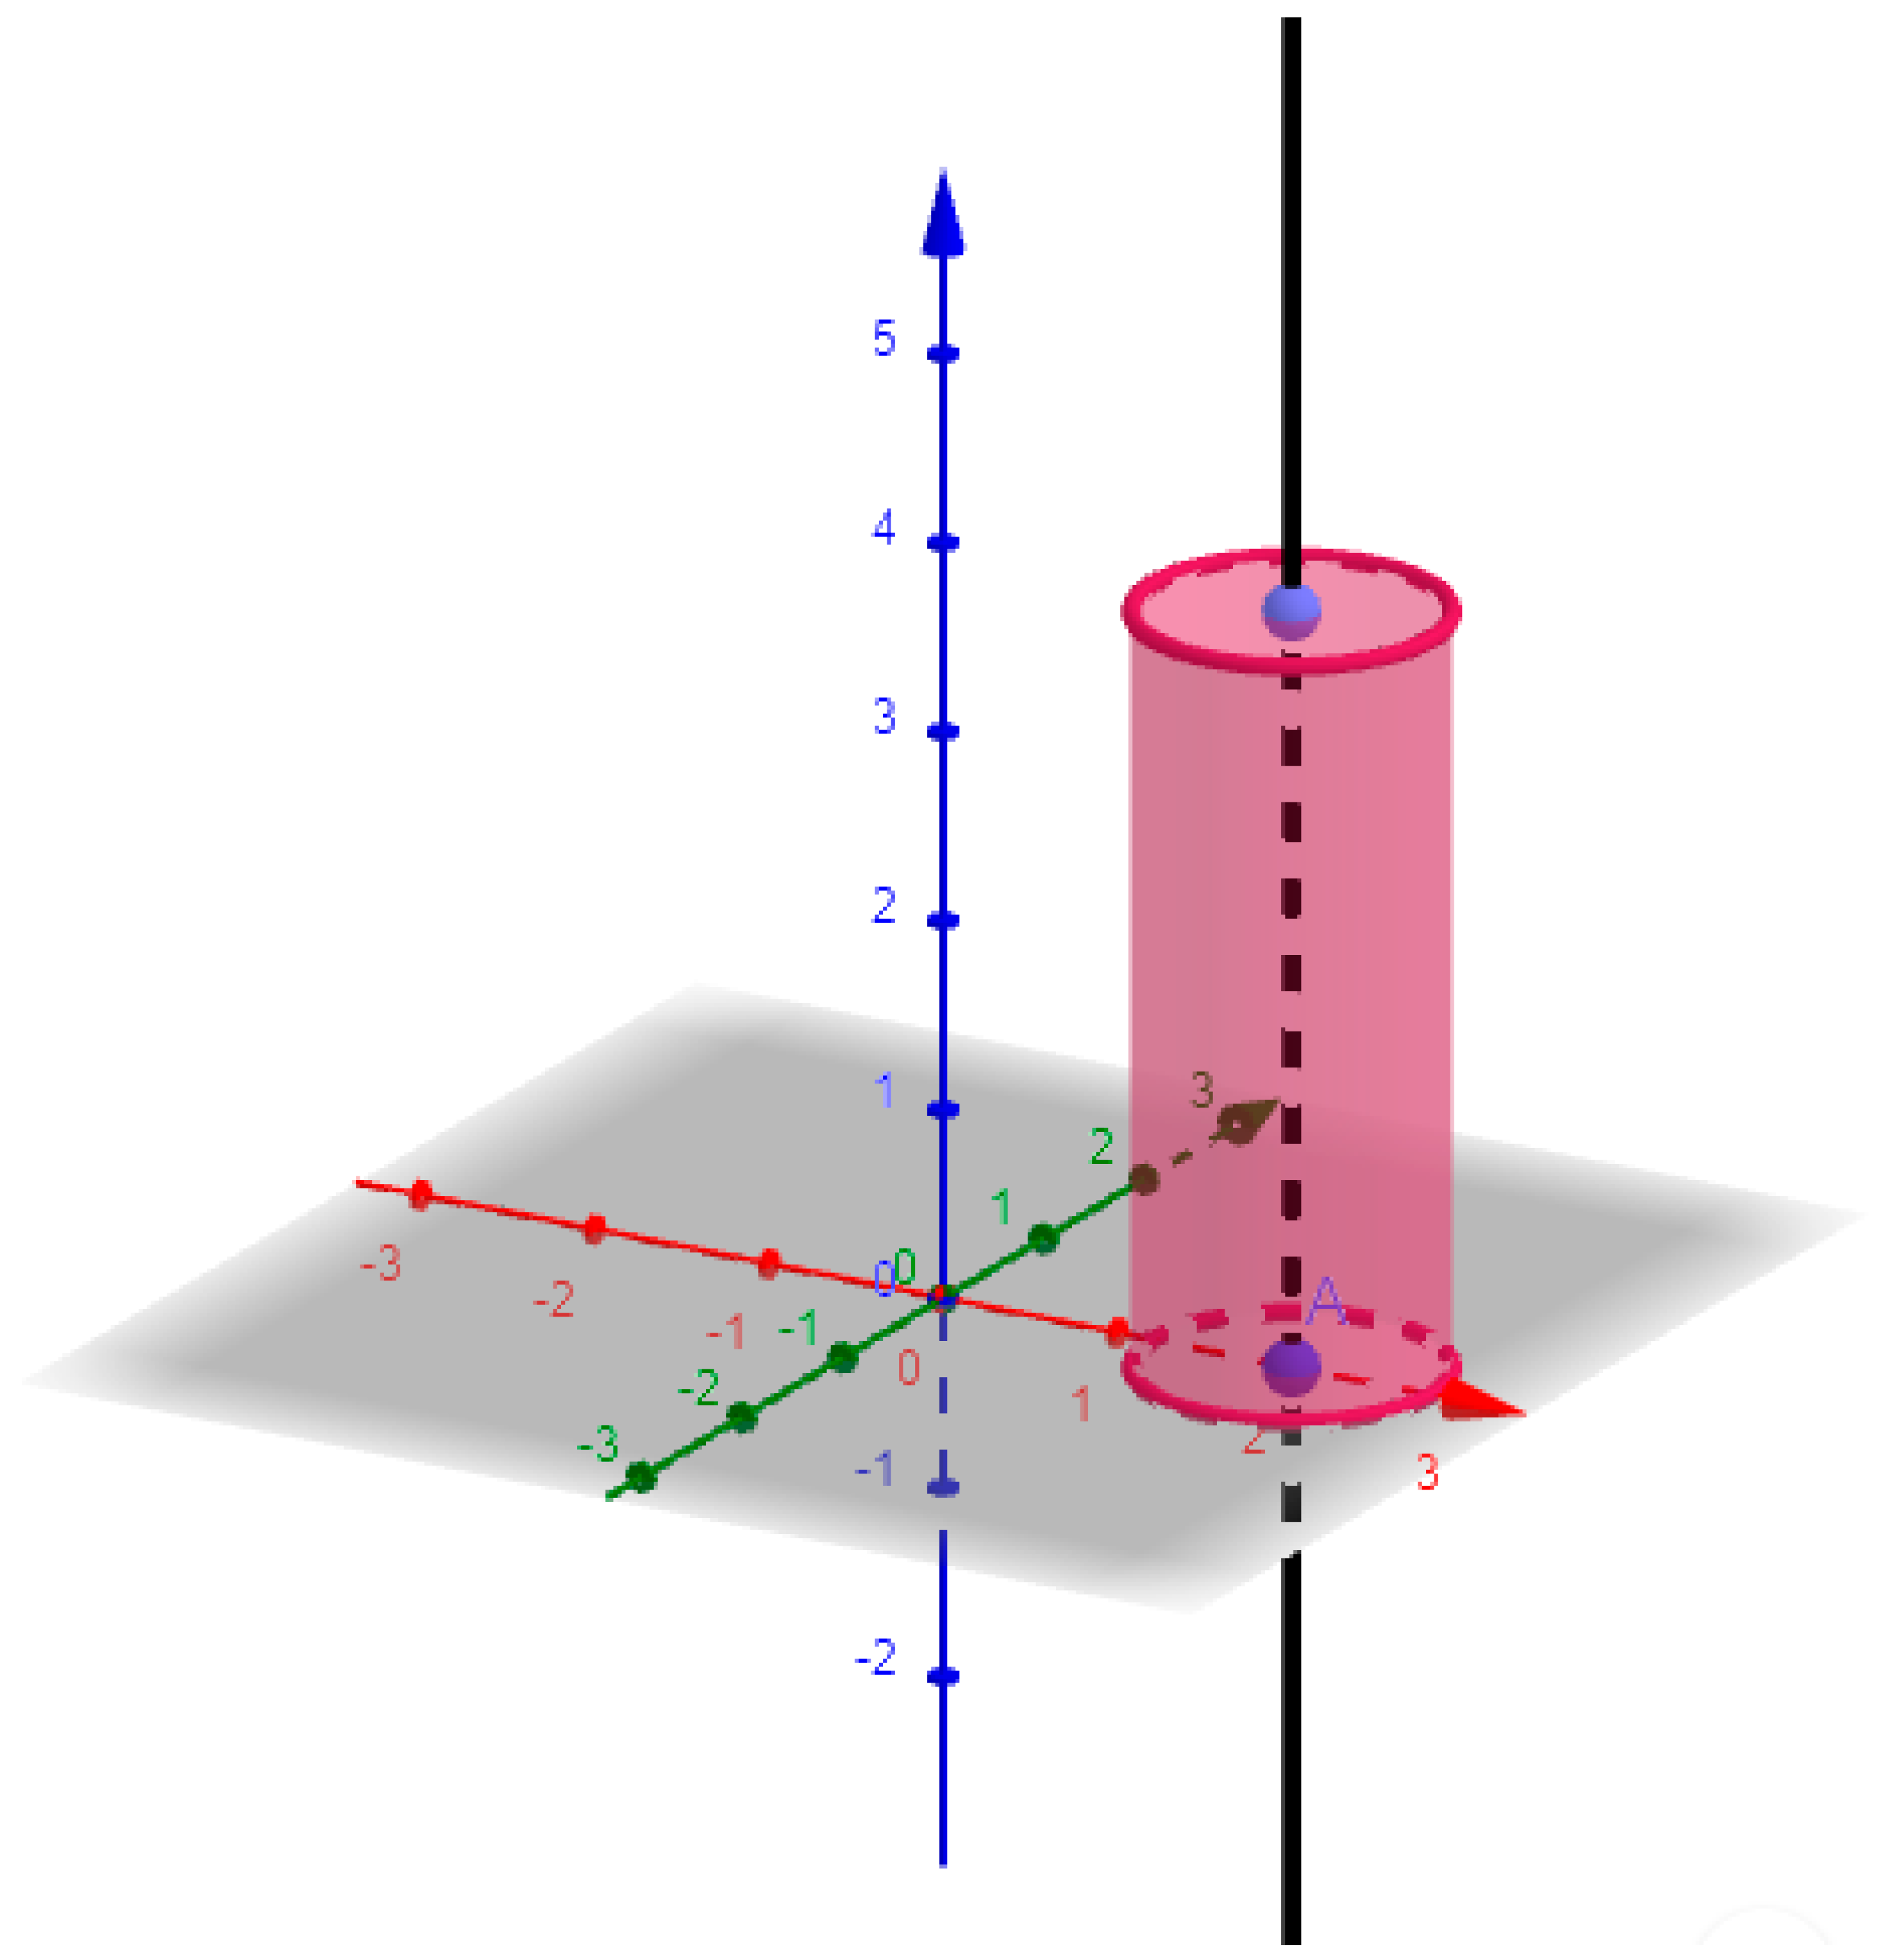
The DG exercises can also be modeled in mobile applications, such as Geometry, Graphing Calculator, and 3D Graphing Calculator, which have been launched relatively recently and are now available on the official GeoGebra website [21] (See Figure 1).
Being dynamic software, GeoGebra, in addition to presenting all elements for the study of DG, allows the quick repetition of exercises, their recording and sharing for various applications. Thus, it is important to identify a suitable approach in teaching and learning to maximize the learning experience. Enabling students to have more opportunity to conduct various experiments is one of the learning methods [22]. An advantage of applying TRs in the classroom is the use of the same tools that students use in their daily lives (computers, smartphones and tablets) and these students, who are digital natives, learn easily with motivation and an apparent constructivist knowledge coming from TR manipulation.
1.2. 3D Spatial Visualization
3D spatial visualization (SV) is the ability to spatially combine all the details related to the shape of the solids and their position. For the student to solve the exercises in DG, it is necessary to mentally rotate the solids in the projection planes, thus there is a need for three skills: the ability to rotate mentally the solids in the projection plane, the ability to visualize every detail of the shape of the solid and the ability to realize the relationship of the elements that will interact with the solid. This reasoning allows for the creation of new projects by manipulating all elements involving the problems of DG. This SV ability is the basis for perceiving the abstract fields of DG. The reasoning associated with geometry is called spatial reasoning, which is the greatest difficulty for secondary school students [9]. To measure SV ability, several tests from cognitive psychology are used, such as the Mental Rotation Test, Spatial Visualization Test, Mental Cut Test, Minnesota Paper Form Board Test, Paper Folding, Surface Development, Cube Test and Santa Barbara Solids Test (SBST). The SV tests measure various skills, such as visual memory capacity, perception of shape figures, shape position in space, color memorization, visual motor coordination, and relationships of elements that conjugate with shapes spatially.
Santa Barbara Solids Test
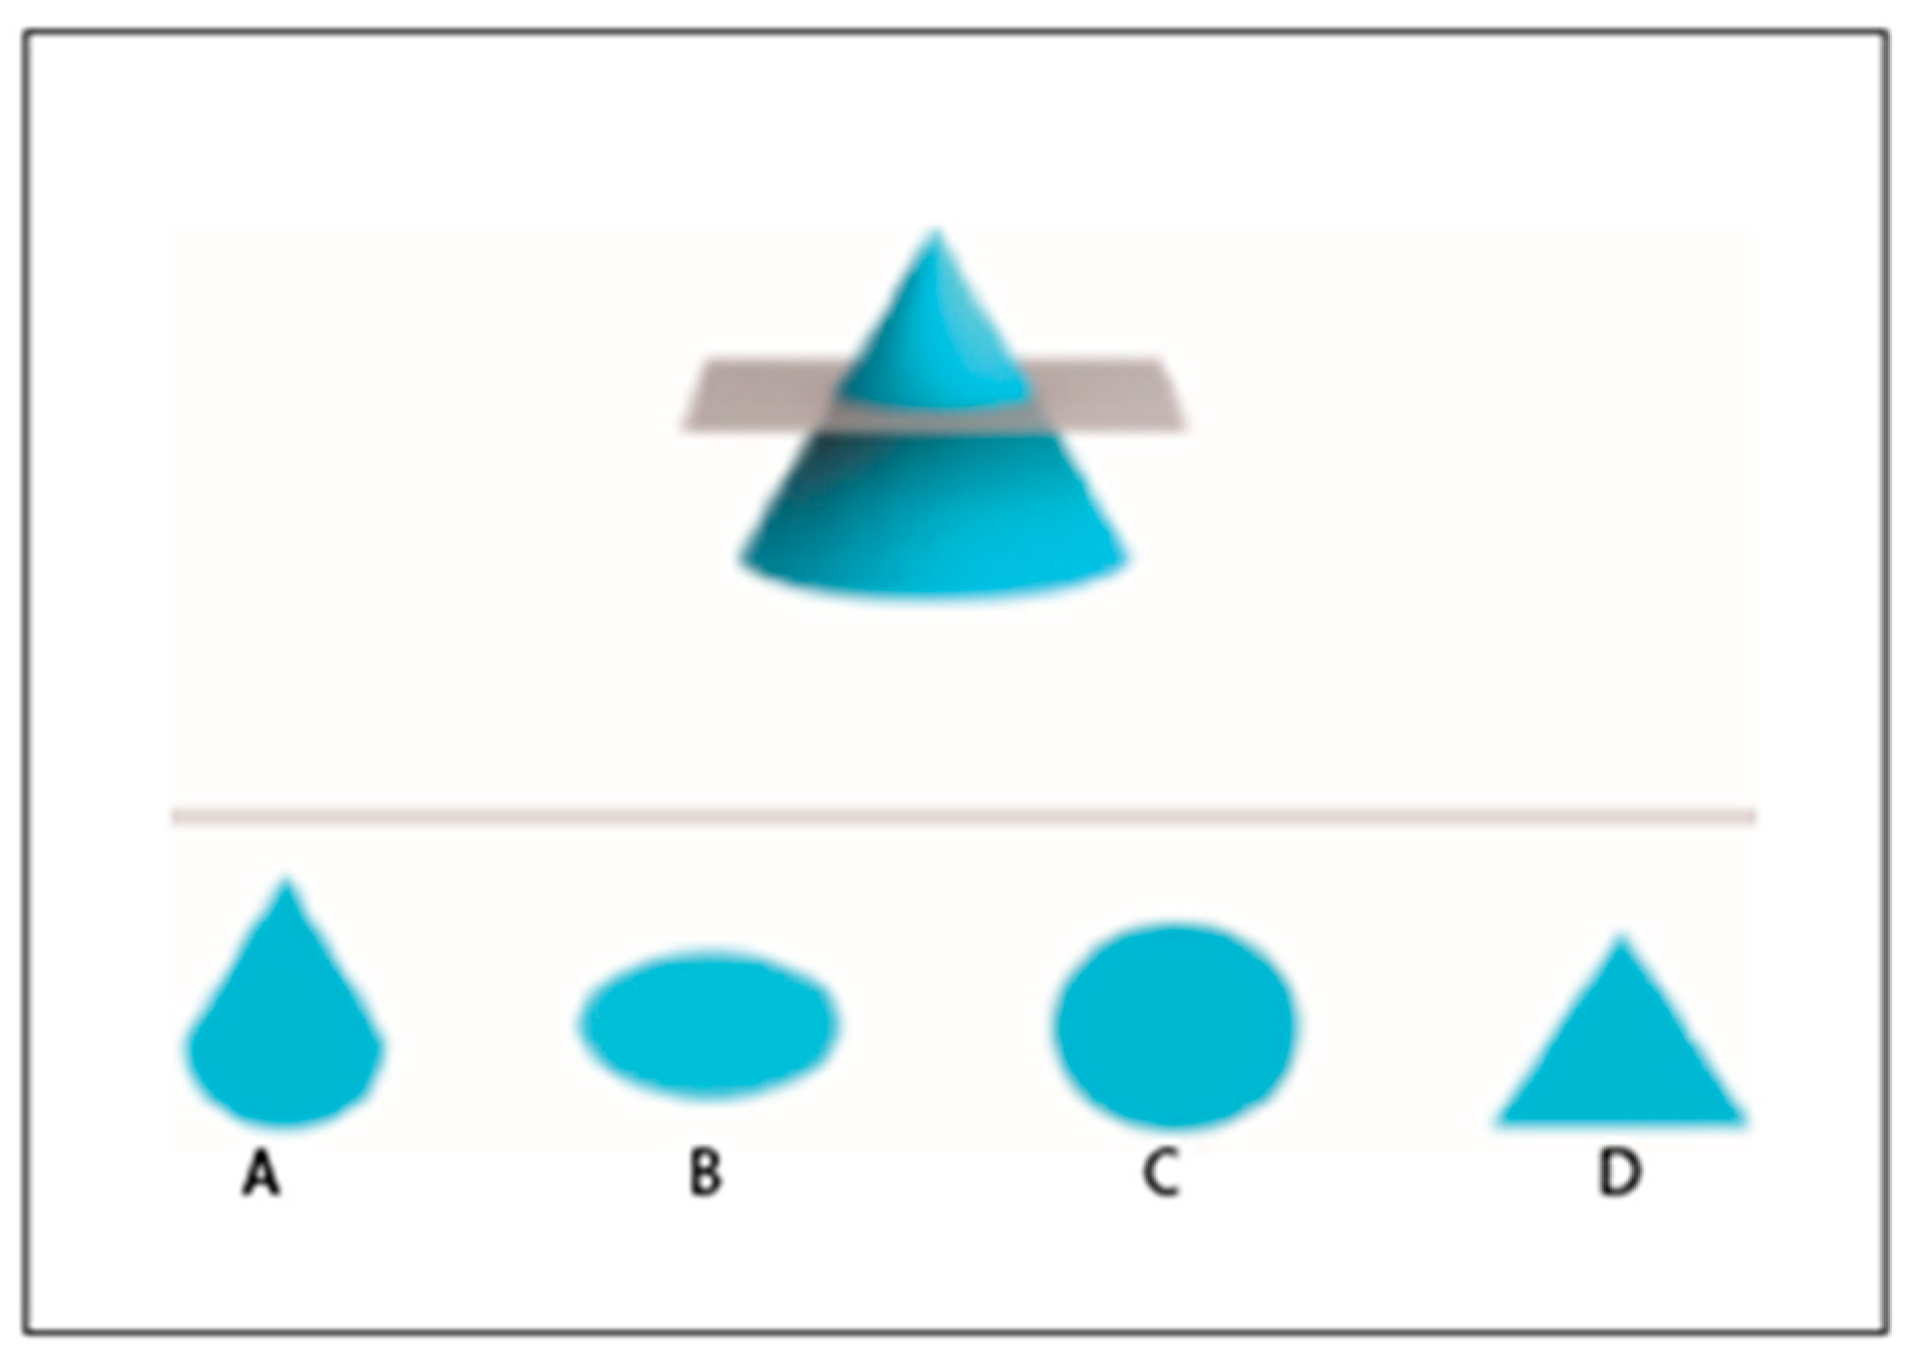
The SBST serves to measure ability levels for perceiving the shape of the figure with the true magnitude of the part sectioned in the solid by the cutting plane. Dere and Kalelioglu [20] (p. 1) claim that “the Spatial Visualization Test, Mental Rotation Test, and SBST, which concurrently measure spatial orientation and spatial relations, were used as tools to measure the different components of spatial ability”. The figure of the sectioned part shall be a consequence of the type of cutting plane and its position in the solid. The SBST allows you to measure the student’s level of perception for each cutting plane position on the solid. The entire SV process for the SBST requires three skills: mentally visualizing the solid, reasoning of the position of the cutting plane and the discretion of the figure of the cut shape produced by the cutting plane in the solid. The SV test ensures measurement of the participant’s ability to relate the elements that interact in the solid and which product results from the cut. Cohen and Bairaktarova [23] (p. 1) tested the SBST “to characterize individual differences in performance among first-year engineering students with low mental rotation scores”. The SBST includes several processes, such as the codification of a three-dimensional stimulus, the construction of a viso–spatial representation from the percentage input and the rotation of a representation of a three-dimensional image sectioned by a plane (See Figure 2).
1.3. Sections Produced in Cylinders
Sections of solids is one of the topics of DG. The section produced in a solid is the figure that results from the cut made by the cutting plane. The shape of the resulting figure depends on the position of the cutting plane. The shapes of the section figure produced in cylinders are acquired depending on the position of the cutting plane in two distinct situations: when the cutting plane is parallel to the surface axis and when the cutting plane is not parallel to the surface axis. The figure can have four results. If the first result is a circumference, it is because the cutting plane is parallel to the bases. If the second result is an ellipse, it is a consequence of using an oblique cutting plane to cut the bases. If the third result is a quadruplet, it is because the cutting plane is parallel to the generatrixes. The fourth result comes from two situations: if it is an ellipse arc and a straight segment, it is because the section is of an oblique plane to the bases; and if they are two segments of line and two ellipse arches, it is also a consequence of an oblique plane that cut the two bases (see Figure 3).
2. Materials and Methods
In this work the methodology used was the almost experimental case study because it does not integrate all the characteristics of a true experiment [24]. This research describes and analyzes in detail the experiment conducted, which focused on the use of dynamic software, GeoGebra version 5.0.721.0 (to learn more WWW.Geogebra.org), in students of a general secondary school class in Southern Mozambique. The study is composed of a sample of 25 students representing the subject of DG in a grade 12 class of a public school in the city of Maputo. A teacher and five trainee students from the Visual Education degree course of the Pedagogical University of Maputo were also part of the participants. The particularity of the study lies in the fact that it experiences the dynamic TR GeoGebra in teaching the topic of cylinder sections. Additionally, this research is pioneering in Mozambique because it was simulated on smartphones, which are not yet allowed to be used in Mozambican classrooms. Timbane et al. [25] (p. 770) highlight in their study that “in the Mozambican context, the use of a cell phone in the classroom, in the school environment, is prohibited by law”. The approach is mixed, being quantitative for presenting and analyzing the quantifiable data of the relationships, causes and consequences of the phenomena that occurred in the classroom environment and qualitative for collecting data from the students through their behavior, ideas, sensations, opinions and perceptions of differences and similarities of comparable aspects of experiences in the classroom. With the intention of obtaining greater veracity of research results, the formal instruments for data collection were: a pre-test, post-test and SBST applied to students in the following sequence.
2.1. Pre-Test
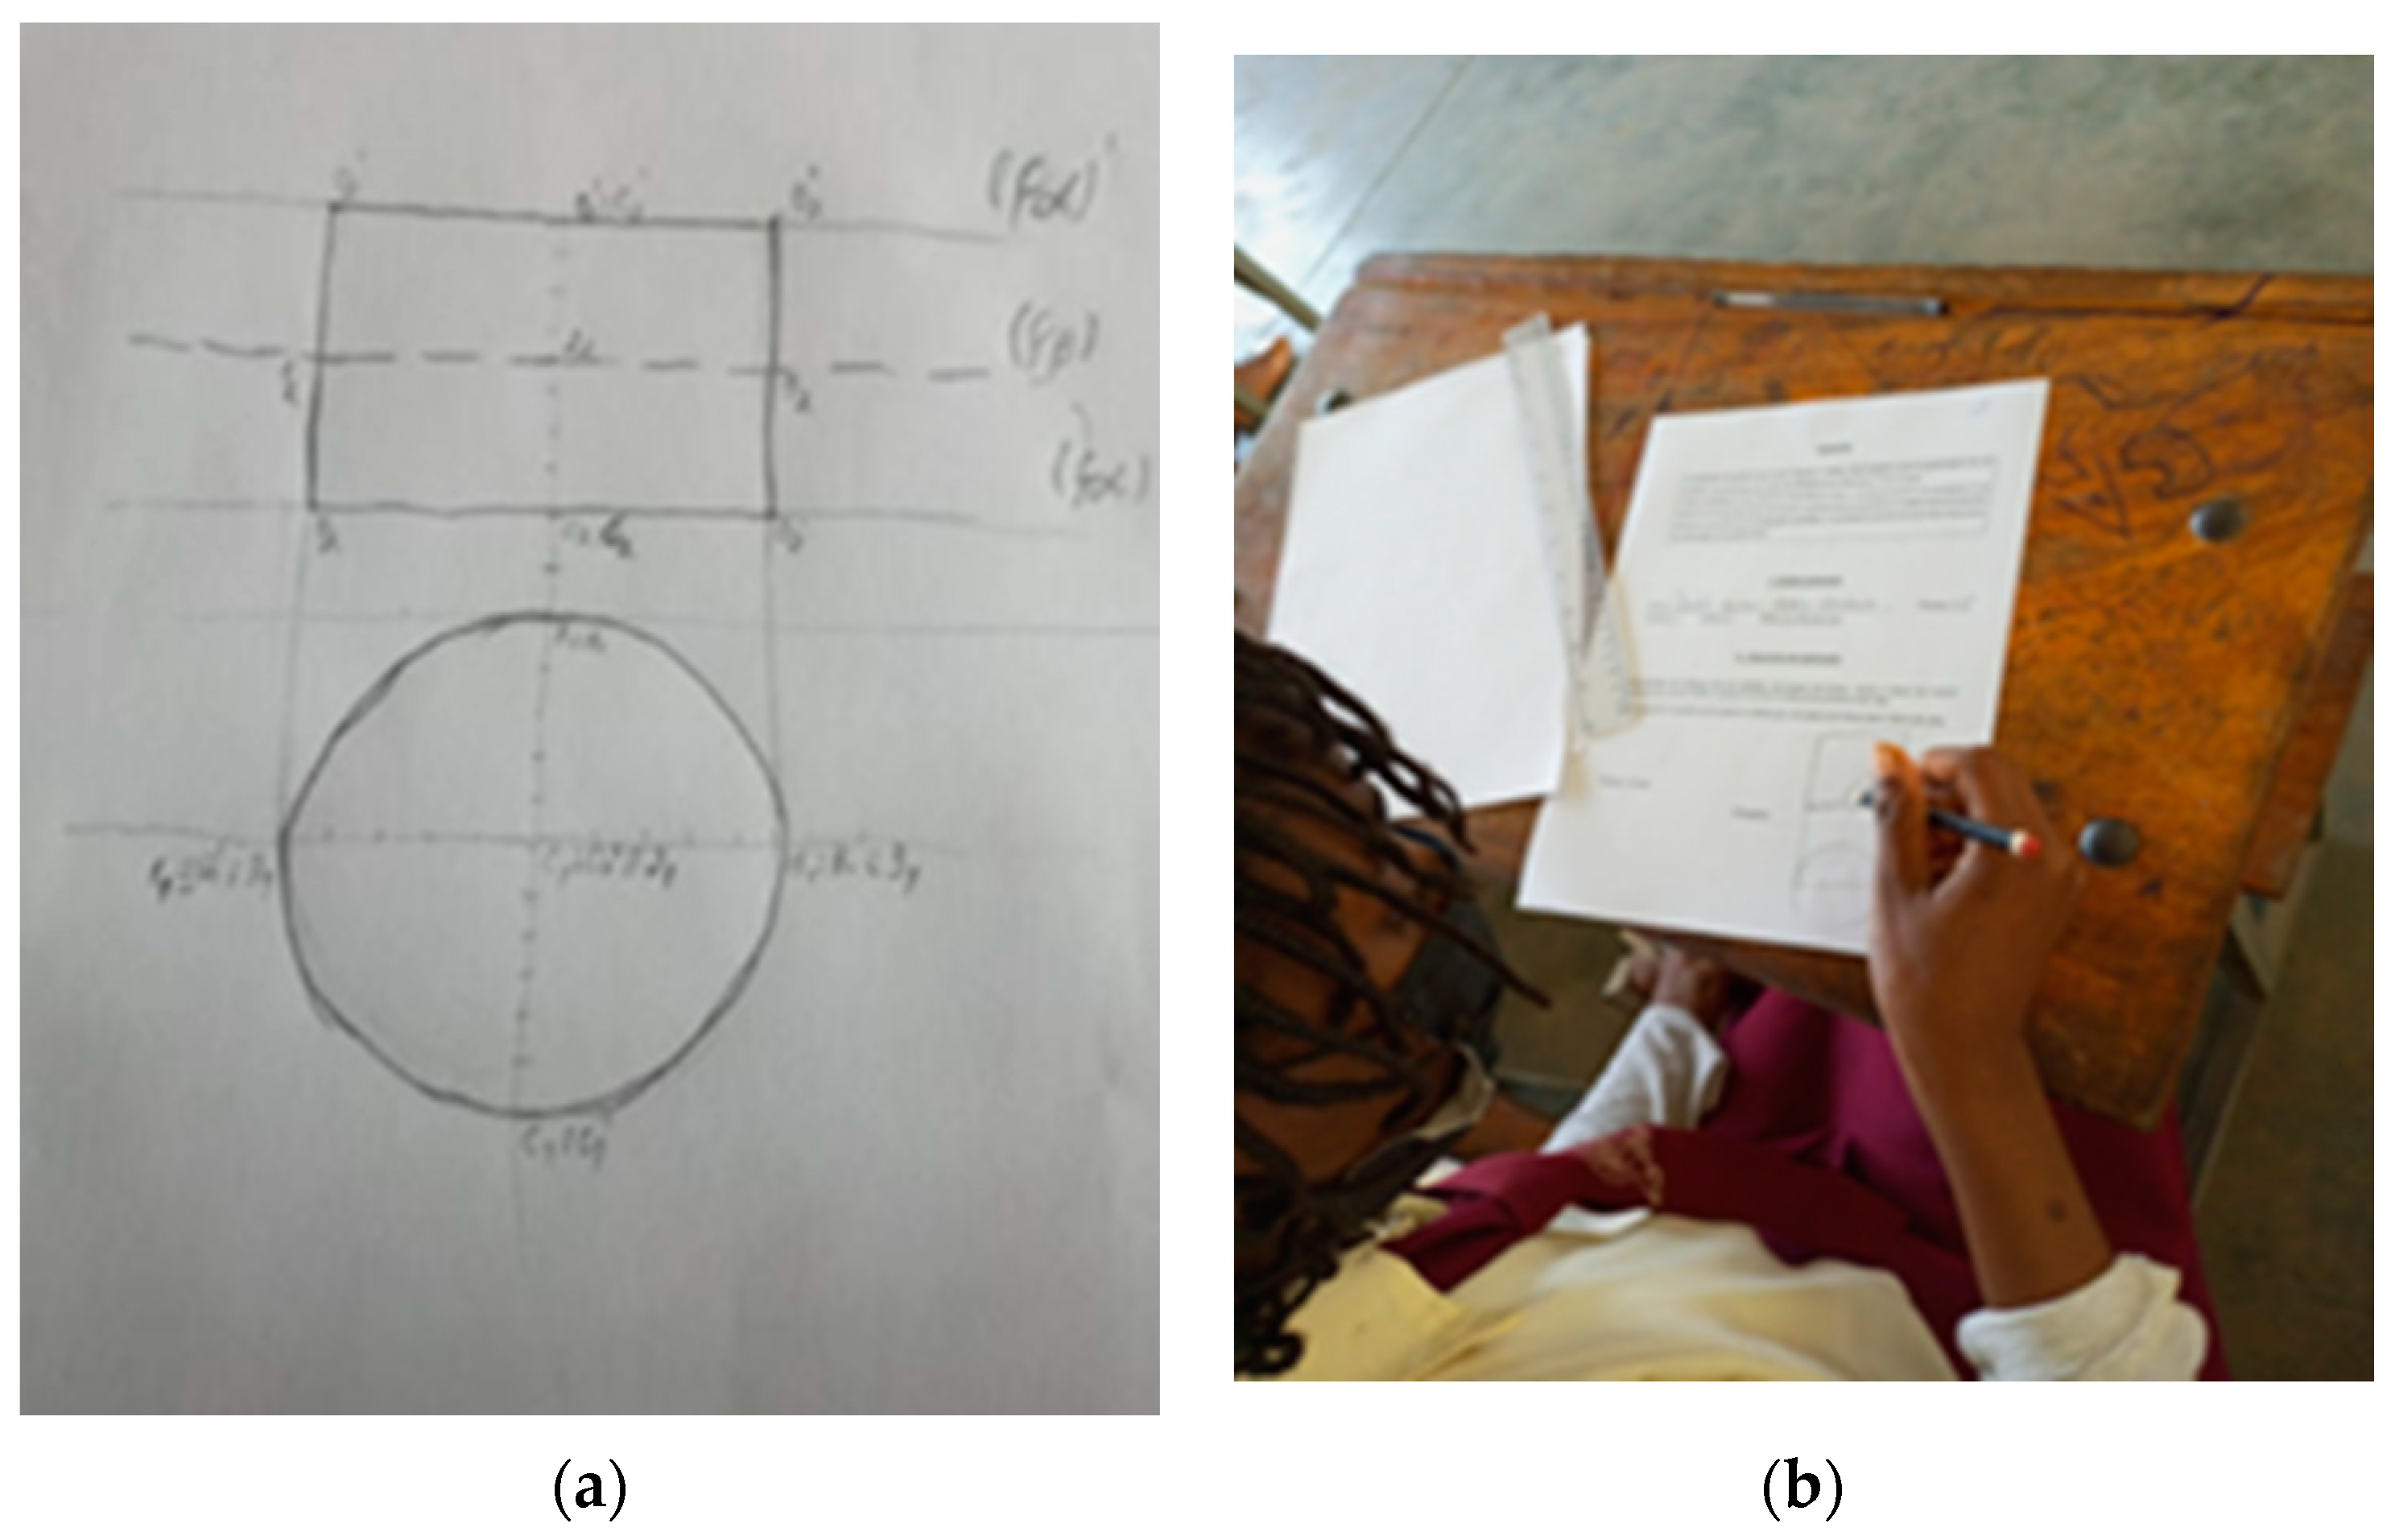
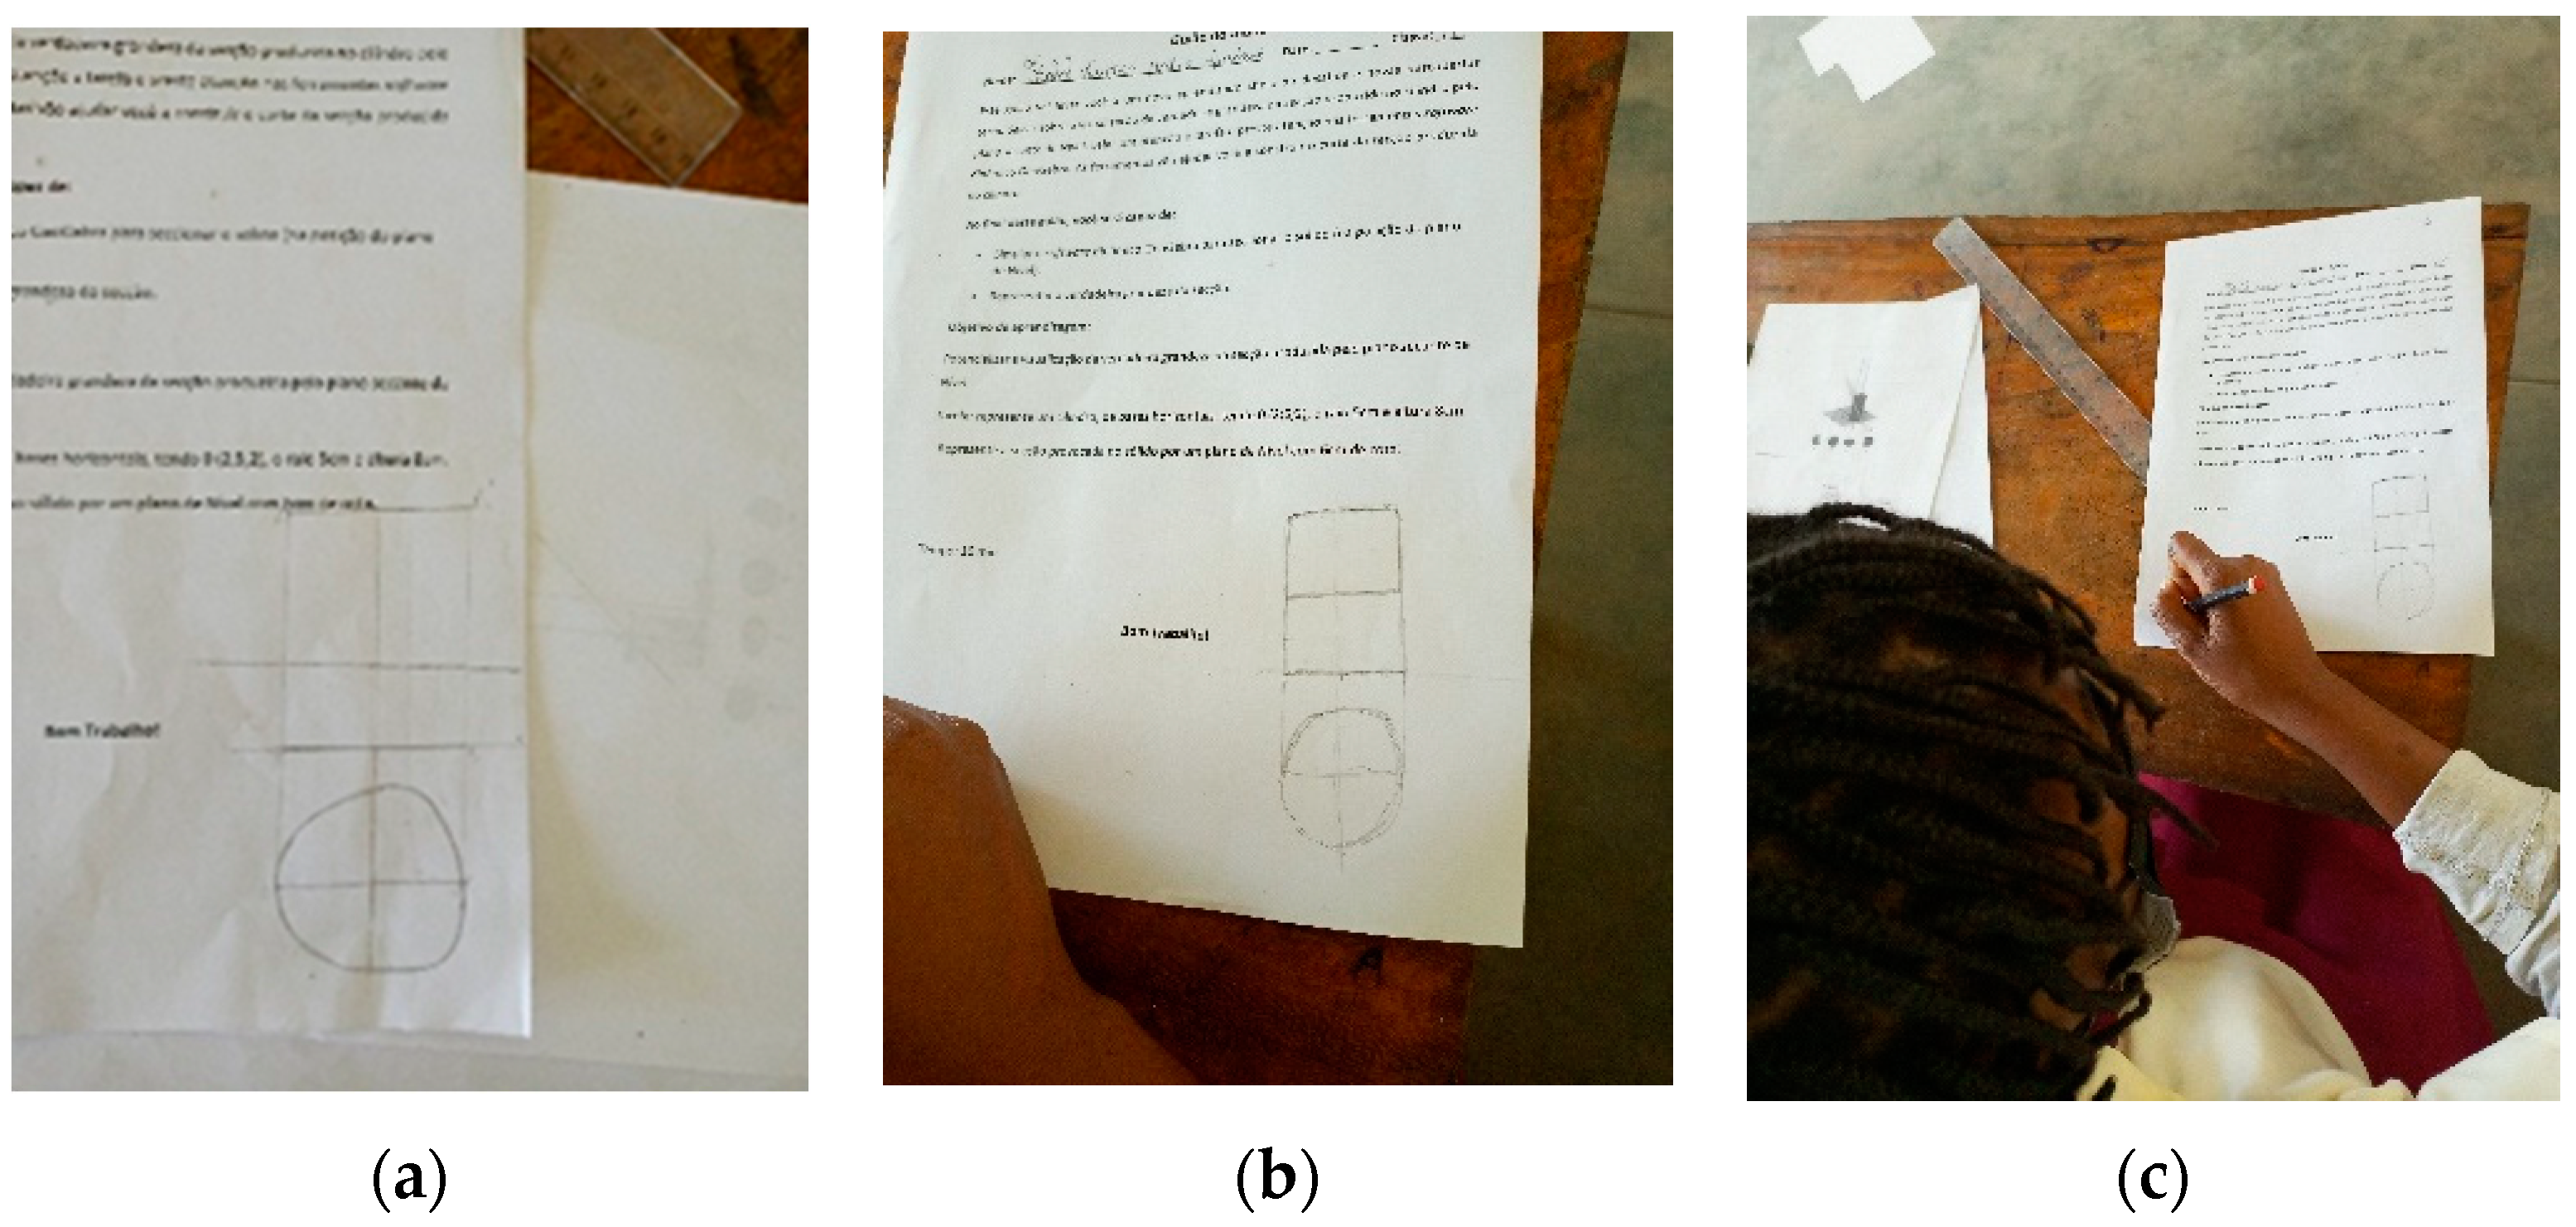
The pre-test was applied at the very beginning. A total of 25 students were interviewed in order to obtain data that allowed for the assessment of knowledge about the topic (sections in cylinders) and observation of the behavior of the students in the initial phase of the research. The class teacher had already presented the subject of cylinder sections but without the aid of a technological resource. The teacher presented a pre-diagnosis of the students’ difficulties in SV. The students’ behavior in the initial phase of the investigation was also observed. The questionnaire contained 1 practice exercise, on a scale of 0 to 20 points, where the student was asked to represent a sketch of the section caused in the cylinder of the front bases by a level cutting plane (the shortest distance from base to center was O (2; 5) and the height of the cylinder was 7 cm). The measurement of the radius was at their discretion because the exercise was solved by sketching in a time of 15 min (see Figure 4).
The students performed the pre-test without confidence; whenever the teacher came nearby, they looked sideways with shy facial expressions. After the pre-test, a teacher presented a lesson on the study of sections in cylinders. It should be noted that the DG teacher of the class had already introduced the topic of sections in cylinders.
2.2. Description of the Lesson
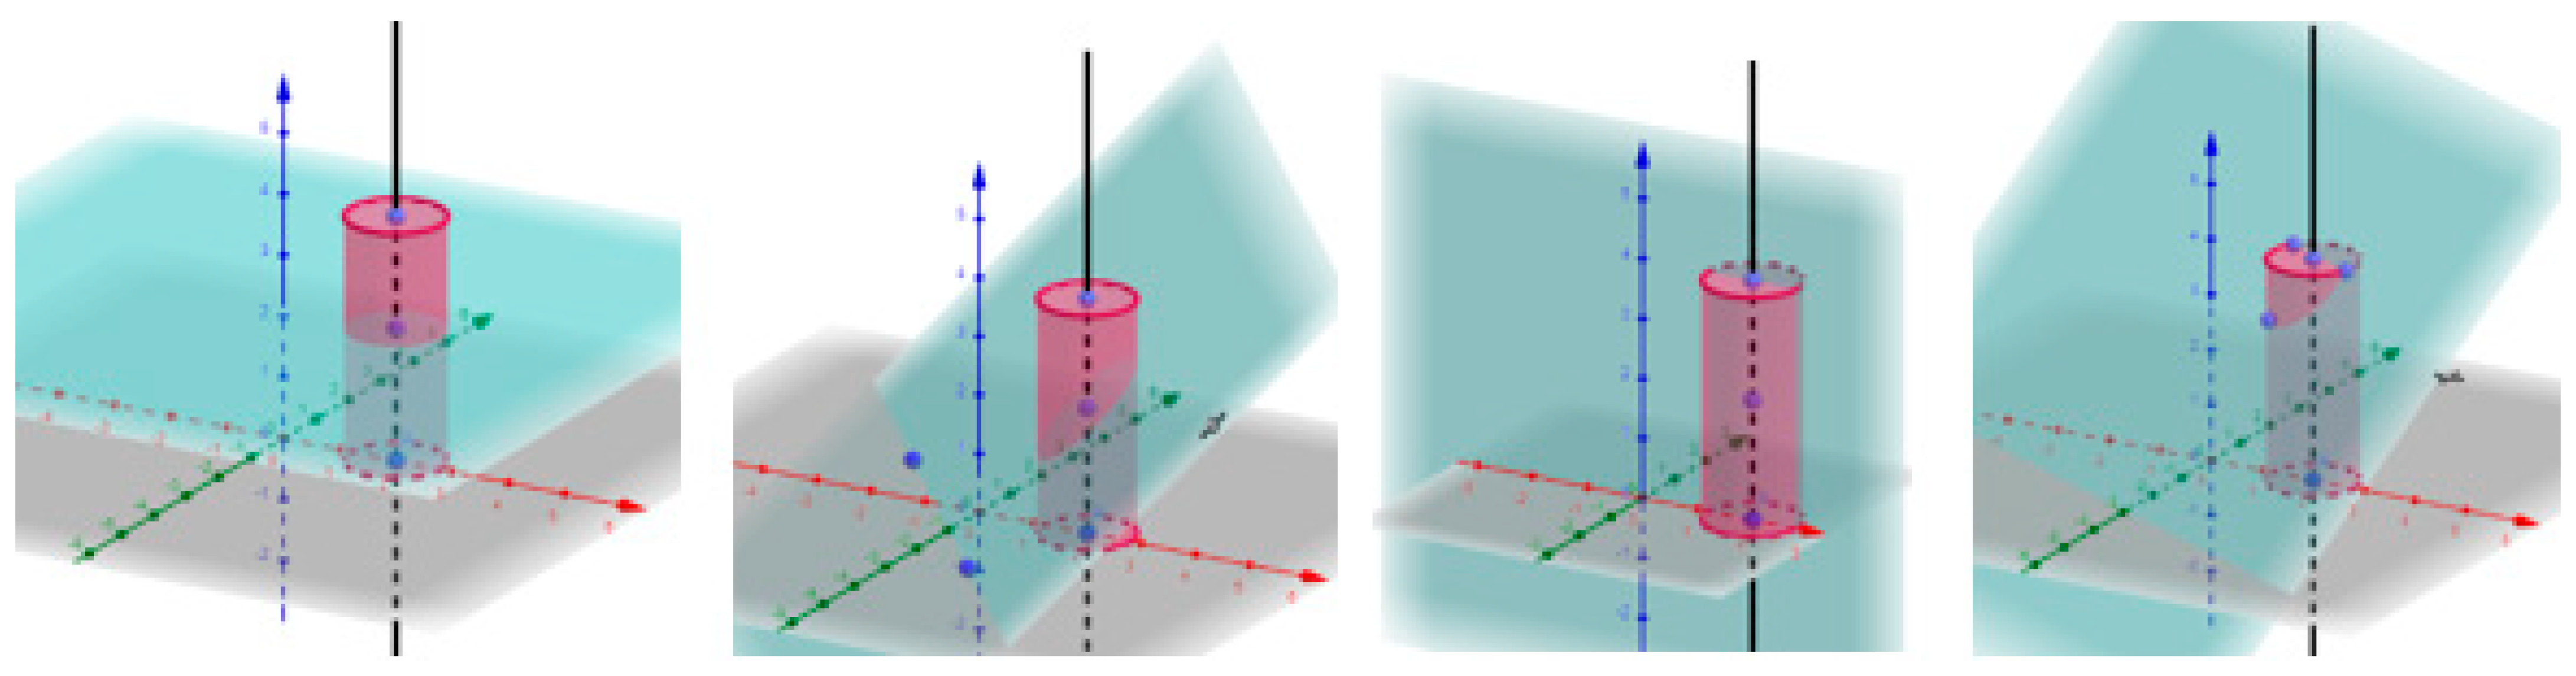
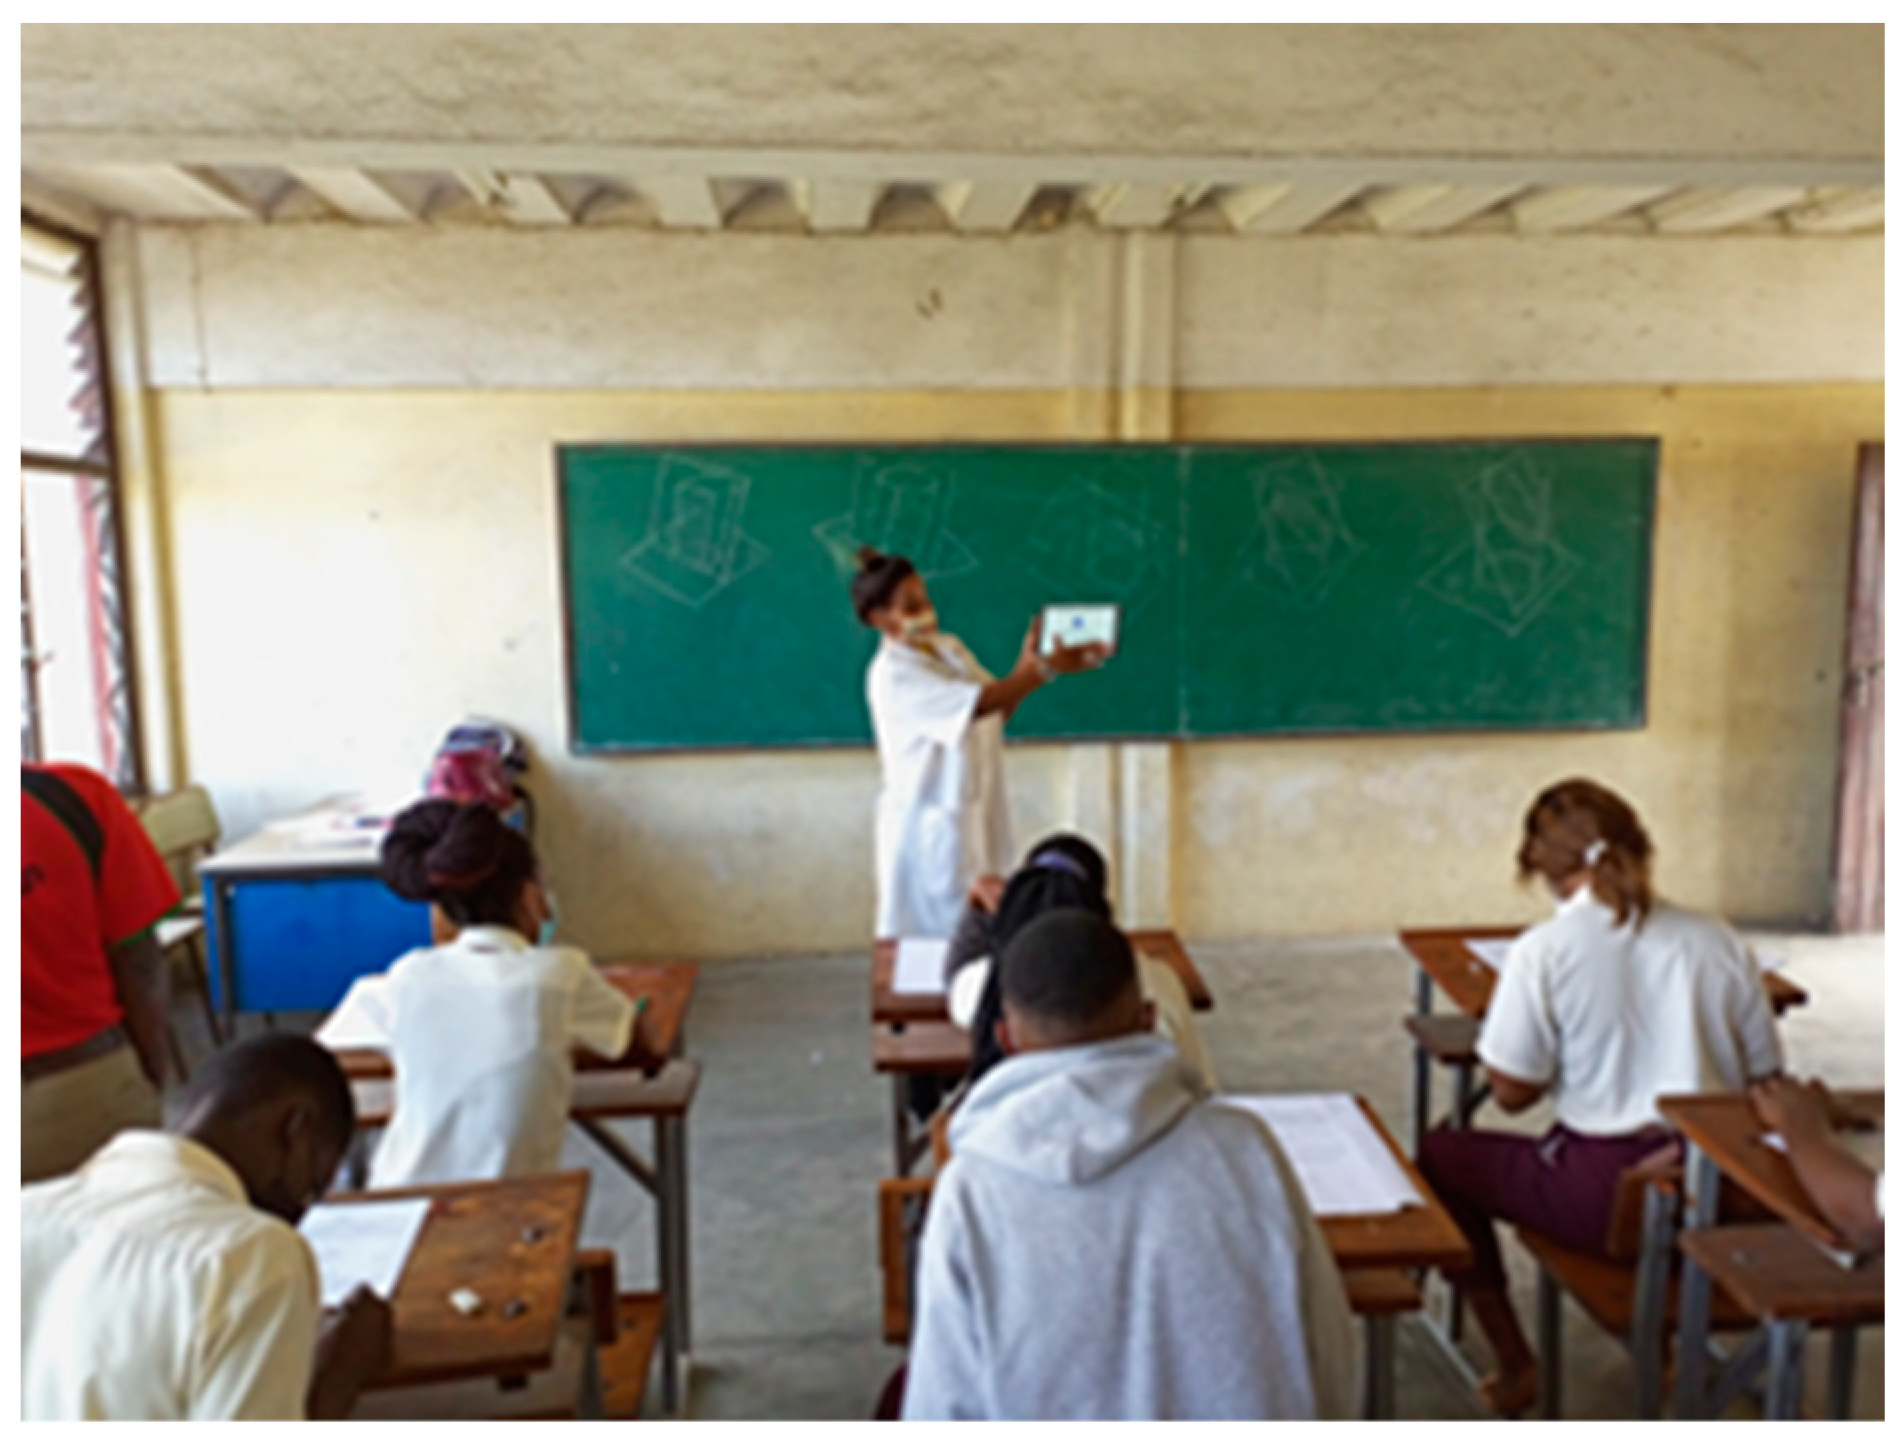
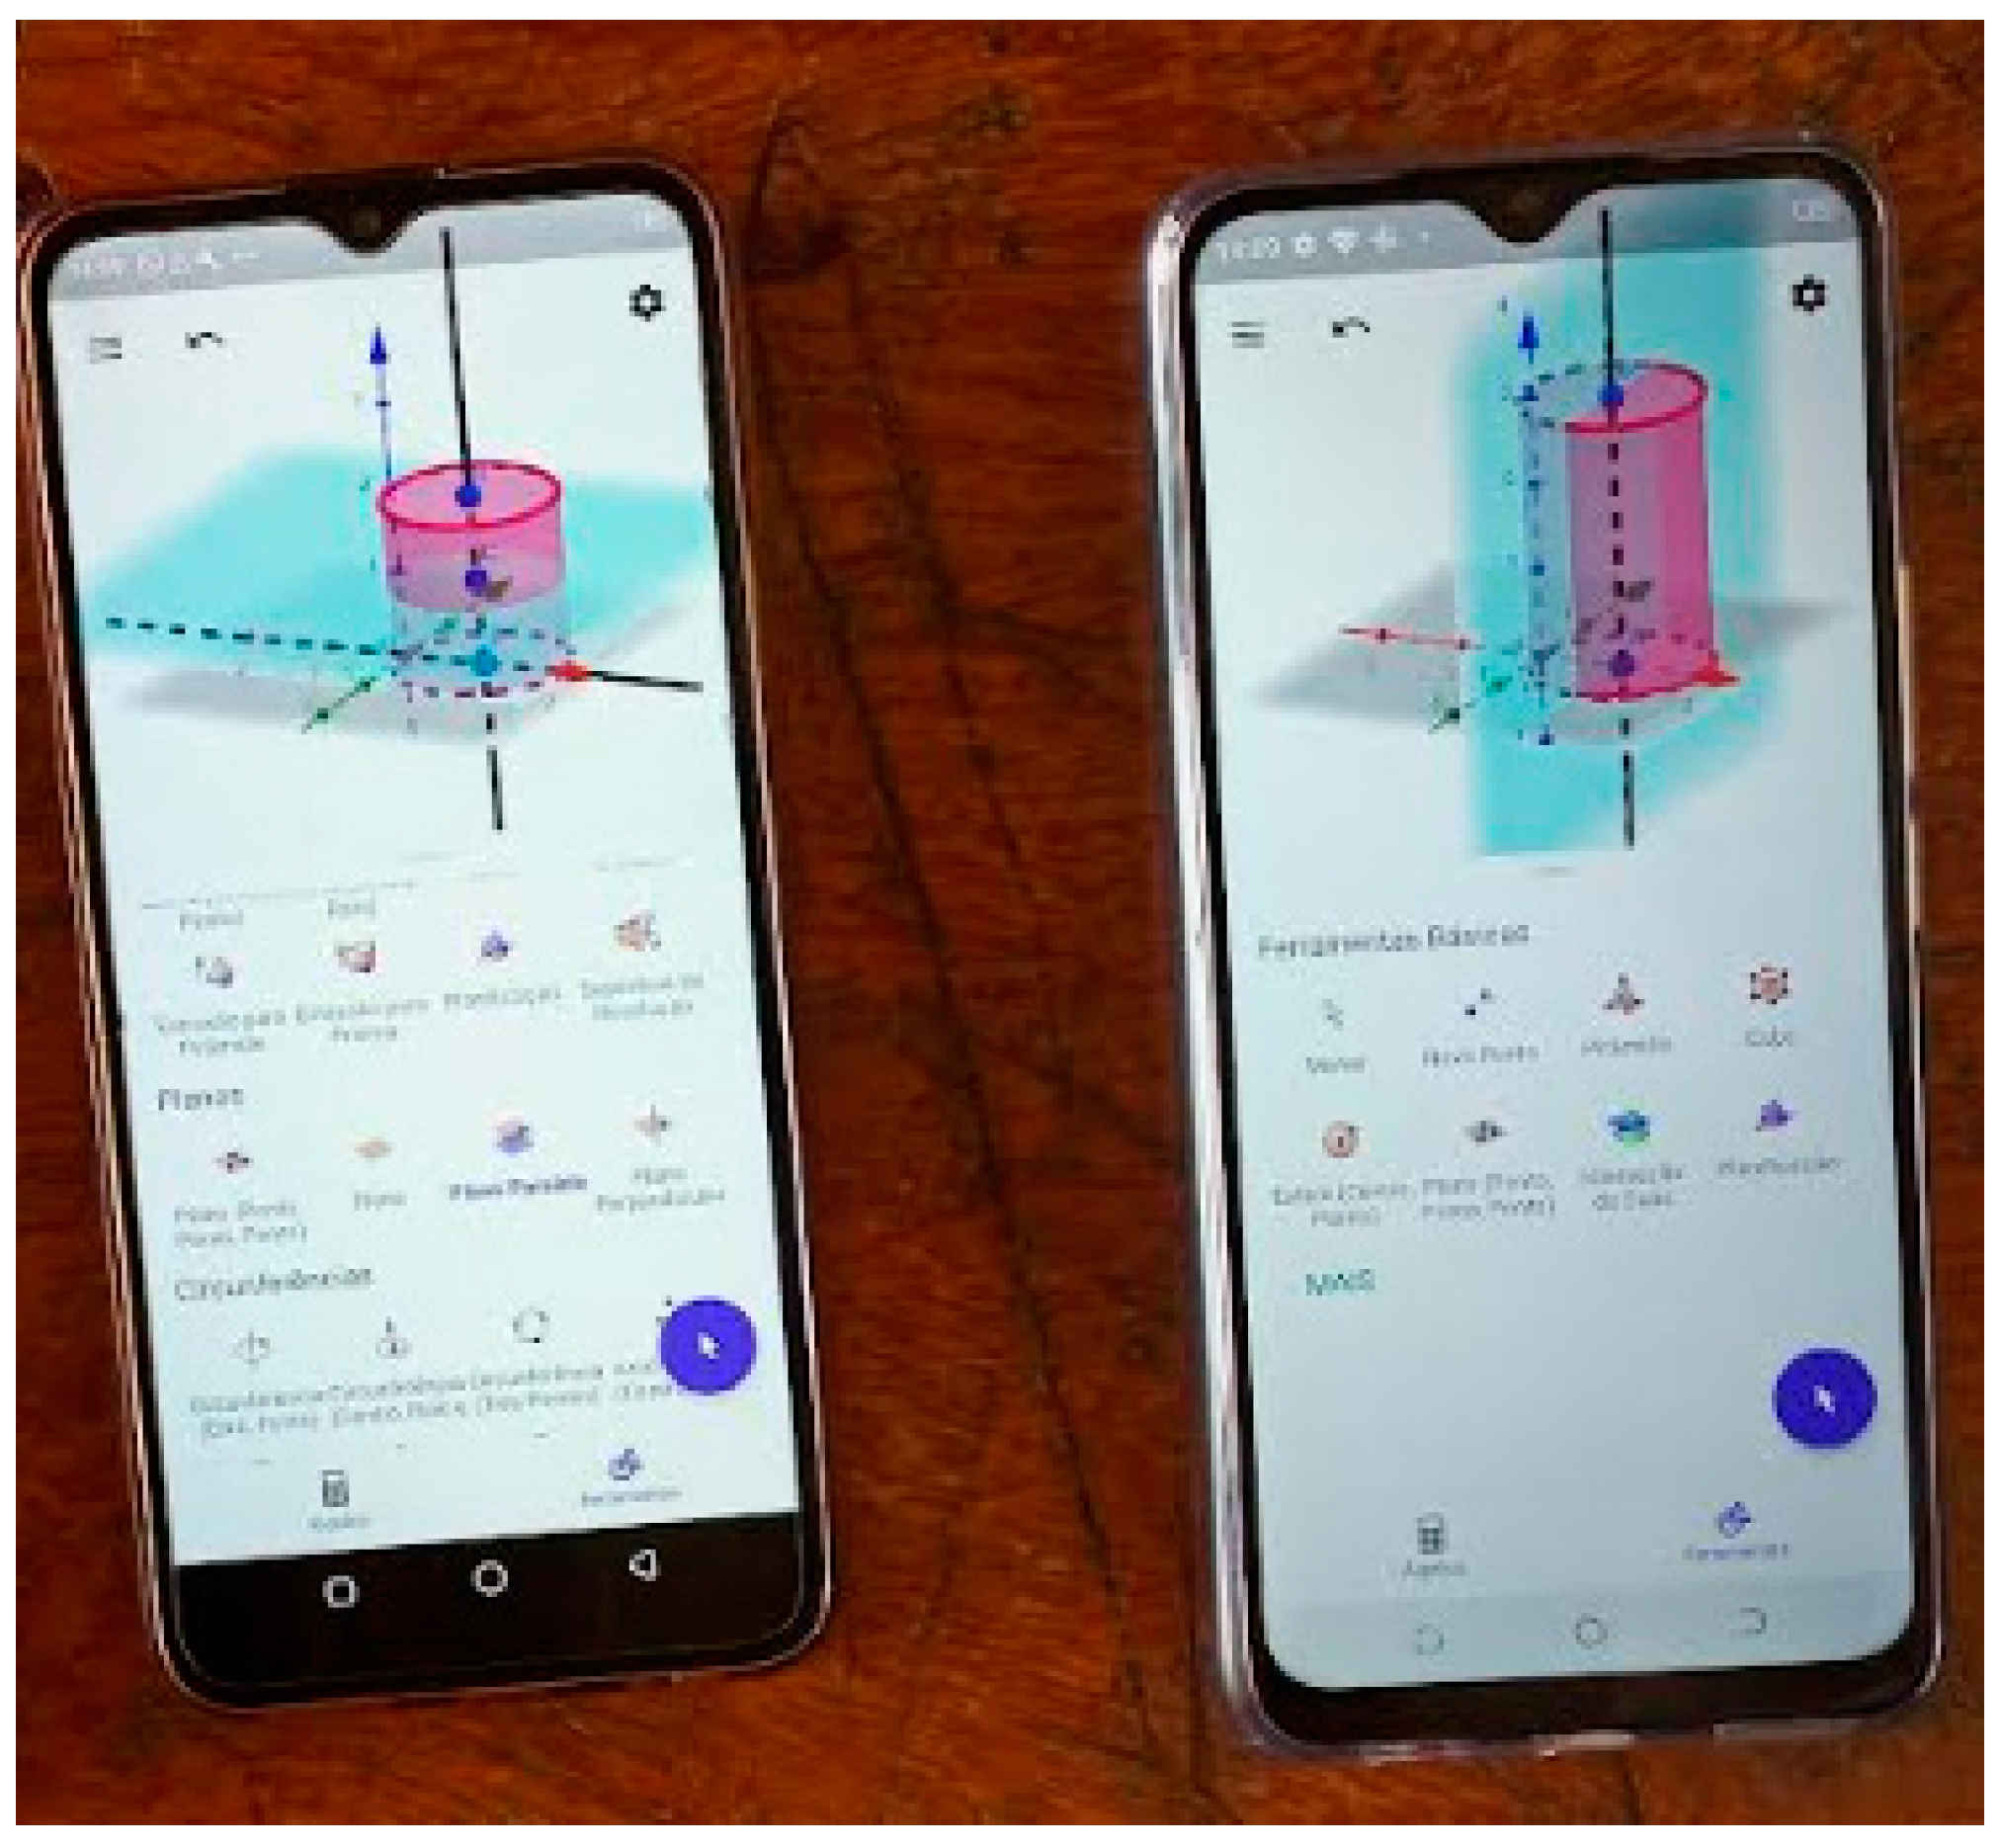
The class used in the experimental was a period of 90 min. The teacher first explained to the students what a cylindrical section would be, then presented what results from two distinct situations: when the cutting plane is parallel to the axis of the surface and when the secant plane is not parallel to the surface axis. At the end of the presentation of the theoretical content, in combination with the dynamic software GeoGebra, the teacher demonstrated the process of 3D construction for the two situations mentioned above (see Figure 5 and Figure 6).
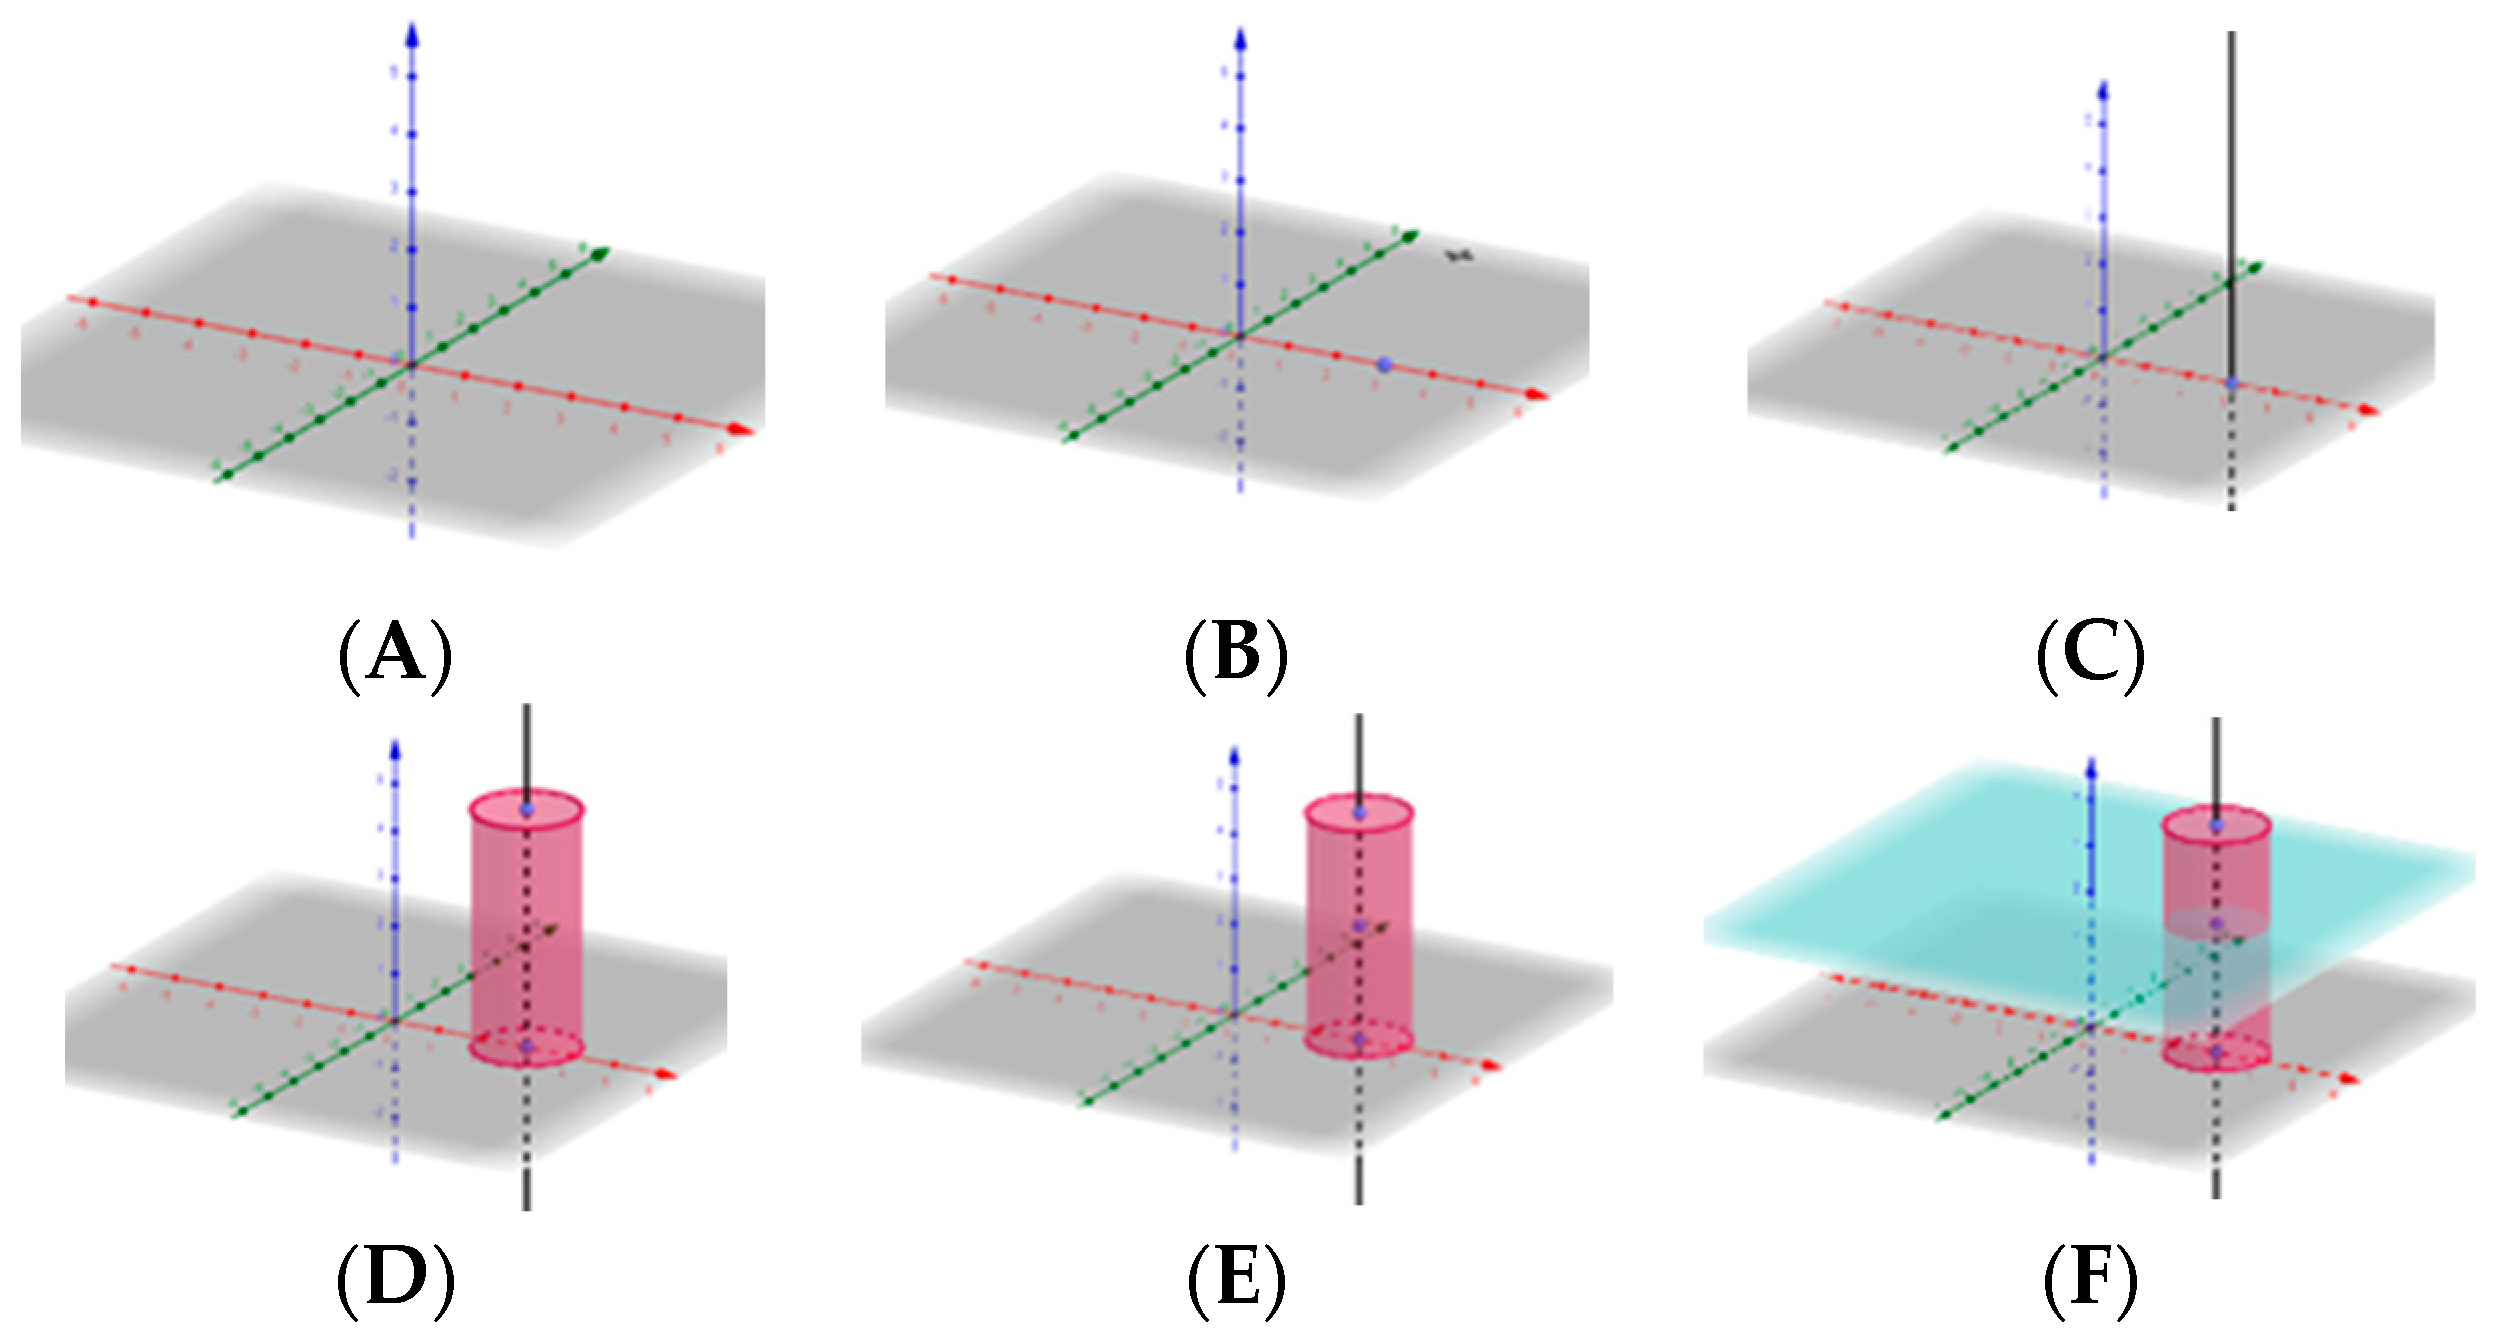
The class was divided into 5 groups under the guidance of a student trainee in each group. With the help of the dynamic software GeoGebra, installed on the smartphone, students constructed the cylinder and the cutting plane with the help of the procedures given below (see Figure 7).
Each point of the script procedures contained, in detail, how to build in color and in 3D. The students interactively simulated the cylinder, modelled in order to obtain the views, visualized all 3D graphics and repeated the exercise in order to gain skills in the handling of GeoGebra tools. In the results of their study, Kramarenko et al. [21] (p. 709) state that:
if a student has not fully mastered GeoGebra tools, it is advisable to provide them with a sheet of paper guiding the algorithm to follow in order to build a construction. Moreover, a student should be supplied with information regarding the icons that correspond to the tools in question. It is appropriate to place QR codes on printable worksheets for demonstrations. The construction on a 2D canvas is rather cumbersome and requires logically justified steps for the construction.
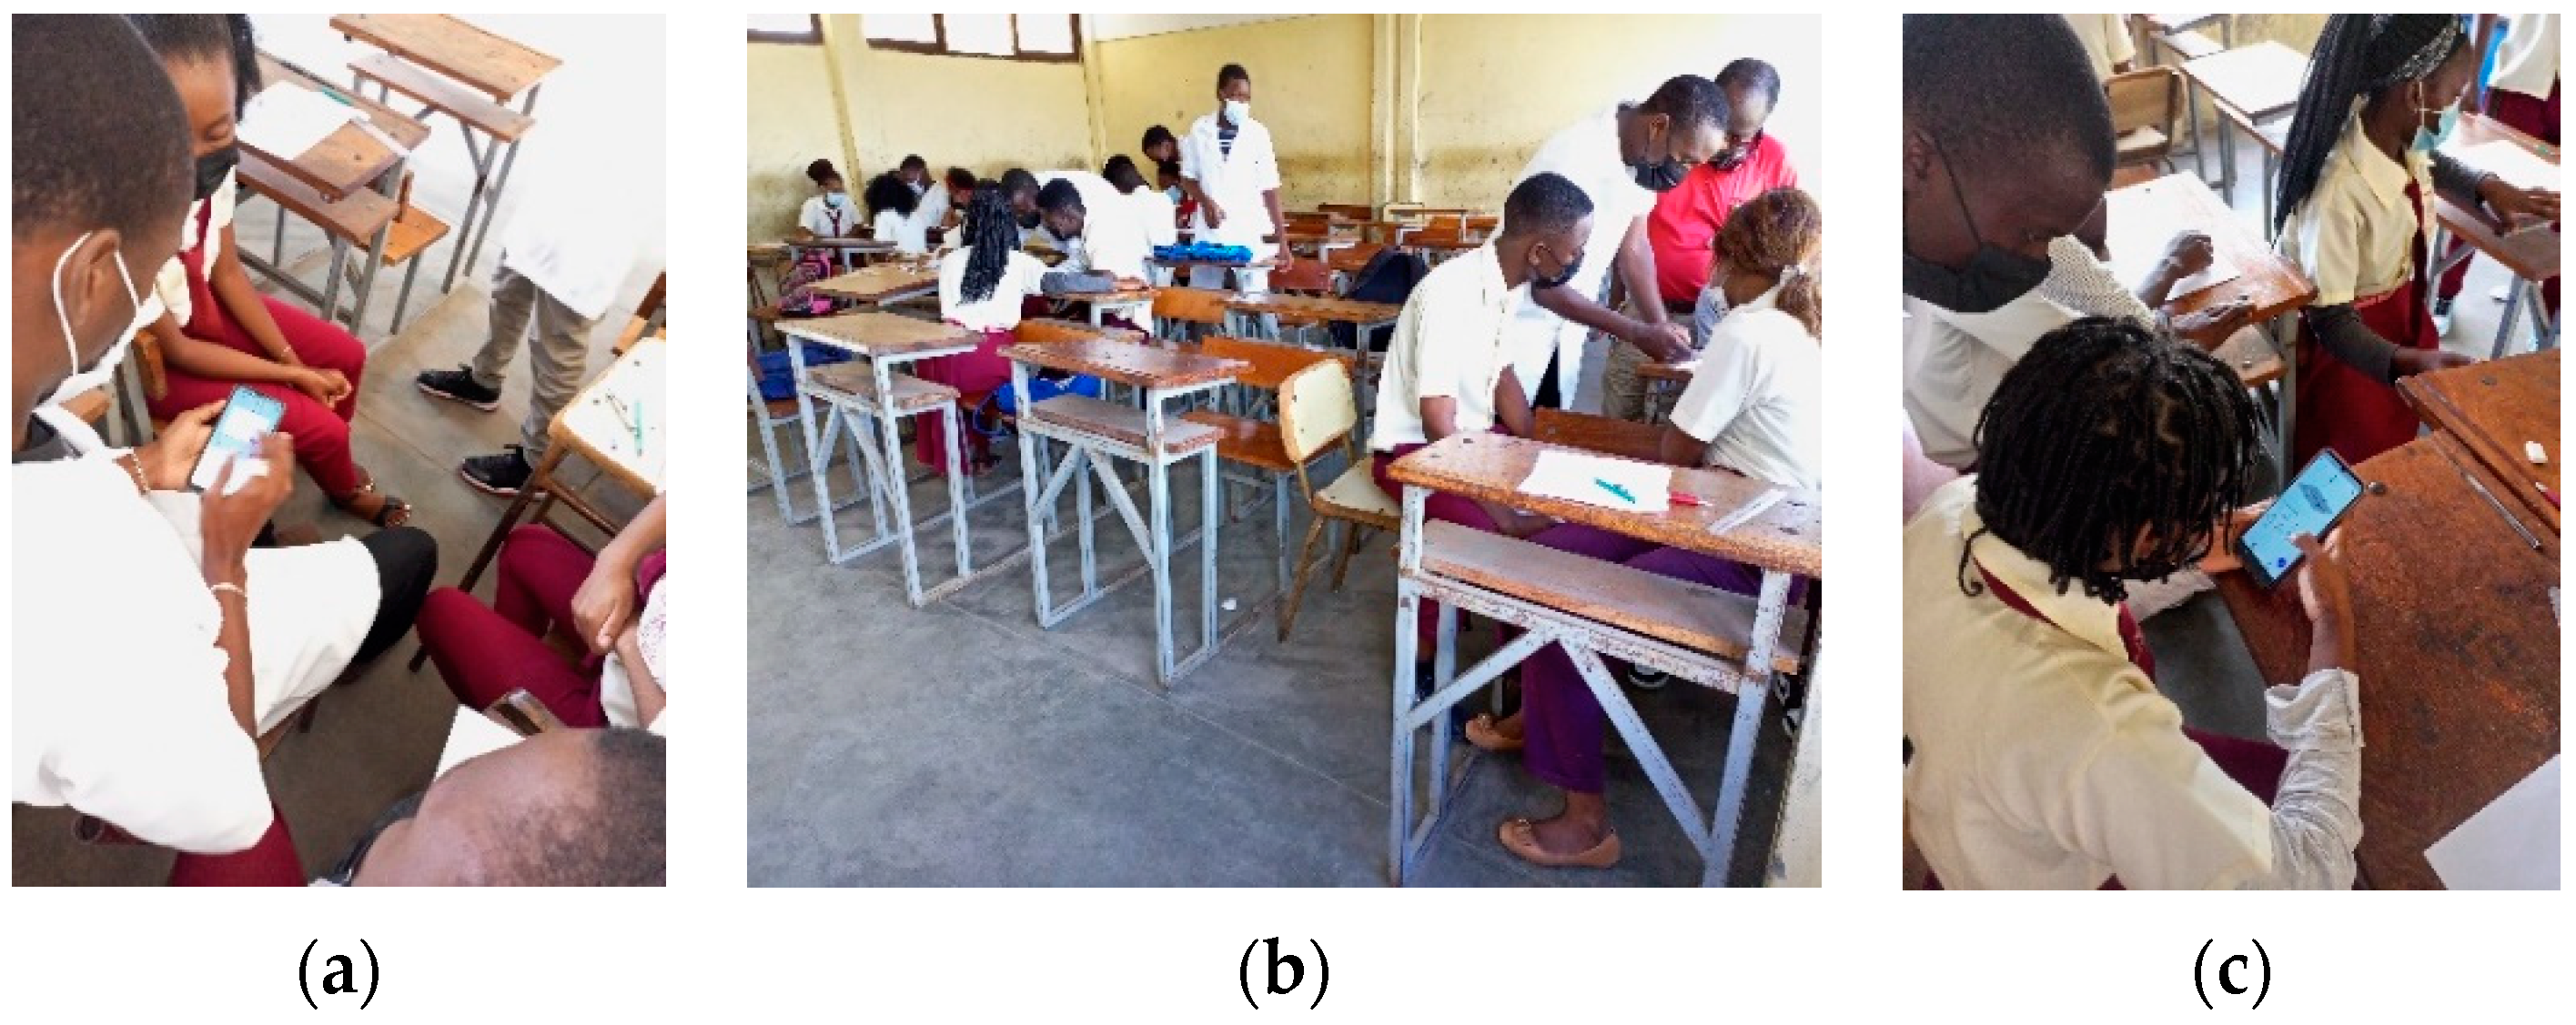
The lesson was interactive in each group and the students simulated TR GeoGebra with the help of the trainee students who guided and paid attention to all students’ difficulties, which encouraged students to feel motivated. At various times, the students showed curiosity and anxiety in handling the smartphone (see Figure 8).
The group work was collaborative and students were able to interact with each other. They demonstrated pleasure in simulating the construction of cylinders. They also experimented with various cutting planes on the same cylinder, which allowed them to compare the different figures that resulted from the cutting.
2.3. Post-Test
The post-test was applied after the presentation of the lesson in order to evaluate the degree of skill acquired after the pre-test and evaluate the level of satisfaction when learning about the sections in cylinders. The class had the opportunity to solve DG problems with the support of GeoGebra software. The post-test exercise was practical, with a scale from 0 to 20 points. The problem was different from the pre-test but was solved in the same 15 min timeframe. The students had to represent a cylinder, with horizontal bases with center 0 (2;5;2), radius 2 cm and height 8 cm, that was sectioned by a 6 cm level plane (see Figure 9).
2.4. Santa Barbara Solids Test
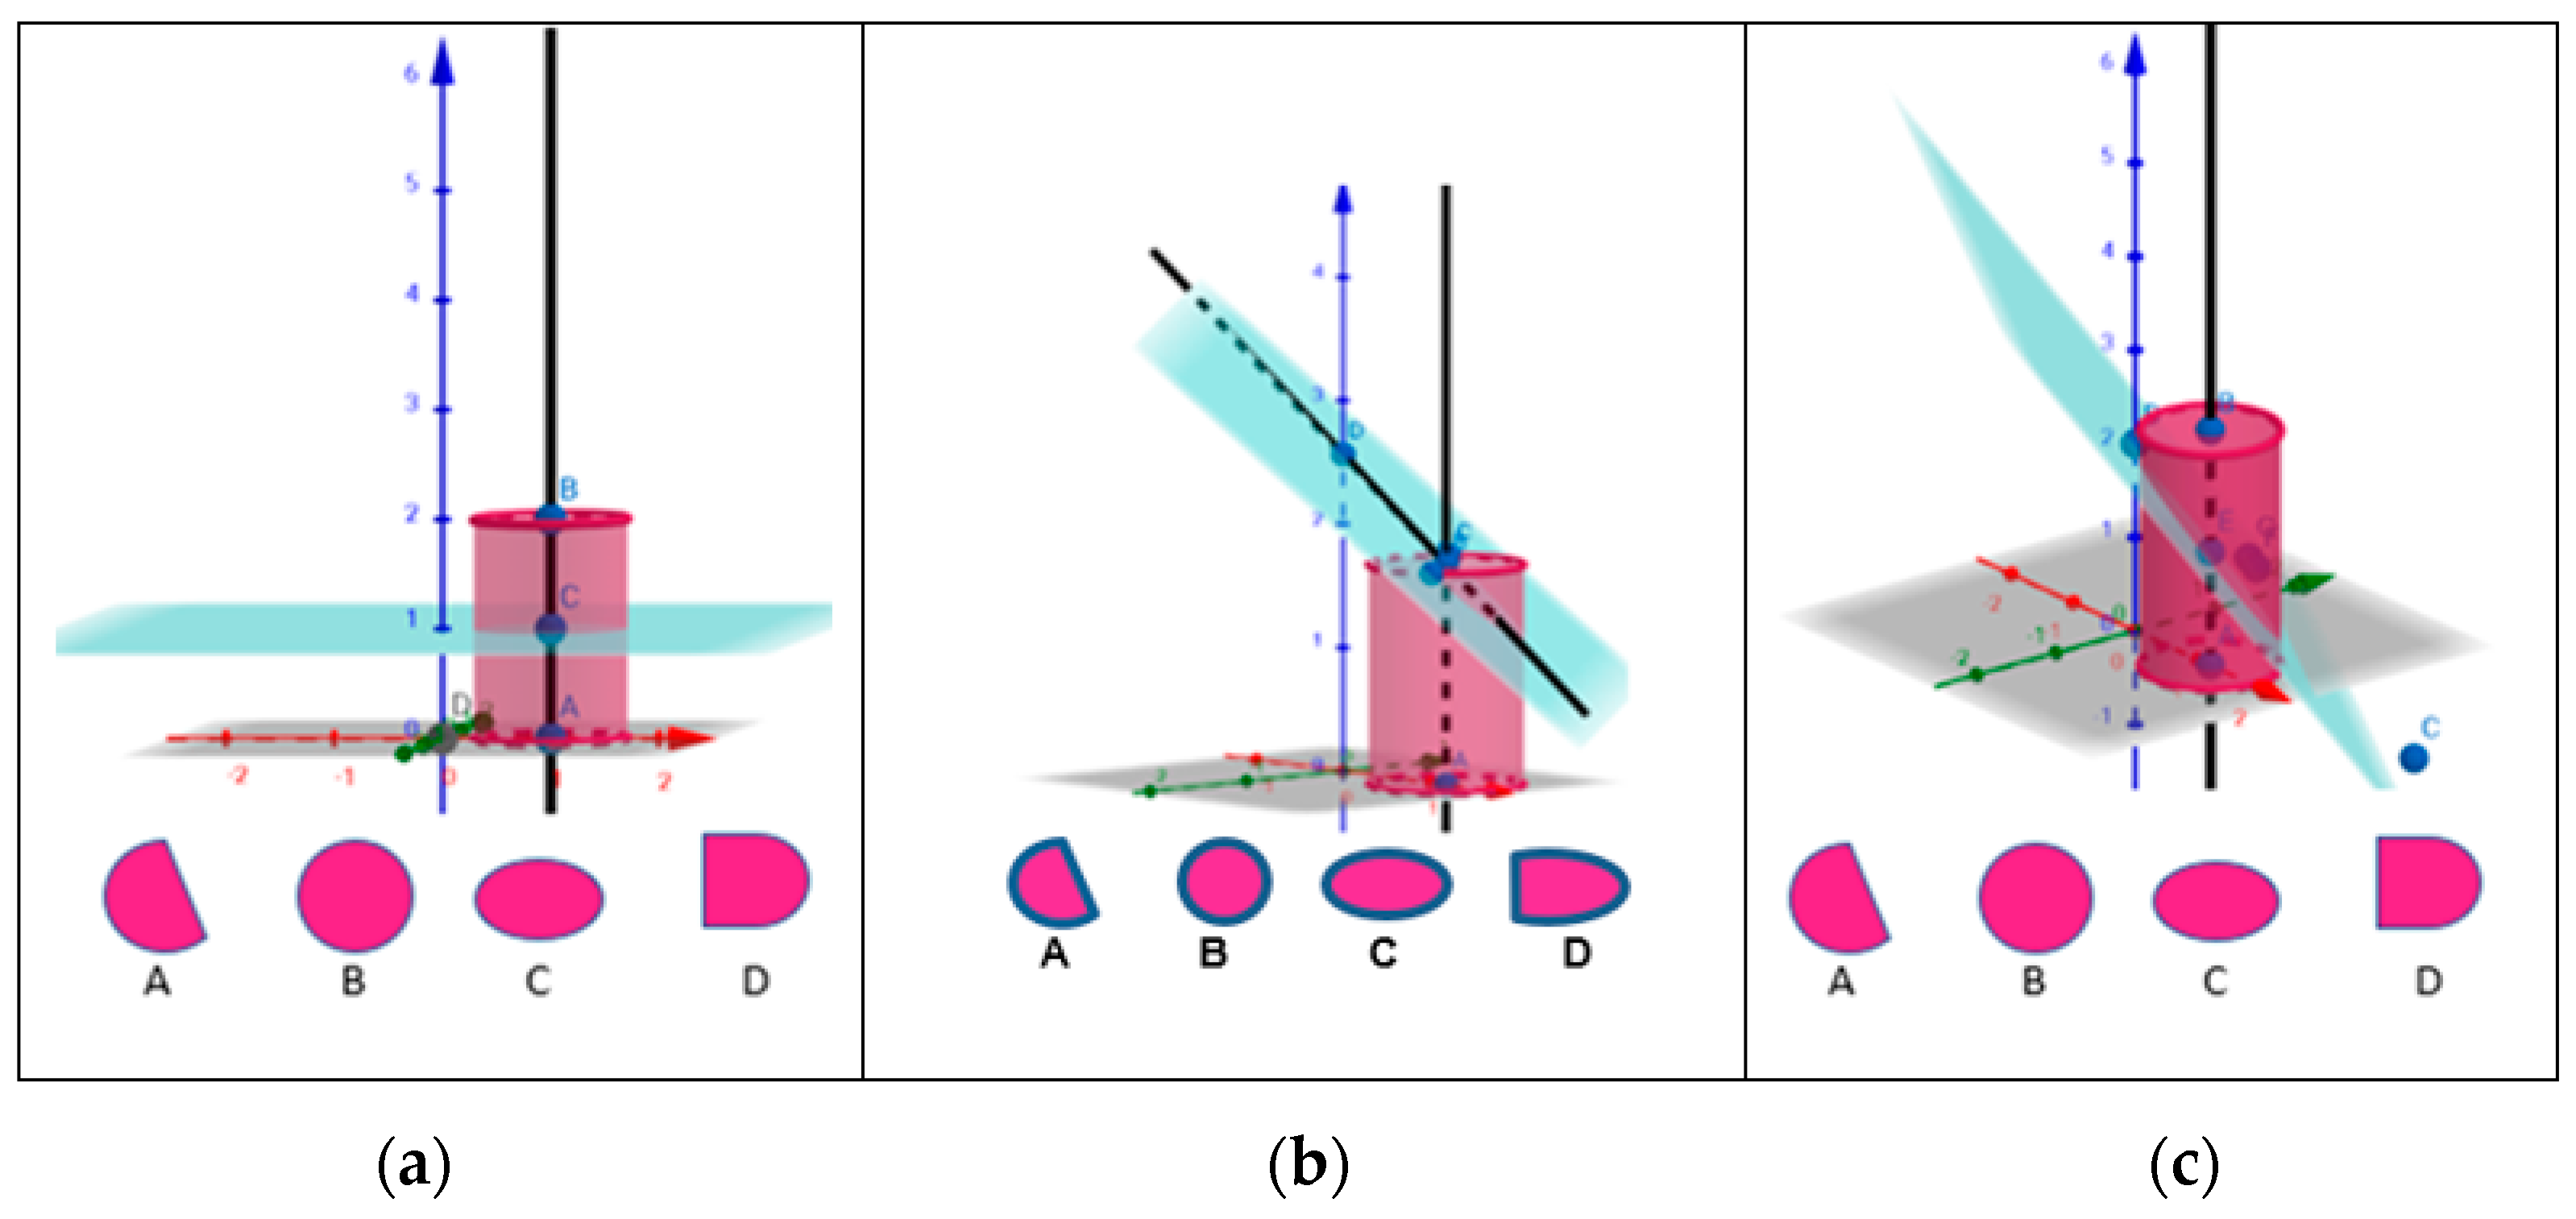
The SBST was applied after the post-test and was conducted in a 15 min timeframe. This instrument aimed to measure the students’ level of SV in studying sections in cylinders. Students had to decipher 3 figure shape choices resulting from a cut caused by 3 different planes in 3 cylinders. The SBST also contained 3 different levels: The first low-level exercise presented a section caused by a level plane. The second mid-level exercise featured a cut resulting from an oblique plane sectioning, positioned so as to enter the top base. The last complex-level exercise also contained an oblique plane but sectioned (in a different position than the mid-level exercise) so as to split the cylinder in half (see Figure 10 and Figure 11).
2.5. Questionnaire
At the end of the lesson, the students solved a questionnaire with an ordered series of open and closed questions to assess whether they already knew GeoGebra and whether the software facilitated the representations of the sections produced in cylinders compared to traditional teaching. This was also performed to help understand the positive and negative aspects that occurred during the lesson and collect classifications of the use of GeoGebra in relation to the following aspects: ease of learning, motivation, efficiency, neutrality, complication in handling and rapid perception.
3. Results and Discussion
Evidence is presented as results of the research which showed that TR GeoGebra brought clarity and dynamics to students in solving problems related to 3D spatial visualization of DG content. This positioning was placed according to observations of the information that occurred in the classroom, from the reality of the school context, the classroom environment, the behavior of the students in solving the DG problems and analysis of the data comparing the pre-test and the post-test. The measurement of student spatial visualization level evaluated with the Santa Barbara Solids Test and the answers to the questionnaire, in particular, were observed with great attention as they describe the first contact and handling of the dynamic software GeoGebra being used on smartphones.
3.1. Comparison of Pre-Test and Post-Test
Both tests contained a practical exercise: the students solving the problem by sketching individually in the pre-test and, in the post-test, with the help of GeoGebra (see Table 1).
The table data indicates the grades assigned in the pre-test and post-test practice exercises. The evaluation was made on a scale from 0 to 20. Analysis of the descriptive comparison for the total average of the students indicates that there was an improvement from values of 5.28 to 11.28. It can be verified that the same happens for the median where there was an improvement from a value of 5 to 15. The minimum value of both tests was equal to 2, the maximum value of the pre-test was 13 and the post-test was equal to 19. It can be seen that there has been an improvement in learning in general.
3.2. Analysis of the Santa Barbara Solids Test
The SBST measured the level of SV of the students in relation to the study of sections in cylinders. The students solved the test by selecting the correct answer for the figures resulting from cuts caused by three planes in different positions in three cylinders of different levels (see Table 2).
The table shows, in general, that boys and girls obtained higher correct scores at the low and middle level as opposed to the complex level, where the wrong answers have the highest score. Observing the three levels for each sex, the result makes us realize that boys had better scores in relation to girls. This observation leads us to agree with several studies that state that boys have greater capacity for SV than girls. Fiantika et al. [26] (p. 3) state that:
by choosing a visual subject, students are expected to optimize spatial thinking that is closely related to visualization. Boys do better in in space than the girls. Thus, besides exploring the spatial thinking of students, the author also distinguishes between boys’ and girls’ work to provide comprehensive information.
A medium level of SV was measured by the SBST after the lesson and by the post-test. In relation to this, Cohen and Bairaktarova [23] (p. 16) state that:
in our study, the SBST Showed promise for diagnosing difficulties and strategies demonstrated by students who are challenged by spatial visualization. We suggest applications of the SBST to support remedial spatial training by including in spatial reasoning instruction, strategy learning and achieving fluency with solid geometrical shapes.
3.3. Analysis of the Results of the Questionnaire
The answers for nine questions were analyzed, of which three were open and six closed. All questions asked were answered by the 25 students. The answers suggest that the TR GeoGebra was well received and simulated by the students and brought an increase in learning about the sections in cylinders while promoting 3D SV (see Table 3).
Regarding the first question in the table, 92% of the students stated that they did not know the dynamic software GeoGebra. Regarding the second question that sought to determine whether GeoGebra software facilitated the representations of the sections produced in geometric solids, it was found that 100% responded positively. Méxas et al. [5] (p. 220) explained that “we can state that the educational software GeoGebra also helps in the learning process, because it is not only easy to handle but also interactive, allowing the student to immediate change of point of view, increasing the understanding of the solid”. In the third question, that reflected on the option of using GeoGebra or use of the traditional model, 92% of the students answered that they preferred to use GeoGebra. Baranová and Katrenicová [8] (p. 30) report that “teaching by using the dynamic geometry software has a great potential to improve spatial visualization skills and has more positive effect on problem solving and spatial skills of students than traditional method”. Regarding the fourth open question, about the justification of the positioning of the previous answer, the results were satisfactory and students stated that they liked to handle the TR GeoGebra when solving the problems in the exercise because, due to the experience they had in the lesson, it was easier to understand the sectioned figures compared to the traditional model that was difficult for them. They also mentioned that GeoGebra is beneficial and interesting for its ease of handling, easy visualization of points and speed when constructing the cylinder in its 3D representation. They also classified GeoGebra as an application that motivates learning through the visualization of 3D figures, facilitates the perception of the sections used in exercises, projects the figures without having to make much mental effort, allows you to see the details of the solid in different views and has all the necessary tools for the construction of the elements of DG. Tretyakova et al. [11] (p. 4) argued that:
moreover, modern graphics systems allow not only to design, but also to manipulate the created object, modify it, resorting to various materials of various structures, textures, using a wide palette of colours, artificially set the conditions and circumstances, up to the extreme, which may be the object of design. Simulating, thus, different life situations, the designer can clearly see the advantages and disadvantages of the project, having the opportunity to implement it, to correct the short-comings, eliminating the possibility of fatal errors after the construction of the object.
These advantages suggest that students fit better into the model with the help of 3D TRs. For the fifth question, that was intended to gather information about the ease and usability of GeoGebra, 92% of the students answered positively. Salcedo [19] (p. 117) argues that:
based on the experience of this group in technical drawing at the secondary school level, there is an almost unanimous preference for GeoGebra. almost unanimous preference for GeoGebra as a work tool; particularly the possibility of undoing constructions and the possibility of undoing constructions and experimenting with the initial data of the exercises, as well as the possibility of undoing constructions and experimenting with the initial data of the exercises, as well as the naturalness with which principles and procedures can be checked.
Regarding the sixth open question, that was proposed to indicate two positive aspects that occurred in the lesson, the students reported: good explanations and a lot of patience on the part of the teacher’s team; learning in the handling of GeoGebra; in-depth perception of the cylinder level plane section in the visualization of the inside of the solid; their minds opened and evolved; it promoted reasoning for solving DG problems; motivation in learning DG; promotion of spatial visualization of 3D solids; and stimulation of attention in exercises through GeoGebra. The most important thing is that they managed to get the idea of the exercise before building on the two-dimensional plane. The results obtained in the sixth open question, that indicated two negative aspects of the lesson, few students stated that, at the beginning of the lesson, it was a little complicated to grasp the graphic construction of the cylinder in TR GeoGebra. A few of them also considered the learning time when handling GeoGebra to be short. For those who commented that the time was short, it was explained that solving the DG exercises requires a lot of concentration when defining the desired graphics in GeoGebra. The eighth question was to classify the use of GeoGebra in relation to the following aspects: facilitation of learning, motivation and rapid perception. A total of 56% of students said it facilitated learning, 16% of students said it was motivating and 28% of students answered that it enabled quicker perception. Pejić et al. [10] (p. 1818) argue in the results of their study that students “considered that lectures did not help much in the preparation of graphical tasks. Lectures are carried out by classical methods, the solution to the problem being given gradually with drawing on the blackboard. The teacher devotes a lot of time to the teaching and learning process”. This vision leads us to believe that the traditional method that only relies on the blackboard (in Mozambique) makes the learning process tiring. In the last question, that was to classify how learning flowed with the help of GeoGebra, 84% of students said it was efficient, 8% said it was neutral and 8% said it was complicated. Condori et al. [27] (p. 258), in the conclusion of their study, reported that “the software generated a great interest and motivation in the pedagogical activities. With the use of GeoGebra a level of effective understanding is acquired in the development of geometry”.
The results suggest that the dynamic software GeoGebra brought clarity and motivation to the students in solving 3D DG problems. All data collected in the classroom, as discussed throughout the research process, led to the search for modern and technological 3D alternatives for the promotion of 3D visualization in the study of cylinder sections. Osypova and Tatochenko [28] (p. 179) argue that “now, in the leading countries of the world, there is a sharp modernization of educational processes and a modern school, both higher and secondary, cannot stand aside”.
4. Conclusions
The implementation of the dynamic software GeoGebra in the study of sections in cylinders can promote spatial visualization in students. These spatial skills are developed through simulations of practical exercises in the dynamic software GeoGebra by allowing 3D graphical representation. This 3D representation generated great interest and motivation for the students in the practical activities and facilitated the understanding of spatial visualization. This study guides future investigations around the complex content of DG with the goal of facilitating the learning process in an interactive way.
Author Contributions
Investigation, P.C.; Methodology, A.A.S.; Software, C.H.C. All authors have read and agreed to the published version of the manuscript.
Funding
This research was funded by Calouste Gulbenkian Foundation, grant number 257640 and APC was funded by Calouste Gulbenkian Foundation.
Institutional Review Board Statement
Not applicable.
Informed Consent Statement
Informed consent was obtained from all subjects involved in the study.
Acknowledgments
The first author thanks the Calouste Gulbenkian Foundation, under the PALOP and East Timor training support program. In addition, the last author thanks the Portuguese Funds through FCT-Fundação para a Ciência e a Tecnologia, within the Projects UIDB/00013/2020, UIDP/00013/2020 and UIDB/00194/2020.
Conflicts of Interest
The authors declare no conflict of interest.
References
- Garganté, B.; Meneses, A.; Naranjo, J.; Tamarit, G.C. Technology use for teaching and learning. Rev. Medios Educ. 2015, 45, 9–24. [Google Scholar] [CrossRef]
- Wahab, R.A.; Abdullah, A.H.; Abu, M.S.; Atan, N.A.; Mokhtar, M.; Hamzah, M.H. Rectracted: A learning 3D geometry through sketchup make (SPPD-SUM) to enhance visual spatial skills and the level of geometric thinking. J. Fundam. Appl. Sci. 2018, 10, 1005–1039. [Google Scholar] [CrossRef]
- Di Paola, F.; Pedone, P.; Pizzurro, M.R. Digital and interactive Learning and Teaching methods in descriptive Geometry. Procedia-Soc. Behav. Sci. 2013, 106, 873–885. [Google Scholar] [CrossRef] [Green Version]
- Suzuki, K. Traditional descriptive geometry education in 3D-CAD/CG Era. J. Geom. Graph. 2014, 18, 249–258. [Google Scholar]
- Méxas, J.G.F.; Guedes, K.B.; da Silva Tavares, R. Stereo orthogonal axonometric perspective for the teaching of Descriptive Geometry. Interact. Technol. Smart Educ. 2015, 12, 222–240. [Google Scholar] [CrossRef] [Green Version]
- Voronina, M.V.; Tretyakova, Z.O.; Moroz, O.N.; Folomkin, A.I. Descriptive Geometry in Educational Process of Technical University in Russia Today. Int. J. Environ. Sci. Educ. 2016, 11, 10911–10922. Available online: https://files.eric.ed.gov/fulltext/EJ1120619.pdf (accessed on 19 September 2016).
- Moreno, R.; Bazán, A.M. Automation in the teaching of descriptive geometry and CAD. High-level CAD templates using script languages. IOP Conf. Ser. Mater. Sci. Eng. 2017, 245, 062040. [Google Scholar] [CrossRef]
- Baranová, L.; Katrenicová, I. Role of Descriptive geometry course in development of students’ spatial visualization skills. Ann. Math. Inform. 2018, 49, 21–32. [Google Scholar] [CrossRef]
- Ma’rifatin, S.; Amin, S.M.; Siswono, T.Y.E. Students’ mathematical ability and spatial reasoning in solving geometric problem. J. Phys. Conf. Ser. 2019, 1157, 042062. [Google Scholar] [CrossRef]
- Pejić, P.; Stojiljković, S.; Dosković, M. Advanced teaching methods application and its benefits in descriptive geometry at the faculty of civil engineering and architecture niš. Teh. Vjesn. 2019, 26, 1814–1820. [Google Scholar] [CrossRef]
- Tretyakova, Z.O.; Voronina, M.V.; Merkulova, V.A. Geometric modelling of building forms using BIM, VR, AR-technology. IOP Conf. Ser. Mater. Sci. Eng. 2019, 687, 044048. [Google Scholar] [CrossRef]
- Anamova, R.R.; Leonova, S.A.; Nartova, L.G.; Tereshchenko, V.P. Digital Spatial Models in Technology as a Development Tool of the Intellectual Creative Aspect within Education. TEM J. 2020, 9, 1186–1193. [Google Scholar] [CrossRef]
- Klemer, A.; Rapoport, S. Origami and GeoGebra activities contribute to geometric thinking in second graders. EURASIA J. Math. Sci. Technol. Educ. 2020, 16, em1894. [Google Scholar] [CrossRef]
- Chivai, C.H.; Soares, A.A.; Catarino, P. Qubism 3D Modeling in Teaching Orthogonal Projections. In Proceedings of the Edulearn21 Proceedings, Seville, Spain, 6 July 2021. [Google Scholar] [CrossRef]
- Papakostas, C.; Troussas, C.; Krouska, A.; Sgouropoulou, C. Exploration of Augmented Reality in Spatial Abilities Training: A Systematic Literature Review for the Last Decade. Inform. Educ. 2021, 20, 107–130. [Google Scholar] [CrossRef]
- Wahab, R.A.; Abdullah, A.H.; Mokhtar, M.; Atan, N.A.; Abu, M.S. Evaluation by experts and designated users on the learning strategy using sketchup make for elevating visual spatial skills and geometry thinking. Bolema Bol. Educ. Mat. 2017, 31, 819–840. [Google Scholar] [CrossRef] [Green Version]
- Rodríguez, M.U.; Cantabrana, J.L.; Cervera, G. Mercè Validation of a tool for self-evaluating teacher digital competence. Educ. XX1 2021, 24, 353–373. [Google Scholar] [CrossRef]
- Lamb, R.L.; Annetta, L.; Firestone, J.; Etopio, E. A meta-analysis with examination of moderators of student cognition, affect, and learning outcomes while using serious educational games, serious games, and simulations. Comput. Hum. Behav. 2018, 80, 158–167. [Google Scholar] [CrossRef]
- Salcedo, J.L.C. Representación de la recta en el Sistema de Monge con el apoyo de GeoGebra: Una experiencia didáctica. Rev. Inst. GeoGebra Int. São Paulo 2019, 8, 102–118. [Google Scholar] [CrossRef] [Green Version]
- Dere, H.E.; Kalelioglu, F. The Effects of Using Web-Based 3D Design Environment on Spatial Visualisation and Mental Rotation Abilities of Secondary School Students. Inform. Educ. 2020, 19, 399–424. [Google Scholar] [CrossRef]
- Kramarenko, T.; Pylypenko, O.; Muzyka, I. Application of GeoGebra in Stereometry teaching. CEUR Workshop Proc. 2020, 2643, 705–718. Available online: https://ds.knu.edu.ua/jspui/handle/123456789/2670 (accessed on 19 September 2016).
- Omar, M.; Ali, D.F.; Nasir, A.N.; Sunar, M.S. AREDApps: Integrating mobile augmented reality. in orthographic projection teaching and learning. Int. J. Recent Technol. Eng. 2019, 8, 821–825. [Google Scholar]
- Cohen, C.; Bairaktarova, D. A cognitive approach to spatial visualization assessment for first-year engineering students. Eng. Des. Graph. J. 2018, 82, 1–19. Available online: http://www.edgj.org (accessed on 19 September 2016).
- Dutra, H.S.; Reis, V.N. Desenhos de estudos experimentais e quase-experimentais: Definições e desafios na pesquisa em enfermagem. Rev. Enferm. UFPE 2016, 10, 2230–2241. [Google Scholar] [CrossRef]
- Timbane, S.A.; Axt, M.; Alves, E. O celular na escola: Vilão ou aliado. Nuevas Ideas Inf. Educ. TISE 2015, 1, 768–773. [Google Scholar]
- Fiantika, F.R.; Maknun, C.L.; Budayasa, I.K.; Lukito, A. Analysis of students’ spatial thinking in geometry: 3D object into 2D representation. J. Phys. Conf. Ser. 2018, 101, 012140. [Google Scholar] [CrossRef] [Green Version]
- Condori, A.P.; Velazco, D.J.M.; Fernández, R.A. GeoGebra as a Technological Tool in the Process of Teaching and Learning Geometry. In Proceedings of the Information and Communication Technologies, Guayaquil, Ecuador, 25–27 November 2020; Springer: Cham, Switzerland, 2020; pp. 258–271. [Google Scholar] [CrossRef]
- Osypova, N.V.; Tatochenko, V.I. Improving the learning environment for future mathematics teachers with the use application of the dynamic mathematics system GeoGebra AR. In Proceedings of the CEUR Workshop Proceedings, Kryvyi Rih, Ukraine, 11 May 2021. [Google Scholar]
Figure 1.
Representation of a cylinder in the dynamic software GeoGebra.

Figure 2.
The Santa Barbara Solids Test contains four options in different forms, namely A, B, C or D, of which the correct answer is the one representing the part sectioned by the level cutting plane.
Figure 2.
The Santa Barbara Solids Test contains four options in different forms, namely A, B, C or D, of which the correct answer is the one representing the part sectioned by the level cutting plane.

Figure 3.
Shapes of the section figure produced in cylinders.

Figure 4.
(a) Pre-test exercise; (b) student solving the pre-test.

Figure 5.
During presentation using the dynamic software GeoGebra.

Figure 6.
Secant plane not parallel to the surface axis and secant plane parallel to the surface axis represented in the dynamic software GeoGebra.
Figure 6.
Secant plane not parallel to the surface axis and secant plane parallel to the surface axis represented in the dynamic software GeoGebra.

Figure 7.
Procedures for building a level-plane cylinder section. (A) Planes, (B) point, (C) recta, (D) Cylinder, (E) point for the cutting plane and (F) Parallel plane of Level.
Figure 7.
Procedures for building a level-plane cylinder section. (A) Planes, (B) point, (C) recta, (D) Cylinder, (E) point for the cutting plane and (F) Parallel plane of Level.

Figure 8.
Simulated exercises in GeoGebra. (a–c) Environment of the groups handling GeoGebra on the smartphone.
Figure 8.
Simulated exercises in GeoGebra. (a–c) Environment of the groups handling GeoGebra on the smartphone.

Figure 9.
Post-test moment. (a,b) Post-test exercise; (c) student completing the post test.

Figure 10.
(a) Low level Santa Barbara Solids Test; (b) medium level Santa Barbara Solids Test; (c) complex level Santa Barbara Solids Test.
Figure 10.
(a) Low level Santa Barbara Solids Test; (b) medium level Santa Barbara Solids Test; (c) complex level Santa Barbara Solids Test.

Figure 11.
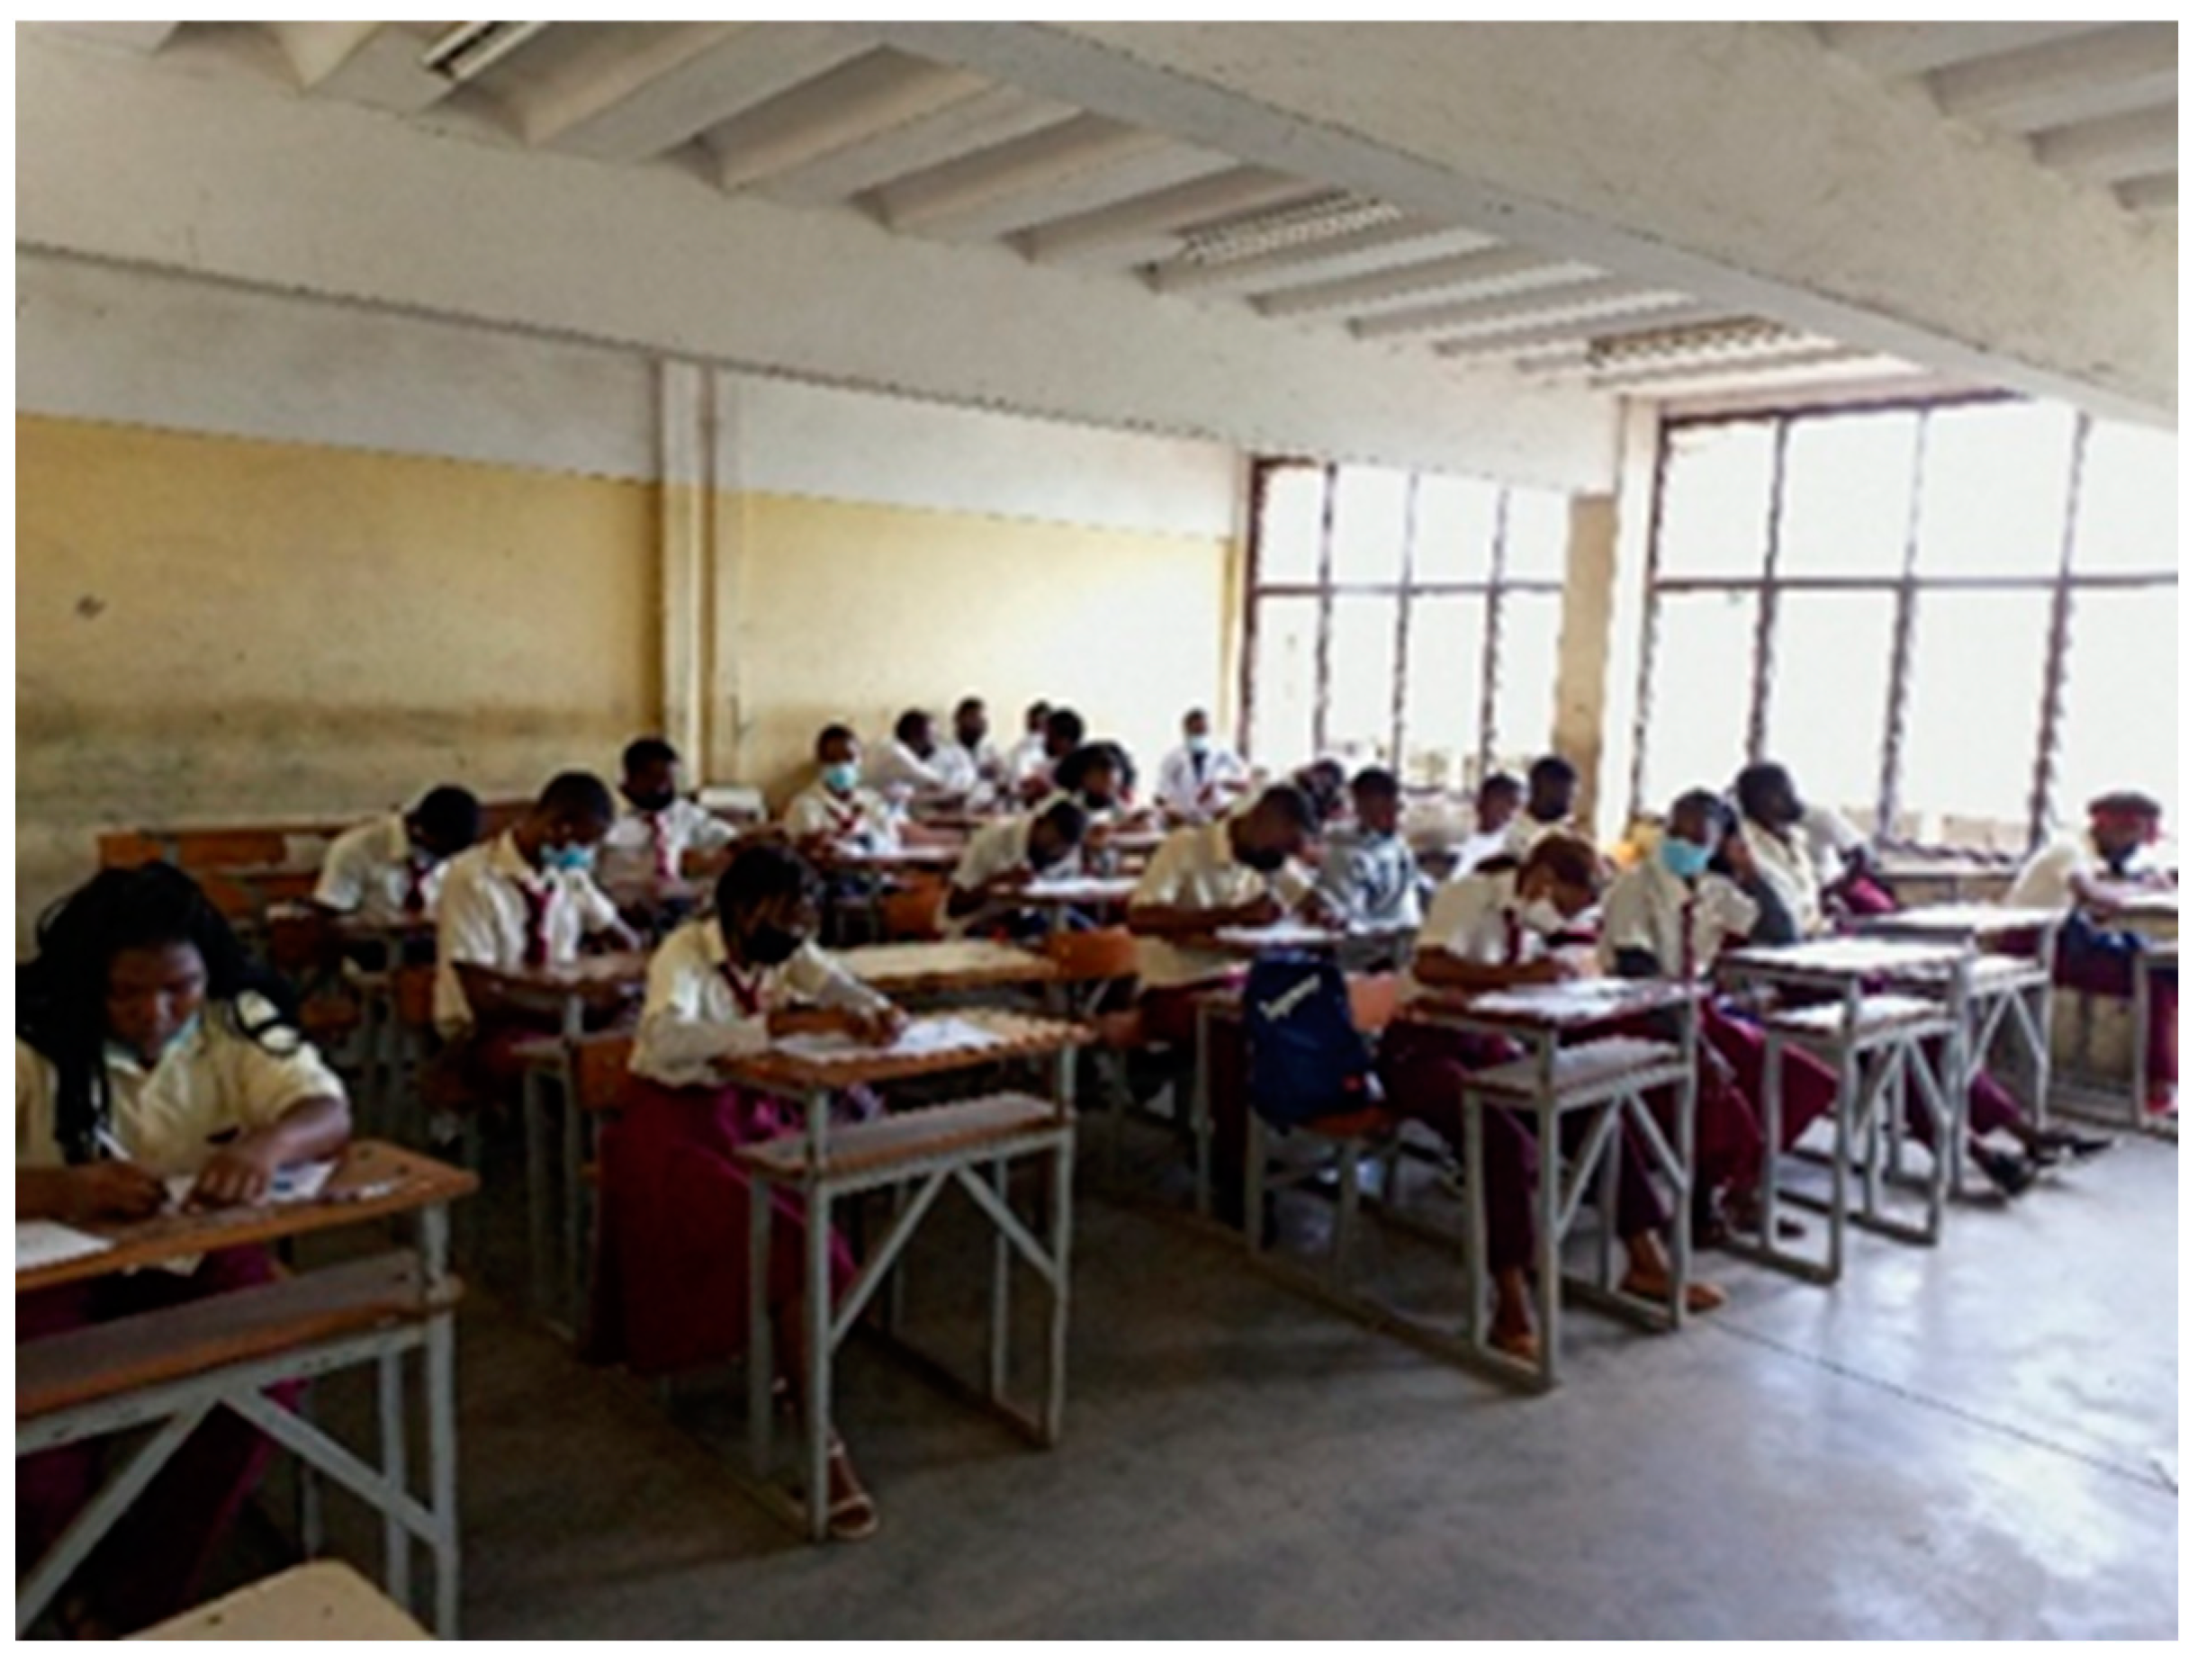
Moment of solving the Santa Barbara Solids Test. Students solving the Santa Barbara Solids Test.
Figure 11.
Moment of solving the Santa Barbara Solids Test. Students solving the Santa Barbara Solids Test.


Table 1.
Comparison of pre-test and post-test.
| Description | Boys | Girls | Total (Boys and Girls) | |||
|---|---|---|---|---|---|---|
| Pre-Test | Post-Test | Pre-Test | Post-Test | Pre-Test | Post-Test | |
| Mean | 5.5 | 12.74 | 5 | 10.18 | 5.28 | 11.28 |
| Median | 5 | 15 | 5 | 7 | 5 | 15 |
| Moda | 6 | 16 | 6 | 16 | 6 | 16 |
| Standard deviation | 3.03 | 5.54 | 1.26 | 5.96 | 2.39 | 5.69 |
| Variance | 9.19 | 30.74 | 1.6 | 35.56 | 13 | 32.6 |
| Minimum | 2 | 4 | 2 | 2 | 2 | 2 |
| Maximum | 13 | 19 | 6 | 18 | 13 | 19 |
Table 2.
Results of the exercises (levels) of the Santa Barbara Solids Test.
| Levels | Boys | Girls | Total (Boys and Girls) | |||
|---|---|---|---|---|---|---|
| Right | Wrong | Right | Wrong | Right | Wrong | |
| Level 1 (Low) | 11 | 4 | 5 | 5 | 16 | 9 |
| Level 2 (Medium) | 9 | 6 | 7 | 3 | 16 | 9 |
| Level 3 (Complex) | 8 | 7 | 1 | 9 | 9 | 16 |
Table 3.
Survey results.
| N° | Questions | Answers | |||
|---|---|---|---|---|---|
| Yes (%) | No (%) | ||||
| 1 | Did you already know the dynamic software GeoGebra? | 8 | 92 | ||
| 2 | Do you think this software facilitated the representation of sections produced in geometric solids? | 100 | 0 | ||
| Question | GeoGebra (%) | Traditional (%) | |||
| 3 | In your opinion, is it more beneficial to use GeoGebra or to solve only in a traditional way? | 100 | 0 | ||
| Question | Answers | ||||
| 4 | Give a justification for your previous answer. | Because it makes it easy to project figures without having to do much effort. GeoGebra is most beneficial to use because it is very easy and fast for cylinder learning. In my opinion, GeoGebra is easier because it makes it easier for me to understand the figures. It is beneficial to use GeoGebra because you can get a 3D view in detail. | |||
| Question | Yes (%) | No (%) | |||
| 5 | Do you think GeoGebra is easy and intuitive to use? | 92 | 8 | ||
| Question | Answers | ||||
| 6 | Show two positive aspects of the lesson. | I learned how to draw a cylinder in the dynamic software GeoGebra, this is a very good application. First, I could understand even more about cylinders, second, I would like you to be our teacher next quarter. With the lesson we were able to apply the plans correctly and were able to use the GeoGebra application. I had a good explanation and learned with ease. | |||
| Question | Answers | ||||
| 7 | Show two negative aspects of the lesson. | I did not find negative aspects because now I am interested in using GeoGebra for its easy-to-use tools. I did not find any negative aspects. I liked the class very much because it made learning easier. I think that, for each student, there should be a teacher accompanying them. There were no negative aspects because the class was beneficial. | |||
| Question | Facilitates Learning (%) | Motivator (%) | Quick Perception (%) | ||
| 8 | Classify the use of GeoGebra in relation to the following aspects: | 56 | 16 | 28 | |
| Question | Efficient (%) | Neutral (%) | Complicated (%) | ||
| 9 | Classify how learning was with the aid of GeoGebra. | 84 | 8 | 8 | |
Publisher’s Note: MDPI stays neutral with regard to jurisdictional claims in published maps and institutional affiliations. |
© 2022 by the authors. Licensee MDPI, Basel, Switzerland. This article is an open access article distributed under the terms and conditions of the Creative Commons Attribution (CC BY) license (https://creativecommons.org/licenses/by/4.0/).
Share and Cite
MDPI and ACS Style
Chivai, C.H.; Soares, A.A.; Catarino, P. Application of GeoGebra in the Teaching of Descriptive Geometry: Sections of Solids. Mathematics 2022, 10, 3034. https://0-doi-org.brum.beds.ac.uk/10.3390/math10173034
AMA Style
Chivai CH, Soares AA, Catarino P. Application of GeoGebra in the Teaching of Descriptive Geometry: Sections of Solids. Mathematics. 2022; 10(17):3034. https://0-doi-org.brum.beds.ac.uk/10.3390/math10173034
Chicago/Turabian StyleChivai, Cacilda H., Armando A. Soares, and Paula Catarino. 2022. "Application of GeoGebra in the Teaching of Descriptive Geometry: Sections of Solids" Mathematics 10, no. 17: 3034. https://0-doi-org.brum.beds.ac.uk/10.3390/math10173034
Note that from the first issue of 2016, this journal uses article numbers instead of page numbers. See further details here.