1. Introduction
Last year, carbon dioxide emissions got more attention from many researchers in different areas. We can see a lot of scientifical and popular papers in absolutely different journals, books, and on the internet. Of course, high-performance computing is associated with the carbon footprint theme because the most powerful supercomputers consume more than 15MW each, although the power consumption of each supercomputer is less than 1% of the typical aluminum plant consumption per year [
1]. For example, we can read about the ecological impact of high-performance computing in astrophysics [
2] or about the energy efficiency of openFOAM calculations in hydrodynamics [
3]. Last decade we can see a lot of papers in computer science with different code optimization techniques [
4,
5]. Many years, our team have been developing parallel codes for plasma physics and for astrophysical hydrodynamics simulations. In [
6] we presented energy efficiency calculation for our astrophysical code. We will use the same method as in [
7] for energy efficiency calculation for a plasma physics code. This method considers the power consumption of compute nodes and the supercomputer’s cooling system. First of all, we would like to say some words about the importance of plasma physics simulation and the Particle-in-Cell (PIC) method as one of the most common methods in this area. PIC simulation of high-beta plasmas in an axisymmetric mirror machine is of interest because of a new proposal of plasma confinement regime with extremely high pressure, equal to the pressure of the magnetic field (so-called diamagnetic confinement) [
8]. This method allows essential decrease in the longitudinal losses. There are several theoretical papers devoted to different aspects of diamagnetic confinement: equilibrium and transport in the MHD approximation [
8,
9,
10], influence of kinetic effects on equilibrium and transport [
11], and axisymmetric z-independence kinetic model of equilibrium [
12]. Experimental demonstration of diamagnetic confinement in a mirror machine with high-power off-axis neutral beam injection (NBI) is planned in the Compact Axisymmetric Toroid (CAT) [
13] device and Gas Dynamic Trap (GDT) at Budker Institute of Nuclear Physics [
14]. These experiments are close to the experiments with high-power NBI in a field-reversed configuration, carried out on the C2-W/Norman device of the company Tri Alpha Energy. Using the numerical PiC code NYM for interpretation of the experiment in the C2-W device is worth noting [
15]. The results of these experiments and calculations can be used for development of aneutronic fusion. In our work, we are using our own PIC algorithms and their parallel implementation. In this paper, we briefly describe the mathematical model, parallel implementation, and some numerical tests of the PIC code in
Section 1,
Section 2 and
Section 3. A detailed description of the algoritms can be found in [
16,
17].
Section 4 and
Section 5 are dedicated to the energy efficicency calculation method and results.
2. Mathematical Model
The problem is conisdered on the basis of the of cylindrical trap sizes with the magnetic field H. The fully ionized hydrogen plasma with zero temperature and density at the initial time is inside the trap. At the time , injection of the particles into the trap from its center begins. We consider the injection as appearance of the ions and electrons at the injection point. The self-consistent non-linear interaction of the injected beam with the plasma and the magnetic field of the trap is the subject of research.
We assume axial symmetry of the problem, plasma quasi-neutrality (), the negligibility of the displacement currents and the massless electron component and obtain the following equations in cylindrical coordinates with the following dimension units and scaling factors:
time: , where is the ion gyrofrequency;
length: , where is the ion plasma frequency;
velocity: the Alfven velocity
The motion equations:
where
are the ion velocities, and
are the ion coordinates.
is the combination of the electromagnetic force with the force of the friction between the ions and the electrons.
The velocities of the electrons
can be obtained from the equation:
The distribution function of the ions
defines their density
and mean velocity
:
The electric field
is defined by the following equation:
The electric field
and magnetic field
are defined from Maxwell’s equations:
The temperature
is defined by the following equation:
for
and the electron pressure
.
The Equations (
1)–(
9) are based on the hybrid decsription of the process, where the ions are defined by the Vlasov kinetic equation and the electron component is described as a liquid with MHD equations. We use the particle-in-cell method [
18,
19], in which the particle coordinates, velocities, and charges are assigned to the particle data on the Lagrangian grid. The other functions (for example, the electric and magnetic fields, currents, temperature, and mean ion densities) are defined on their own staggered Eulerian grids. For plasma confinement with injection in the central domain of the trap and particle outflow through the trap ends
,
, the equilibrium parameters of the system require a detailed study. Due to the uneven particle distribution in the trap, the number of particles in some cell may be few orders grater than that in another cell, and the distribution is non-stationary on the early stages. The need in a large total number of particles (
) and long times of evolution (∼
) forces us to parallelize the complicated time-consuming algorithm.
3. Parallel Code
The parallel computing algorithm is based on the decomposition of the space and particle grids. We divide the computational domain into equal subdomains along the z-axis and assign the grid data of a subdomain to its own group of processor cores. The data of the ions located in a subdomain is divided among the cores of the group. On each time step, each core computes its particle trajectories, current, and charge densities. The master core of each group additionally gathers the current and charge densities, computes the functions on the Eulerian grid in view of the exchanges with the neighbour group cores and boundary conditions, and then broadcasts the results to all cores of its group.
In a group, the background ions for and the injected ions on each timestep are distributed uniformly among the cores. When particles leave a subdomain, their data are sent to a core of the adjacent group, the receiving core for each sending core defined via the module operation. The algorithm provides an equal number of particles per core in group. The equal number of particles in groups is obtained due to periodic load balancing, the number of required cores in the groups is computed on the basis of the average number of particles in each core. The balancing is laborous and thus occurs periodically, for example, every time steps. The dynamic load balancing allows speeding up the calculations.
We use explicit numerical schemes, and the trajectories of model particles and particle charge contribution can be calculated independently by each core. This internal parallelism of the particle-in-cell method is promising. However, there is a problem of the transition from the Lagrangian grid to the Eulerian one and back. At the same time, the computation of the force acting on each particle, the ion current, and the charge density via bilinear interpolation are the most time consuming procedures and may take more than 95% of the computation time. These difficulties are overcome via optimization of the algorithms for the calculations of the velocities, coordinates of ions, charge densities, current densities, and mean ion velocities to enable automatic vectorization [
20]. We achieve ≈
speedup with the auto-vectorized code in comparison with the scalar code. This application of a single instruction to multiple data points allowed us to increase the efficiency of the computations and decrease their time. A detailed description of the model realization can be found in [
21]. The pseudocode of the proposed parallel algorithm is presented in
Appendix A. The calculations were carried out with the Intel Xeon Phi 7290 processors of the Siberian Supercomputer Center, ICM&MG SB RAS, Novosibirsk, Russian Federation.
4. Numerical Simulation
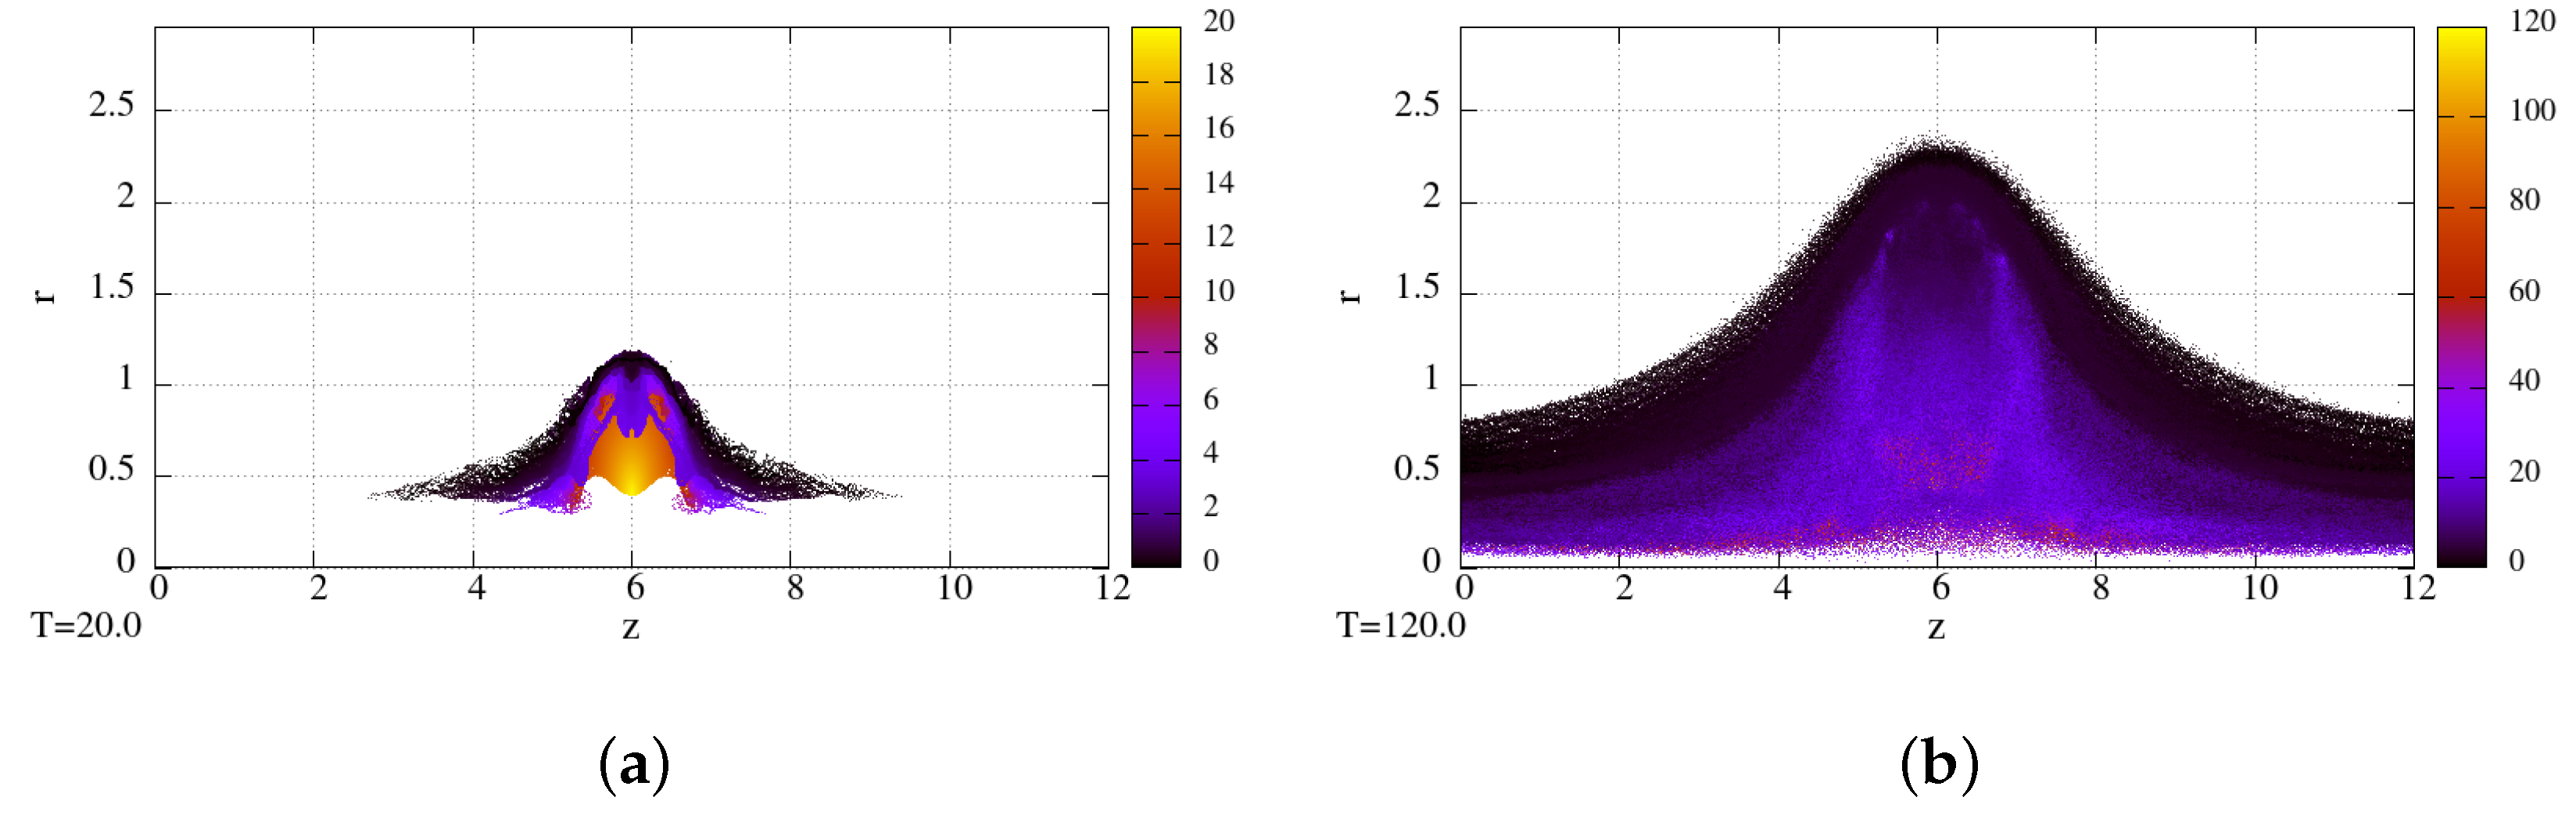
For the simulations we use the magnetic field value kg with the mirror ratio , length cm, and background density cm. In the dimensionless units, the trap sizes are and ; the injection point coordinates are and ; the average beam speed for is , sm/s; the initial angular velocity . We used the spatial grid with nodes, time step , and model particles. Each time unit model particles were injected, adding to the trap the charge of real ions.
Figure 1 demonstrates the injected particle coordinates
at the times
and
. The color of the particles denotes the time of injection of the particles.
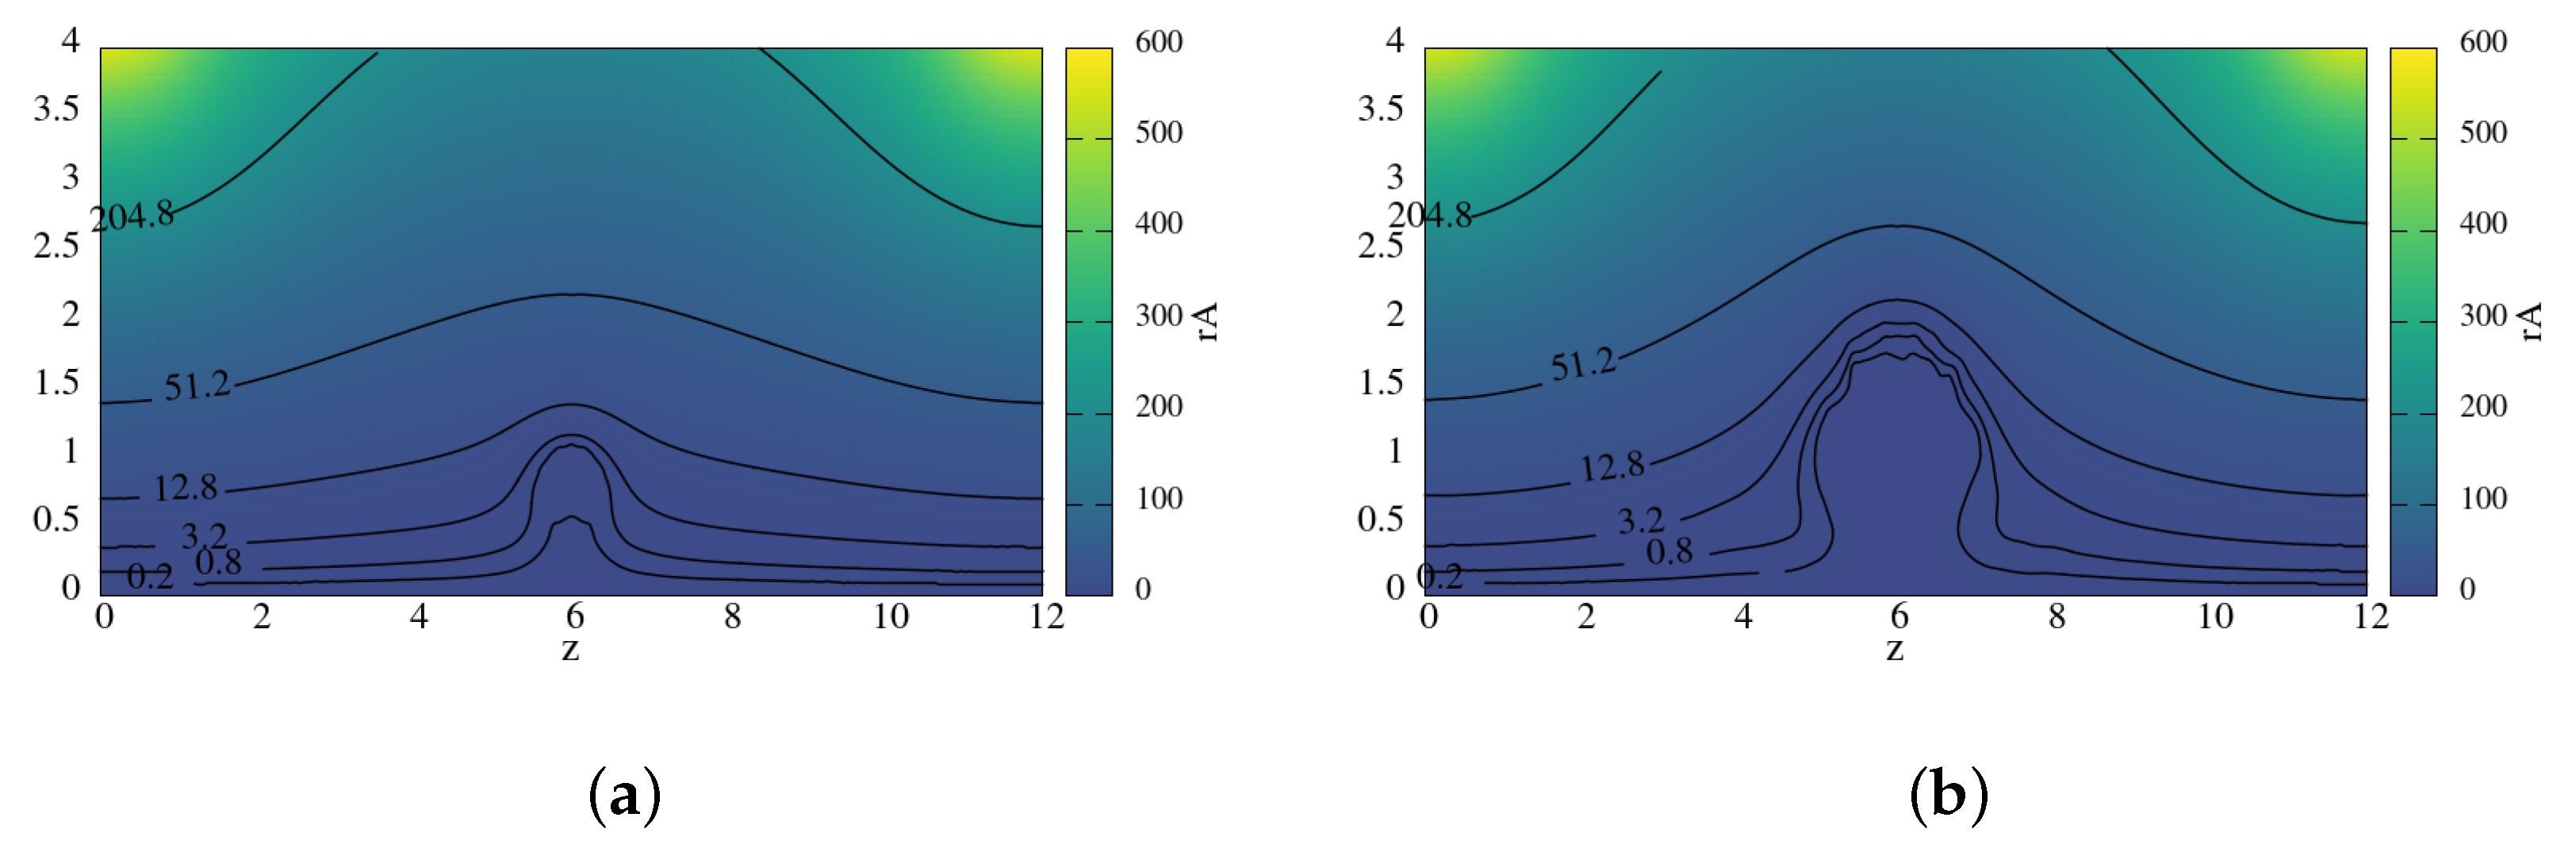
Figure 2 represents the magnetic field lines at the times
and
. The injected particles begin to rotate in the magnetic field, forming a domain with the expelled magnetic field around the point of injection. The magnetic field inside this cavity reaches only few percents from the initial values, and thus new injected particles move in the cavity with their original velocities and change them on the border of the cavity. Then some particles move along the field lines towards the mirrors, and some particles remain captured in the cavity. The formation of the magnetic field cavity with the thin boundary layer of high field gradient may lead to the plasma confinement on the later evolution stages.
5. Energy Efficiency
Recent initiatives on carbon footprint reduction will affect data centers. The carbon footprint is estimated from the energy consumption of the algorithm and the carbon intensity of the production of this energy:
, where the energy needed is
. The energy consumption of the computing cores depends on the model of CPU and the number of cores, while the memory power draw only depends on the size of memory available. The usage factor corrects for the real core usage percentage. The default value of the usage factor is 1 for the full usage. The PUE (Power Usage Effectiveness) value measures how much energy is consumed by the cooling, lighting, etc. systems of the data center. The PSF (Pragmatic Scaling Factor) is used to take into account the code runs during debugging and final calculations. A detailed description can be found in [
7]. Software engineers cannot control PUE and PSF values because they depend on the supercomputer architecture. However, we can create the energy-efficient code, which means that we have to use the CPU’s architecture effectively. For modern CPUs from Intel or AMD, it means that we need to use vectorization instructions such as AVX2 or AVX-512 [
22]. The best way is to optimize the code for autovectorization using a compiler, because this solution is more flexible towards the use of CPU intrinsics based on the specific processor architecture. We tested this approaches in our earlier works for astrophysical codes. Some of the results and software development techniques can be found in [
23,
24]. In the case of PIC code, in
Listing A1 we provide a very simple pattern for aligning of main data. We used a C
++ style aligning in a Fortran code, which can be compiled by the Intel Fortran compiler using the C
++ precompiler. In our energy efficiency research, we used the Intel Xeon CPU architecture, because we can receive the energy consumption directly from hardware. This is a more precise approach than the use of approximate theoretical models from different publications. The Intel server platform also provides the possibility of DRAM power consumption collection for some DRAM models. The energy consumption of other devices inside the cluster’s computational node is significantly less than that of processors and memory.
For the energy effciency research, we used the Intel oneAPI software package [
25]. It can measure the energy consumption data from processors, memory, and other hardware during calculations. We employed the Intel SoCwatch tool from Intel OneAPI for energy consumption evaluation. All collected data can be read and explained by the Intel VTune tool. We utilized the Intel Fortran Compiler, SoCwatch, and Intel Vtune from oneAPI 2022 for compiling and evaluating the energy consumption. In our research, we used RSC high-performance computing nodes of the NKS-1P cluster [
26] with the Intel Xeon Phi 7290 (2nd KNL generation) and Intel Xeon 6248R (2nd generation of Intel Xeon Scalable) processors. Both type of CPUs support AVX512 instructions for vectorization. We also tested a workstation with the Intel core i9-10980XE processor, because this CPU also supports AVX-512 instructions. This building script from
Listing A2 was used for our tests. Our code is an MPI code, and we utilize a standard mpirun for a Linux or mpiexec for Windows command for running the PIC simulation. As we said before, we use the
key with some source files because we need to employ the C
++ precompiler for aligning data and some other techniques to help the compiler to create auto-vectorized code. For the energy consumption collection we applied the SoCwatch tool, run by the command
as a separate process. SoCwatch produces an output file, which can be opened in the Intel VTune profiler, which shows the following data for analysis:
Analyze the amount of time spent in each sleep state (C-State) and processor frequency (P-State).
Identify which core spent time at what frequency.
Understand which cores were active during which timeframes during data collection.
Review the state residency by core, module, or package.
Explore how the state and frequency changed over time.
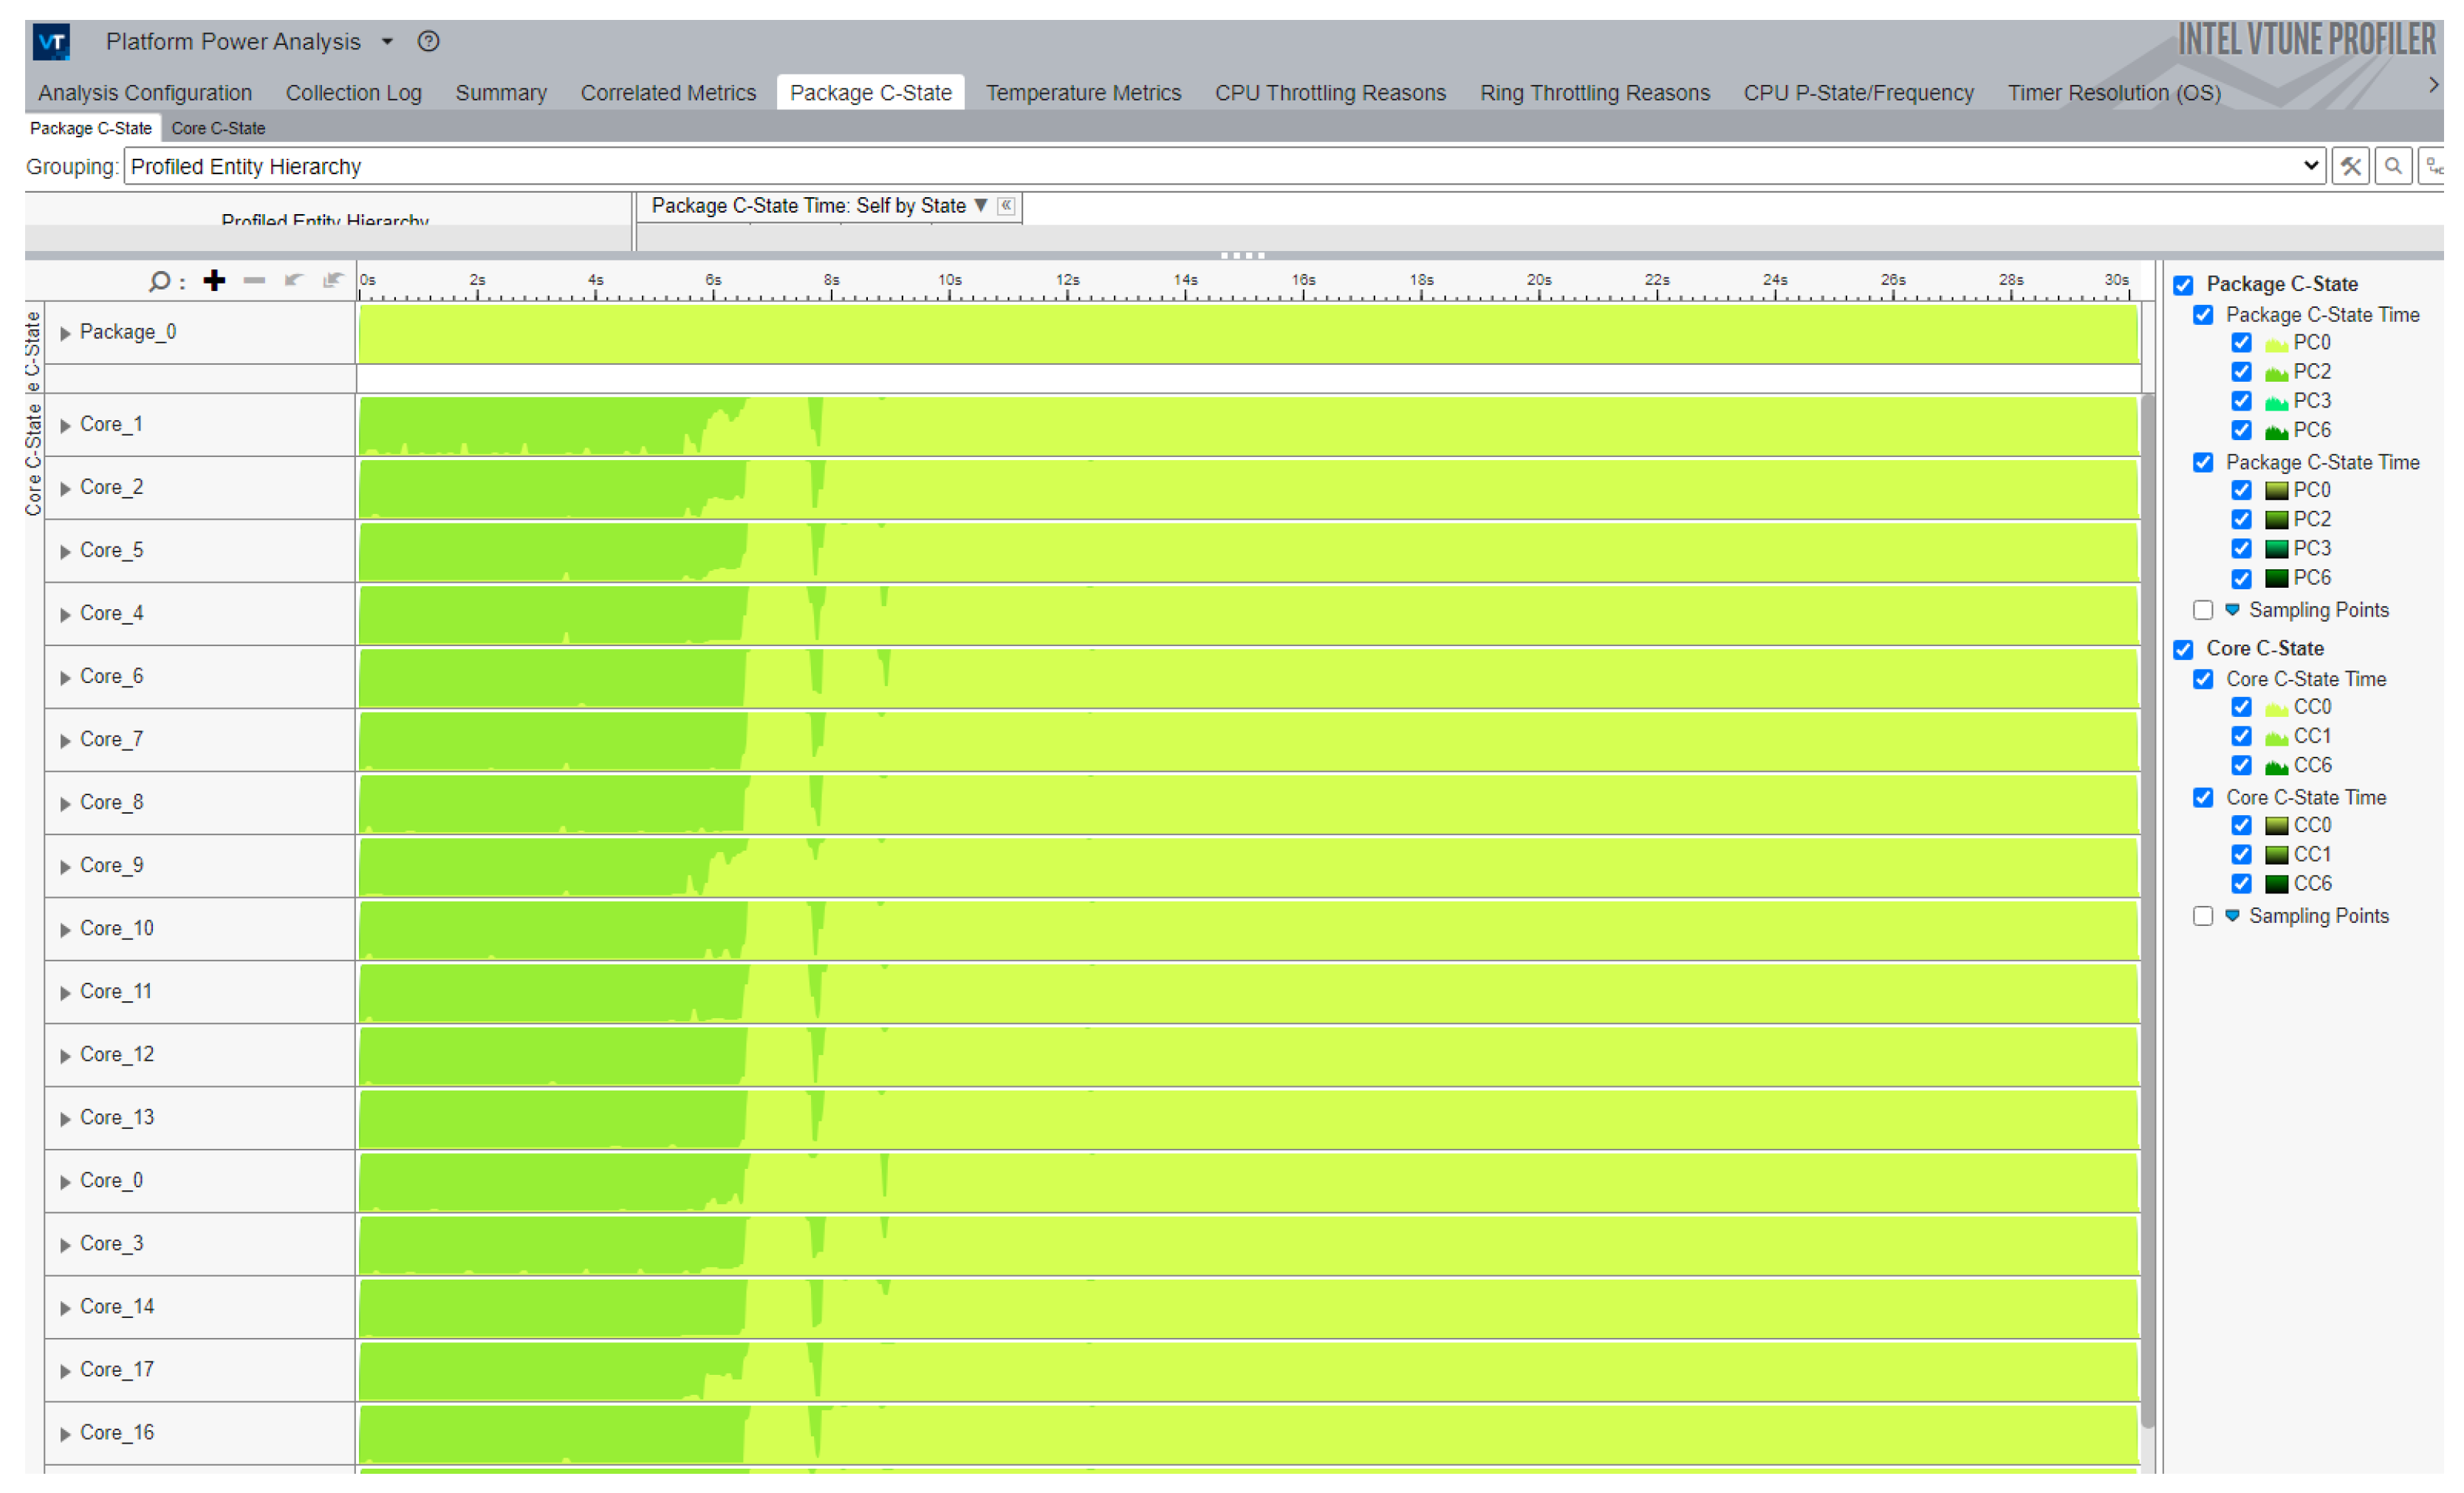
Figure 3 shows a C-state for the PIC code. We can see that in the first eight seconds of the numerical simulation, the cores are in state C2. It can also be considered as a transition state. The core clock is gated, and interrupts are not served. In this state, the PIC code is loading data for numerical simulation. After this, the CPU is going to a C0 state with some inactivity, which is connected with the internal data distribution between some of the cores. The C0 state means that at least one hardware thread within the core is executing some task. In this state, cores stay active. Sometimes, in the case of thousand-core numerical simulation, this data can help to find bugs faster than other types of analysis, because we can find inactive cores. Finally, we can see that our PIC code uses all cores in an active state. For energy efficiency research, we need information about the performance in GFLOPS and the power consumption in Watts. For the performance evaluation, we used the Intel Advisor, which is also part of oneAPI. Detailed information, on how to evaluate the performance can be found in our previous work [
27]. In this paper, we present data obtained from Advisor.
Table 1 shows the energy efficiency of the developed PIC code on Intel Xeon Phi, the second generation of Intel Xeon Scalable processors, and Intel core i9 processor for workstations. We achieve ≈
performance growth with AVX512 instructions auto-vectorization in comparison with scalar maximum performance for each processor type. Why we concerning on aligning data in PIC code and trying to use other optimization techniques? Because the vectorization technique gives up to 8x performance speedup with 20–30% power consumption growth. This is the main feature of Intel Xeon scalable CPUs as well as other processors with AVX512 instructions support. This is hard to optimize memory bounded code to achieve maximum vectorized performance. We think that this is the main challenge for modern scientifical parallel codes development. For the carbon footprint calculation, we need data from the cluster’s cooling system. In our research, we used the NKS-1P system from the Siberian Supercomputer Center, the PUE factor of which is equal to 1.03. There are only
% of energy consumed by the cooling system. This PUE is typical for the liquid-cooled systems (
https://rscgroup.ru/en/, accessed on 24 August 2022). For this simple PIC test, the PSF is equal to 1. We used one node with two Intel Xeon 6248 CPUs for numerical tests, and one Intel Xeon Phi 7290 processor. It means that the
value = 48 h*2*193 W*1.03*1 = 19,084 Wh for 2× Intel Xeon 6248R. In the case of one Intel Xeon Phi 7290 CPU, the
value = 48 h*1*202 W*1.03*1 = 9987 Wh. The total power consumption of the experimental setup is obtained by the node consumption * PUE factor. The carbon intensity from electricity generation can be found from [
28], and for natural gas, it will be 0.91 pounds per kWh. In our case, we produced 17.29 pounds (≈7.8 kg) of CO
2 from one test with double Intel Xeon 6248R and 9 pounds (≈4 kg) with Intel Xeon Phi 7290.
Unfortunately, we cannot compare these results with those of other teams, which are developing plasma physics codes yet, because the most common open-source software has different numerical schemes. We hope that the database of these authors [
7] will help to do that in future.


 ,
, 


