1. Introduction
Dolmens are the oldest stone architecture erected by humans to monumentalize their funerary spaces. They are collective or individual tombs with a trousseau associated with the megalithic phenomenon from the 5th millennium to the 3rd millennium BC [
1], with permanence and/or reuse reaching up to the 2nd and 1st millennium BC [
2,
3,
4]. The trousseaus are made up mainly of chert (flint) and, in some places, obsidian, and other minerals.
Chert is a sedimentary rock made up of 70–99.9% microcrystalline quartz (SiO
2), containing small percentages of water and various associated oxides (Ca, C, Fe, K, Al, and Mg) [
5,
6]. These features allow us to compare different rocks to determine similarities and differences. Chert from different origins can often be distinguished visually but using only visual identification per se is inappropriate because samples from the same provenance can exhibit a high degree of visual diversity [
7]. Petrological characterization of chert has been based mainly on its mineralogical composition, texture, fossil content, and the environment in which it was formed [
8]. At present, reflectance spectroscopy is being used for the identification and characterization of minerals and rocks since they are non-destructive techniques at medium cost and allow for quite rapid acquisition of raw data. Nevertheless, the great amount of data obtained presents great variability and requires the application of complex methods of mathematical big data analysis [
9,
10,
11].
In Andalusia, the megalithic phenomenon has great relevance, with a large number of dolmens used as individual or collective funerary tombs [
12]. In this work, we obtained the spectral signatures of lithic material found inside the excavated dolmens in the Andévalo region (
Figure 1):
A spectral library was created containing the spectral signatures of these artifacts. The material was analyzed using preprocessing transformation and big data methods to characterize, classify, establish similarities, and discriminate between chert artifacts. In this paper, we propose preprocessing by means of an affine transformation.
The interaction between light and matter is a complex process, and, in addition, data collection is limited by the accuracy of the instrument used, the wavelength range used, and the distortion caused by noise in the data acquisition. It is usual to use previous data preprocessing, mainly applying mathematical techniques of smoothing, baseline removal, and data normalization [
13,
14,
15]. This transformation uses the specific parameters Maximum and Minimum of the spectral signature and enhances the values of each sample by sharpening the shapes and highlighting the peaks and valleys, obtaining important details that remain masked using raw data. In this work, preprocessing data using the affine transformation to highlight the amplitudes and shapes of the spectral signatures is proposed.
2. Materials and Methods
Spectroscopy records the interaction between light and matter, and the study of the reflected radiation after its interaction with matter is known as reflectance spectroscopy. Light reflected by a material gives rise to specular reflectance and diffuse reflectance. In specular reflectance, the incident rays are reflected without interacting with the sample, with the incident angle equal to the reflected angle. In diffuse reflectance, part of the incident rays interacts with the sample components and are absorbed and diffused according to the intensity and spectral composition of the radiation, reflecting in different directions. Only diffuse reflectance is relevant to reflectance spectroscopy. Each sample, depending on its chemical composition and optical properties, will return a characteristic reflectance curve called spectral signature as a function of absorption and reflection due to the sample composition.
The spectra in the visible and near-infrared ranges contain considerable information about the physical and molecular composition of materials (e.g., flint), as they detect molecules from the absorbed wavelengths such as water, hydroxyls, phosphates, nitrates, carbonates, sulfates, and metal oxides and hydroxides [
3]. Therefore, infrared spectroscopy has been proposed as a new technique to detect heat-induced effects within lithic artifacts and to quantify OH and water ions in archaeological flints.
The siliceous rock quarries linked to the production of specialized flint flakes in Andalusia are grouped into four large areas [
11]: (1) the Pyritic Belt of Huelva with rhyolites and rhyodacites mainly from the Paleozoic; (2) the Middle Sub-Baetic of External Areas, centered in Granada province, with flints characteristic of the Upper Jurassic Milanos Formation; (3) flint quarries in Málaga province and the Campo de Gibraltar Complex (Cádiz province); and (4) the flint quarries of the Malaver Formation (Ronda, Málaga) from the Tertiary.
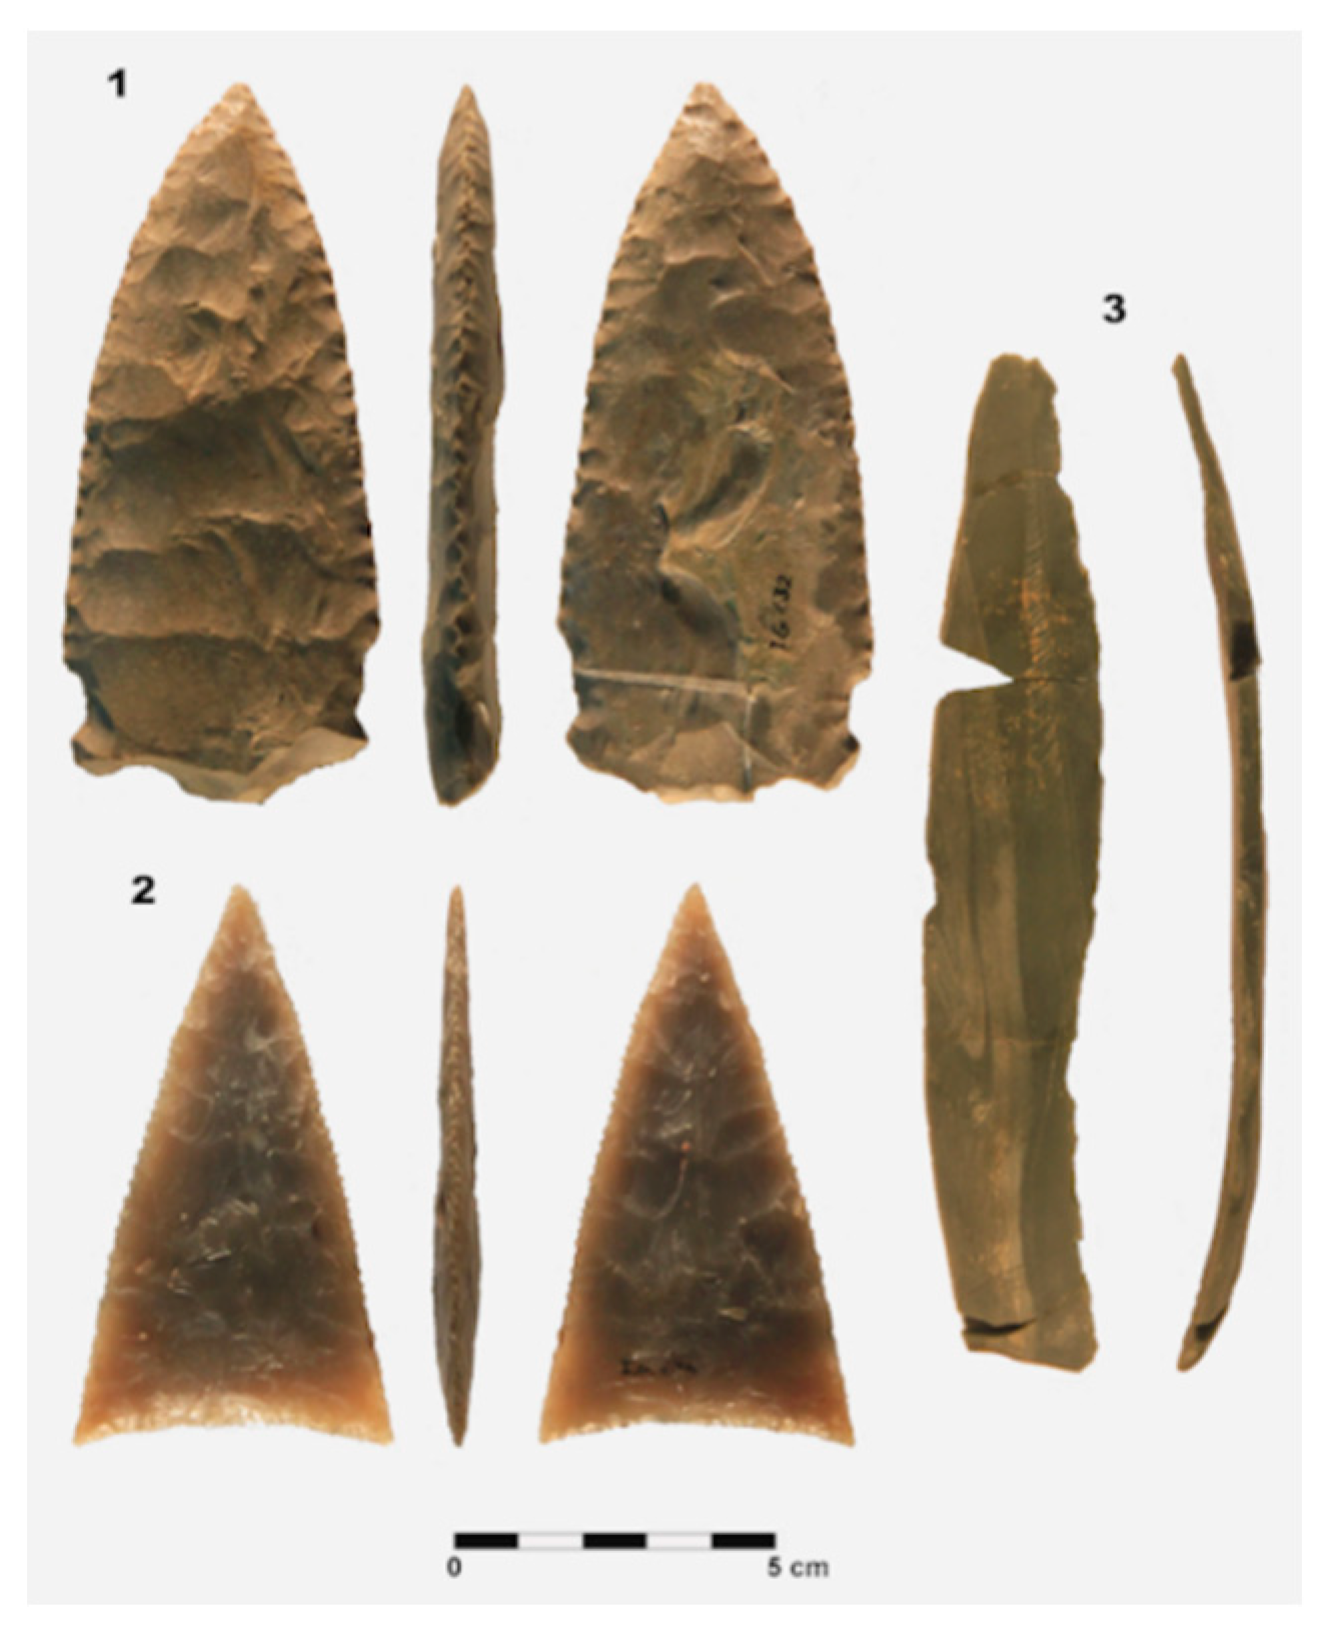
In this study, the samples analyzed are prehistoric lithic artifacts retrieved in archaeological excavations in the Andévalo area (Huelva, Andalusia). The chert artifacts come from four locations corresponding to San Bartolomé de la Torre dolmen (SBn° with 5 samples), El Tejar dolmen from Higuera de la Sierra (Tn° having 5 samples), La Zarcita dolmen in the town of Santa Bárbara de Casa (Zn° with 15 samples), and the tholos of El Moro in Niebla (TMn° with 1 sample) (
Figure 2).
Reflectance spectra were collected using an Analytical Spectrometer Device (ASD) Portable Spectroradiometer FieldSpec4STD (Malvern Panalytical, Malvern, UK), which records the amplitude value of electromagnetic waves between 350 nm and 2500 nm (spectral range). This spectroradiometer is designed with three channels, and in each channel, it can distinguish a very small difference in wavelengths (spectral resolution), with a spectral resolution between 3 nm at 700 nm and 10 nm at 1400 and 2100 nm, with a total number of 2151 spectral bands. The measuring interval was 1.4 nm in the spectral range of 350–1000 nm and 2 nm in the 1001–2500 nm range, using a high-intensity contact probe A122307 (Analytical Spectral Devices, Inc., Boulder, CO, USA) with a halogen light source, a measurement surface area equivalent to a circle 2 cm in diameter, and a maximum specular reflectance of 5%. The white level was calibrated on a Spectralon of 3.62″ diameter (Analytical Spectral Devices, Inc.), providing a nearly 100% reflective Lambertian surface across the entire spectrum. Dark correction (DCC) was applied to remove the electrical current generated by thermal electrons and was added to that generated by incoming photons. Raw data returned are 16-bit numbers corresponding to the output of each element in the VIS/NIRS detector array and each 2 nm sample of the spectrum to generate a relative reflectance. This system reduces noise using a spectrum averaging technique (average of 20 spectra per quantification). Three spectra were acquired for each chert sample, and their mean was used. According to the ASD manual, the white level was calibrated after every 25 spectra.
The results obtained in the quarries in the case of Andévalo have been analyzed by using preprocessing mathematical transformations to analyze spectroscopy data, including logarithms, standardizations of different types (the most usual one is Z-score), etc. The affine transformation is based on the use of specific parameters obtained from the spectral signature of the data used (Maximum and Minimum). This transformation allows enhancement of the values of each sample by sharpening the shapes and highlighting the peaks and valleys. The scale is [0,1] because spectrometers usually provide the recorded reflectance values in this interval.
Figure 3 shows a graphic diagram of the proposed methodology.
3. Preprocessing Data
The analysis of spectral data from raw data presents some problems, mainly due to the characteristics of the interaction process of light and matter, the limitations of the instruments used, and the distortion produced by noise. However, the use of preprocessing methods allows us to improve the results and attenuate the influence of noise by applying mathematical techniques of smoothing, elimination of baseline, scaling, and normalization [
13,
14,
15]. The suitable preprocess transforms the reflectance values, maintaining the relationships in amplitude and between the shapes, features, and other details and allowing them to stand out when they would otherwise remain hidden or masked [
16].
Preprocess transformations belong to three basic groups: functional, statistical, and geometric. Functional transformations are based on applying a function, generally defined in implicit coordinates, to the spectral signatures. Among the most common functional transformations, those belonging to the family of logarithmic functions
and potentials
(usually
a =
e) stand out, although there are some quite complex functions, such as the sigmoid function
that equalizes the reflectance data with distortion proportional to the
a parameter [
17].
Statistical transformations modify the scale of the distribution of a variable to make comparisons between elements, sets of elements, or different parameters, homogenizing the units of measurement between variables. Among the most used are the typified
Z or standardized scores from a normal distribution (
), related to range (
), to range 0–1 (
), to the maximum magnitude (
), to the mean (
), or to the standard deviation
[
18].
A very important class is composed of geometric transformations based on the concepts of Euclidean geometry (adjusted to the Euclid postulates). Among them, affine geometry stands out as a generalization of Euclidean geometry with properties applicable in a Minkowski space. These concepts were formalized in the language of Felix Klein’s Erlangen Program [
19,
20]. Among the important geometric transformations are the affine transformations in the
vector space
, where
A is a real and non-singular 2 × 2 matrix,
b a 2 × 1 real vector, and
α a real number. In the case of spectral curves, these values are simplified since
A and
B are real numbers, and the standard affine transformation is expressed by
providing a min–max normalization (MMN) [
17,
21]. The classification performance can hardly be improved by this method [
22].
In this work, the affine transformation is proposed in order to simultaneously maintain the coherence of the original reflectance values (
raw data) and the shape of the graphical representation, highlighting as well the peaks, valleys, and trends of each signature. Raw data and transformed plots are shown in
Figure 4.
Signatures of samples from San Bartolomé are homogeneous in shape with a decreasing trend at the end of the spectrum. The standard affine transformation highlights the aggrupation of these samples and points out materials with the same diagenetic processes and, possibly, similar post-depositional alterations of environmental and/or anthropic origin. However, SB1357 shows a very flat curve with an almost constant reflectance and a gently increasing trend, making it very difficult to distinguish its shape (
Figure 4a). The preprocessed values highlight a peak at ~530 nm, the maximum of the signature, as well as a doublet at ~2200 nm. The petrochemical analysis assigns this sample to the group of rhyolitic rocks in the Odiel river area [
23], having differences from the other samples at 550–2500 nm (
Figure 4b).
Four samples from El Tejar agree with the general patterns of chert with high reflectance. Sample T3874 is similar to SB1357, with a peak at ~530 nm, low reflectance, and a characteristic double valley shape at ~2200 nm. Both samples can be associated with crystalline and luminous minerals.
Fifteen lithic artifacts found in the Zarcita dolmen show great variability but maintain the general shape of signatures of chert. The Z215 sample is very different from the rest, having a small reflectance range with an absolute maximum at ~550 nm and doublet absorption at ~2200 nm.
The visual analysis of T3874 and Z215 show similar features even in the visible spectrum, but the adscription of SB1357 is not clear using the raw data (
Figure 5).
Again, the affine transformation highlights important underlying features. Samples T3894 and Z215 have similar shapes in the VNIR spectrum, while SB1357 has the same curve only in the 350–550 nm range. The three signatures have a decreasing trend in 1000–1700 nm, but SB1357 is different. These features point out diagenetic processes that are similar but with some differences at 800–1800 nm, possibly due to large areas of Europe having been subjected to similar processes in the formation of geological materials during a specific period, although with local variations.
4. Singular Statistical Parameters: Peaks and Valleys
Rock identification is dependent upon several variables, such as mineral associations, diagenetic processes and transformations through geologic time, mineral alterations, current large- and small-scale morphology, and recent climatic conditions [
24]. Some authors propose a description of spectral curves based on: (1) the position of wavelengths minimizing the values of reflectance of absorption bands; (2) the depth, width, area, and asymmetry of the bands; and (3) the position of the slope changes and inflection points on the curve [
25].
The spectral absorption patterns in the SWIR spectrum provide great homogeneity with very small coefficients of variation at important flint wavelengths (~1400, ~1900, ~2200, and ~2350) (
Table 1).
The last peak (~2350 nm) is a specific diagnostic with a great homogeneity, identified by the peaks of various cations and anions in the SWIR region, mainly due to carbonates [
26]. Moreover, some authors propose the characteristic bands of major absorption in the SWIR region for the common mineral groups corresponding to carbonates and Mg-OH, as well as Mg–OH vibration in amphiboles [
24,
27].
On the other hand, the shape in the visible spectrum of SB1357, T3874, and Z215 stand out from the rest, with a peak at ~540 nm, having the maximum reflectance in each signature. This peak is related to ferric and ferrous ions (mainly oxides), silicates, sulfates, sulfites, manganese, and chromium ions [
26,
28]. Other authors propose Fe
2 + chlorites, Ni Chrysoprase, and Cr-diopside [
27], as unbound electrons whose atomic structure and mineral impurities the diagnostic attributes detected [
29]. These three samples possibly correspond to rocks whose main components are serpentine, olivine, or malachite, along with other components. These common minerals in Western Andalusia have great reflectance at ~540 nm, with green or greenish colors.
5. Pattern Recognition
The large amount of data (
big data) registered by spectroscopy requires the use of complex statistical methods of multivariate statistical analysis to obtain the possible patterns (
pattern recognition) in the data. These methods include primarily factor analysis (FA), principal component analysis (PCA), discriminant analysis (DA), principal component regression (PCR), multiple linear regression (MLR), and partial least squares regression (PLS). DA and PCA are widely used tools for quantitative analysis. Additionally, CA (cluster analysis) is another important method that allows us to obtain a data classification using geometric and statistical methods [
3,
30].
In this paper, we have applied Principal Component Analysis and Cluster Analysis, as they are the most reliable methods for our analysis.
5.1. Principal Component Analysis
The essential concept is to consider each signature as a point in multidimensional vector space with the wavelengths as the dimensions, usually with 1 nm accuracy. Factorial analysis (FA) provides a new coordinate system constituted by a linear combination of the original variables, which are called components. The most used algorithm is the principal components algorithm (PCA), whose components are chosen so that PC1 includes the greatest variability of the data. Then, PC2 is chosen orthogonal to PC1, including the maximum remaining variability, and so on.
The PCA method is used with a great number of variables to drastically reduce their dimensionality in an interpretable way, preserving the greatest part of the information in the data. Normally, the first principal components involving a large amount of total variance (usually more than 80%) are taken into account. The remainder of the components then contains minor characteristics and noise. The importance of each original variable is measured by the matrix of loadings, and these values indicate the importance of each original variable in the data set. Usually, the first principal components are considered in order to study factor structure. Then, the trends underlying the data are drawn in different bivariate plots using PCAs [
31,
32]. The main uses of PCAs are exploratory rather than inferential to detect the underlying trends in the data and, in some cases, to obtain a visual prior data classification.
The application of exploratory PCAs to the samples from Andévalo shows some notable trends. Using the first three components, the results are similar in terms of total variation carried with the raw data (99.2%) or the transformed data (95.2%) (
Table 2).
Raw variables are highly correlated, providing a very large first eigenvalue (size effect) with explained variance close to 100%. The transformed data show a factorial structure with three factors that have more defined matrix loadings. Matrix loading determines which variables are most important when analyzing the variability and is fundamental in deciding which minimum values are chosen, with the loadings interpreted using robust cut-offs in the presence of non-normal distributions [
22]. Some authors propose absolute values ≥ 0.45 as relevant, ≥0.45 to 0.55 as good, and ≥0.63 as very good [
33]. Other methods use resampling techniques, such as jack-knifing or bootstrapping [
34,
35], with similar results.
The instrument used is based on the FORS (Fiber Optics Reflectance Spectroscopy) technique with 2151 variables corresponding to wavelengths of 350–2500 nm, so choosing only a few factors (components) is quite difficult. We propose choosing continuous wavelength intervals with no isolated values, corresponding to most of the load factors when their absolute value is ≥0.55 (
Figure 6).
The factor structure with raw data is dominated by PC1, a “size factor” with loads greater than 0.8. The other factors have very small loads. Thus, obtaining detailed features is very difficult. The use of transformed data provides the emergence of a more detailed factorial structure. The PC1 factor highlights the NIR interval (1400–2500 nm) as one of the most important features when studying absorption bands of minerals, those being mainly -OH oxidrile (~1400 nm), H
2O (~1900 nm), and Metal-OH ions (~2200 nm) [
6]. By separating the samples, the loads in PC2 show a bipolar factor due to the reflectance in the VIS + NIR and SWR2 intervals (e.g., SB1357) against high values in the full spectrum (e.g., Z239).
Plot PC1–PC2 shows that important details of diagnostic features are lost with raw data but transformed data highlight the differences much better, with the visual groups being more homogeneous and consistent. Thus, with raw data, only factor 1 is relevant, it being a “size factor”; the other factors do not practically discriminate (
Figure 7a). With the exception of SB1357 and Z215, the transformed data highlight an important relationship between the samples from San Bartolomé and those at the Zarcita dolmen and also establish possible graphic associations (
Figure 7b):
5.2. Cluster Analysis
Using multivariate geometric and statistical algorithms, cluster analysis is focused on classifying objects into significant groups or clusters where there was no prior information about cluster membership in predefined groups. The most used clustering techniques are of type SHAN (Sequential Hierarchical Agglomerative Not overlapping), obtaining a classification dendrogram [
36,
37].
The algorithms are based on a previous similarity measure or distance in addition to an agglomeration criterion maximizing intragroup similarity and minimizing intergroup similarity. The single linkage and the average linkage algorithms are among the most used and highlight the Ward, the nearest neighbor. The Euclidean or squared distance is the most commonly used similarity measure for quantitative variables. A SHAN clustering is computed on the Andévalo samples with squared Euclidean distance as a similarity measure and Ward’s clustering algorithm (minimum variance) as the clustering algorithm [
38,
39].
The Ward method is based on the loss of information between each object and the average of each cluster in which it is integrated, which is produced in each pass when calculating the total sum of the squares of the deviations between each object and the average of the cluster in which it is integrated. Some authors have found that this provides a more optimal classification than other methods, such as minimum distance, maximum distance, average distance, or centroid methods [
40].
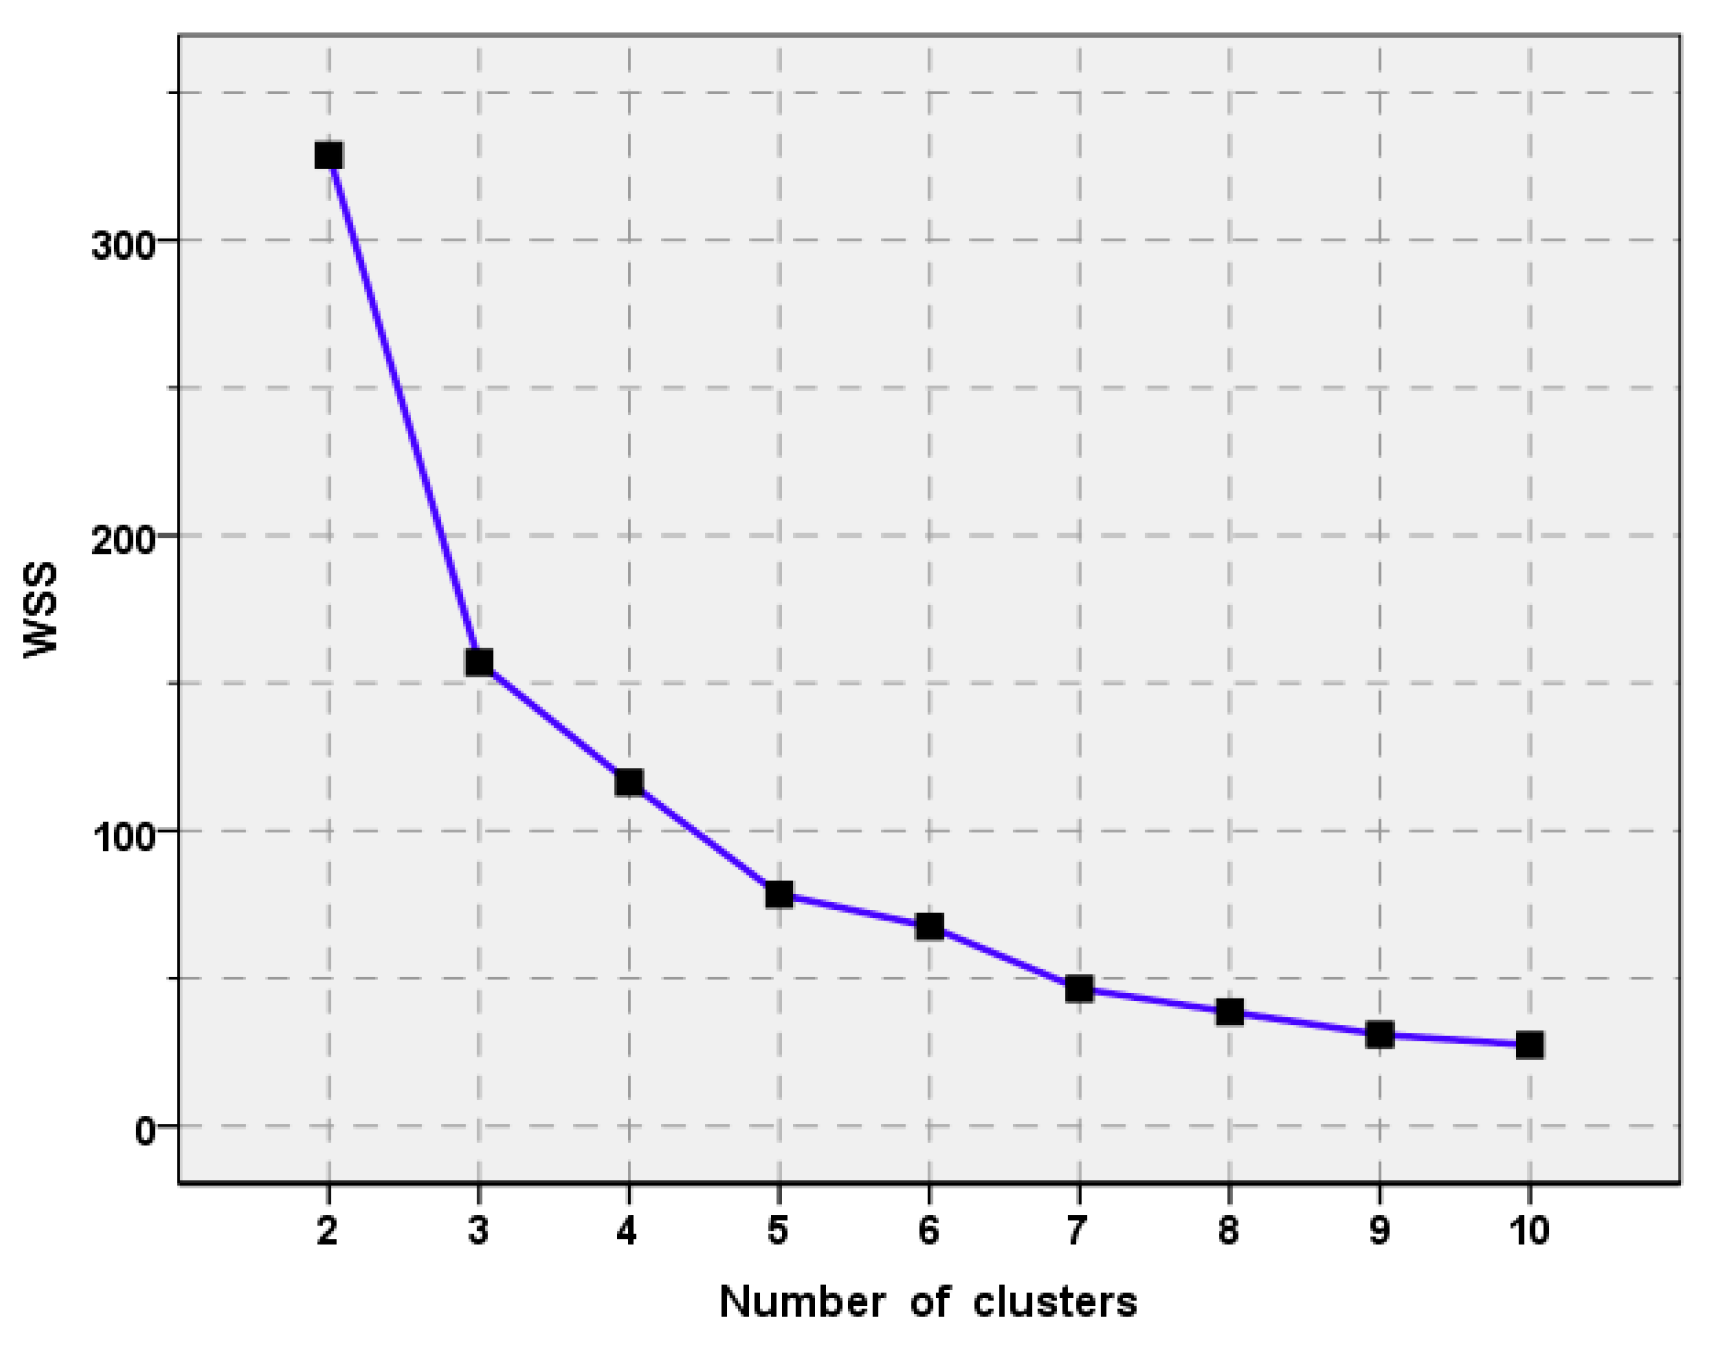
The determination of the number of clusters is based on the Elbow Method, which looks at the total WSS (Within Sum of Squares) to measure the compactness of the clustering and the goodness of the clustering structure. A curve plots the number of clusters versus the WSS measures. The location of an elbow (“knee”) in the plot is considered an indicator of the appropriate number of clusters [
41,
42]. Application of that method to our data set provides that the best number of clusters is
n = 5 (
Figure 8).
From the Andévalo samples: cluster analysis provides a classification into five clusters (
Figure 9).
CLUSTER 1 presents great variability with samples from all the areas studied, pointing to the fact that the objects are exchanged in the zone. CLUSTER 2 consists almost exclusively of samples from the tholos La Zarcita in Northern Andévalo, except one sample from the El Moro, and CLUSTER 3 is formed from samples from El Tejar and La Zarcita, possibly because they come from quarries with similar characteristics. CLUSTER 4 is composed of a rhyolite (extrusive igneous rock) very different from flint, which is a rock formed by a mixture of siliceous minerals from the closest volcanic area to the Andévalo, and points to exchanges throughout the south of the Iberian Peninsula. Finally, CLUSTER 5 is composed of two samples with great similarities between them. This group is similar to the rhyolite in CLUSTER 4, indicating that they come from the same quarry (
Figure 5), although with small variations. Further, SB1357 appears isolated from the others, although it shares many similar characteristics with T3874 and Z215, maintaining the absorption in the visible spectrum but with very high reflectance values. Its singularity comes from the higher values in the visible spectrum, with a peak at ~535 nm and higher values than in previous cases. SB1357 is a volcanic siliceous rock mainly composed of rhyolite, very different from chert. Identification of these three samples corresponds to rocks whose main components are chlorite, serpentine, olivine, or malachite (peaks in ~535 nm), very abundant in this so-called “pyritic belt” area of Andalusia, in addition to other components.
6. Conclusions
Spectroscopic methods allow us to obtain important information about the structure and composition of minerals in the VNIR range of the electromagnetic spectrum at the level of atoms, electrons, molecules, and crystal lattices. This information can be used to better understand the physical and chemical conditions of the mineral formations and explain various properties, such as color, and analyze the provenance of lithic tools manufactured by prehistoric people.
The samples analyzed correspond to prehistoric lithic artifacts obtained from archaeological excavations in the Andévalo region (Huelva, Andalusia) belonging to the Later Neolithic and Chalcolithic periods. Spectral signatures were obtained and analyzed, but their low reflectance and the small range of variation between minimum and maximum in some samples required previous preprocessing data to highlight their characteristics and obtain more reliable measurements of some features. Among the large number of existing transformations, the standard affine transformation has been used to typify data values and highlight their differences while keeping the shape of the curve. Further, the affine-transformed data greatly increased the effectiveness of statistical analysis with respect to the raw data.
The results confirm the circulation of lithic artifacts in the Andévalo region and allow us to draw conclusions about the places of extraction, the origin of lithic material, patterns of cultural transmission, circulation, and paths of exchange. Given this, we can deduce that during the Chalcolithic period, the southwest of Andalusia seems to have formed an area in which the exchange of information, objects, and, possibly, people took place.
It is important to note that two statistical methodologies, Principal Component Analysis and Cluster Analysis, have been applied to study the classification of the samples considering the transformed data, obtaining identical classifications that also coincide with the origin of the samples.
Author Contributions
Conceptualization, J.A.E. and L.F.G.d.M.; methodology, J.A.E., F.J.E., and J.L.R.-B.; software, F.J.E. and J.L.R.-B.; validation, A.M. and L.F.G.d.M.; formal analysis, J.A.E.; investigation, J.A.E., L.F.G.d.M., and A.M.; resources, L.F.G.d.M. and A.M.; data curation, F.J.E. and J.L.R.-B.; writing—original draft preparation, J.A.E. and F.J.E.; writing—review and editing, J.L.R.-B.; visualization, J.A.E., A.M., and L.F.G.d.M.; funding acquisition, J.A.E. and L.F.G.d.M. All authors have read and agreed to the published version of the manuscript.
Funding
This work has been funded by the Ministry of Economy and Competitiveness, Project UNGR15-CE-3531, and by the research groups AGR123 and ARCHAEOSCIENCE HUM1037 of the Junta de Andalucía.
Data Availability Statement
Data available upon request to the authors.
Acknowledgments
The authors thank the staff of the Huelva Museum for the facilities given to access the archaeological flint blades studied in this article. F.J. Esquivel and J.L. Romero have been partially supported by grant PID2021-128077NB-I00, funded by MCIN/ AEI/10.13039/501100011033/ ERDF A way of making Europe, EU.
Conflicts of Interest
The authors declare no conflict of interest.
References
- Paulsson, B.S. Radiocarbon dates and Bayesian modelling support maritime diffusion model for megaliths in Europe. Proc. Natl. Acad. Sci. USA 2019, 116, 3460–3465. [Google Scholar] [CrossRef] [PubMed] [Green Version]
- Aguayo, P.; García, L. The megalithic phenomenon in Andalusia. An overview. In Origin and Development of the Megalithic Phenomenon of Western Europe, Proceedings of the International Symposium, Bougon, France, 26–30 October 2002; Joussaume, R., Laporte, L., Scarre, C., Eds.; Conseil Général de Deux Sèvres: Bougon, France, 2006; pp. 452–472. [Google Scholar]
- García del Moral, L.F.; Morgado, A.; Esquivel, J.A. Espectroscopia de Reflectancia de Fibra Óptica (FORS) de las principales canteras de rocas silíceas de Andalucía y su aplicación a la identificación de la procedencia de artefactos líticos tallados durante la Prehistoria. Complutum 2022, 33, 35–67. [Google Scholar] [CrossRef]
- Esquivel, F.J.; Morgado, A.; Esquivel, J.A. 2017 La Arqueología de la Muerte y el Megalitismo en Andalucía. Una Aproximación a los Rituales de Enterramiento V Milenio BC-II Milenio B.C. In La Muerte desde la Prehistoria a la Edad Moderna; Espinar, M., Ed.; EPCCM: Granada, Spain, 2017; Volume 23, pp. 93–124. [Google Scholar]
- Luedtke, B.E. An Archaeologist’s Guide to Flint and Flint Archaeological Research Tools; Institute of Archaeology, University of California: Los Angeles, CA, USA, 1992. [Google Scholar]
- Clark, R.N. 1999 Spectroscopy of Rocks and Minerals, and Principles of Spectroscopy. In Manual of Remote Sensing, Remote Sensing for the Earth Sciences; Chapter 1; Rencz, A.N., Ed.; John Wiley and Sons: New York, NY, USA, 1999; Volume 3, pp. 3–58. [Google Scholar]
- Luedtke, B.E. The identification of sources of chert artifacts. Am. Antiq. 1979, 44, 744–756. [Google Scholar] [CrossRef]
- Affolter, J. Provenance des Silex Préhistoriques du Jura et des Regions Limitrophes. Archéologie Neuchâteloise, 28; Service et Musée cantonal D’archéologie: Neuchâtel, France, 2002. [Google Scholar]
- Parish, R.M. A Chert Sourcing Study Using Visible/Near-infrared Reflectance Spectroscopy at the Dover Quarry Sites, Tennessee. Unpublished. Master’s Thesis, Department of Geosciences, Murray State University, Murray, Kentucky, 2009. [Google Scholar]
- Beyer, M.A.; Laney, D. The Importance of Big Data: A Definition; Gartner Inc.: Stanford, CA, USA, 2012. [Google Scholar]
- García del Moral, L.F.; Morgado, A.; Esquivel, J.A. Reflectance spectroscopy in combination with cluster analysis as tools for identifying the provenance of Neolithic flint artefacts. J. Archaeol. Sci. Rep. 2021, 37, 103041. [Google Scholar] [CrossRef]
- Linares, J.A. El Megalitismo en el sur de la Península Ibérica. Arquitectura, Construcción y Usos de Los Monumentos del Área de Huelva, Andalucía Occidental. Ph.D. Thesis, University of Huelva: Huelva, Spain, 2017. [Google Scholar]
- Gholizadeh, A.; Borůvka, L.; Saberioon, M.M.; Kozák, J.; Vašát, R.; Němeček, K. Comparing Different Data Preprocessing Methods for Monitoring Soil Heavy Metals Based on Soil Spectral Features. Soil Water Res. 2015, 10, 218–227. [Google Scholar] [CrossRef] [Green Version]
- Fang, Q.; Houng, H.; Zhao, L.; Kukolich, S.; Yin, K.; Wang, C. Visible and Near-Infrared Reflectance Spectroscopy for Investigating Soil Mineralogy: A Review. J. Spectrosc. 2018, 2018, 3168974. [Google Scholar] [CrossRef]
- Angelopoulou, T.; Balafoutis, A.; Zalidis, G.; Bochtis, S. From Laboratory to Proximal Sensing Spectroscopy for Soil Organic Carbon Estimation. Sustainability 2020, 12, 443. [Google Scholar] [CrossRef] [Green Version]
- Sgavetti, M.; Pompilio, L.; Meli, S. Reflectance spectroscopy (0.3–2.5 µm) at various scales for bulk-rock identification. Geosphere 2006, 2, 142–160. [Google Scholar] [CrossRef] [Green Version]
- Da Fontoura, L.; Marcontes, R. Shape Classification and Analysis, 2nd ed.; CRC Press, Taylor and Francis Group: Boca Ratón, FL, USA, 2009. [Google Scholar]
- Dodge, Y. The Oxford Dictionary of Statistical Terms, 6th ed.; Oxford University Press: Oxford, UK, 2003. [Google Scholar]
- Nomizu, K.; Sasaki, T. Affine Differential Geometry: Geometry of Affine Immersions. (Cambridge Tracts in Mathematics, Series Number 111); Cambridge University Press: Cambridge, UK, 2008. [Google Scholar]
- Vargas, J.G. Differential Geometry for Physicists and Mathematicians. Moving Frames and Differential Forms: From Euclid Past Riemann; World Scientific: New York, NY, USA, 2014. [Google Scholar]
- Solomon, C.; Breckon, T. Fundamentals of Digital Image Processing. A Practical Approach with Examples in Matlab; John Wiley & Sons: Oxford, UK, 2011. [Google Scholar]
- Wang, B.; Yan, X.; Jiang, Q. Loading-Based Principal Component Selection for PCA Integrated with Support Vector Data Description. Ind. Eng. Chem. Res. 2015, 54, 1615–1627. [Google Scholar] [CrossRef]
- Donaire, T.; Toscano, M.; Valenzuela, A.; González, M.J.; Pascual, E. Alteración diferencial de las rocas volcánicas ácidas en el sector de Riotinto, Faja Pirítica Ibérica. Geogaceta 2010, 48, 147–150. [Google Scholar]
- Longhi, I.; Sgavetti, M.; Chiari, R.; Mazzoli, C. Spectral analysis and classification of metamorphic rocks from laboratory reflectance spectra in the 0.4–2.5 mm interval: A tool for hyperspectral data interpretation. Int. J. Remote Sens. 2001, 22, 3763–3782. [Google Scholar] [CrossRef]
- Grove, C.I.; Hook, S.J.; Paylor, E.D. Laboratory Reflectance Spectra of 160 Minerals, 0.4 to 2.0 Micrometers; JPL Publication 92-2; Jet Propulsion Laboratory: Pasadena, CA, USA, 1992. [Google Scholar]
- Gupta, R.P. Remote Sensing Geology, 3rd ed.; Springer: Berlin, Germany, 2018. [Google Scholar]
- Hauff, P. An Overview of VIS-NIR-SWIR Field Spectroscopy as Applied to Precious Metals Exploration; Spectral International Inc.: Arvada, CO, USA, 2008. [Google Scholar]
- Hunt, G.R. Spectral signatures of particulate minerals in the visible and near infrared. Geophysics 1977, 42, 468–671. [Google Scholar] [CrossRef] [Green Version]
- Parish, R.M. Reflectance Spectroscopy as a Chert Sourcing Method. Archaeol. Pol. 2016, 54, 115–128. [Google Scholar]
- Esbensen, K.H.; Swarbrick, B. Multivariate Data Analysis: An introduction to Multivariate Analysis, Process Analytical Technology and Quality by Design, 6th ed.; CAMO Software AS: Oslo, Norway, 2018. [Google Scholar]
- Ritz, M.; Vaculíková, L.; Plevová, E. Application of Infrared Spectroscopy and Chemometric Methods to Identification of Selected Minerals. Acta Geodyn. Geomater. 2011, 8, 47–58. [Google Scholar]
- Izenman, A.J. Modern Multivariate Statistical Techniques: Regression, Classification, and Manifold Learning. Springer Texts in Statistics, 2nd ed.; Springer: New York, NY, USA, 2013. [Google Scholar]
- Finch, A.P.; Brazier, J.E.; Mukuria, C.; Bjorner, J.B. An Exploratory Study on Using Principal-Component Analysis and Confirmatory Factor Analysis to Identify Bolt-On Dimensions: The EQ-5D Case Study. Value Health 2017, 20, 1362–1375. [Google Scholar] [CrossRef] [PubMed] [Green Version]
- Peres-Neto, P.R.; Jackson, D.A.; Somers, K.M. Giving Meaningful Interpretation to Ordination Axes: Assessing Loading Significance in principal Component Analysis. Ecology 2018, 84, 2347–2363. [Google Scholar] [CrossRef] [Green Version]
- Timmerman, M.E.; Kiers, H.A.L.; Smilde, A.K. Estimating confidence intervals for principal component loadings: A comparison between the bootstrap and asymptotic results. Br. J. Math. Stat. Psychol. 2007, 60, 295–314. [Google Scholar] [CrossRef] [PubMed]
- Sneath, P.H.A.; Sokal, R.R. Numerical Taxonomy: The Principles and Practice of Numerical Classification, 2nd revised ed.; W.H. Freeman: San Francisco, CA, USA, 1973. [Google Scholar]
- Everitt, B.S.; Landau, S.; Leese, M.; Stahl, D. Cluster Analysis, 5th ed.; Wiley in Probability and Statistics: New York, NY, USA, 2011. [Google Scholar]
- King, R.S. Cluster Analysis and Data Mining: An Introduction; Mercury Learning & Information: Vancouver, BC, Canada, 2014. [Google Scholar]
- Wierzchon, S.T.; Klopotek, M.A. Modern Algorithms of Cluster Analysis. Studies in Big Data 34; Springer International Publishing AG: Cham, Switzerland, 2018. [Google Scholar]
- Kuiper, F.K.; Fisher, L. A Monte Carlo comparison of six clustering procedures. Biometrics 1975, 31, 777–783. [Google Scholar] [CrossRef]
- Raykov, Y.P.; Boukouvalas, A.; Baig, F.; Little, M.A. What to do when K-Means Clustering Fails: A Simple yet Principled Alternative Algorithm. PLoS ONE 2016, 26, e0162259. [Google Scholar] [CrossRef] [PubMed] [Green Version]
- Patil, C.; Baidari, I. Estimating the Optimal Number of Clusters k in a Dataset Using Data Depth. Data Sci. Eng. 2019, 4, 132–140. [Google Scholar] [CrossRef]
| Publisher’s Note: MDPI stays neutral with regard to jurisdictional claims in published maps and institutional affiliations. |
© 2022 by the authors. Licensee MDPI, Basel, Switzerland. This article is an open access article distributed under the terms and conditions of the Creative Commons Attribution (CC BY) license (https://creativecommons.org/licenses/by/4.0/).

 ,
, 


