

WSI: A New Early Warning Water Survival Index for the Domestic Water Demand

1
Department of Information Management, National Yunlin University of Science and Technology, Douliu 64002, Taiwan
2
Department of Electrical and Computer Engineering, Iowa State University, 2520 Osborn Drive, Ames, IA 50011, USA
*
Author to whom correspondence should be addressed.
Mathematics 2022, 10(23), 4478; https://0-doi-org.brum.beds.ac.uk/10.3390/math10234478
Submission received: 27 October 2022
/
Revised: 19 November 2022
/
Accepted: 23 November 2022
/
Published: 27 November 2022
(This article belongs to the Special Issue Mathematical Modeling, Optimization and Machine Learning)
Abstract
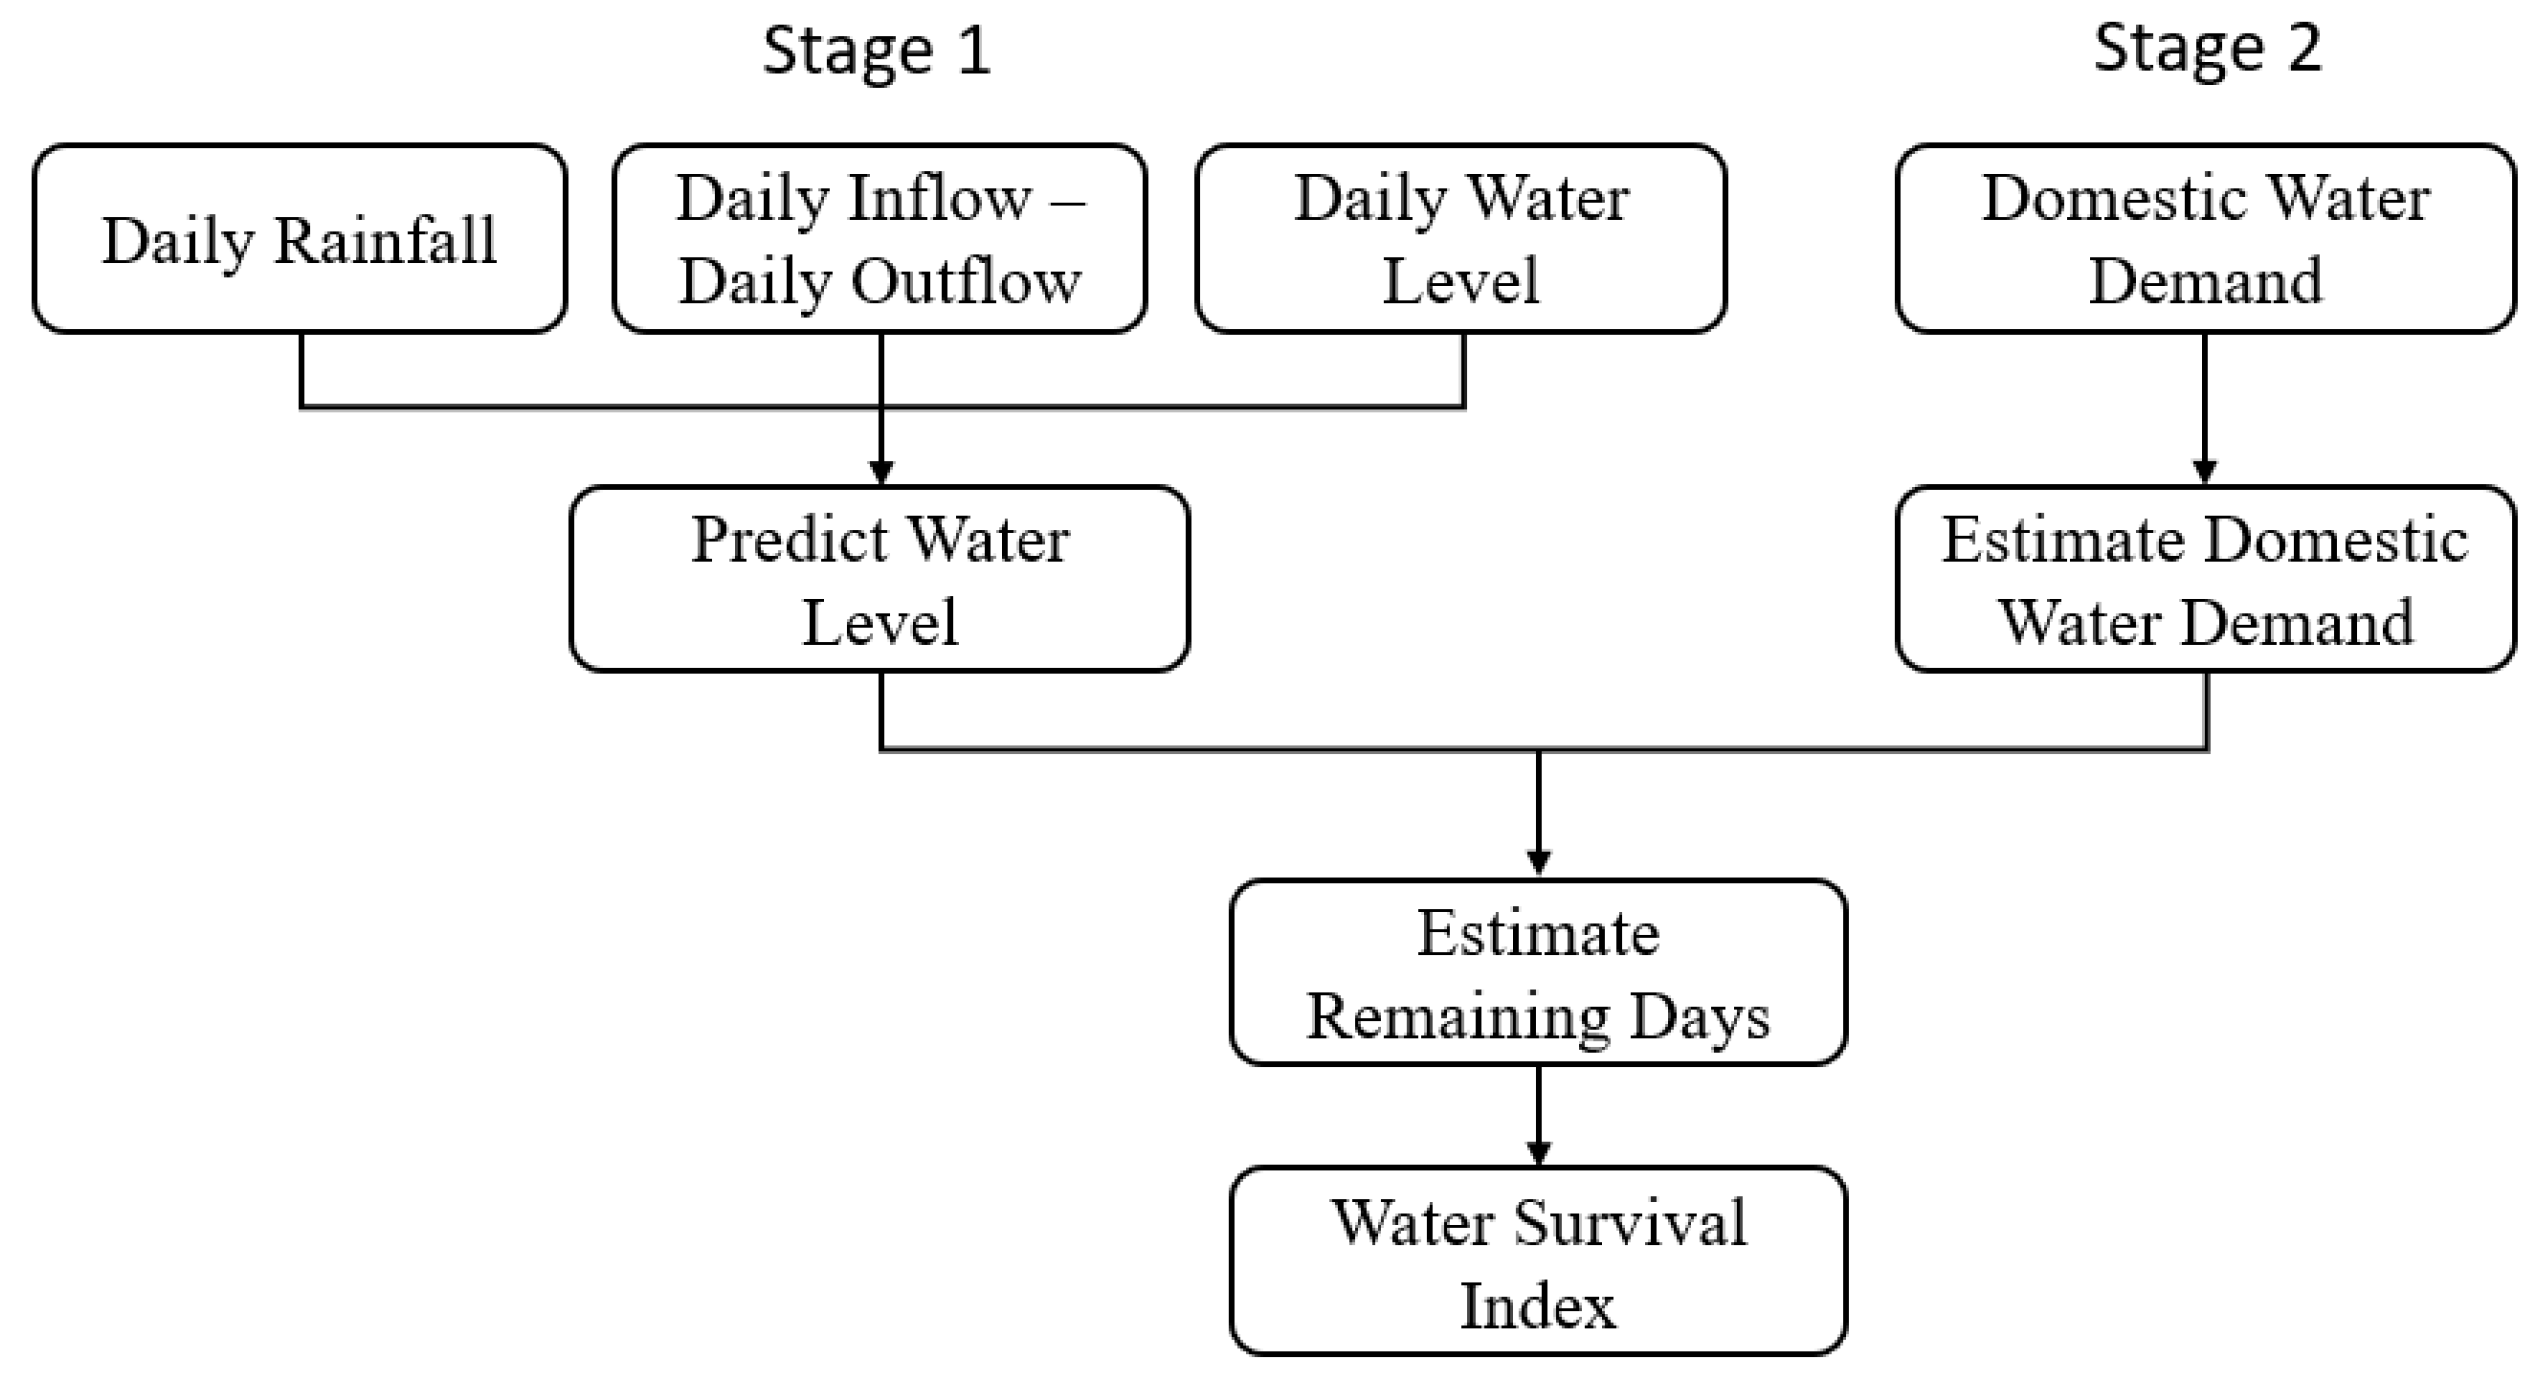
:A reservoir is an integrated water resource management infrastructure that can be used for water storage, flood control, power generation, and recreational activities. Predicting reservoir levels is critical for water supply management and can influence operations and intervention strategies. Currently, the water supply monitoring index is used to warn the water level of most reservoirs. However, there is no precise calculation method for the current water supply monitoring index to warn about the adequacy of the domestic water demand. Therefore, taking Feitsui Reservoir as an example, this study proposes a new early warning water survival index (WSI) to warn users whether there is a shortage of domestic water demand in the future. The calculation of WSI was divided into two stages. In the first stage, the daily rainfall, daily inflow, daily outflow, and daily water level of the Feitsui Reservoir were used as input variables to predict the water level of the Feitsui Reservoir by the machine learning method. In the second stage, the interpolation method was used to calculate the daily domestic water demand in Greater Taipei. Combined with the water level prediction results of the Feitsui Reservoir in the first stage, the remaining estimated days of domestic water supply from the Feitsui Reservoir to Greater Taipei City were calculated. Then, the difference between the estimated remaining days of domestic water demand and the moving average was converted by the bias ratio to obtain a new WSI. WSI can be divided into short-term bias ratios and long-term bias ratios. In this study, the degree of the bias ratio of WSI was given in three colors, namely, condition blue, condition green, and condition red, to provide users with a warning of the shortage of domestic water in the future. The research results showed that compared with the existing water supply monitoring index, the new WSI proposed in this study can faithfully present the warning of the lack of domestic water demand in the future.
Keywords:
reservoir water level prediction; water supply monitoring index; machine learning; water survival index; bias ratioMSC:
68T05; 68Q321. Introduction
Water is an essential resource for many economic activities, and if unchecked or mishandled, it can lead to problems in economic development. The chip industry contributes significantly to Taiwan’s overall economy but requires much water to clean the wafers. Suppose Taiwan’s reservoirs run dry or there is insufficient water supply. In that case, it could be terrible for the global electronics industry because Taiwan’s dominant position in the global semiconductor foundry means that supply chain bottlenecks caused by drought may manifest as shortages of consumer electronics [1,2]. In 2021, the northern part of Taiwan was hit by drought, which also affected Hsinchu Science Park, causing a massive impact on the country’s economy.
A reservoir is an integrated water resource management infrastructure for water storage, flood control, power generation, and recreational activities [3,4]. If the changing trend of reservoir water level can be understood in advance, the application of these water resources will be significantly improved [5]. Floods related to the flooding of reservoirs and lake or river levels are significant problems for protecting life and property. At the same time, low water levels may also cause considerable impacts on water quality, river navigation, and aquatic ecosystems [6]. Therefore, proper planning and management of water resources is a necessary condition for the future world [7]. The current warning for reservoirs uses the water supply monitoring index, which uses water supply units to hold scheduling coordination meetings and make decisions based on the weather provided by the Meteorological Bureau. However, without a clear standard, the water supply monitoring index cannot give people an actual water supply situation.
In recent years, many methods have been developed to predict the water level of reservoirs and lakes. For example, in [8] a wavelet-based artificial neural network, WANN) and a wavelet-based adaptive neuro-fuzzy inference system (WANFIS) were used to predict the daily water level. In [9], a feedforward neural network (FFNN) and deep learning (DL) were used to predict the water level of Lake Poland one month in advance. In [10], the observed water levels for the previous three days were utilized and machine learning was incorporated to predict the daily water levels for the next day. In [5], fuzzy neural networks were used, and the total inflow of the reservoir was subtracted from the total flood discharge to predict the reservoir’s water level in advance for the first 48 h. However, these studies only predicted the reservoir’s water level and did not make an in-depth analysis of how to manage and warn of the water resources needed in the future.
On the other hand, domestic water demand forecasting is indispensable in short- and long-term management plans. In [11], new artificial neural network technology was used to predict weekly water consumption at the Indian Institute of Technology, Kanpur. In [12], daily water consumption and climate data were used to construct a combination of artificial neural networks (ANNs) and time series models to predict future daily domestic water demand in Khobar City, Saudi Arabia. Zubaidi et al. [13] used a new method combining discrete wavelet transform (DWT) and an adaptive neurofuzzy inference system (ANFIS) to predict monthly urban water demand according to several intervals of historical water demand.
There are three criteria used to evaluate the water resources system. These measures describe the possibility of system failure (reliability), the speed of recovery from failure (resiliency), and the severity of the consequences of failure (vulnerability) [14]. These criteria can be used to help evaluate and select an alternative design and operational policies for various water projects. It is hoped that water resources are better managed and treated under water shortages [15]. The water-shortage index (SI) and generalized water-shortage index (GSI) used in the analysis were evaluated and modified by considering the cost of damage caused by water supply failures and the construction cost of water supply systems in South Korea [16]. Previous reservoir studies mainly focused on water quality, the ecological environment, risks, and uncertainties, but there is no further analysis and application of the reservoir water level, and the main problem is the lack of a reliable model to simulate the impact of the water level on the reservoir operation [17,18,19].
The current hydrological warning system used in Taiwan is the supply monitoring index, which the Water Resources Department publishes to let the public know the water supply and demand situation. At present, the supply monitoring index of the reservoir uses the water supply and water units to hold water resource management meetings and make decisions, according to the future weather provided by the Meteorological Bureau, to decide whether to take relevant measures and change the warning situation. However, the water supply monitoring index has yet to give a clear standard, so the public cannot know when these states will change, and so it cannot give the public an actual water situation. Therefore, this study uses a data-driven water survival index to help calculate the estimated remaining days of domestic water demand for people in greater Taipei to help the public and decision-makers provide more practical information and decision-making ability.
This study proposed a new early warning water survival index (WSI) for the Feitsui Reservoir. The calculation of the WSI was divided into two stages. In the first stage, daily rainfall, daily inflow, daily outflow, and daily water level of Feitsui Reservoir were used as input variables, and the machine learning method was used to predict the water level of Feitsui Reservoir on subsequent days. In the second stage, the interpolation method was used to calculate the daily domestic water demand in Greater Taipei City. Combined with the water level prediction results of the Feitsui Reservoir in the first stage, the remaining estimated days of domestic water demand from the Feitsui Reservoir to Greater Taipei City were calculated. Then a new early warning WSI was obtained by converting the distance between the estimated remaining days of domestic water demand and the moving average by bias ratio. The WSI could be divided into a short-term 6-year bias ratio (WSI6, j) and a long-term 12-year bias ratio (WSI12, j). According to the degree of the bias ratio of the WSI, condition blue, condition green, and condition red were given to warn users whether there would be a shortage of domestic water demand in the future.
2. Preliminary
2.1. Water Supply Monitoring Index
Regarding the latest meteorological forecasts of the Central Weather Bureau and the information on rainfall and reservoir storage in various regions, the Water Resources Department of the Ministry of Economic Affairs, after a comprehensive assessment of the latest water situation of each water supply area in Taiwan, represents the latest water situation by a condition light signal. Condition blue means the water situation is normal, condition green means water supply preparedness, condition yellow represents reducing the water pressure, condition orange represents reducing the water supply volume, and condition red means a rotating water supply. The water supply monitoring index issued by the Water Resources Department is used to provide the public with a clear understanding of the supply and demand situation of water resources to strengthen water conservation. In practice, the system first defines the appropriate water resource allocation area according to the characteristics of the local water supply system, and then the water resources bureau of each district of the Water Resources Department establishes the water resources early warning index according to the characteristics of meteorology, hydrology, water sources, and the water supply system of each water resources dispatching area under its jurisdiction, which serves as the corresponding index for initiating relevant countermeasures and the relevant units after the confirmation of the condition light. When the pre-warning conditions of blue, green, yellow, orange, and red stages are reached, the water supply and water use units are invited to hold a water supply scheduling and coordination meeting according to the procedure, after referring to the future meteorological outlook, and then they will decide what measures to take and whether to change the condition lights and review the response measures and light signal content on a rolling basis. According to the principle, condition blue and condition green should be evaluated once a month; condition yellow, condition orange, and condition red should be evaluated once every ten days; and the frequency should be increased if.
Currently, most reservoir-level warnings use the water supply monitoring index without any standard. However, there should be a standard way to calculate the water supply monitoring index to warn of the adequacy of water storage in the reservoir.
2.2. Water Level Prediction
Water levels play an essential role in social well-being and economic livelihoods, and the accurate prediction of reservoir water levels is essential for optimal water resources management. Changes in the water level can affect the physical processes of a lake or reservoir, thereby further affecting water quality and aquatic ecosystems. Therefore, the International Joint Commission (IJC) advocates that the existing water level monitoring and prediction methods should be improved.
In recent years, there have been several studies on water level prediction. Chang and Chang [20] used an Adaptive Network-Based Fuzzy Inference System (ANFIS) to build a reservoir prediction model. In total, 132 typhoon records and rainstorm events were used, as well as 8640 h datasets collected from the past 31 years. Ehteram et al. [21] used an improved Adaptive Neuro-Fuzzy Inference System (ANFIS), a Multilayer Perceptron (MLP) model, and the Sunflower Optimization (SO) algorithm and carried out a lake level simulation. Tsao et al. [5] used fuzzy neural networks to predict the water level of the Techi Reservoir in three stages. In the first stage, the reservoir inflow of the Techi Reservoir was estimated, and the water inflow directly into the reservoir was estimated by considering the electricity/water ratio of the hydroelectric units and the flood discharge volume. The second stage was 48 h ahead of reservoir inflow prediction, considering the impact of upper basin observations, and numerically predicted the effects of rainfall on future inflow and current inflow estimation measurements to predict 48 h Techi reservoir inflow. The third stage output the water level of the Techi Reservoir.
2.3. Domestic Water Prediction
In recent years, water crises have emerged due to rapid urbanization and climate change, and accurate prediction of urban water demand has become more critical for many cities and demand operating systems for real-time data. Related studies on domestic water demand prediction are as follows.
Zubaidi et al. [22] used signal preprocessing methods to analyze water consumption in Baghdad and then applied autoregressive (AR) models to predict monthly water consumption. Zubaidi et al. [23] used an artificial neural network (ANN) model to predict urban monthly water demand by optimizing the latest slime mold algorithm (SMA-ANN). Mu et al. [24] compared the performance of the LSTM-based model with the autoregressive integral moving average (ARIMA) model, support vector regression (SVR) model, and the random forest (RF) model for basic and seasonal water consumption.
2.4. Hydrologic Indicators
In recent years, the number of socioeconomic drought events has increased, leading in many cases to significant economic losses [15]. Drought, or lack of water, can be indexed. The Palmer Drought Severity Index (PDSI) is a dryness measure based on precipitation and temperature that defines the amount of water needed for “climate-appropriate precipitation” and the actual precipitation and its difference to define the water profit and loss situation. PDSI is a drought index that can objectively and reasonably quantitatively describe a drought [25]. McKee et al. [26] proposed the Standardized Precipitation Index (SPI). SPI is calculated by the rainfall status of the local long-term climate and reflects the possibility of rainfall observation. The more severe the drought, the greater the negative value of SPI. Vicente-Serrano et al. [27] proposed the Standardized Precipitation Evapotranspiration Index (SPEI), which can reflect the duration of drought, making it an ideal index for assessing, monitoring, and evaluating drought in the context of global warming [28].
2.5. Machine Learning
Machine learning (ML) is an artificial intelligence (AI) branch that focuses on training computers to learn from data and improve upon the experience. In machine learning, algorithms are trained to look for patterns and associations in large datasets and make decisions and predictions based on that analysis. The following describes several machine learning methods used in this study.
2.5.1. Random Forest
In machine learning, random forests combine the outputs of multiple decision trees to reach a single result. This study adopted the same random forest (RF) algorithm as Breiman [29]. However, the random forest algorithm originally evolved from random decision forests proposed by Ho [30]. Breiman [29] extended Ho’s algorithm and developed its application in many aspects. Zhang et al. [31] used the bootstrap resampling method to extract multiple samples from the original sample and modeled a decision tree for each bootstrap sample. This model increases the diversity of decision trees by having backtracking samples and randomly changing different trees. Then, the prediction of multiple decision trees was combined and averaged to obtain the final result.
2.5.2. M5 Model Trees
The M5P algorithm of Quinlan [32] was used in this study. There is a set of training samples (T); each training sample has a set of fixed attributes, namely, input values, and a corresponding target, namely, output values. Initially, T is associated with the leaves of the stored linear regression function or split into subsets considering the output, and the same process is then recursed on the subsets [10]. In this process, the appropriate attributes are selected to split T. In order to minimize the expected error of a specific node, a splitting criterion is needed, and the standard deviation reduction is the expected error reduction. As shown in Equation (1),
2.5.3. Multiple Linear Regression
Multiple linear regression is a classical statistical tool and supervised machine learning algorithm used to formulate complex input and output relationships [33]. This study adopts the same method as that adopted by Niu et al. [34], which estimates the output value according to the input characteristics of the data of the input model. In regression, features derived from the dataset are used as inputs to the regression model to predict continuous value outputs. This prediction is made by learning the relationship between the input x and the output y. Multiple linear regression models are applicable, where the objective is to find an approximately linear function between a set of independent and dependent variables. The regression line in MLR can be expressed as Equation (2):
2.5.4. Support Vector Regression
Cortes and Vapnik [35] proposed an SVM model in machine learning, which is widely used in pattern recognition, regression, and probability density function estimation. The SVR algorithm is an extension of the SVM model, and the same SVR method as used by Mohammadi et al. [36] was used in this study. SVR can learn and model the nonlinear relationship between input and output data in higher dimensions to minimize the observed training error and distribution error range and achieve generalized regression efficiency [37]. The SVR equation is shown in Equation (3):
3. Materials and Methods
3.1. Feitsui Reservoir
The Feitsui Reservoir is one of the main reservoirs in Taiwan’s Taipei metropolitan area. It is located on the Beishi River, a tributary of the Xindian River. The reservoir covers Xindian District, Shiding District, and Pinglin District in Greater Taipei City, with a total capacity of about 406 million cubic meters, making it the second largest reservoir in Taiwan. The reservoir is about 30 km away from downtown Taipei. The catchment area covers Xindian District, Shiding District, Pinglin District, and Shuangxi District in Greater Taipei City, with a total area of 303 square kilometers, as shown in Figure 1 (https://www.feitsui.gov.taipei/, accessed on 1 October 2022).
The data in this study were collected from the monthly operating report of the Feitsui Reservoir of the Ministry of Economic Affairs and Water Conservancy of the Executive Yuan, and these data cover the period from January 2000 to December 2021. The data are daily data, numbering a total of 8036 data points. The input variables used in the first stage were daily rainfall, daily inflow minus daily outflow, and the historical water levels of the Feitsui Reservoir. The variable description of the first stage data is shown in Table 1. The domestic water demand statistics are from 1 January 2016 to 31 December 2021, a total of 72 monthly data points. Since domestic water demand results are released monthly, this study used the same interpolation method as in Ibanez et al. [38] to convert monthly data into daily time series. The data description of the second stage is shown in Table 2.
3.2. Research Framework
In many types of research on reservoir water levels, many related kinds of research only end with the water level prediction. This study hopes that subsequent warning studies can be conducted after obtaining the water level prediction to provide relevant units as a reference. Therefore, the study was divided into two stages. In the first stage, daily rainfall, daily inflow minus daily outflow, and historical Feitsui Reservoir water level were used to predict the water level of the Feitsui Reservoir in the future. The second stage converted the monthly domestic water demand into daily domestic water demand by the interpolation method. The reservoir water level was converted into water quantity to calculate the remaining days as the output variable. Finally, the WSI proposed in this study was calculated to provide the domestic water warning. The overall research process is shown in Figure 2.
3.2.1. Process of Stage 1
In the first stage, the data source of this study was the monthly operating report of the Feitsui Reservoir of the Ministry of Economic Affairs and Water Conservancy of the Executive Yuan, from 1 January 2000 to 31 December 2021, in the Open Platform of Government data. First, it was determined whether missing values existed in the data, and then a correlation analysis was conducted. An analysis result of zero indicated no correlation between the two variables, and the larger the value, the stronger the correlation [10]. Next, the data were normalized. Then, 70% of the integrated dataset samples were used as training, 15% as validation, and 15% as testing. In machine learning, RF, M5P, LR, and SVR were used as models to predict the water level value of the Feitsui Reservoir on the next prediction days. Finally, R2, RMSE, MAE, and MAPE were used to evaluate the model’s performance, as shown in Figure 3.
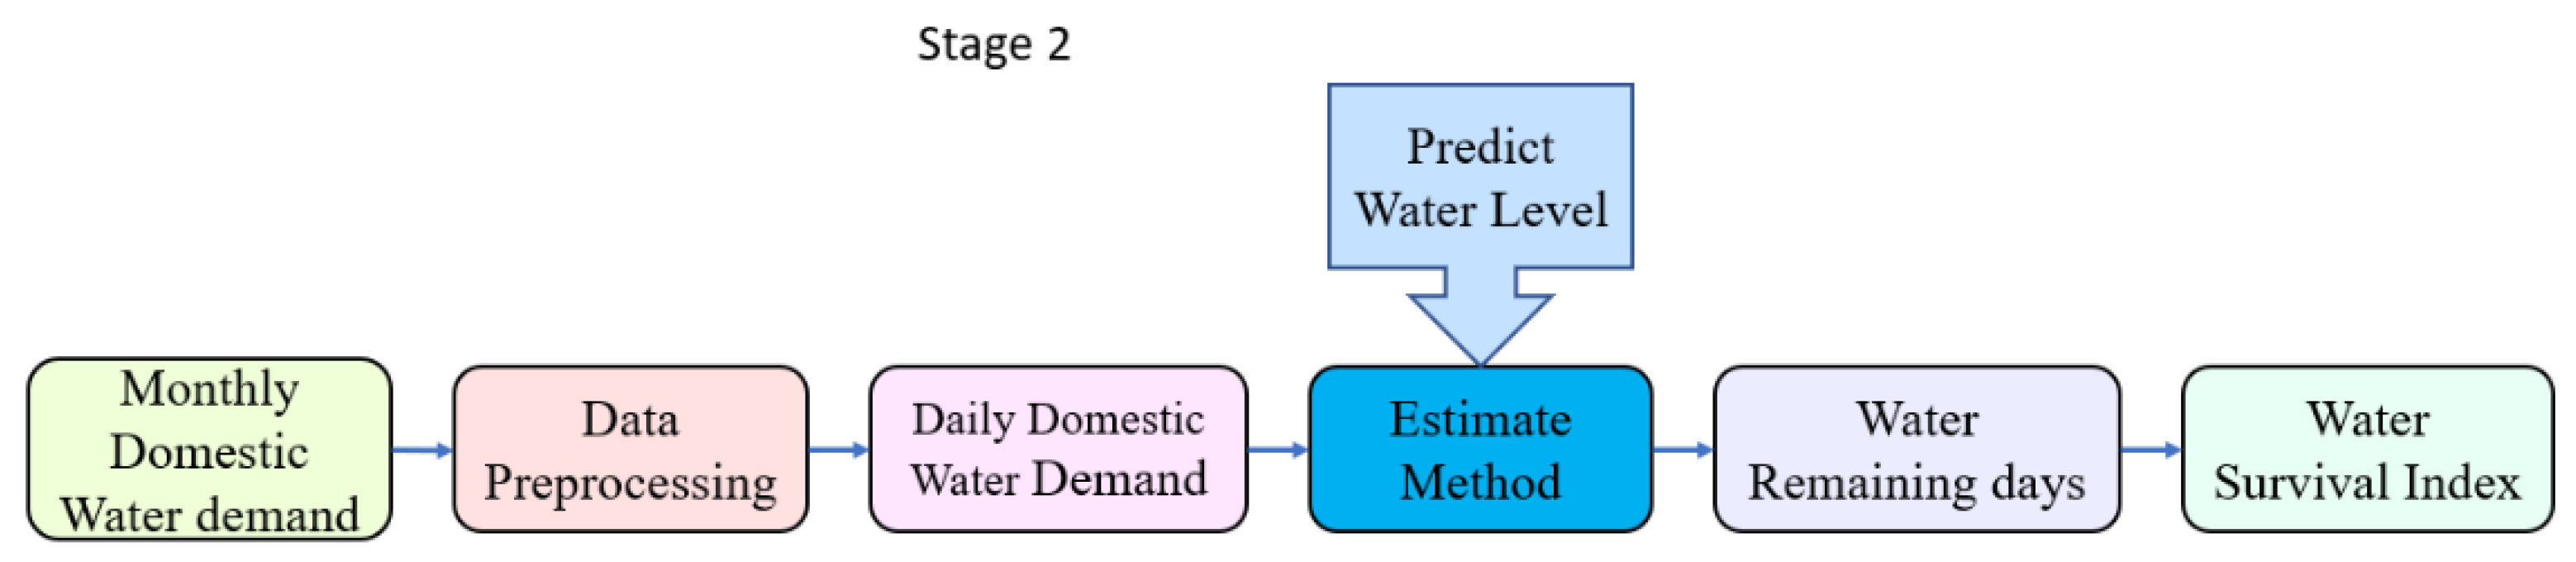
3.2.2. Process of Stage 2
Figure 4 shows the input and output of the second stage of this study. The input of the second stage was the historical domestic water demand. This study obtained the statistics of domestic water consumption from the open data platform of the Water Resources Bureau of the Ministry of Economic Affairs, Executive Yuan; these data were from 1 January 2016 to 31 December 2021. Firstly, the monthly data of domestic water consumption were converted into daily domestic water consumption statistics by the interpolation method, and the best result of water level prediction of the Feitsui Reservoir in the first stage were used as the input variables, the amount of water converted to the Feitsui Reservoir was calculated, and then the remaining days of domestic water as the output variable were calculated. Secondly, the proposed WSI was calculated to provide water warnings for people. In order to provide short-term and long-term warning predictions of domestic water consumption, this study divided the WSI into short-term and long-term warnings of 30 days, 90 days, and 180 days. Three types of water signals, namely, condition blue, condition green, and condition red, were also defined to provide warnings. More detailed calculations of the subsistence WSI are explained in the next section.
3.3. Water Survival Index (WSI)
In a report on the effective water storage of the Feitsui Reservoir by the Accounting Office of the Taipei Municipal Government, the effective water storage equation of Feitsui Reservoir was not mentioned, and the current water supply monitoring index also could not give people a precise number to achieve an effective reminder. Therefore, this study proposes a method for the remaining days of domestic water consumption in Greater Taipei City and calculates the short-term and long-term survival water index.
In this study, the reservoir’s water levels, y1(t + 1), y2(t + 30), y3(t + 90), and y4(t + 180), were predicted from Stage 1 first and then multiplied by the effective area of the reservoir to obtain the effective water storage (WS) capacity of the reservoir. Then, the effective water storage capacity of the reservoir was divided by the daily domestic water demand of the population of Greater Taipei City, and the result was the remaining days (RDs) of water in the reservoir. By calculating the bias ratio of RD, the proposed WSI was obtained. The WSI proposed was divided into short-term and long-term, and the warning was divided into 30 days, 90 days, and 180 days. The three signals of condition blue, condition green, and condition red were given to provide the warning. The remaining days of domestic water demand in the reservoir are shown in Equation (4):
- RD = The remaining days of domestic water demand in the reservoir;
- WS = Effective water storage capacity of the reservoir;
- POP = The population of Great Taipei (currently assume a Taipei City population of 2.49 million and a New Taipei City population of 3.99 million);
- WD = Domestic water demand per person in Greater Taipei.
The bias ratio is a technical indicator extended by the buying and selling rule of the moving average of the stock price to analyze the degree of deviation of the stock price from the average price (average cost) of a certain period, and the bias ratio can be divided into positive bias ratio and negative bias ratio. According to Brock et al. [39], a buy (sell) signal for a stock occurs when the short-term moving average is above (below) the long-term moving average. Fifield et al. [40] also argued that the moving average rule relies on comparing short-term and long-term moving averages to generate buying and selling signals.
This study extended the concept of bias ratio to water demand and supply. When the remaining days of domestic water demand are above the historical moving average, it is called a positive bias ratio and means that the domestic water supply is sufficient to satisfy the demand. When the remaining days of the reservoir’s domestic water demand are below the historical moving average, it is called a negative bias ratio and indicates that the domestic water supply may be insufficient to satisfy the demand. Therefore, this study proposed a modified equation for calculating the WSI to represent the bias ratio of the remaining days of domestic water supply, as shown in Equation (5):
where
- WSIi,j (t + 1): Water survival index at time t + 1 (i = 6 or 12),(j = 30, 90, 180);
- RDp(t + 1): The predicted value of the remaining days of the reservoir’s domestic water demand at time t + 1;
- RDi(t + 1): The i-year historical average of the remaining days of the reservoir’s domestic water demand at time t + 1.
As defined in this study, the short-term water survival index is taken as a 6-year moving average (i = 6):
where WSI6,j(t + 1) < − 3% is condition red; WSI6,j(t + 1) > 3.5% is condition blue; the others are condition green.
WSI6, j(t + 1) = [RDp(t + 1) − RD6(t + 1)]/RD6(t + 1) × 100%
As defined in this study, when the water survival index is taken as a 12-year moving average (i = 12), it is the long-term water survival index.
where WSI12,j(t + 1) < − 4.5% is condition red; WSI12,j(t + 1) > 5% is condition blue; the others are condition green.
WSI12, j(t + 1) = [RDp(t + 1) − RD12(t + 1)]/RD12(t + 1) × 100%
The solid line presents the short-term WSI6,j defined in this study, and the long-term WSI12,j is presented by the solid line plus the dashed line. The WSI is at 30, 90, and 180 days.
3.4. Performance Metrics
In this study, four evaluation methods of Ibanez et al. [38] were used to evaluate the accuracy of the model, including coefficient of determination (R2), root means square error (RMSE), mean absolute error (MAE), and mean absolute percentage error (MAPE). While R2 describes the difference between observations and predictions, in the case of multiple regression, the variance of observations is predictable. RMSE describes the model’s overall accuracy, and a small RMSE indicates superior prediction performance. MAE is another loss function used in regression models and is the sum of the absolute values of the difference between the target and predicted values. The evaluation metrics are shown in Equations (6)–(9):
4. Results
4.1. Data Preprocessing
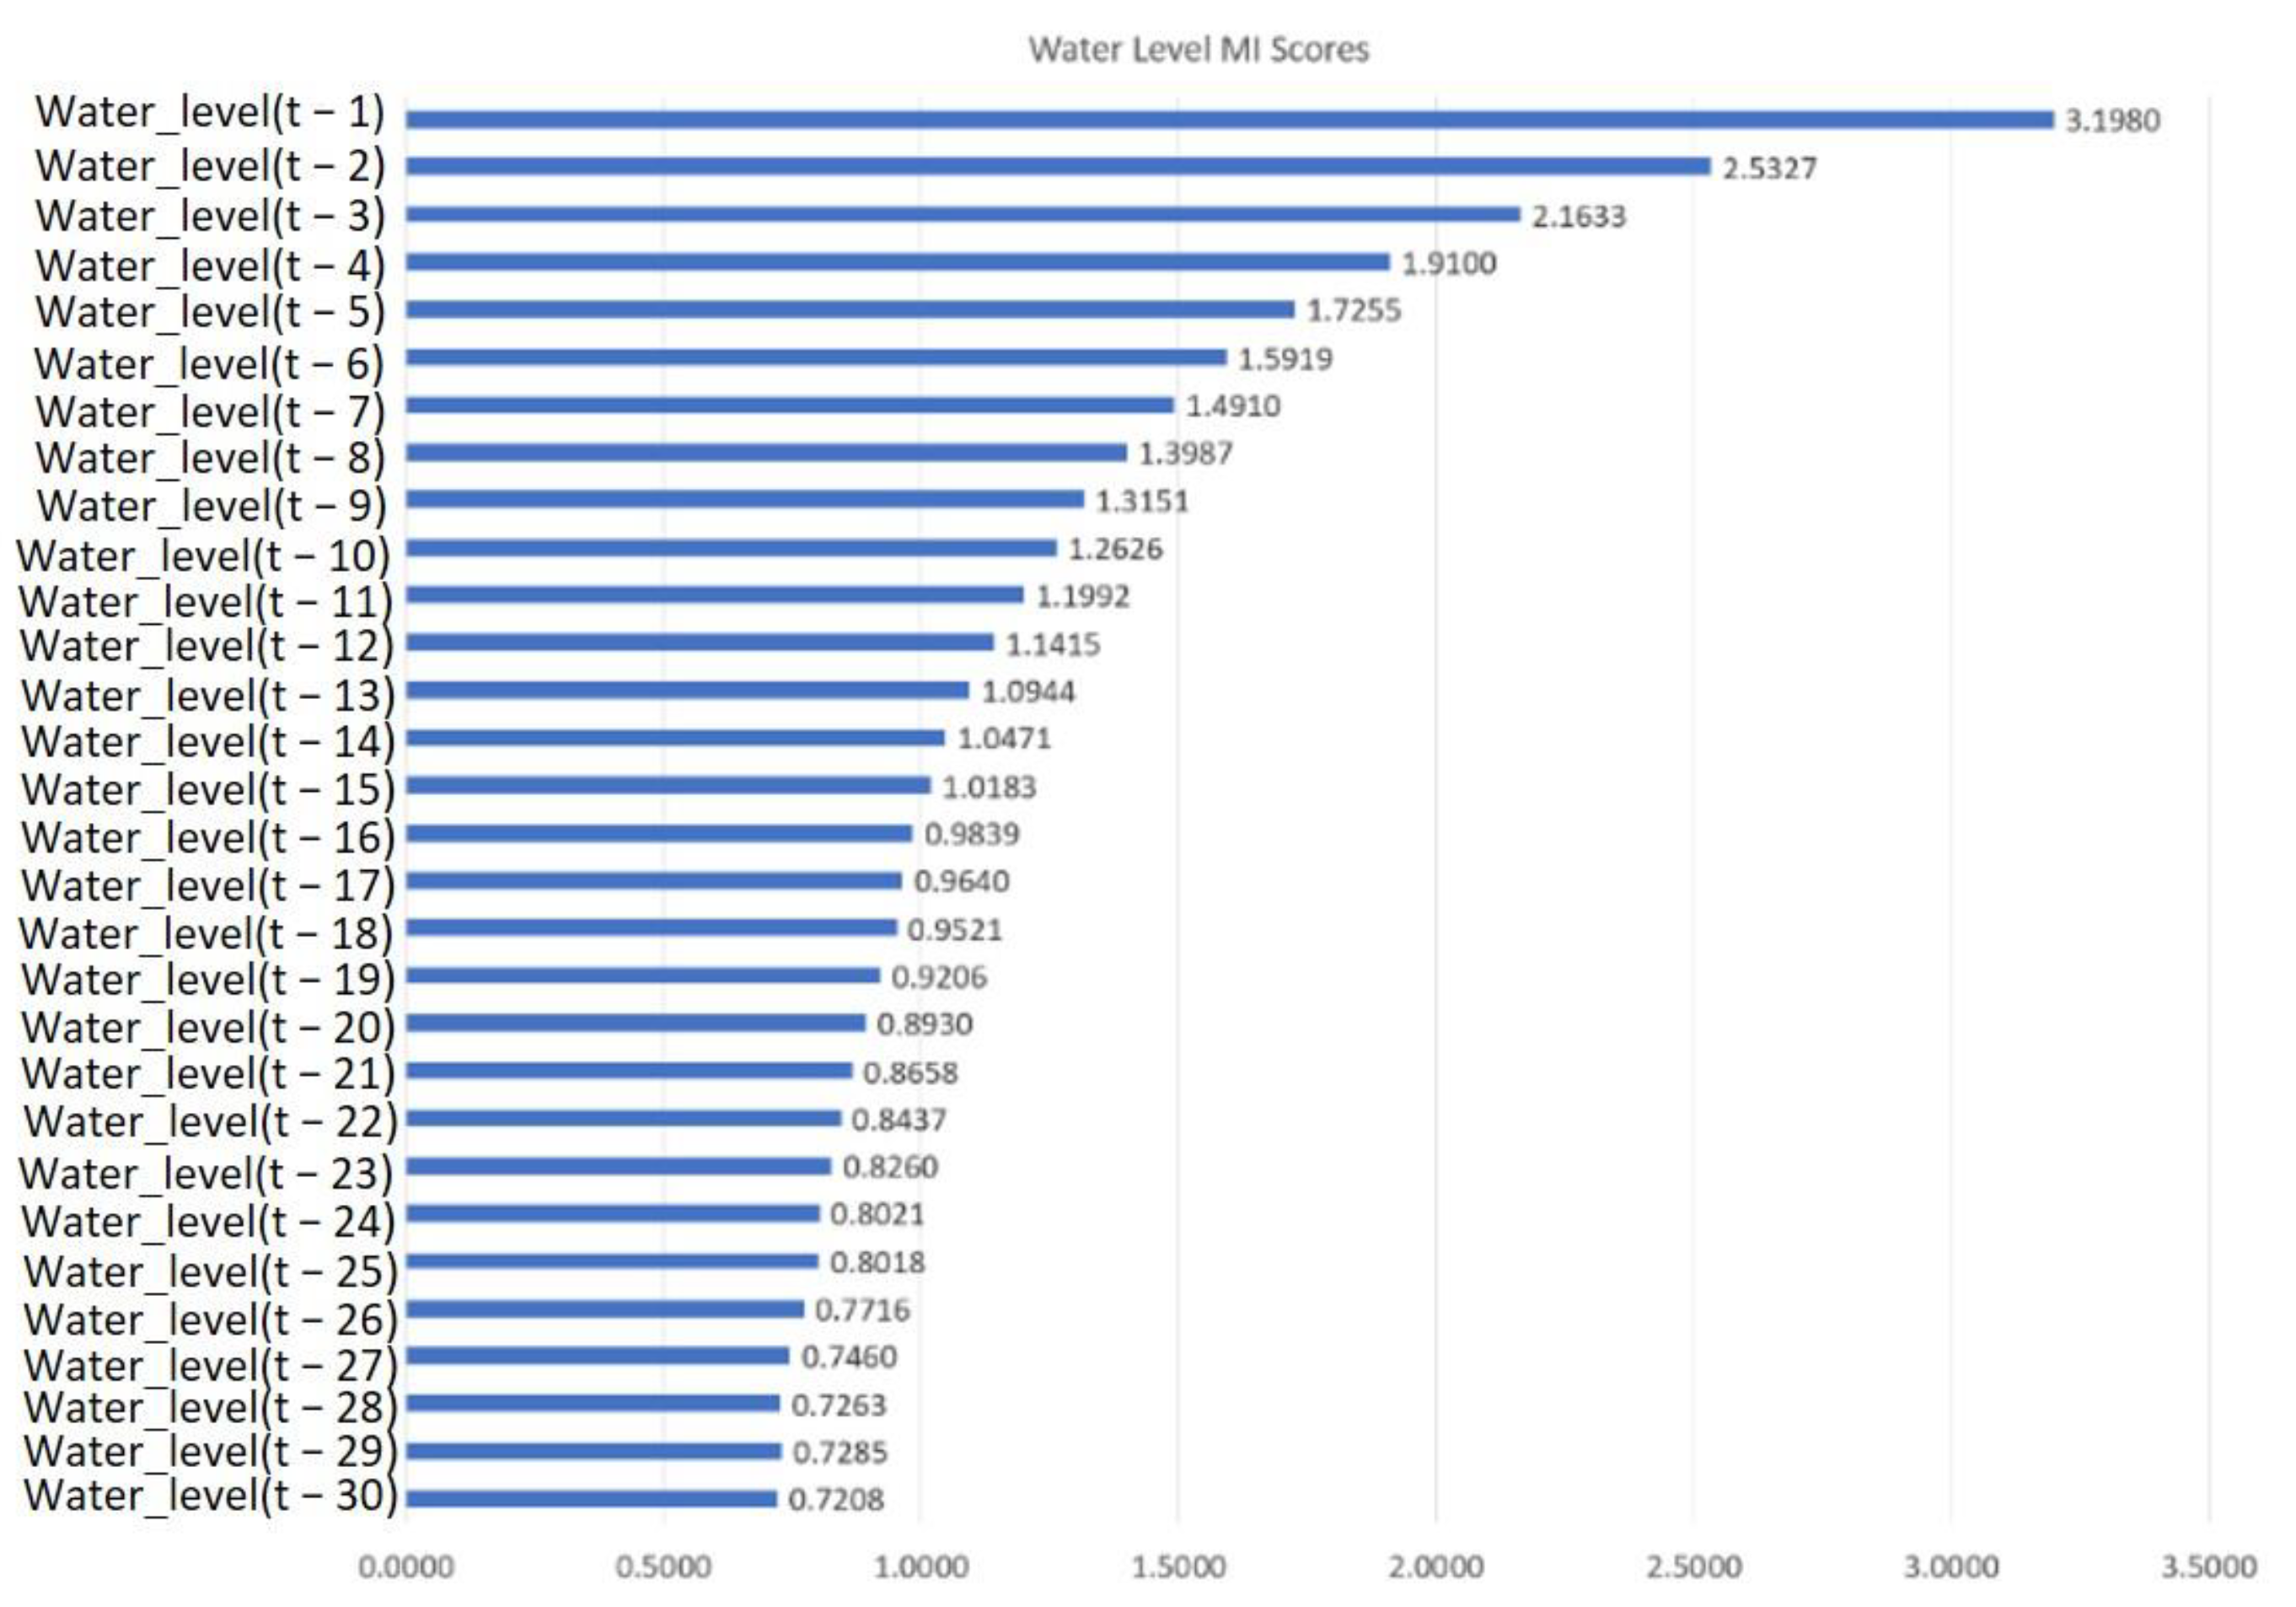
In this study, the time capture range of the Feitsui Reservoir operation monthly report data was set as 1 January 2000 to 31 December 2021, with a total of 8036 data points. First, the IsNull method of the DataFrame object in Python was used to check whether there were any missing values in the data table. Then, the sum method was applied to return several missing values in each feature field, and the return number of each field was 0 to verify that there were no missing values. In addition, Mutual Information (MI) was used for correlation analysis. Firstly, the study conducted an autocorrelation analysis of the daily water level of the Feitsui Reservoir, as shown in Figure 5. Secondly, a correlation was made between the daily water level of the Feitsui Reservoir and the delay of daily rainfall in the catchment area. Finally, a correlation was made between the daily water level of the Feitsui Reservoir and the daily inflow minus the daily outflow of the reservoir. In the final process of data pre-processing, the data of the Feitsui Reservoir with a daily water level delayed for 15 days were selected for the subsequent study. Due to the significant differences between the values of each variable data, this study used normalization and finally used 70% of the integrated dataset samples as training, 15% as validation, and 15% as testing.
4.2. Results of Stage 1
In the first stage of this study, four methods, namely, random forest (RF), tree regression algorithm (M5P), multiple linear regression (MLR), and support vector regression (SVR), were used to predict the reservoir water level with the segmentation method of 70% training, 15% validation, and 15% testing. The test results of the water level prediction model in this study are shown in Table 3. Among these four methods, the model evaluation results of SVR, R2, RMSE, and MAPE were 0.9980, 0.2234, and 0.0772, respectively, which were the best among the four methods, while the model evaluation of MLR was the worst among the four methods. Therefore, SVR was used in this study to make subsequent water level predictions.
4.3. Results of Stage 2
The second stage of this study was to use SVR to predict the reservoir water level after 30, 90, and 180 days and then calculate the effective storage volume of the reservoir from the reservoir water level, dividing the current effective reservoir capacity by the daily domestic water demand of the Greater Taipei City’s population. The result was the number of days remaining in the reservoir. Finally, the WSI proposed in this study was obtained by using short-term and long-term bias ratios. The calculation results of the WSI are explained in the next section.
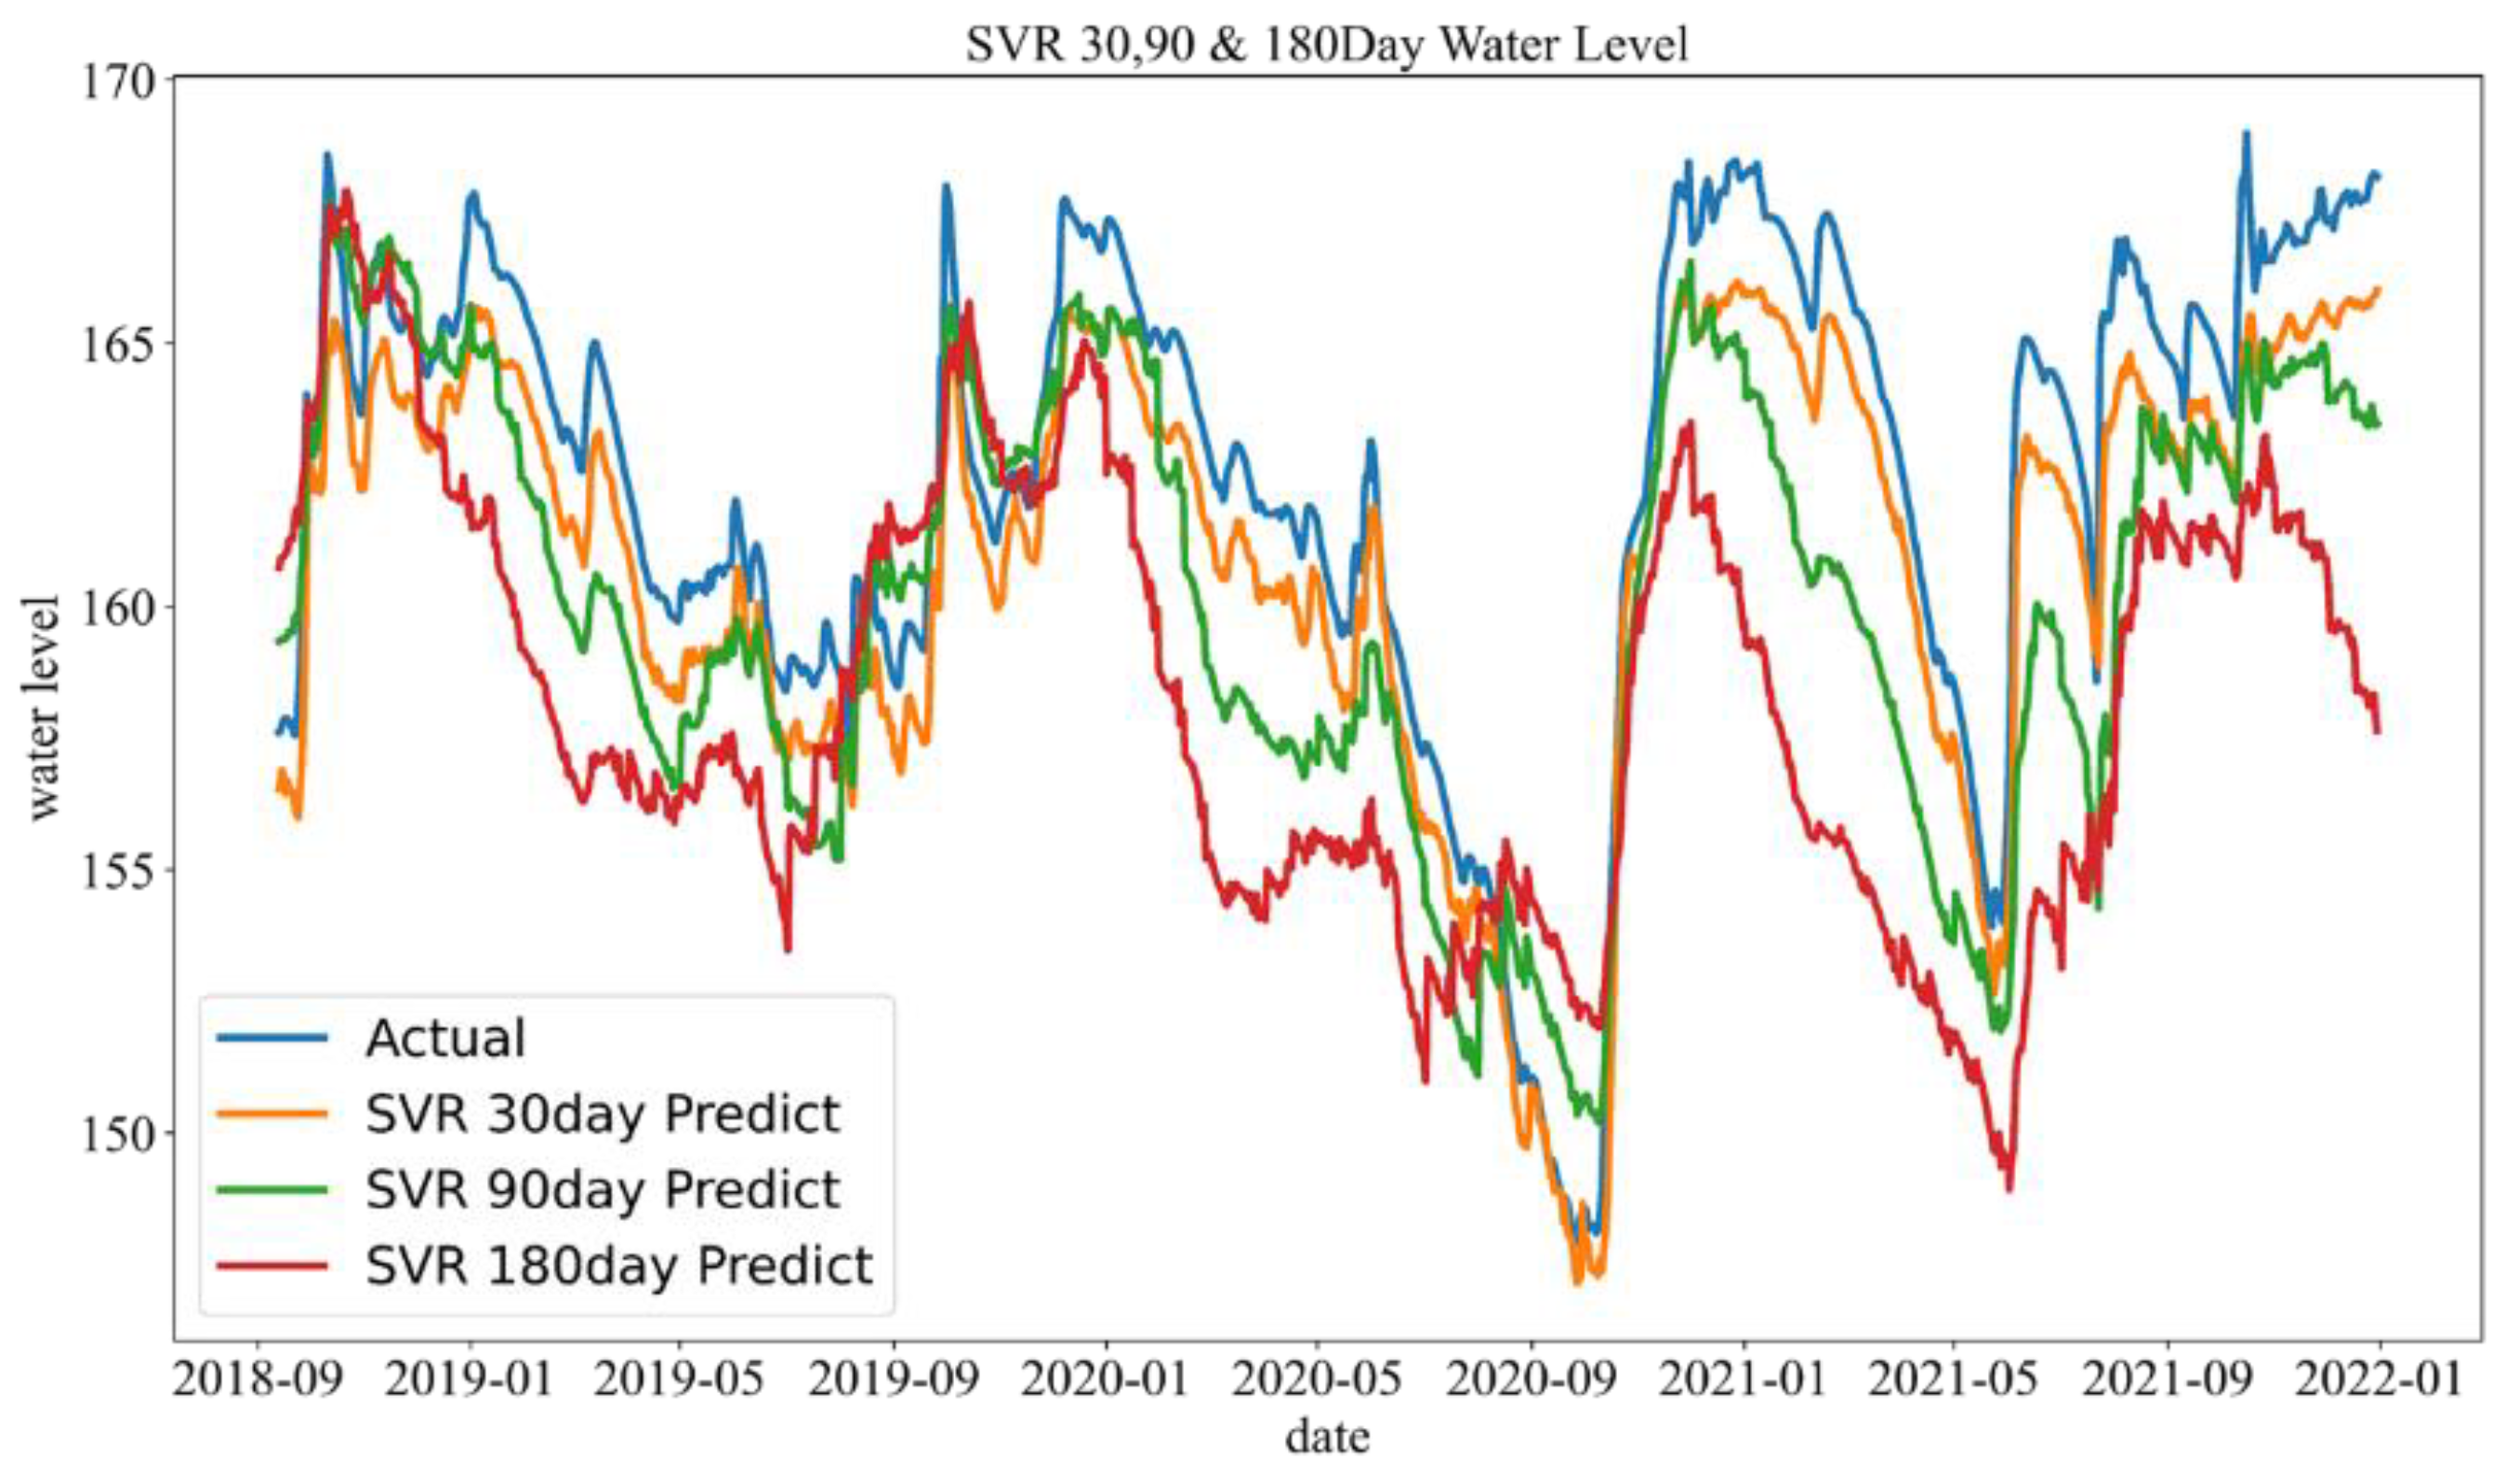
In the second stage of this study, SVR was used to predict the reservoir water level after 30 days, 90 days, and 180 days. The prediction results are shown in Figure 6, and Table 4 shows the evaluation of the SVR prediction model.
As can be seen from Table 4, the R2 value of SVR’s prediction results of reservoir water levels after 30 days and 90 days was greater than 0.5, indicating good prediction results. However, the R2 of SVR’s prediction results of the reservoir water level after 180 days was less than 0.5, indicating poor prediction results. Therefore, this study preferred not to discuss the WSI after 180 days.
4.4. Results of WSI
The WSI was calculated by using SVR to predict the water level of the reservoir after 30, 90, and 180 days and then predicting the effective storage volume of the reservoir from the water level of the reservoir and dividing the current effective reservoir capacity by the daily domestic water demand of Greater Taipei City’s population. The result was the number of days remaining in the reservoir. Finally, the water survival index WSIi,j proposed in this study was obtained by using the short-term and long-term bias ratio calculation methods. When the water survival index was calculated as the 6-year moving average (i = 6), it was the short-term WSI6,j, and when the water survival index was calculated as the 12-year moving average (i = 12), it was the long-term WSI12,j.
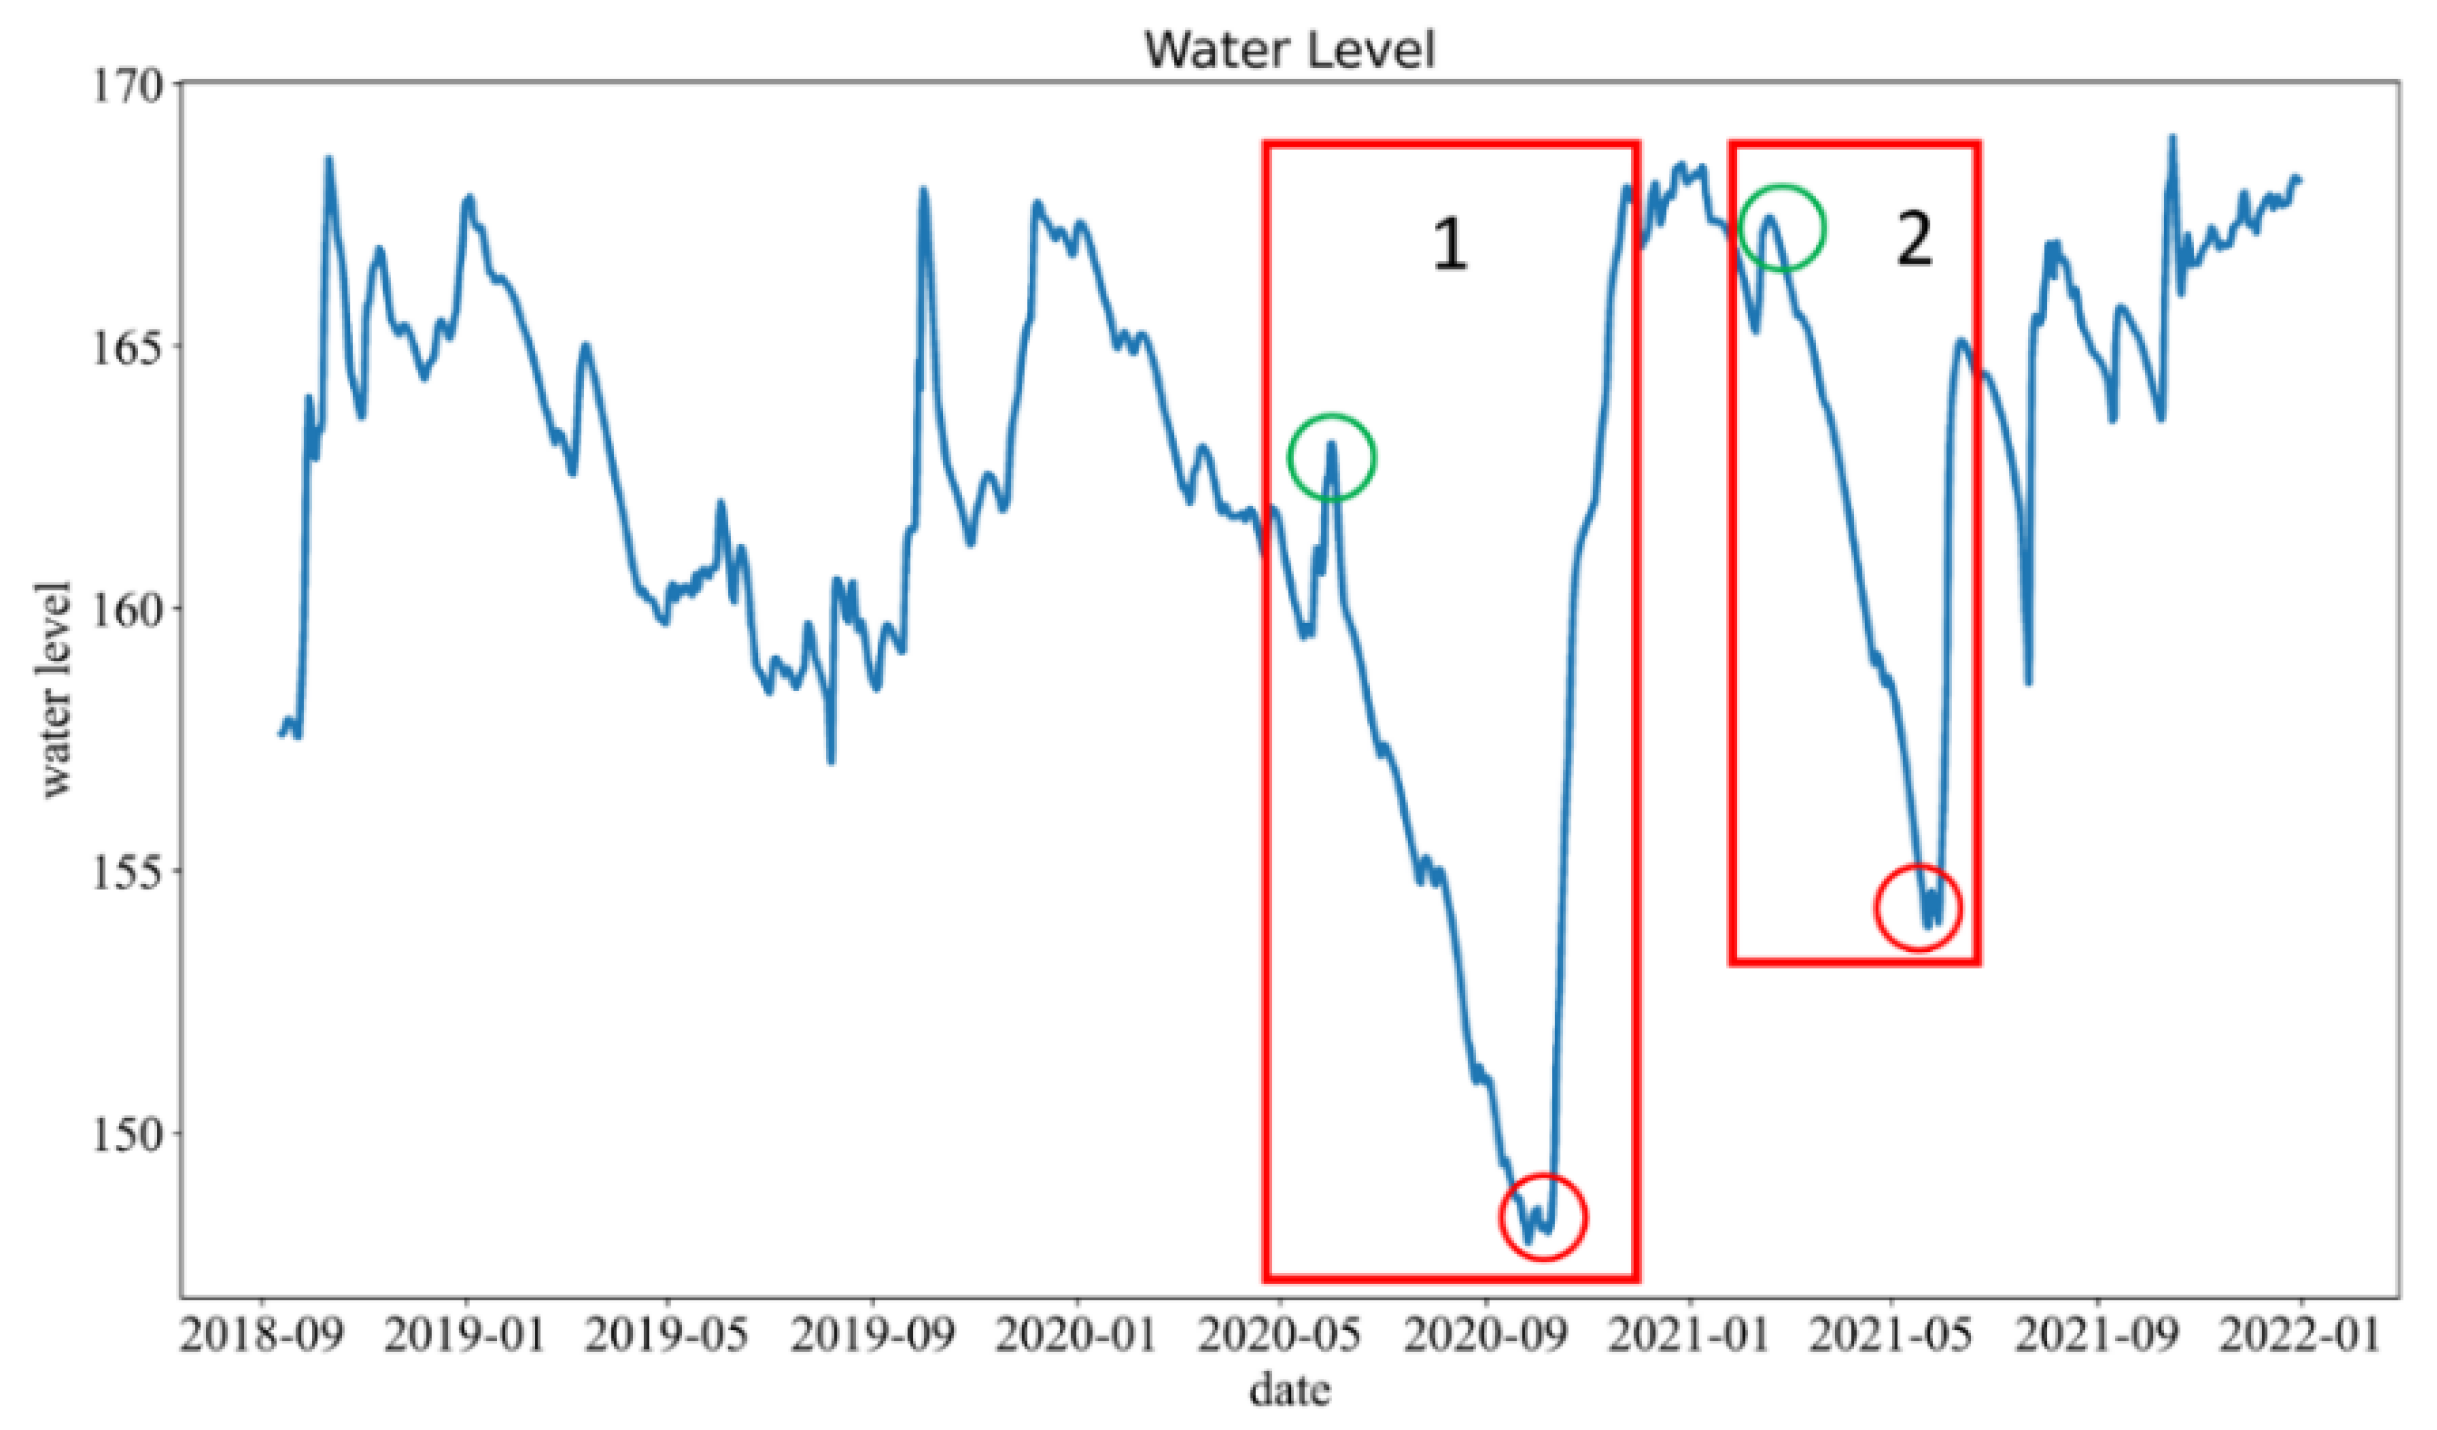
As the warning of the reservoir water level focuses on the warning of a water shortage, two periods with large water shortage levels were marked with red frames in this study, as shown in Figure 7, so as to facilitate subsequent discussion. Zone 1 had 117 days from the green circle high on 2 June 2020 to the red circle low on 27 September 2020, and Zone 2 had 101 days from the green circle high on 18 February 2021 to the red circle low on 30 May 2021.
The research results of calculated short-term WSI6,30 after 30 days (j = 30) are shown in Figure 8, and the research results of long-term WSI12,30 are shown in Figure 9, where the water survival index values were WSIj,30 RED (condition red, reducing water delivery), WSIj,30 BLUE (condition blue, water supply normal), and the WSIj,30 GREEN (condition green, water supply preparedness).
As can be seen from Figure 8, in Zone 1, there were condition red (reducing water delivery) alerts at WSI6,30 on 2020/5/13, and there were continuous red alerts, denoting the short-term survival water index WSI6,30, which could give warning of water shortage in the reservoir 20 days in advance. However, in Zone 2, WSI6,30 began to put forward the warning of reservoir condition red after 19 March 2021.
In addition, as can be seen from Figure 9, in Zone 1, there were condition red (reducing water delivery) alerts on 22 May 2020 for the long-term water survival index WSI12,30, and there were continuous red alerts, which indicated that the long-term water survival index WSI12,30 could give warnings of a water shortage in the reservoir 11 days in advance. However, in Zone 2, the long-term water survival index WSI12,30 began to give the condition red warning on 19 March 2021.
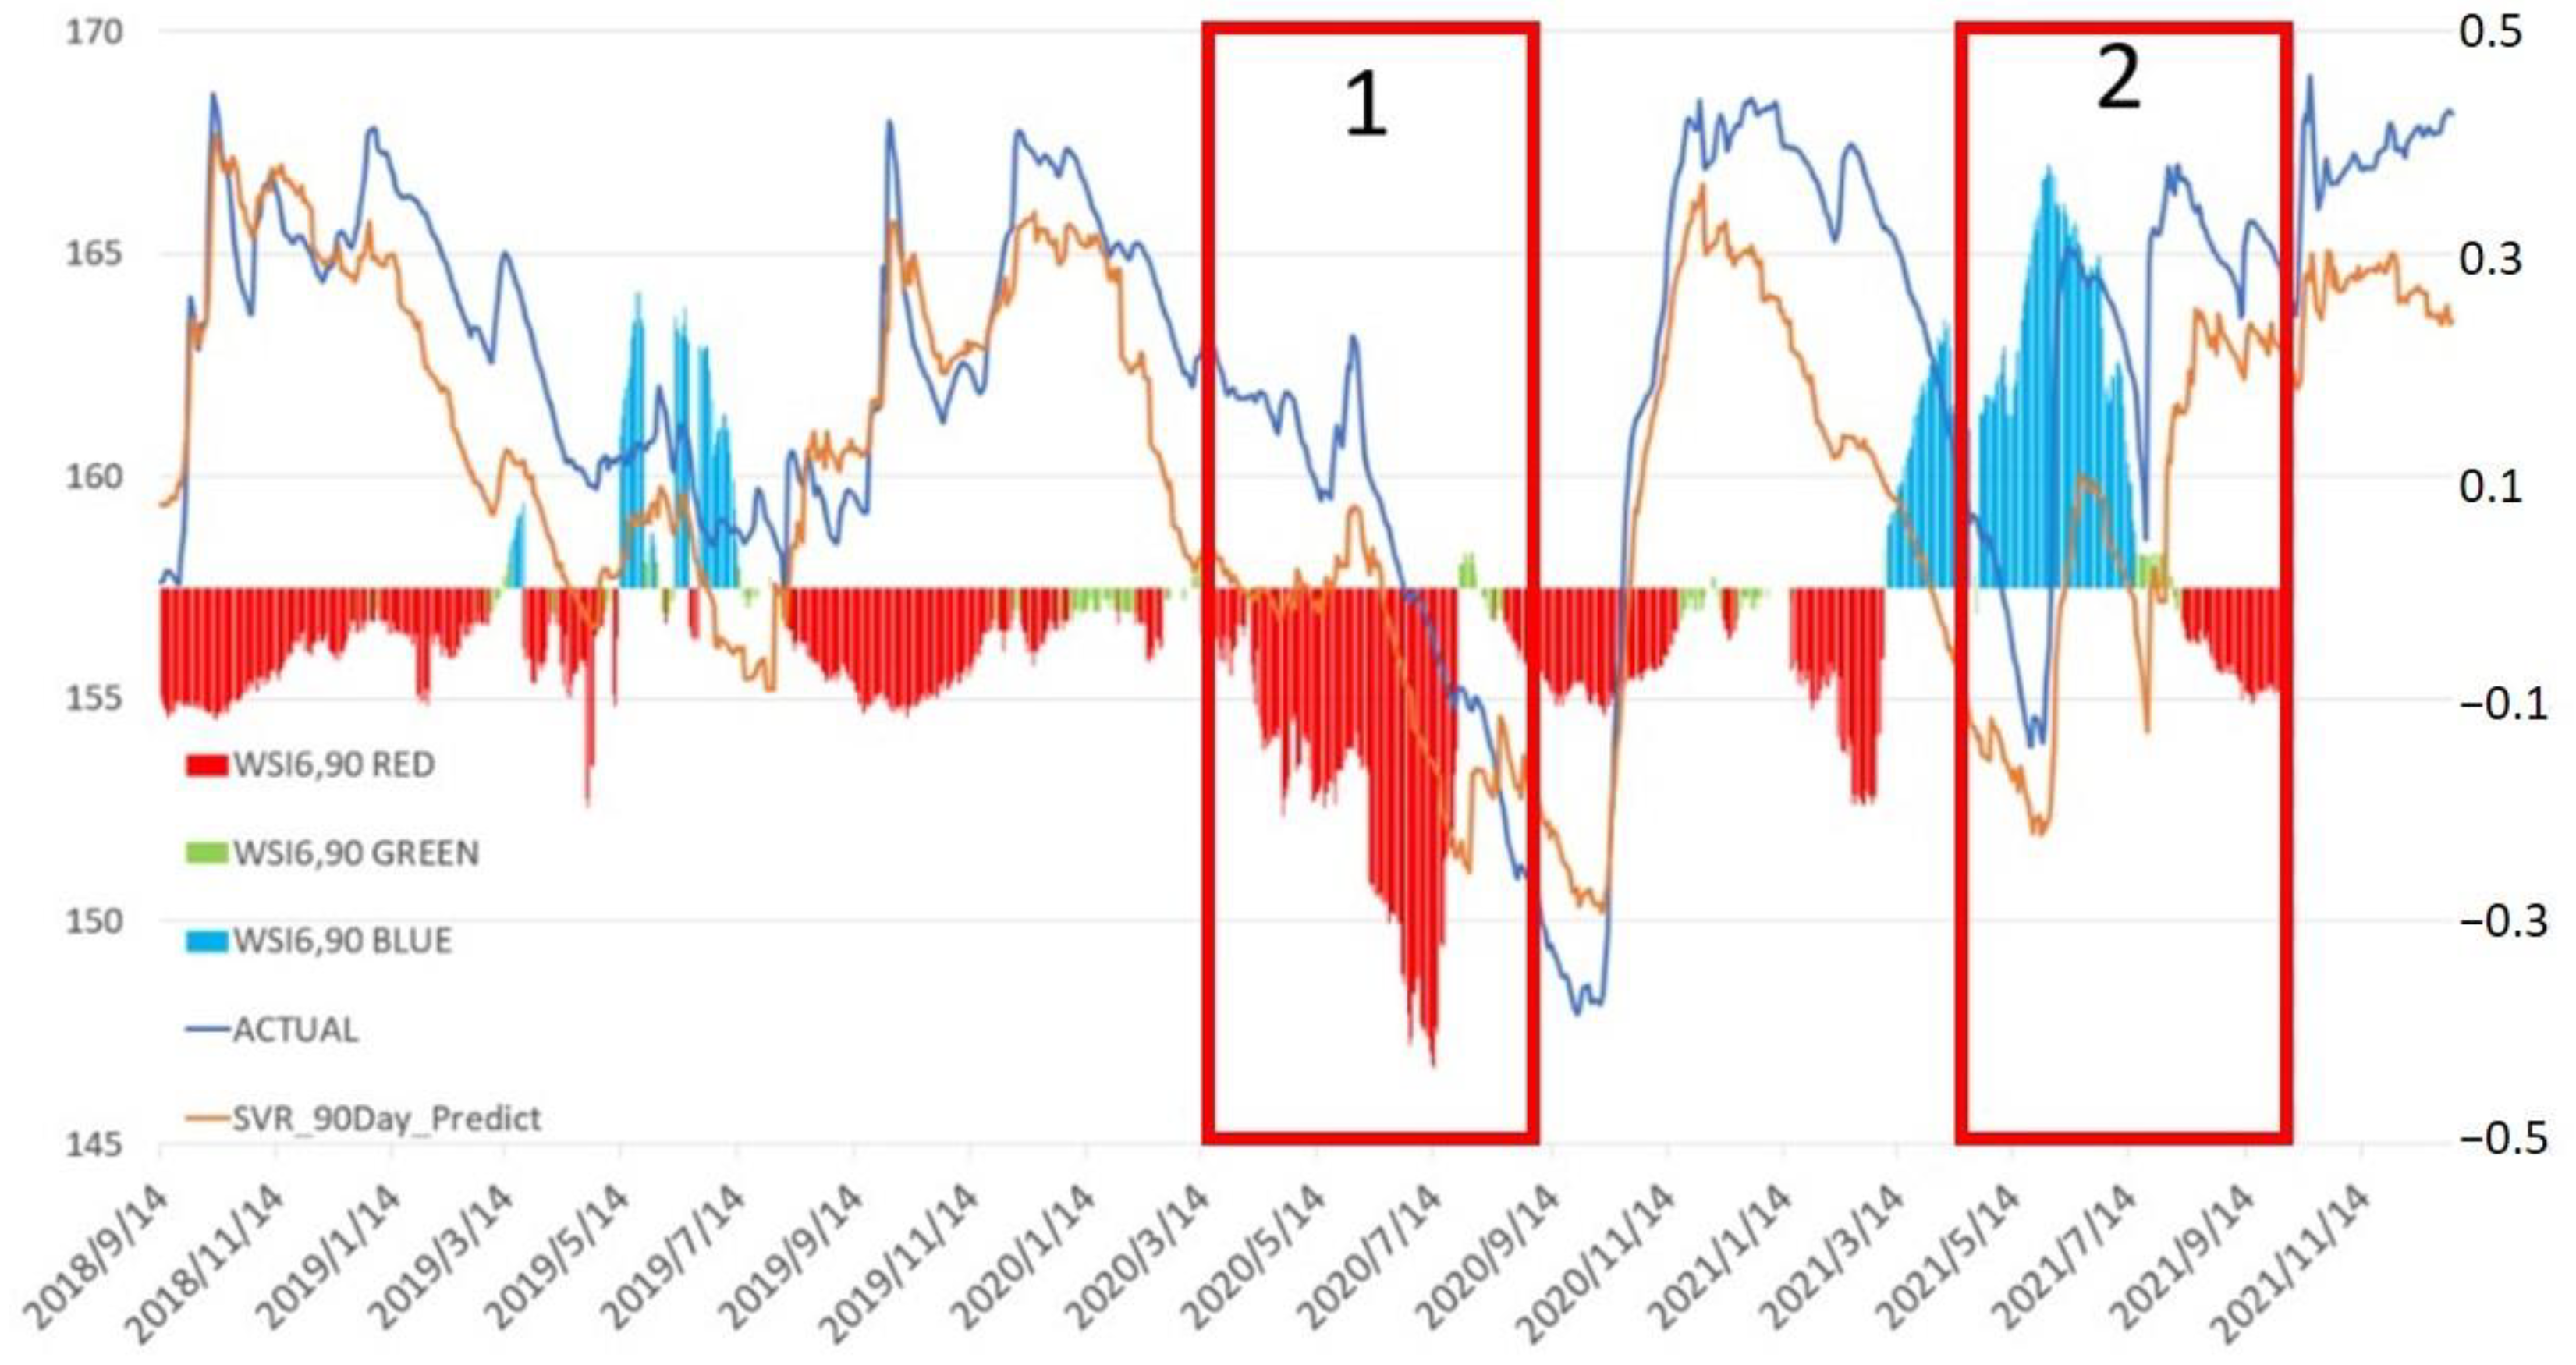
The calculated short-term survival water index WSI6,90 after 90 days (j = 90) is shown in Figure 10, while the long-term survival water index WSI12,90 is shown in Figure 11, where the values of the water survival index were as follows: WSIj,90 RED (condition red, reducing water delivery), WSIj,90 BLUE (condition blue, water supply normal), and WSIj,90 GREEN (condition green, water supply preparedness).
As can be seen from Figure 10, in Zone 1, the short-term survival water index WSI6,90 presented condition red (reducing water delivery) alerts on 14 March 2020 and continuously presented red alerts, denoting the short-term survival water index WSI6,90, which could give warnings of water shortages in reservoirs 80 days in advance. However, in Zone 2, WSI6,90, the warning of condition red, was presented 30 days in advance on 19 January 2021.
In addition, it can be seen from Figure 11 that in Zone 1, there were condition red (reducing water delivery) alerts for long-term survival water index WSI12,90 on 4 March 2020, reducing continuously, and the long-term survival water index WSI12,90 could give a warning of a water shortage 72 days in advance. However, in Zone 2, the long-term survival water index WSI12,90 gave the warning of condition red 30 days in advance on 4 March 2020.
As shown in Table 4, the SVR prediction value of the reservoir water level after 180 days was not good; we skipped the research results of two water survival indexes, namely, WSI6,180 and WSI12,180 at 180 days.
5. Discussion
5.1. Stage 1 Research Result Discussion
In the results of Figure 6, the predicted water levels seem consistently lower than the true values. The main reason for this gap is that the proposed model uses the current reservoir water level value to predict the reservoir water level after 30 days and 90 days. If a constant can be added to adjust the prediction model, then the model will be invulnerable.
In addition, Zhu et al. [9] mentioned in their study that the deep learning (DL) model is not superior to the traditional feedforward neural network (FFNN) model in predictions of lake levels; for lake level predictions, the use of traditional machine learning models is sufficient if the model is well calibrated. In order to verify such a conclusion, deep learning methods such as GRU, LSTM, and MLP are also used in this study to predict the water level of the Feitsui Reservoir, and the evaluation and comparison of SVR and deep learning models are shown in Table 5. According to the research results in Table 5, the performance of deep learning in predictions of reservoir water levels is no better than that of machine learning SVR; moreover, deep learning takes a longer time than SVR, so it is reasonable to use machine learning models in water level predictions in this study.
This study sorted out studies related to reservoir water levels and compared model performance, as shown in Table 6. It can be seen from the table that while most studies related to reservoirs make short-term predictions from the next 3 h to 30 days, the water level prediction in this study is the same as that proposed by Ibanez et al. [38], which is 1 day, 30 days, 90 days, and 180 days. The performance comparison at 1 day and 180 days in this study is slightly worse than that of Ibanez et al. [38]. The results of this study at 30 days and 90 days are better than those of Ibanez et al. [38].
5.2. WSI Performance Measures
In order to verify the warning effect of the water survival index, this study intended to compare the WSI with the Drought Warning Stage. The Drought Warning Stage data source is the Government Data Open Platform Taichung Ministry of Economic Affairs Water Conservancy (https://data.gov.tw/dataset/36695, accessed on 1 October 2022), and this information provides the water supply Drought Warning Stage (DWS) notification for various regions in Taiwan. Data were collected from 1 January 2021 to 31 December 2021 for comparison.
Figure 12 shows the comparison of the warning lights of the Drought Warning Stage for the short-term survival water index WSI6,j (j = 30, 60, 180). Figure 12a shows the comparison between the water level of the Drought Warning Stage of the Water Conservancy Department and the Feitsui Reservoir. In 2021, the water condition light of the Feitsui Reservoir was always condition blue. Figure 12b–d show the comparison of reservoir water levels with the water survival indices WSI6,30, WSI6,90, and WSI6,180 proposed in this study. It was found that the water level of the reservoir was very low during the period of 18 April 2021 to 5 June 2021, and the water survival index WSI6,j from this study had shown a condition red warning. However, the water supply monitoring index in the Drought Warning Stage of the Water Conservancy Department remained in condition blue. The results show that the short-term water survival index proposed in this study can actually present the effect of early warning.
Figure 13 shows the comparison of the water supply monitoring index between the Drought Warning Stage of the Water Conservancy Department and the long-term water survival index WSI12,j (j = 30, 60, 180). Figure 13a shows that the condition blue of the Drought Warning Stage of the water Conservancy Department always indicated normal water conditions. Figure 13b–d show the long-term water survival indices proposed in this study, including the WSI12,30 warning, WSI12,90 warning, and WSI12,180 warning. It was found that the water level of the reservoir had been low during the period from 19 April 2021 to 4 June 2021, and the long-term water survival index WSI12,j in this study showed condition red warnings, but the water supply monitoring index of the Feitsui Reservoir remained in condition blue. The results show that the long-term water survival index proposed in this study can also actually present the effect of early warning.
When designing the proposed WSI, there is a premise assuming that in the absence of an external force intervention, there is no significant difference between the reservoir water level on a certain day and the average value of the reservoir water level on that day in past years. If the difference is too large, a condition red or condition blue light may be applied. Therefore, if the reservoir water level seems high on one day, why is the condition red light generated? It is purely because the reservoir water level of that day is different from the historical statistical average of that day. Possible solutions to avoid this situation is to consider the historical reservoir water level of that day and the bias ratio of the current year’s reservoir water level at the same time. This issue will be left to other researchers for future research.
6. Conclusions
A reservoir is an integrated water resource management infrastructure that can be used for water storage, flood control, power generation, and recreational activities. Predicting reservoir levels is critical for water supply management and can influence operations and intervention strategies. Taking the Feitsui Reservoir as an example, this study proposes a new water survival index to warn users whether there will be a shortage of domestic water in the future. The research results show that compared with the existing water supply monitoring index, the new water survival index proposed in this study can faithfully present the warning of the lack of domestic water in the future.
The results of this study are limited to the Feitsui Reservoir. Since the data on the Feitsui Reservoir are relatively complete, and the water supply of the Feitsui Reservoir is limited to the domestic water supply of the Greater Taipei City area, it is easier to estimate the demand for water sources. For many reservoirs that not only supply water for people’s domestic water demand, it is not easy to calculate the consumption of water; therefore, the research results of this study may not be very applicable. In addition, when calculating the WSI using a bias ratio, the WSI currently uses moving averages of 6 years and 12 years as the short-term and long-term bias ratios, respectively; if the set value of the bias ratios is different, the research results may be different, which can be used as a reference for future researchers to do further investigation.
Machine learning was adopted in this study to predict the reservoir’s water level, mainly because the result of deep learning in this study was slightly inferior to that of machine learning. If similar cases are encountered in the future, deep learning can still be referred to, and the prediction effect may be different.
Author Contributions
Conceptualization, D.-H.S., C.-H.L. and M.-H.S.; data curation, T.-W.W. and H.-S.C.; formal analysis, D.-H.S. and H.-S.C.; funding acquisition, D.-H.S. and C.-H.L.; investigation, T.-W.W.; methodology, D.-H.S. and H.-S.C.; project administration, D.-H.S.; resources, M.-H.S.; supervision, D.-H.S.; validation, C.-H.L., T.-W.W. and H.-S.C.; visualization, C.-H.L.; writing—review and editing, T.-W.W. and M.-H.S. All authors have read and agreed to the published version of the manuscript.
Funding
This work was partially supported by the Taiwan Ministry of Science and Technology (grants MOST 111-2410-H-224-006). The funder had no role in study design, data collection and analysis, decision to publish, or preparation of the manuscript.
Institutional Review Board Statement
Not applicable.
Informed Consent Statement
Not applicable.
Data Availability Statement
Not applicable.
Conflicts of Interest
The authors declare no conflict of interest.
References
- Aviso, K.B.; Chien, C.-F.; Lim, M.K.; Tan, R.R.; Tseng, M.-L. Taiwan Drought was a Microcosm of Climate Change Adaptation Challenges in Complex Island Economies. Process Integr. Optim. Sustain. 2021, 5, 317–318. [Google Scholar] [CrossRef]
- Wu, R.S.; Liu, J.S.; Chang, J.S. Modeling Irrigation System for Water Management of a Companion and Inter Cropping Field in Central Taiwan. In Proceedings of the 2nd World Irrigation Forum, Chiang Mai, Thailand, 6–8 November 2016; pp. 6–8. [Google Scholar]
- Graf, W.L. Geomorphology and American dams: The scientific, social, and economic context. Geomorphology 2005, 71, 3–26. [Google Scholar] [CrossRef]
- Ishak, W.H.W.; Ku-Mahamud, K.R.; Norwawi, N.M. Neural network application in reservoir water level forecasting and release decision. Int. J. New Comput. Archit. Appl. 2011, 1, 256–274. [Google Scholar]
- Tsao, H.-H.; Leu, Y.-G.; Chou, L.-F.; Tsao, C.-Y. A Method of Multi-Stage Reservoir Water Level Forecasting Systems: A Case Study of Techi Hydropower in Taiwan. Energies 2021, 14, 3461. [Google Scholar] [CrossRef]
- Khaliq, M.N.; Ouarda, T.B.; Gachon, P.; Sushama, L.; St-Hilaire, A. Identification of hydrological trends in the presence of serial and cross correlations: A review of selected methods and their application to annual flow regimes of Canadian rivers. J. Hydrol. 2009, 368, 117–130. [Google Scholar] [CrossRef]
- Karunanayake, C.; Gunathilake, M.B.; Rathnayake, U. Inflow forecast of iranamadu reservoir, Sri Lanka, under projected climate scenarios using artificial neural networks. Appl. Comput. Intell. Soft Comput. 2020, 2020, 8821627. [Google Scholar] [CrossRef]
- Seo, Y.; Kim, S.; Kisi, O.; Singh, V.P. Daily water level forecasting using wavelet decomposition and artificial intelligence techniques. J. Hydrol. 2015, 520, 224–243. [Google Scholar] [CrossRef]
- Zhu, S.; Hrnjica, B.; Ptak, M.; Choiński, A.; Sivakumar, B. Forecasting of water level in multiple temperate lakes using machine learning models. J. Hydrol. 2020, 585, 124819. [Google Scholar] [CrossRef]
- Wang, Q.; Wang, S. Machine learning-based water level prediction in Lake Erie. Water 2020, 12, 2654. [Google Scholar] [CrossRef]
- Jain, A.; Varshney, A.K.; Joshi, U.C. Short-term water demand forecast modelling at IIT Kanpur using artificial neural networks. Water Resour. Manag. 2001, 15, 299–321. [Google Scholar] [CrossRef]
- Al-Zahrani, M.A.; Abo-Monasar, A. Urban residential water demand prediction based on artificial neural networks and time series models. Water Resour. Manag. 2015, 29, 3651–3662. [Google Scholar] [CrossRef]
- Zubaidi, S.L.; Al-Bugharbee, H.; Ortega-Martorell, S.; Gharghan, S.K.; Olier, I.; Hashim, K.S.; Al-Bdairi, N.; Kot, P. A novel methodology for prediction urban water demand by wavelet denoising and adaptive neuro-fuzzy inference system approach. Water 2020, 12, 1628. [Google Scholar] [CrossRef]
- Hashimoto, T.; Stedinger, J.R.; Loucks, D.P. Reliability, resiliency, and vulnerability criteria for water resource system performance evaluation. Water Resour. Res. 1982, 18, 14–20. [Google Scholar] [CrossRef] [Green Version]
- Pedro-Monzonís, M.; Solera, A.; Ferrer, J.; Estrela, T.; Paredes-Arquiola, J. A review of water scarcity and drought indexes in water resources planning and management. J. Hydrol. 2015, 527, 482–493. [Google Scholar] [CrossRef] [Green Version]
- Yoo, C.; Jun, C.; Zhu, J.; Na, W. Evaluation of Dam Water-Supply Capacity in Korea Using the Water-Shortage Index. Water 2021, 13, 956. [Google Scholar] [CrossRef]
- Kuo, J.-T.; Yen, B.-C.; Hsu, Y.-C.; Lin, H.-F. Risk analysis for dam overtopping—Feitsui reservoir as a case study. J. Hydraul. Eng. 2007, 133, 955–963. [Google Scholar] [CrossRef]
- Chow, M.; Shiah, F.; Lai, C.; Kuo, H.; Wang, K.; Lin, C.; Chen, T.; Kobayashi, Y.; Ko, C. Evaluation of surface water quality using multivariate statistical techniques: A case study of Fei-Tsui Reservoir basin, Taiwan. Environ. Earth Sci. 2016, 75, 1–15. [Google Scholar] [CrossRef]
- Sapitang, M.; Ridwan, W.M.; Faizal Kushiar, K.; Najah Ahmed, A.; El-Shafie, A. Machine Learning Application in Reservoir Water Level Forecasting for Sustainable Hydropower Generation Strategy. Sustainability 2020, 12, 6121. [Google Scholar] [CrossRef]
- Chang, F.-J.; Chang, Y.-T. Adaptive neuro-fuzzy inference system for prediction of water level in reservoir. Adv. Water Resour. 2006, 29, 1–10. [Google Scholar] [CrossRef]
- Ehteram, M.; Ferdowsi, A.; Faramarzpour, M.; Al-Janabi, A.M.S.; Al-Ansari, N.; Bokde, N.D.; Yaseen, Z.M. Hybridization of artificial intelligence models with nature inspired optimization algorithms for lake water level prediction and uncertainty analysis. Alex. Eng. J. 2021, 60, 2193–2208. [Google Scholar] [CrossRef]
- Zubaidi, S.L.; Al-Bugharbee, H.; Muhsin, Y.R.; Hashim, K.; Alkhaddar, R. Forecasting of monthly stochastic signal of urban water demand: Baghdad as a case study. IOP Conf. Ser. Mater. Sci. Eng. 2020, 888, 012018. [Google Scholar] [CrossRef]
- Zubaidi, S.L.; Abdulkareem, I.H.; Hashim, K.S.; Al-Bugharbee, H.; Ridha, H.M.; Gharghan, S.K.; Al-Qaim, F.F.; Muradov, M.; Kot, P.; Al-Khaddar, R. Hybridised artificial neural network model with slime mould algorithm: A novel methodology for prediction of urban stochastic water demand. Water 2020, 12, 2692. [Google Scholar] [CrossRef]
- Mu, L.; Zheng, F.; Tao, R.; Zhang, Q.; Kapelan, Z. Hourly and daily urban water demand predictions using a long short-term memory based model. J. Water Resour. Plan. Manag. 2020, 146, 05020017. [Google Scholar] [CrossRef]
- Palmer, W.C. Meteorological Drought; US Department of Commerce, Weather Bureau: Silver Spring, MD, USA, 1965; Volume 30.
- McKee, T.B.; Doesken, N.J.; Kleist, J. The relationship of drought frequency and duration to time scales. In Proceedings of the 8th Conference on Applied Climatology, Anaheim, CA, USA, 17–22 January 1993; Volume 17, pp. 179–183. [Google Scholar]
- Vicente-Serrano, S.M.; Beguería, S.; López-Moreno, J.I. A multiscalar drought index sensitive to global warming: The standardized precipitation evapotranspiration index. J. Clim. 2010, 23, 1696–1718. [Google Scholar] [CrossRef] [Green Version]
- Yu, M.; Li, Q.; Hayes, M.J.; Svoboda, M.D.; Heim, R.R. Are droughts becoming more frequent or severe in China based on the standardized precipitation evapotranspiration index: 1951–2010? Int. J. Climatol. 2014, 34, 545–558. [Google Scholar] [CrossRef] [Green Version]
- Breiman, L. Random forests. Mach. Learn. 2001, 45, 5–32. [Google Scholar] [CrossRef] [Green Version]
- Ho, T.K. Random decision forests. In Proceedings of the 3rd International Conference on Document Analysis and Recognition, Montreal, QC, Canada, 14–16 August 1995; Volume 1, pp. 278–282. [Google Scholar]
- Zhang, W.; Wu, C.; Zhong, H.; Li, Y.; Wang, L. Prediction of undrained shear strength using extreme gradient boosting and random forest based on Bayesian optimization. Geosci. Front. 2021, 12, 469–477. [Google Scholar] [CrossRef]
- Quinlan, J.R. Learning with Continuous Classes V: 5th Australian Joint Conference on Artificial Intelligence; Adams, A., Sterling, L., Eds.; Hobart: Tasmania, Australia, 1992; Volume 92, pp. 343–348. [Google Scholar] [CrossRef]
- Wang, S.; Huang, G.; He, L. Development of a clusterwise-linear-regression-based forecasting system for characterizing DNAPL dissolution behaviors in porous media. Sci. Total Environ. 2012, 433, 141–150. [Google Scholar] [CrossRef]
- Niu, W.-J.; Feng, Z.-K.; Feng, B.-F.; Min, Y.-W.; Cheng, C.-T.; Zhou, J.-Z. Comparison of multiple linear regression, artificial neural network, extreme learning machine, and support vector machine in deriving operation rule of hydropower reservoir. Water 2019, 11, 88. [Google Scholar] [CrossRef] [Green Version]
- Cortes, C.; Vapnik, V. Support-vector networks. Mach. Learn. 1995, 20, 273–297. [Google Scholar] [CrossRef]
- Mohammadi, B.; Guan, Y.; Aghelpour, P.; Emamgholizadeh, S.; Pillco Zolá, R.; Zhang, D. Simulation of Titicaca lake water level fluctuations using hybrid machine learning technique integrated with grey wolf optimizer algorithm. Water 2020, 12, 3015. [Google Scholar] [CrossRef]
- Mohammadi, B.; Mehdizadeh, S. Modeling daily reference evapotranspiration via a novel approach based on support vector regression coupled with whale optimization algorithm. Agric. Water Manag. 2020, 237, 106145. [Google Scholar] [CrossRef]
- Ibañez, S.C.; Dajac, C.V.G.; Liponhay, M.P.; Legara, E.F.T.; Esteban, J.M.H.; Monterola, C.P. Forecasting reservoir water levels using deep neural networks: A case study of Angat Dam in the Philippines. Water 2021, 14, 34. [Google Scholar] [CrossRef]
- Brock, W.; Lakonishok, J.; LeBaron, B. Simple technical trading rules and the stochastic properties of stock returns. J. Financ. 1992, 47, 1731–1764. [Google Scholar] [CrossRef]
- Fifield, S.; Power, D.; Knipe, D. The performance of moving average rules in emerging stock markets. Appl. Financ. Econ. 2008, 18, 1515–1532. [Google Scholar] [CrossRef]
- Güldal, V.; Tongal, H. Comparison of recurrent neural network, adaptive neuro-fuzzy inference system and stochastic models in Eğirdir Lake level forecasting. Water Resour. Manag. 2010, 24, 105–128. [Google Scholar] [CrossRef]
- Liang, C.; Li, H.; Lei, M.; Du, Q. Dongting lake water level forecast and its relationship with the three gorges dam based on a long short-term memory network. Water 2018, 10, 1389. [Google Scholar] [CrossRef]
Figure 1.
Location map of the Feitsui Reservoir.

Figure 2.
Proposed approach.

Figure 3.
First stage of the proposed approach.

Figure 4.
Second stage of the proposed approach.

Figure 5.
Autocorrelation of daily water levels in the Feitsui Reservoir.

Figure 6.
SVR reservoir level prediction results for 30, 90, and 180 days.

Figure 7.
The water level trend of the Feitsui Reservoir.

Figure 8.
Analysis result of WSI6,30.

Figure 9.
Analysis result of WSI12,30.

Figure 10.
Analysis result of WSI6,90.

Figure 11.
Analysis result of WSI12,90.

Figure 12.
Comparison of the Water Conservancy Drought Warning Stage with the WSI6,j proposed in this study.
Figure 12.
Comparison of the Water Conservancy Drought Warning Stage with the WSI6,j proposed in this study.

Figure 13.
Comparison of the Water Conservancy Drought Warning Stage with the WSI12,j proposed in this study.
Figure 13.
Comparison of the Water Conservancy Drought Warning Stage with the WSI12,j proposed in this study.


Table 1.
Variable description of the Feitsui Reservoir.
| Variables | Definition |
|---|---|
| x1(t − k), …, x1(t): Daily water level | Feitsui Reservoir daily historical water level |
| x2(t − k), …, x2(t): Daily rainfall | Historical mean daily rainfall in the catchment |
| x3(t − k), …, x3(t): Daily inflow – daily outflow | Reservoir daily historical inflow minus release flow |
| y1(t + 1): Predicted water level at next day | y1(t + 1) = f1(x1(t − k), …, x1(t), x2(t − m), …, x2(t), x3(t − n), …, x3(t)) |
| y2(t + 30): Predicted water level at next 30th day | y2(t + 30) = f2(x1(t − k), …, x1(t), x2(t − m), …, x2(t), x3(t − n), …, x3(t)) |
| y3(t + 90): Predicted water level at next 90th day | y3(t + 90) = f3(x1(t − k), …, x1(t), x2(t − m), …, x2(t), x3(t − n), …, x3(t)) |
| y4(t + 180): Predicted water level at next 180th day | y4(t + 180) = f4(x1(t − k), …, x1(t), x2(t − m), …, x2(t), x3(t − n), …, x3(t)) |
Table 2.
Data description of domestic water demand.
| Variables | Definition |
|---|---|
| z1(t − k), …, z1(t): Domestic water consumption | Daily historical total domestic water consumption (liters/person/day) |
| y5(t + 1): Estimated domestic water consumption | Total domestic water consumption per person at time t + 1 (in liters/person/day) |
| y6(t + 1): Estimated remaining days of water use | The remaining days of domestic water at time t + 1 |
Table 3.
Test results of the Feitsui Reservoir water level prediction.
| Method | R2 | RMSE | MAE | MAPE |
|---|---|---|---|---|
| SVR | 0.9980 | 0.2234 | 0.1255 | 0.0772 |
| M5P | 0.9968 | 0.3660 | 0.1173 | 0.1174 |
| RF | 0.9943 | 0.5825 | 0.2612 | 0.2615 |
| MLR | 0.8464 | 2.8235 | 1.3218 | 1.3229 |
Table 4.
SVR 30, 90, 180 days prediction and evaluation of reservoir water level.
| Model | R2 | RMSE | MAE | MAPE |
|---|---|---|---|---|
| SVR 30 day | 0.9364 | 1.3185 | 0.7363 | 0.4633 |
| SVR 90 day | 0.762 | 3.1978 | 2.7542 | 1.6921 |
| SVR 180 day | 0.3611 | 5.7291 | 4.9457 | 3.0306 |
Table 5.
Evaluation and comparison of SVR and deep learning prediction models.
| Algorithm | R2 | RMSE | MAE | MAPE | Time |
|---|---|---|---|---|---|
| SVR | 0.9980 | 0.2234 | 0.1255 | 0.0772 | 120 s |
| GRU | 0.9568 | 1.0912 | 0.8207 | 0.8174 | 362 s |
| LSTM | 0.9708 | 0.8101 | 0.772 | 0.728 | 650 s |
| MLP | 0.9861 | 0.5357 | 0.3226 | 0.4615 | 318 s |
Table 6.
Comparison with other water level studies.
| Authors | Duration | R2 | RMSE | MAE | MAPE |
|---|---|---|---|---|---|
| Chang and Chang [20] | 3 h | - | 0.597 | 0.436 | - |
| Güldal and Tongal [41] | 30 day | 0.97 | 0.126 | - | - |
| Liang et al. [42] | 1 day | 0.999 | 0.083 | - | - |
| Zhu et al. [9] | 30 day | 0.83 | 0.0515 | - | - |
| Ibañez et al. [38] | 1 day | 0.9990 | 0.1980 | 0.1980 | 0.0010 |
| 30 day | 0.9100 | 3.2730 | 2.8920 | 0.0150 | |
| 90 day | 0.7460 | 5.9620 | 5.1030 | 0.0270 | |
| 180 day | 0.5810 | 8.1280 | 6.6520 | 0.0360 | |
| Our Study | 1 day | 0.9980 | 0.1934 | 0.0772 | 0.0770 |
| 30 day | 0.9364 | 1.3185 | 0.7363 | 0.4633 | |
| 90 day | 0.762 | 3.1978 | 2.7542 | 1.6921 | |
| 180 day | 0.3611 | 5.7291 | 4.9457 | 3.0306 |
Publisher’s Note: MDPI stays neutral with regard to jurisdictional claims in published maps and institutional affiliations. |
© 2022 by the authors. Licensee MDPI, Basel, Switzerland. This article is an open access article distributed under the terms and conditions of the Creative Commons Attribution (CC BY) license (https://creativecommons.org/licenses/by/4.0/).
Share and Cite
MDPI and ACS Style
Shih, D.-H.; Liao, C.-H.; Wu, T.-W.; Chang, H.-S.; Shih, M.-H. WSI: A New Early Warning Water Survival Index for the Domestic Water Demand. Mathematics 2022, 10, 4478. https://0-doi-org.brum.beds.ac.uk/10.3390/math10234478
AMA Style
Shih D-H, Liao C-H, Wu T-W, Chang H-S, Shih M-H. WSI: A New Early Warning Water Survival Index for the Domestic Water Demand. Mathematics. 2022; 10(23):4478. https://0-doi-org.brum.beds.ac.uk/10.3390/math10234478
Chicago/Turabian StyleShih, Dong-Her, Ching-Hsien Liao, Ting-Wei Wu, Huan-Shuo Chang, and Ming-Hung Shih. 2022. "WSI: A New Early Warning Water Survival Index for the Domestic Water Demand" Mathematics 10, no. 23: 4478. https://0-doi-org.brum.beds.ac.uk/10.3390/math10234478
Note that from the first issue of 2016, this journal uses article numbers instead of page numbers. See further details here.