Article

Multi-Objective Optimal Design of a Hydrogen Supply Chain Powered with Agro-Industrial Wastes from the Sugarcane Industry: A Mexican Case Study

by
Luis Miguel Reyes-Barquet
1,
José Octavio Rico-Contreras
2,
Catherine Azzaro-Pantel
3,
Constantino Gerardo Moras-Sánchez
1,
Magno Angel González-Huerta
1,
Daniel Villanueva-Vásquez
4,* and
Alberto Alfonso Aguilar-Lasserre
1,*
1
Graduate Studies and Research Division, Tecnológico Nacional de México/Instituto Tecnológico de Orizaba, Calle Oriente 9 Colonia Emiliano Zapata, Orizaba 94320, Mexico
2
Grupo Porres Corporativo, Km 355 Carretera Federal Fortín de las Flores, Cordoba 94540, Mexico
3
Laboratoire de Génie Chimique, Université de Toulouse, U.M.R. 5503 CNRS/INP/UPS, 4 allée Emile Monso, CEDEX 4, 31432 Toulouse, France
4
Departamento de Investigación y Posgrado, Tecnológico Nacional de México/Instituto Tecnológico Superior de Misántla, Km 1.8 Carretera a Lomas de Cojolite, Misantla 93821, Mexico
*
Authors to whom correspondence should be addressed.
Submission received: 15 December 2021 / Revised: 19 January 2022 / Accepted: 27 January 2022 / Published: 29 January 2022

Abstract

:
This paper presents an optimization modeling approach to support strategic planning for designing hydrogen supply chain (HSC) networks. The energy source for hydrogen production is proposed to be electricity generated at Mexican sugar factories. This study considers the utilization of existing infrastructure in strategic areas of the country, which brings several advantages in terms of possible solutions. This study aims to evaluate the economic and environmental implications of using biomass wastes for energy generation, and its integration to the national energy grid, where the problem is addressed as a mixed-integer linear program (MILP), adopting maximization of annual profit, and minimization of greenhouse gas emissions as optimization criteria. Input data is provided by sugar companies and the national transport and energy information platform, and were represented by probability distributions to consider variability in key parameters. Independent solutions show similarities in terms of resource utilization, while also significant differences regarding economic and environmental indicators. Multi-objective optimization was performed by a genetic algorithm (GA). The optimal HSC network configuration is selected using a multi-criteria decision technique, i.e., TOPSIS. An uncertainty analysis is performed, and main economic indicators are estimated by investment assessment. Main results show the trade-off interactions between the HSC elements and optimization criteria. The average internal rate of return (IRR) is estimated to be 21.5% and average payback period is 5.02 years.

1. Introduction

In recent years, the popularity of hydrogen as a promising sustainable energy carrier has increased significantly to contribute to clean energy transition [1]. In particular, hydrogen has a noticeable role to play in the transport sector which requires large amounts of clean energy as an enabler of deep decarbonization of this difficult to abate sector. One of the advantages of using hydrogen is the availability of different production processes [2]. The biomass contained in some agro-industrial wastes can provide enough energy to be used for hydrogen production in a variety of processes [3]. Several paths can be followed in biomass resource exploitation, among which the selection of the most appropriate conversion technology is challenging. Agro-industrial wastes are commonly known as residues that offer little benefit to their producers, so their recovery can be an option to investigate. The use of agro-industrial waste for energy production can be an alternative end-of-life for these resources by creating sustainable and renewable systems that minimize pollutant emissions. The cogeneration of electricity and thermal power could provide energy autonomy for these companies and additional income from the sale of their energy overflows, while their waste gets a second use. Applying the necessary technologies for efficient use of the energy generated from renewable resources requires a comprehensive vision that includes the assessment of several factors for decision support at different levels [4]. The objective of this work is thus to include these options in the planning and design of a hydrogen supply chain network.
The electrical energy used for hydrogen production is generated with agro-industrial wastes in 50 sugar factories located in Mexico, where steam generators are powered by burning sugar cane bagasse. The electricity generated is used for self-consumption for the sugar companies and the excess is often sold to the national grid, but is commonly wasted because of low demand; thus, an HSC network where the excess energy can be exploited may turn out to be convenient. In the proposed model, the behavior of the electricity production systems is modeled using probability distributions, among other model parameters. The major contribution of this study is the integration of a multi-objective optimization model using a genetic algorithm (GA) with a hydrogen production system generated from agro-industrial waste for mobility purposes, integrating the proposed network with already existing infrastructure from the national energy industry. The model is evaluated with energy prices and geographic information from different regions across the country. (GA). The obtained solutions offer a variety of options for setting the HSC since a multi-criteria approach is adopted to optimize economic and environmental objectives simultaneously.
The presented mathematical model is inspired on three previously built formulations, whereby Parker [5] adopts the profit maximization approach for its flexibility in terms of resource utilization, and de León Almaráz [4] considers global warming criteria, and its mathematical formulation for transport and storage in an HSC is adopted by this study. Finally, Rico Contreras [6] presents the mathematical model for generation of electricity at sugar mills available for hydrogen production; integrating these approaches contributes to the formulation of the mixed integer linear program (MILP), and significant changes were made to adapt the mathematical formulation to the case examined in this study.
The optimal HSC network configuration is selected using a multi-criteria decision-making technique (MCDM). Due to the type of problem (input data), a multi-attribute decision-making (MADM) method is adopted. This type of technique calculates the distance between each alternative and a central point. VIKOR and TOPSIS methods were considered (differing by criteria normalization procedure). Both techniques use the CP method that seeks to obtain the closest alternative from the hypothetical optimal solution. The TOPSIS method was selected since it considers the distance to the ideal solution and the distance to the non-ideal solution, while VIKOR only considers the distance to the ideal solution.

2. Literature Review

The literature review identifies the tools, technologies, resources, and other important factors to consider when designing the hydrogen supply chain (HSC) for mobility purposes. The reviewed works were selected based on similar studies with MILP models and the main scientific objective regarding the design of HSC networks. A variety of case studies were analyzed to determine the most appropriate research path given the actual conditions of the field of study. The classification of the relevant studies is based on the objective functions, agro-industrial waste, raw materials, production technologies (alkaline/ Proton Exchange Membrane (PEM) electrolysis) and the region where the methodology is implemented.
A review of the different decision levels for HSC is presented in Azzaro C. et al. [7] on the different components related to hydrogen production, transportation, and distribution. More than 40 authors contribute to a compilation of multiple case studies, where the most recent methodologies used for modeling the HSC supply chain are presented for design, planning and operation strategies, providing diverse tools that allow the design of complex systems using mathematical models involving economic, environmental and risk criteria.
Jiyong K. et al. [8] proposed a methodology for HSC infrastructure design including production, storage, and transportation with a generic optimization-based model. The network design is formulated as a MILP to identify the optimal configuration of the supply chain from various alternatives. The goal was to consider not only cost efficiency, but safety criteria as well. Since these two aspects are contradictory, multi-objective optimization techniques were required to find practical solutions. With this approach, the effects of uncertainty in demand can also be analyzed, and deterministic and stochastic analysis methods were compared.
The pioneering work presented in A. Almansoori and N. Shah [9] emphasizes the challenges of HSC design focused on three main factors: the presence of various links in the supply chain (including local hydrogen distribution and refueling stations), the high level of interaction between the components of the supply chain and their subsystems, and the uncertainty in hydrogen demand. In this work, the growing uncertainty in the variation of hydrogen demand in the long term was integrated into an existing generic optimization model, using a scenario-based approach. For both cases, the most feasible solution involves a centralized production with small or medium-sized storage facilities and distribution through tanker trucks. The performance of the model was evaluated using sensitivity and risk analysis.
In their latest work, Güler MG et al., 2020 [10] presented a design for an HSC in Turkey for 2021–2050 using a MILP modeling approach. A mathematical optimization model was adopted to evaluate the objective functions in Turkey. The results show decentralized production as one feasible alternative to fulfill the demand, and the local production rate exhibited a significant increase from 12% to 48% by the end of the planning horizon, revealing future considerations that must be considered. The analysis revealed that almost all regions either produce or import hydrogen, but do not do both.
The work by P. Gabrielli et al., 2020 [11] concerns the optimal design of a low-carbon Swiss HSC. The infrastructure design is performed by solving an optimization problem that determines the hydrogen, biomass, and CO2 network configuration with a focus on production technologies. A national scale case study was analyzed to derive specific guidelines concerning the design of the HSC deploying carbon capture and storage. The impact of relevant design parameters was assessed, such as the location of CO2 storage facilities, the techno-economic characteristics of CO2 capture technologies and network losses. The study highlights the benefits of biomass and carbon capture and storage for decarbonizing HSC networks compared to the use of electrolysis for hydrogen production due to the high carbon intensity of the electricity mix.
C. Quarton and S. Samsatli, 2020 [12] present an optimization framework to determine how carbon dioxide and hydrogen technologies could fit into existing value chains in the energy and chemicals sector, analyzing how effectively these technologies can contribute to meet the climate change goals. The first study concerning the modeling and optimization of an integrated value chain for carbon dioxide and hydrogen is performed, providing assessment of the role of carbon capture, utilization and storage (CCUS), and hydrogen technologies. The results showed opportunities for CCUS to decarbonize existing power generation capacity and emphasize the need of renewable energy and hydrogen to achieve lower cost decarbonization and flexibility in the long term. The importance of negative emissions policies to encourage investors was also discussed.
An optimization-oriented review regarding HSC design is presented by Lei Li et al., 2019 [13]. Some drawbacks and missing aspects in the literature are identified, and key components of the HSC are presented. Models are classified based on several model features. It is highlighted that profit maximization has received less attention compared to other optimization criteria, and only two of the references reported profit as the HSC performance measure.
A social cost–benefit assessment is performed by Ochoa R. et al., 2020 as post-optimal analysis for HSC design and deployment [14]. The sequential application of an optimization strategy employing genetic algorithms and a multi-criteria decision-making tool at first determine the optimal solution for the HSC network design problem. The evaluation is then performed by a social cost–benefit analysis (SCBA) to estimate the impact of hydrogen mobility deployment on social welfare. A subsidy policy scenario was implemented where results showed that CO2 abatement dominates the externalities, while platinum was the second largest externality.
Husna I. et al., 2016 [15] present a comparative study between biomass burning and gasification techniques. It is highlighted that direct burning of biomass and co-firing with coal is most used since it is the most economic convenient decision for the biomass power plant, while little plant modifications are required. On the gasification of biomass field, some points are made highlighting the benefits of chemical recovery to produce higher process steam and electricity efficiencies, reducing capital cost compared to conventional technologies.
Loong Lam H. et al., 2013 [16] proposed a methodological framework for designing waste-to-energy supply chains that considers efficient resources management and reduction of greenhouse gas emissions. A two-stage optimization model was developed, with MILP being used in both stages. Different technologies were considered for the whole exploitation of the resources in alternative forms. It was concluded that the green strategy adopted contributes significantly to the amount of power generated in existing power plants. Further studies concerning the integration of the available infrastructure and alternative energy technologies are required to determine opportunities for a more efficient resource exploitation.
The study by Gumte K. et al., 2021 [17], presents a nationwide analysis of a supply chain network fed with bioenergy; the study looks forward to integrating a fraction of the obtained biofuels with traditional fuels during the 2018–2026 horizon. A MILP is built to handle multiple types of raw materials, products and transport alternatives, while performing the techno, economic and environmental analysis, looking forward to making optimal operational and design decisions. The main findings remark that 43% and above biomass feed is needed for the supply chain network to survive.
Goodarzian F. et al., 2021 [18] propose the design of a three-echelon green medicine supply chain network through a fuzzy bi-objective MILP model, considering multiple periods, products, and transportation modes. The study measures the environmental impacts derived from establishing pharmacies and hospitals, aiming to reduce greenhouse gas emissions and to control environmental pollutants. Meta-heuristic algorithms are used to solve the model, including two novel hybrid algorithms known as Hybrid Firefly Algorithm and Simulated Annealing (HFFA-SA) and Hybrid Firefly Algorithm and Social Engineering Optimization (HFFA-SEO).
A bi-objective optimization model approach is proposed by Abdolazimi O. et al., 2020 [19], where a comparison of exact and meta-heuristic methods is performed. The main objective of this study is to improve the inventory grouping based on ABC analysis. The objective functions seek to maximize the total net profit of the items in the central stock, and in different locations. The aim is to simultaneously optimize the number of inventory groups, the number of items to be assigned and the service level. Statistical analysis besides the AHP and VIKOR techniques is implemented to compare the applied optimization techniques in terms of efficiency. To solve the model in different dimensions, two exact methods (LP-metric and ε-constraint) and two meta-heuristic methods (NSGA-II and MOPSO) are applied.
A systematic literature review on multi-criteria decision making methods applied in different areas of supply chain management is conducted by Paul A. et al., 2021 [20]. A total of 106 published journal articles were analyzed. It is highlighted that MCDM methods are commonly used for analyzing several factors of sustainable supply chain management. In this review, it is highlighted that most of the published articles combine only two MCDM methods, and integration with other techniques, such as simultaneous optimization and simulation, are missing in the literature.
A literature review presented by Tordecilla R. et al., 2021 [21], refers to existing literature on the use of simulation techniques in the formation of resilient supply chain networks (SCNs). Research opportunities have been identified for the inclusion of three criteria (such as financial, environmental, and social) during the process of marking and the application of a multidisciplinary approach to integrating metaheuristic algorithms, simulation, and machine learning methods to integrate uncertainty and dynamic conditions.
A multi-objective novel model was developed by Hosseini S. et al., 2020 [22]. The model deals with the design/reorganization of the wheat supply network, which includes different suppliers, existing warehouses, warehouse candidate locations, flour mills, and warehouses in an uncertain environment. The purpose of the proposed model is to reduce costs, non-resiliency, and the negative effects of social responsibility. The results show that considering the cost, durability, and social impact simultaneously can greatly help improve the performance of the wheat supply chain model.
The paper presented by Gital Y. et al., 2020 [23] discusses the appropriate design and planning of a biomass supply chain network that incorporates flows from poultry farms to biogas facilities. A multi-stage novel solution methodology is designed to solve the problem of designing a biomass supply chain network. Spatial information systems, as well as hierarchy processing techniques, are used to determine the candidate location of biogas infrastructure. The aim is to determine the total amount, location, and size of biogas facilities, alongside network flow, and the electricity generated. The sensitivity analysis shows both maximum distance parameters, and purchase prices have a significant impact on decisions, as well as financial benefit.
The aim of the research conducted by Rasi R. et al., 2021 [24] is to optimize economic and environmental dimensions in a sustainable supply chain (SSC) using a MILP model to incorporate both criteria simultaneously. According to the authors, the value of the work relies on the limited alternatives regarding the design and optimization of SSC networks. The research is among the first to integrate the selection of sustainable suppliers and the optimization of performance indicators. The differences between the genetic algorithms and the MILP methods can be explained by managing the issues and their various logic alternatives.
A review regarding the development of biomass-based cogeneration energy systems in Malasia is presented by Zailan R. et al., 2021 [25]. The aim of the analysis is to report recent improvements in co-firing technology using biomass in Malaysia with the optimization modeling role. The authors address technical issues concerning the key players of the technologies and the biomass supply chain, remarking the importance of biomass utilization for energy generation in regions where agro-industrial wastes are abundant.
The study presented by Nunes L. et al., 2020 [26] reviews the status of research on biomass supply chain modelling and highlights the growing importance of biomass as a renewable alternative energy source. The review identifies modeling as a critical step in improving comprehension leading to improved supply chain performance. It is said that research using supply chain models focuses on examining specific supply chain conditions, often with the aim of reducing costs.
Seung S. et al., 2020 [27] presented a study involving the development of a hydrogen supply chain optimization model using a centralized storage approach that integrates and combines the flow of different production facilities into integrated bulk storage. The results show that a hydrogen supply chain with a central storage approach improves the phase transition of the hydrogen-producing plants, while reducing the total annual cost of the network.
A techno-economic analysis review of biomass supply chain was conducted by Yuen S. et al., 2021 [28]. The study emphasizes the growing needs of biomass caused by the increased risk of climate change. The study aims to provide an overview of the different types of methods or techniques used to assess the feasibility of biomass-based industries from a technical point of view. The study also looks forward to describing the uncertainty of the supply chain that should be included in the model test using the Malaysian case study to show the impact of this uncertainty. In total, 78% of reviewed articles chose the method of testing the mathematical model with optimization. A minority have undergone stochastic tests that include systemic uncertainty.
Rafique R. et al., 2021 [29] introduces and develops a model to design a bioenergy supply chain with the aim of minimizing the energy gap under budget and the challenges of biomass availability. The dynamic features of the model capture interactions between people, size, energy demand, biomass availability, energy consumption and the overall domestic product. The analysis highlights that the cost of further development of the bioenergy system can vary greatly during the planning horizon. Complete configuration starts as a very central system and shifts to a decentralized system divided into areas where power plants emit biofuel and provide energy locally.
Li L. et al., 2019 [30] conducted a study focusing on developing a mathematical model that encompasses the entire hydrogen supply network. The model is integrated with a hydrogen fueling station planning approach to produce a new configuration. The proposed model looks at the supply of feedstock, installation and operation facilities, the operation of transportation modes, and a system for carbon capture and storage. The proposed model can study the interactions that exist between different parts of a hydrogen supply network. Therefore, many HSC building plans are guaranteed.
From the reviewed literature, it can be concluded that further research in terms of evaluating the economic and environmental benefits of utilizing alternative energy sources and technologies in the existing energy industry infrastructure might provide the sufficient arguments to determine whether it is convenient or not to look forward to the exploitation of agricultural wastes for these means in specific regions. A summary of the literature review is presented in Table 1. We classified the relevant studies based on the adopted objective function, feedstock types (energy sources), considered hydrogen production technologies, and analyzed case studies. This study assesses the economic and environmental behavior of a power-to-hydrogen supply chain through a stochastic modelling approach, where the existing energy and biomass infrastructure is integrated on a national scale. Electricity produced by biomass combustion is already available as an energy source across the country due to the large quantities of sugarcane bagasse generated annually by agro-industrial activities and the ready-to-use infrastructure located at biomass producer facilities for energy generation and self-consumption, although a considerable part of this energy may be wasted due to the lack of synchronization of supply and demand. The results can help provide alternatives for countries that rely heavily on primary and secondary activities where biomass is widely available and where national energy autonomy is a concern.
The objective of this study is to evaluate the economic and environmental implications of using biomass wastes from sugar factories for energy generation, opening the scope to a non-conventional application according to the state of the art, which implies the utilization of already existing infrastructure, at the time that a resource commonly considered as waste is exploited. The innovation value of this contribution relies on the proposal of a wastes exploitation scheme that can be escalated in a variety of ranges, and can be applied to other energy sources, like biomass wastes originated from other agro-industrial sectors.

3. Materials and Methods

3.1. Methodological Framework

The methodological framework applied in this study is presented in three general frames; the first one concerns the input data used in the modelThe second aspect refers to the tools used to find the optimal solution for the proposed model, which implies the mathematical formulation, solving methods and solution selection technique. The last segment shows the outputs obtained from the applied methodology and its representation form, which implies a pareto front and graphic representations of the optimal supply chain configuration (Figure 1).

3.2. Modelling Assumptions

The actual model describes the optimal behavior of a hydrogen production system in the steady state, considering many aspects, such as the production, distribution, and storage operating and investment costs, the accessibility of the raw material, the selling price for hydrogen at distribution points, and the greenhouse gas emissions. The approach applied focuses on developing an optimization model that maximizes profit and minimizes greenhouse gas (GHG) emissions in a system where hydrogen is obtained using agro-industrial wastes from sugar factories in Mexico.
The model arrangement integrates several assumptions that serve as a starting point for the estimation of the economic and environmental indicators that support the decision-making process in the strategic planning of the HSC. These assumptions are as follows:
  • The operating time of the system is divided into harvest and non-harvest periods, in which the behavior during the generation of electrical energy differs from one another.
  • It is assumed that investments in land and construction have already been paid off. Therefore, these aspects are not considered in the required capital investment.
  • Given amounts of available electric energy and storage capacities are considered as model constraints.

3.3. Optimization Model Structure

The proposed model structure is integrated through several calculation modules, which are mainly divided into the following areas: production, transport, and storage. Figure 2 shows the general structure of the model. A description of each module is presented later.

3.3.1. Hydrogen Production Module

The production module estimates the amount of hydrogen that is convenient to produce based on the availability of electrical energy generated in each of the sugar cane mills by burning bagasse, which is an uncertain parameter for every mill whose behavior responds through probability distributions. The major objective of these calculations is to estimate the operating and investment costs that will result from the production infrastructure. In this section of the model, the selection of the best production technology and the estimate of the amount of hydrogen to be produced by each sugar factory is evaluated (Figure 3).
Hydrogen production is divided into two periods: the harvest season, when the greatest amount of H2 is produced due to the enormous amount of electricity generated from the intensive operation of the sugar factories during this time of year; and the non-harvest season, during which mill operations are reduced due to the lack of raw sugarcane to be processed, thereby lowering the rate of electricity generation and the amount of energy available for hydrogen production. The length of each period is considered as an uncertain parameter according to probability distribution given in days per year [6].
Production cost estimations start by calculating the tons of raw sugar cane that will be processed by each mill during harvest times. The amount of bagasse obtained from sugar cane processing and the amount of moisture it contains are also measured. These values are unique for every sugar cane mill and are represented by probability distributions obtained from historical production records. Humidity measurement is used to determine bagasse energy potential [17]. The amount of bagasse that is used in each mill to generate steam in the boiler rooms during each period depends on the energy consumption behavior of the mill. The steam production dedicated to power generation in each period is estimated using the theoretical efficiencies of the boiler and the bagasse energy potential, also considering the fraction of the dead time operation. Using the amount of steam used to generate electricity, the amount of MWh generated in each period is calculated. Some of this electricity is used by the sugar factories for their daily activities, whereas the overflows are usually fed into the national electricity grid and sold to other organizations. In the proposed model, the energy overflows are used for hydrogen production, whereas their availability is different for the harvest and non-harvest periods.
Once the amount of electrical energy available for hydrogen production in each mill during each period is determined, the optimization model evaluates the most convenient means of production to convert the energy to hydrogen; the proposed technologies are alkaline water electrolysis and proton membrane exchange electrolysis, considering efficiency, investment capital and annual operating costs for each type of production facility. In addition, the variable production costs are calculated, considering the electricity and water prices for each region in which the hydrogen is produced.

3.3.2. Hydrogen Transportation Module

The hydrogen transport module focuses on estimating the capital and operating costs arising from hydrogen distribution activities throughout the supply chain, from the production facilities to the delivery of the hydrogen to the storage and dispatch stations (SDSs)—these are the endpoints where the hydrogen would be stored before they are delivered to the refueling stations (refueling stations are not considered in the actual model). In the analysis, the SDSs are considered as the final stage of the proposed supply chain design (as presented in Figure 4). The amount of greenhouse gas emissions caused by transport activities is also estimated. To achieve this, the optimization model determines the hydrogen flow in tons per year, considering the hydrogen that is generated in both harvest and non-harvest seasons. The model then evaluates the convenience of transporting the hydrogen generated in each electrolysis plant to each storage location; the most favorable network configuration relies on the active objective function. When optimizing with multiple destinations, two main factors influence this decision: the shipping distance (an aspect that has a direct impact on transport costs and equivalent CO2 kg production), and the selling price of hydrogen at the storage locations, a value that relies on the SDSs’ location selected to receive the determined amount of H2, which has a direct impact on the income generated.
Once the annual hydrogen flow is estimated, the number of trips to be made by the transport trucks is calculated based on the vehicle’s loading capacity. The time available for each transport vehicle is considered in the calculation, and the number of vehicles required for all distribution operations during the year is determined, thereby obtaining the transport investment cost. The transport operating costs are estimated considering the fuel consumption, the maintenance cost factors (whereby both costs depend directly on the travelling distance from the electrolysis plant to the SDS), the driver’s wages, and the toll costs of the selected route. The distance and the toll costs of 50 sugar cane mills for each of the 73 SDSs are shown as two data fields that can be called up via the information system of the national communications and transport department. Finally, the amount of equivalent CO2 emitted by the network is calculated.

3.3.3. Hydrogen Storage Module

Liquid hydrogen is stored at the SDS, these being the storage points selected by the model in the multiple solutions found. This module calculates the investment capital and operating costs required for the storage units. The number of storage units is determined by the model according to the maximum hydrogen inventory received at a given station during the year of operation. Within these costs, the conditioning energy required for hydrogen compression is calculated and its price depends on the region where the SDSs that have been selected for storing the hydrogen are located. Additionally, the storage costs per unit are considered, including the operating and maintenance costs of the storage unit. The above factors determine the total cost of storage, a value that is added to the cost of production and transportation to determine the final cost of hydrogen on each SDS. Moreover, the revenue generated at each station depends on the gasoline sales price at such SDS, as this price is used as a reference for establishing a competitive sales price for hydrogen, as both serve as mobility fuel for medium-sized vehicles.

3.4. Optimization Model Formulation

3.4.1. Model Notation and Decision Variables

Multiple acronyms definitions, as well as model variables and parameters are presented in Table 2.

3.4.2. Production Constraints

Hydrogen production is limited by the amount of electrical energy available from sugar mills during the periods of harvesting and non-harvesting. The optimization model determines the most suitable amount of hydrogen to be produced annually. The annual amount of hydrogen that is generated in the type p electrolysis plant in the sugar mill i (PH2ip) must be less than or equal to the sum of the maximum amount of produced hydrogen in both z periods, as described in Equation (1).
P H 2 i p   z P H M a x i p z   ,     i = 1 ,   2 ,   3 50   ; z = 1 , 2
The electrolysis technology is selected by binary variable PEip, which takes on the zero value if no technology is selected at all, or takes the value 1 if it is selected to generate hydrogen in the sugar mill i. Since it is not possible to select both technologies for the same point of production, a constraint must be set to limit these events from being mutually exclusive. Equation (2) describes this limitation.
P E i p + P E i p 1   ,     p = 1 , 2   ;   i = 1 , 2 , 3 50 ; p p
The selection of one or the other electrolysis technology implies a difference in the conversion efficiency of electrical energy into hydrogen, both have different investment costs, annual operating, and maintenance costs.

3.4.3. Transportation Constraints

Produced hydrogen at each location should be distributed to the stations where it offers the highest economic and environmental benefits, considering the potential income, transportation costs, and CO2 generation to make this decision. To achieve this, Equation (3) limits the flow rate of hydrogen per year distributed from sugar mill i to station t (Fit) to meet the amount of hydrogen transported to one or more stations with the amount produced at the supplier electrolysis plants (PH2i).
t F i t = P H 2 i   ,     i = 1 , 2 , 3 50 ; t = 1 , 2 , 3 73

3.4.4. Storage Constraints

Each SDS has a limited storage capacity, so the sum of the hydrogen flows (Fit) resulting from the production points i and which are to be stored in each terminal t must be limited by the available storage volume (ADt) at this station. To achieve this, Equation (4) limits the amount of hydrogen a station can receive from one or more electrolysis plants.
i F i t A D t ,     i = 1 , 2 , 3 50 ; t = 1 , 2 , 3 73

3.4.5. Non-Negativity Constraints

All continuous, integer and binary variables must be non-negative.
P H 2 i p 0   ,     i = 1 , 2 , 3 50
P E i p 0 ,     i = 1 , 2 , 3 50
F i t 0 ,     i = 1 , 2 , 3 50 ; t = 1 , 2 , 3 73

3.5. Profit Maximization Objective Function

The total profit of the system is calculated as the difference between the revenue obtained in the storage station and the increase in production (CProdt), transport (CTransit), and storage costs (CAlmt) achieved in one year of operation. Equation (8) describes the calculation for this statement.
M A X :   T o t a l P r o f i t = t ( P r o f i t t = i n c o m e s t o u t c o m e s t ) ,     t = 1 , 2 , 3 ,   73
The income parameter results from the multiplication of the tons of hydrogen that are intended for storage in station t by the hydrogen sales price (PVH2t) determined for the respective station, as shown in Equation (9).
I n c o m e s t = i F i t P V H 2 t ,     i = 1 , 2 , 3 50 ;   t = 1 , 2 , 3 73
Hydrogen sales prices (PVH2t) are determined based on the sales price for gasoline at each station t considering the power offered by each type of vehicle. This is achieved by Equation (10), which estimates the cost per kilometer (US$/km) it would cost to the end-user. The sales price of gasoline is divided by the average theoretical power that a gasoline engine (GasPerft) offers for the car used as a reference in this analysis, resulting in a cost in US$/km. This value is then multiplied by the average power of a hydrogen fuel cell engine (FCEVPerf), measured in km/kg H2, which determines the hydrogen sales price in US$/kg at each SDS.
P V H 2 t = P V G a s t G a s P e r f F C E V P e r f ,     t = 1 , 2 , 3 73
when calculating the total annual costs (AExpt), the operating costs for the production, transport, and storage of hydrogen from generation in the electrolysis systems to storage at the SDSs are considered. This is represented by Equation (11).
A E x p t = C t P r o d + C i t T r a n s + C t A l m

3.5.1. Production Costs

The production cost (CProdt) is calculated using Equation (12), where the hydrogen flows (Fit) from point i to endpoint t is multiplied by the production cost per unit (CUPip) produced in sugar mill i.
C t P r o d = i ( F i t C U i p P )   ;     i ;   t
The estimate of the production costs in each electrolysis plant is determined by the sum of the variable production costs per unit (CVUPip), which relates to the consumption of water and electricity in the process, and the fixed unit production costs (CFUPip), including the cost of operating and maintaining the production facilities as expressed in Equation (13).
C U i p P = C V U I P P + C F U P i p ,     i
CVUPip (Equation (14)) results from costs of electricity and water volume required hydrogen production per ton. These costs vary depending on the prices of these resources (PEEr and PVAr) in each region r. The power consumption depends on the electrolysis technology selected at each point i, since each type of plant has a different transformation performance (Equation (14)).
C V U p r P = ( P E E r E p C o n s ) + ( P V A r W p C o n s ) ,     r ,   p    
The fixed production costs (CFPip) comprise the operating and maintenance costs (Opexp) in the production facilities, which are expressed as a percentage (%) of the investment capital and refer to an annual cost. Both the production investment capital (CIPip) and the operating and maintenance costs depend on the hydrolysis technology selected. The cost of capital estimate is based on the installed capacity (CapInstip) of energy processing converted into hydrogen at point i (where an additional gap of 20% is considered to compensate for possible fluctuations in the electricity supply) multiplied by the cost of the capital per installed MW (Capexp). The maximum electricity conversion capacity is estimated using the maximum amount of electricity per hour that will be achieved during the harvest season. This is shown in Equations (15)–(17).
C a p i p I n s t = P H 2 i p z O p D z 24   E P C o n s 1.2 ;   z = 1 ,     i , p
C I P i p = C a p e x p     C a p I n s t i p ,     i ,   p
C F P i p = C I P i p   O p e x p ,     i ,   p
The fixed unit production cost (CFUPip) is estimated by dividing the annual cost by the annual production (Equation (18)) during harvest and non-harvest periods.
C F U P i p = C F P i p P H 2 i p z + P H 2 i p z ,     i ,   p ,   z

3.5.2. Transportation Costs

The transportation costs (CTransit) consider the fuel consumption (CCombit), the labor costs (CMOit), and the maintenance costs (CMantit) of the transport units, as well as the toll costs (TollCit), the values of which are specific for the transport of the hydrogen produced in each plant location i and delivered to the stations t during the entire operating days. Equation (19) is used to illustrate these calculations.
C i t T r a n s = i ( C i t c o m b + C M O i t + C i t M a n t + T o l l C i t ) ;     i ,   t
First, the estimate of the number of trips required to distribute the hydrogen flow allocated from facilities i to stations t is obtained, dividing the annual hydrogen flow by the capacity of the transport units (CapTrans), as shown in Equation (20).
T r i p s i t = F i t C a p T r a n s   ;     i ,   t
The fuel cost (CCombit) used by the transport units to distribute the hydrogen is obtained by multiplying the estimated number of trips by twice the distance from point i to point t (dit). This value is then multiplied by the fuel price (PCombt) and divided by the fuel consumption (EC) in km/L. This concept is illustrated in Equation (21).
C i t c o m b = P C o m b t E C ( 2 d i t )   T r i p s i t ;     i ,   t
The labor cost is calculated using the number of transport units required for hydrogen distribution for all the days of operation. The number of transport units is estimated using Equation (22), where Vm relates to the average speed of the unit, TCD to the loading and unloading time, and DMT to the available time that the transport units consider disposed of. Both values are expressed in hours/year.
N U T i t = T r i p s i t ( 2 d i t V m + T C D )   1 D M T   ;   i ,   t
The NUTit parameter is multiplied by the driver’s monthly salary (SC) and multiplied by 12 (months per year) to calculate the annual labor cost (CMOit), as shown in Equation (23).
C M O i t = N U T i t S C 12 ;     i , t
The maintenance cost of the transport unit is calculated by multiplying the maintenance cost (GM) by the total distance in all working days. This is expressed in Equation (24).
C M a n t i t = G M ( 2 d i t ) T r i p s i t ;     i ,   t
Finally, the annual toll costs (ATollCit) that must be covered to use the routes selected by the model for hydrogen distribution are calculated. This is achieved by considering the number of trips multiplied by the toll price (TollPit), which is specific to each route, as shown in Equation (25).
A T o l l i t C = T r i p s i t T o l l P i t ;     i ,   t

3.5.3. Storage Costs

The total storage costs comprise the storage costs per unit (CUAlm), considering the O&M costs of the storage units and hydrogen conditioning cost per unit (CCondt), a value that is a function of the electrical power required to liquefy the hydrogen (EnAc) to the desired conditions prevailing in the region in which the SDS is located. With this assumption, the conditioning cost per unit is calculated using Equation (26), while the total storage cost is calculated using Equation (27).
C t C o n d = E n A c   P E E r ;     r ,   t
C t A l m = i F i t ( C U A l m + C t C o n d ) ;     i ,   t

3.6. GWP Objective Function

The GWP parameter considered in this model includes the greenhouse gas emissions from hydrogen storage (SGWP), and transport (TGWP), which are generated during an entire year of system operation. Equation (28) is used to calculate the total amount of equivalent CO2 kilograms for the entire operation.
M i n   G W P T o t a l = P G W P + S G W P + T G W P

3.6.1. Production GWP

The greenhouse gas emissions from hydrogen production are determined by multiplying the total hydrogen produced in the year of operation by the amount of CO2 produced per kilogram of hydrogen (PCGP), as shown in Equation (29).
P G W P = i P H 2 i P C G P ;     i

3.6.2. Transportation GWP

Hydrogen transport is a major contributor to emissions from the CO2 and heavily depends on the distances between the production points and the storage stations selected by the model to store hydrogen. Equation (30) is used to estimate the calculation of the kilograms of equivalent CO2 produced by transportation. These calculations start with the distances traveled in the year of operation of the system, with the number of trips made multiplied by twice the distance from the production site to the SDS. The resulting value is multiplied by the eq- CO2 kg (PCGTrans), and the weight of the transport unit (WeightUT) is also considered when estimating this parameter.
T G W P = i t ( 2 d i t T r i p s i t ) P C G T r a n s W e i g h t U T   ;     i ,   t

3.6.3. Storage GWP

The storage of hydrogen also generates a significant amount of equivalent CO2, mainly related to energy conditioning and the operation of storage units. The estimate of the carbon dioxide emissions generated by the storage of hydrogen is determined using Equation (31), which uses the variable PCGAlm, which refers to the equivalent CO2 kg/ton of hydrogen, and which is multiplied by the total hydrogen tons accumulated in each terminal for the entire year of operation.
S G W P = i t F i t P C G A l m   ;     i ,   t

3.7. Solution Methods

For solving MILP problems, the use of genetic algorithms appears to be one of the most effective methods to find a wide range of feasible solutions when solving similar mathematical problems according to the literature. For selecting the multi-objective optimization method, several alternatives were considered. The selected approach was a meta-heuristic technique, using MULTIGEN software which is a GA used by the research team in previous studies. In addition, multi-objective simulated annealing and multi-objective tabu search techniques were evaluated. At first, a mono-objective optimization method was applied to identify the behavior of the model concerning the optimal solutions for each objective function (to identify antagonism), then multi-criteria optimization was performed. MULTIGEN turned out to be convenient in terms of efficiency and convergence time. MULTIGEN has been applied by the research team in previous studies concerning multi-objective optimization of the HSC [14,31]. The optimization approach was performed in two stages. The first one focuses on the single optimization of each objective function. The second one is aimed to obtain a range of feasible solutions when both optimization criteria are considered simultaneously. For selecting the mid-point solution from the obtained pareto front, the multi-criteria decision-making technique TOPSIS was applied. The assignment of weights for each criterion was performed along the organization interested in the study, assigning equivalent weights for both criteria, since the company decided that both aspects were equally relevant in the decision making.
The GA applied for solving the mathematical model was built using the user interface, generated by the optimization software. The GA parameters were defined based on an iterative procedure, where different combinations were evaluated, selecting those with the smallest solving times. The TOPSIS method was applied using a spreadsheet that allows evaluation of the 1000 possible solutions.

3.8. Mathematical Model Optimization Framework

The mathematical model optimization was carried out with two GA’s, the first regarding the independent optimization of each target using the Evolver optimization software in version 7.6 developed by PALISADE, obtaining the best value for each objective function. The second GA is a multi-objective optimization tool that implements a variant of NSGA II developed in the Chemical Engineering Laboratory at the Institut National Polytechnique de Toulouse (INPT). The MULTIGEN algorithm was set to optimize the optimization criteria at the same time. The optimization algorithms were calculated using an 8-core AMD Ryzen 7 2700X processor at 3.7 GHz.

3.8.1. Mono-Objective Optimization

The individual criteria optimization is carried out using the GA interface, which is integrated into the Evolver optimization software. With this software, the user can easily define an optimization model, prioritizing that the logic of the decision variables and the constraints correspond to the mathematical formulation.
The performance of a GA for finding optimal solutions can be influenced by its parameter configuration. Therefore, a sensitivity analysis was performed to define these elements and look for those that would give the best results in finding the optimal solution. These parameters are listed in Table 3 along with the stopping conditions considered for the mono-objective optimization, which were defined to obtain workable solutions until a significant improvement is found over a certain number of iterations.

3.8.2. Multi-Objective Optimization

The multi-criteria optimization phase is carried out by MULTIGEN optimization software. The model formulation is introduced by generating the optimization interface in which the GA parameters, such as population size or the number of generations, can be defined. The selected configuration of the GA is shown in Table 4. These values are determined by a sensitivity analysis, from which the best configuration for the selected algorithm could be determined.
Different parameters were used in both algorithms since each of them responds differently to the parameter values. Several values were tried before finding the optimal configuration for each GA. When optimizing multiple objectives simultaneously, a Pareto front is generated with a set of different feasible solutions; then, the alternative that better meets both optimization criteria is selected using a decision-making technique (TOPSIS).

4. Case Study

4.1. Mexican Sugarcane Industry

Sugar cane is mainly used in Mexico to make refined sugar by extracting syrups from its stems. In the 2018/2019 harvest season, the National Committee for the Sustainable Development of Sugar Cane (CONADESUCA) reported a harvested area of 805.5 thousand hectares, around 57,036,700 tons of gross base cane and 6.4 million tons of sugar. The average yield per hectare at the national level is estimated at 70.81 tons in the industrialized acreage dedicated to grinding in the sugar mills [32,33].
The main activities of the sugar mills are divided into two periods: harvest or grinding period. This is when the harvested cane is processed for sugar production and the maintenance period, which coincides with the rainy season when farmers devote themselves to growing sugar cane. In the second phase, production in the mill is stopped to take over the dismantling, repair, and improvement of the factory to prepare for the next grinding period. The 2018/2019 harvest took place over 179 days with 50 sugar mills operating, mainly located in the west, the Gulf, and the south of the country.

Sugarcane Bagasse Generation and Characteristics

In this study, information of 50 sugar mills is taken from the sixth statistical report of the agro-industrial sugar cane sector in Mexico [34] by CONADESUCA, which provides data from the harvest period 2006/2007 to 2018/2019. The amount of bagasse available is modeled as a percentage of the tons of raw cane milled annually. Acting as model inputs, the amount of ground raw cane, the remaining bagasse fraction, and the moisture contained in the bagasse are considered as uncertain parameters and modeled using probability distribution. The mathematic formulation for calculating the fraction of bagasse that is available in the HSC for power generation is extracted from the work previously carried out by Rico Contreras, among the calculations for converting the bagasse into electricity [6]. This information is presented in Appendix A and Appendix B.

4.2. Hydrogen in Mexico

4.2.1. Hydrogen Demand

The estimated hydrogen demand for mobility purposes has been determined based on the available capacity of each of the 76 SDSs, which are spread across Mexican territory and are currently used for fossil fuel storage and subsequent distribution at petrol stations for sale to the public [35].

4.2.2. Hydrogen Production

The proposed model considers two primary means of hydrogen production: alkaline electrolysis and the proton exchange membrane [36]. They are mainly considered due to their technological maturity and their availability in the international market. Each technology has different properties that can have a significant impact on the cost of hydrogen production [37]. These are shown in Table 5. Electricity and water prices were modeled using probability distributions, as listed in Appendix C.
The variable cost of hydrogen produced by electrolysis is heavily influenced by the electricity and water prices of the region in which it is produced. Information on these prices has been compiled for each region considered in the study.

4.2.3. Hydrogen Storage

Capital costs of the storage units, the storage unit costs, and the parameters to produce greenhouse gases are presented in Table 6. Information concerning the storage capacity and availability for each SDS is presented in Appendix D.

4.2.4. Hydrogen Transportation

This study uses real geographic information from the communications and transportation department to determine the shipping distances and toll costs of the selected routes and to find the optimal route configuration. The proposed transportation mode to be used in the hydrogen shipment are tanker trucks, as this is the transportation mode of fossil fuels currently used in Mexico [35]. The toll costs of the selected routes for the hydrogen distribution considers the type of truck used, which are 6-axis vehicles. The distances between each mill and the SDSs considered are collected as well [38]. To calculate the transport costs, these values must be multiplied by two to get the round-trip flight costs. The hydrogen transport parameters are listed in Table 7. Data sets used for distance and transportation costs calculations are listed in Appendix E.

4.2.5. Hydrogen Selling Price

The information for estimating the hydrogen sales price is given in Table 8. The annual distance traveled by a medium-sized private vehicle is also established to be used in the calculation of the hydrogen selling price.

5. Results and Discussion

5.1. Mono-Objective Optimization Results

Both objective functions were initially optimized independently of one another. With these results, it is possible to create a comparison table showing the resulting values from both selected criteria optimizations, as shown in Table 9.
Based on the resulting values, it is determined that it is possible to produce hydrogen at the 50 locations of the sugar mill, which allows the system to produce 55,965 tons of hydrogen per year.
From the profit maximization O.F. obtained solution, 73 transportation units and 275 storage units are required to ensure the logistics demand of hydrogen. In contrast, in the GWP O.F. solution, only 55 transport units and 286 storage units are needed. Additionally, the capital expenditures for each element of the supply chain were estimated, resulting in US$1,903,270,621 for the first O.F., and US$1,962,907,160 for the second one. The obtained solutions put the annual operating cost of the entire system at US$221,729,804 and US$219,815,777 for each O.F., respectively. The production cost obtained in the first O.F. optimization contributes 85% to the final cost of hydrogen (Figure 5), while transportation and storage give 3% and 12%, respectively.
In Figure 6, a pie chart shows the composition of the total cost of hydrogen obtained from the GWP O.F. optimization. It can be observed that the transportation costs reduced their participation on the total cost of hydrogen in the optimization of the second O.F. from 3% to 1%. This is expected since the GWP optimization looks mainly to deliver the hydrogen to the closet SDS to reduce the gases emitted by the network. The production and storage cost participation increased due to the previous statement.
Another clear difference is the average selling price of hydrogen which goes from US$8938/ton in the profit optimization to US$8782/ton in the GWP optimization, which was expected since the selling price of hydrogen is a critical factor for a SDS to be selected in the profit O.F. The annual profit of the system is estimated at US$278,491,009, which equates to a net profit margin of 55.67% for the first objective function and US$271,675,857 with a profit margin of 44.72% for the second O.F. Occupancy in the SDS’s refers to the percentage of storage volume at the selected station in which hydrogen is stored, whereby a ratio of 4.49% is achieved.
A detailed economic report is shown in Table 10. In the first column are the names of the sugar factories where the electrolysis plants were located. The second column shows the names of the storage and dispatch stations where the hydrogen is stored, which are the locations for the storage units. In the rest of the columns, the information of the hydrogen flow from the PE to the storage location, the costs of production, transportation, and storage per unit are shown separately at first, then the total cost of hydrogen and the selling price per unit at each SDS. A profit estimation calculated from the difference of selling revenues and total cost is displayed.
It is possible to see significant differences in the contribution of the various elements of the supply chain to costs. For example, hydrogen from the El Molino and Puga generation points makes a higher contribution to the transport costs than the rest, as the reported production costs in these facilities are exceptionally low (US$1984.82/ton of H2) compared with other facilities. It is possible to distribute hydrogen over greater distances to stations with higher sales prices.
The hydrogen distribution for this solution is a decision that is heavily influenced by the selling price at the SDS for which it is intended. However, a SDS an extremely large distance from the electrolysis plant that supplies it would cause higher transport costs. Therefore, the model carries out an assessment and determines to which of the storage stations the hydrogen produced should be distributed.
The GWP for supply chain operations was then calculated. The electrical energy from the emissions balance of bagasse production is regarded as neutral due to its agricultural origin, so that the estimate of greenhouse gas emissions is limited to the transport and storage factors, the second one contributes majorly with a share of 67% of greenhouse gas emissions. On this basis, it is estimated that this configuration of the HCS generates 59,182,721 kg of equivalent CO2, or 1057 kg of CO2/ton of distributed and stored hydrogen.
The HSC configuration obtained from the profit objective function optimization is presented in Figure 7.
Concerning the optimization of the GWP objective function, considerable differences can be observed compared to the profit optimization function. First, the number of transport units has been significantly reduced to 55, so the investment capital is also reduced. However, this configuration requires 286 storage units, a higher number than previous results, and while this is the factor that has the greatest impact on the capital cost. Thanks to this, the investment required to deploy the supply chain increases to US$1,962,907,160.
The production makes the largest contribution to operating costs but remained constant for both OFs. Besides, the operating costs for the transport are reduced by 60%, which is a consequence of the fact that the algorithm in this OF mainly focuses on the selection of the shortest distances from the hydrogen production points to the SDS and requires fewer transport units to carry out the distribution. As a result, the unit cost of hydrogen will be significantly reduced to an average of US$3928 per ton.
With respect to profit, the average selling price is US$8782/ton of hydrogen. Because of this, there are fewer economic benefits compared to the solution shown above, which in this case is US$271,675,857, resulting in a profit margin of 44.72%.
Table 11 shows the key results of the economic indicators for each station selected by the model for hydrogen storage and shows the unit cost of supply chain operations and the selling price at each SDS. In this case, the average final cost of hydrogen is reduced compared to the previous solution, assuming a value of US$3908/ton and an average sales price of US$8804/ton.
Finally, a significant decrease in the equivalent CO2 tons emitted by the system can be observed, which corresponds to a reduced travel distance for the hydrogen distribution. As a result, the amount of CO2 emitted per ton of hydrogen is significantly reduced, assuming values of 829 kg equivalent CO2/ton of H2, which corresponds to 78.42% of the value obtained in the previous solution. For this configuration, it was found that the contribution from transport to CO2 emissions decreased from 33% to 15%.
The HSC configuration obtained from the optimization of the GWP objective function is shown in Figure 8. The model in this case is mainly committed to storing the hydrogen in the nearest SDSs from the production facilities, the major reason for the significant decrease in CO2 emissions generated by the system.

5.2. Multi-Objective Optimization Results

The simultaneous optimization of both objective functions carried out with the MULTIGEN optimization software, through which it is possible to obtain a Pareto front with a set of 1000 possible solutions, the one that fulfills both criteria most satisfactorily. Figure 9 shows a Pareto front diagram and the solution chosen by the TOPSIS.
In most cases, the hydrogen storage terminals where higher profits would be made are not close to the points where hydrogen production takes place. However, at some point, the increase in profit is no longer proportional to the increase in emissions, which indicates that there are solutions whose emissions are considerably high (<5.70 × 10⁷) and whose contribution to profit is not as significant compared to other solutions found for the model.
The solution selected using the TOPSIS method that best meets both optimization criteria is highlighted in the diagram. With this configuration, a profit of US$275,197,557/year is achieved, and 51,443,692 kg of equivalent CO2 is emitted annually. Next, the HSC design based on this configuration is presented, in which important performance indicators were estimated.

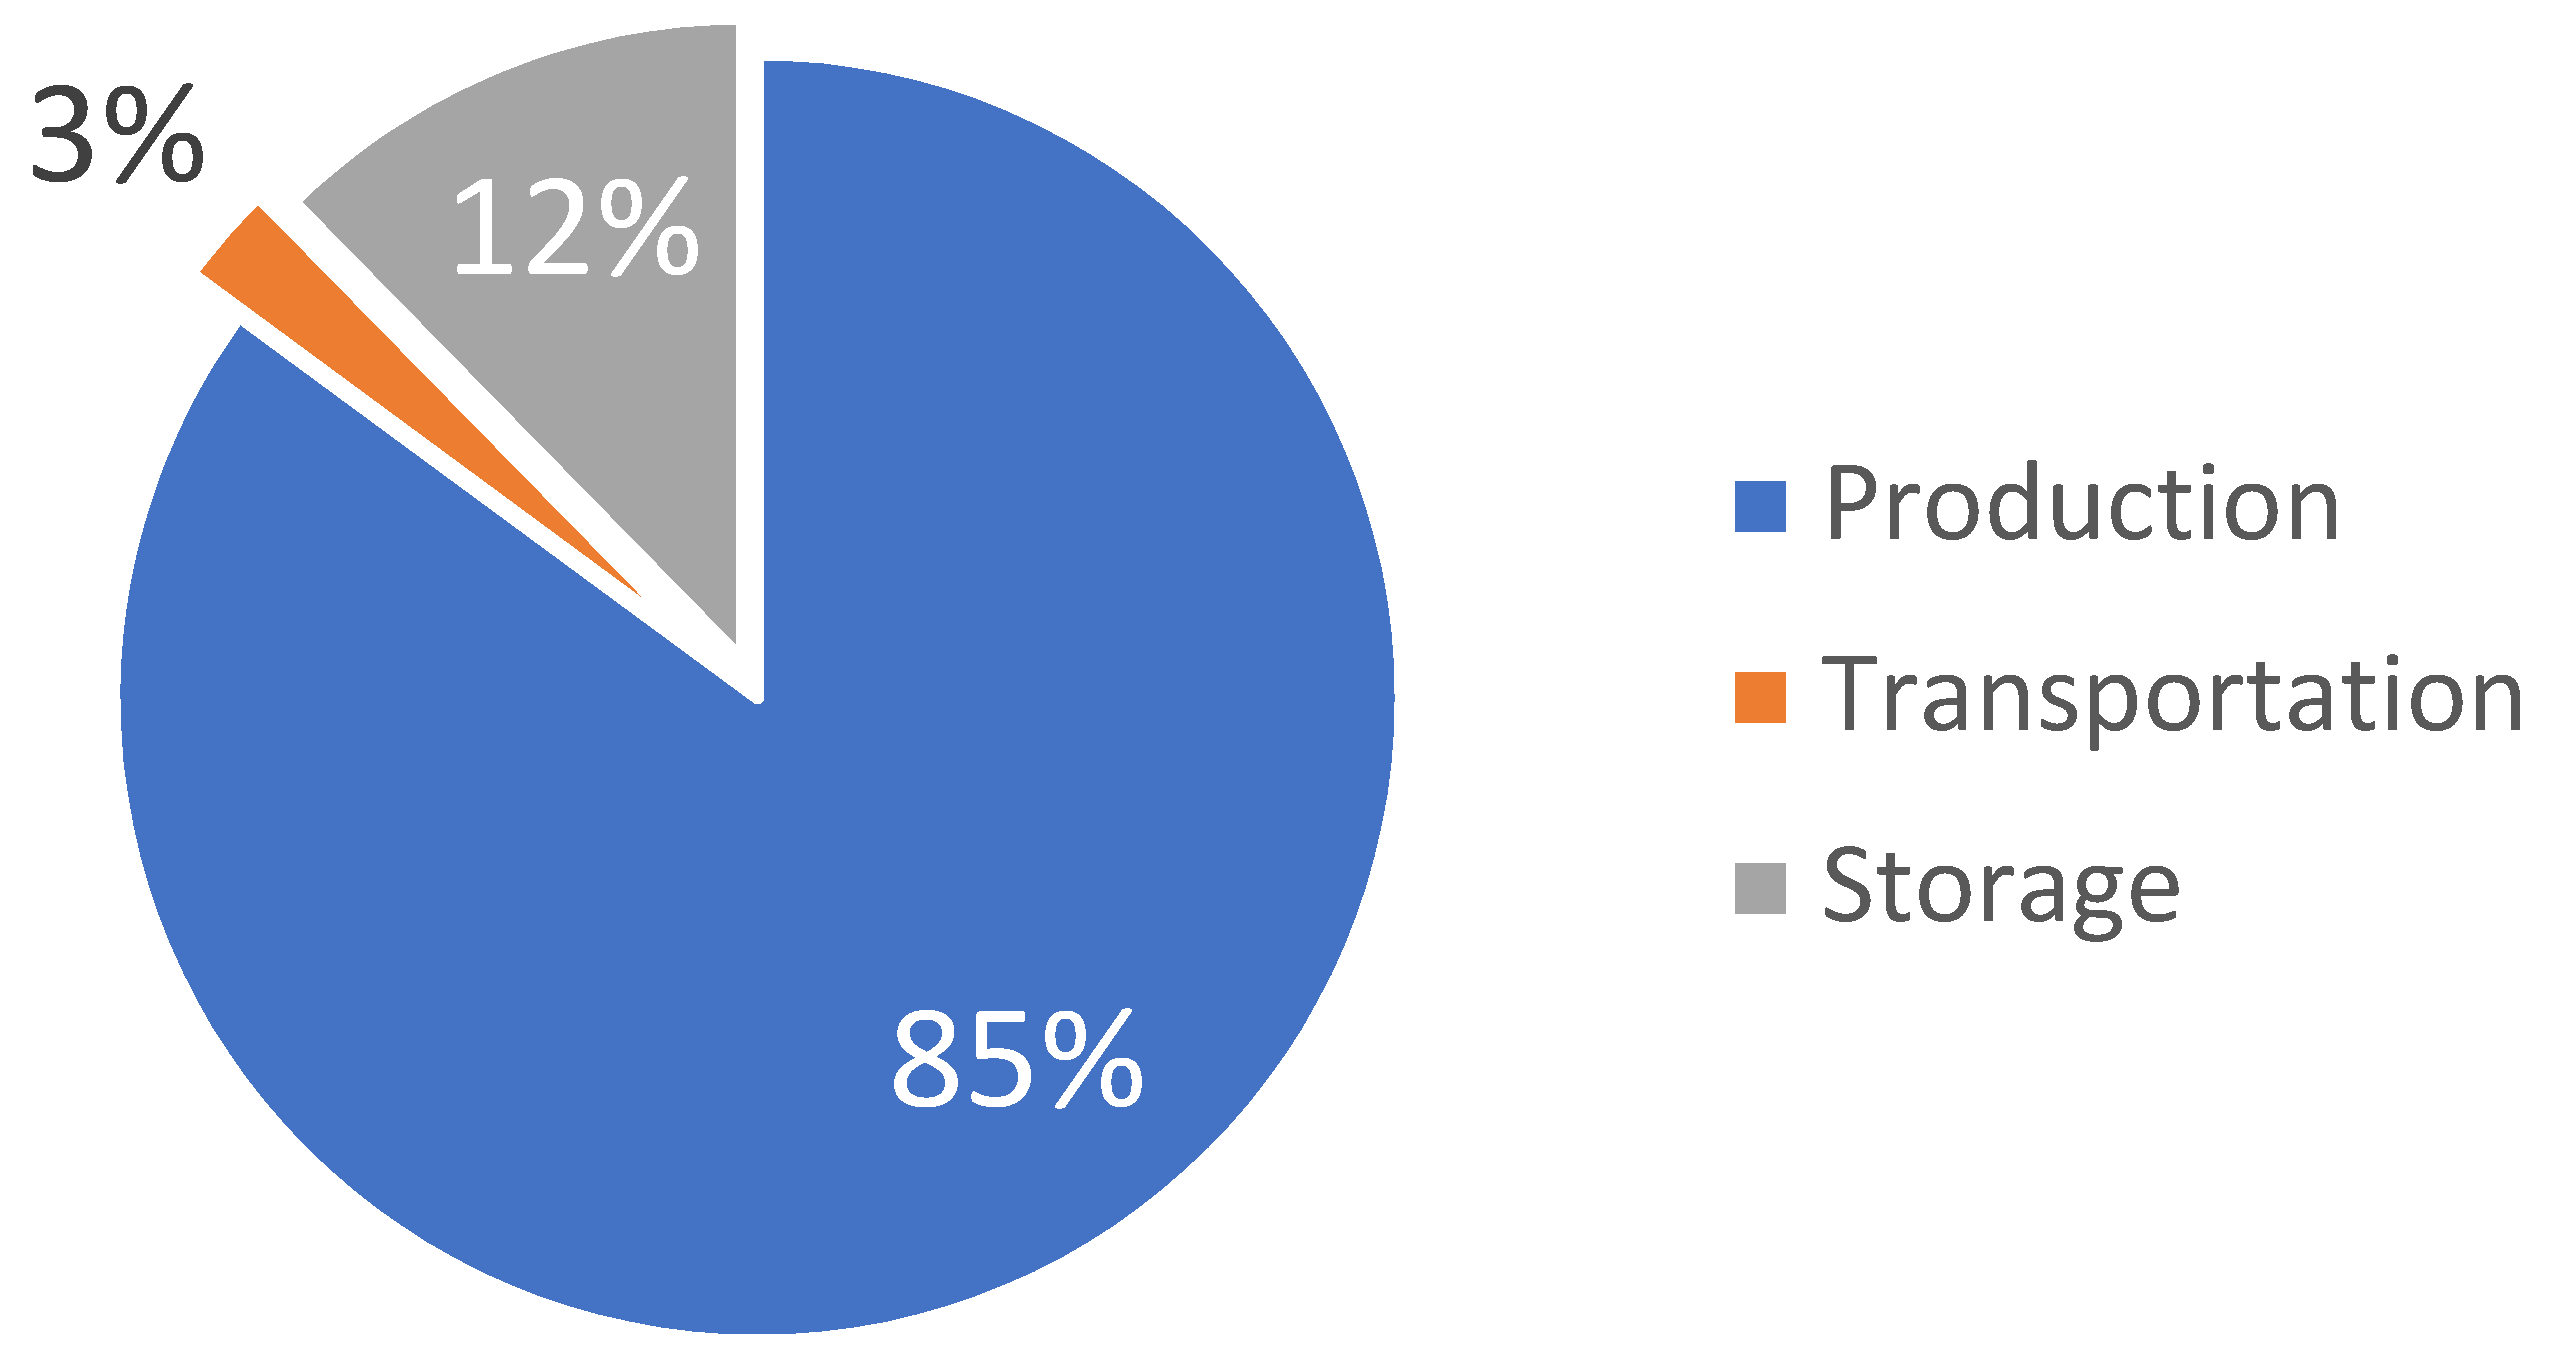
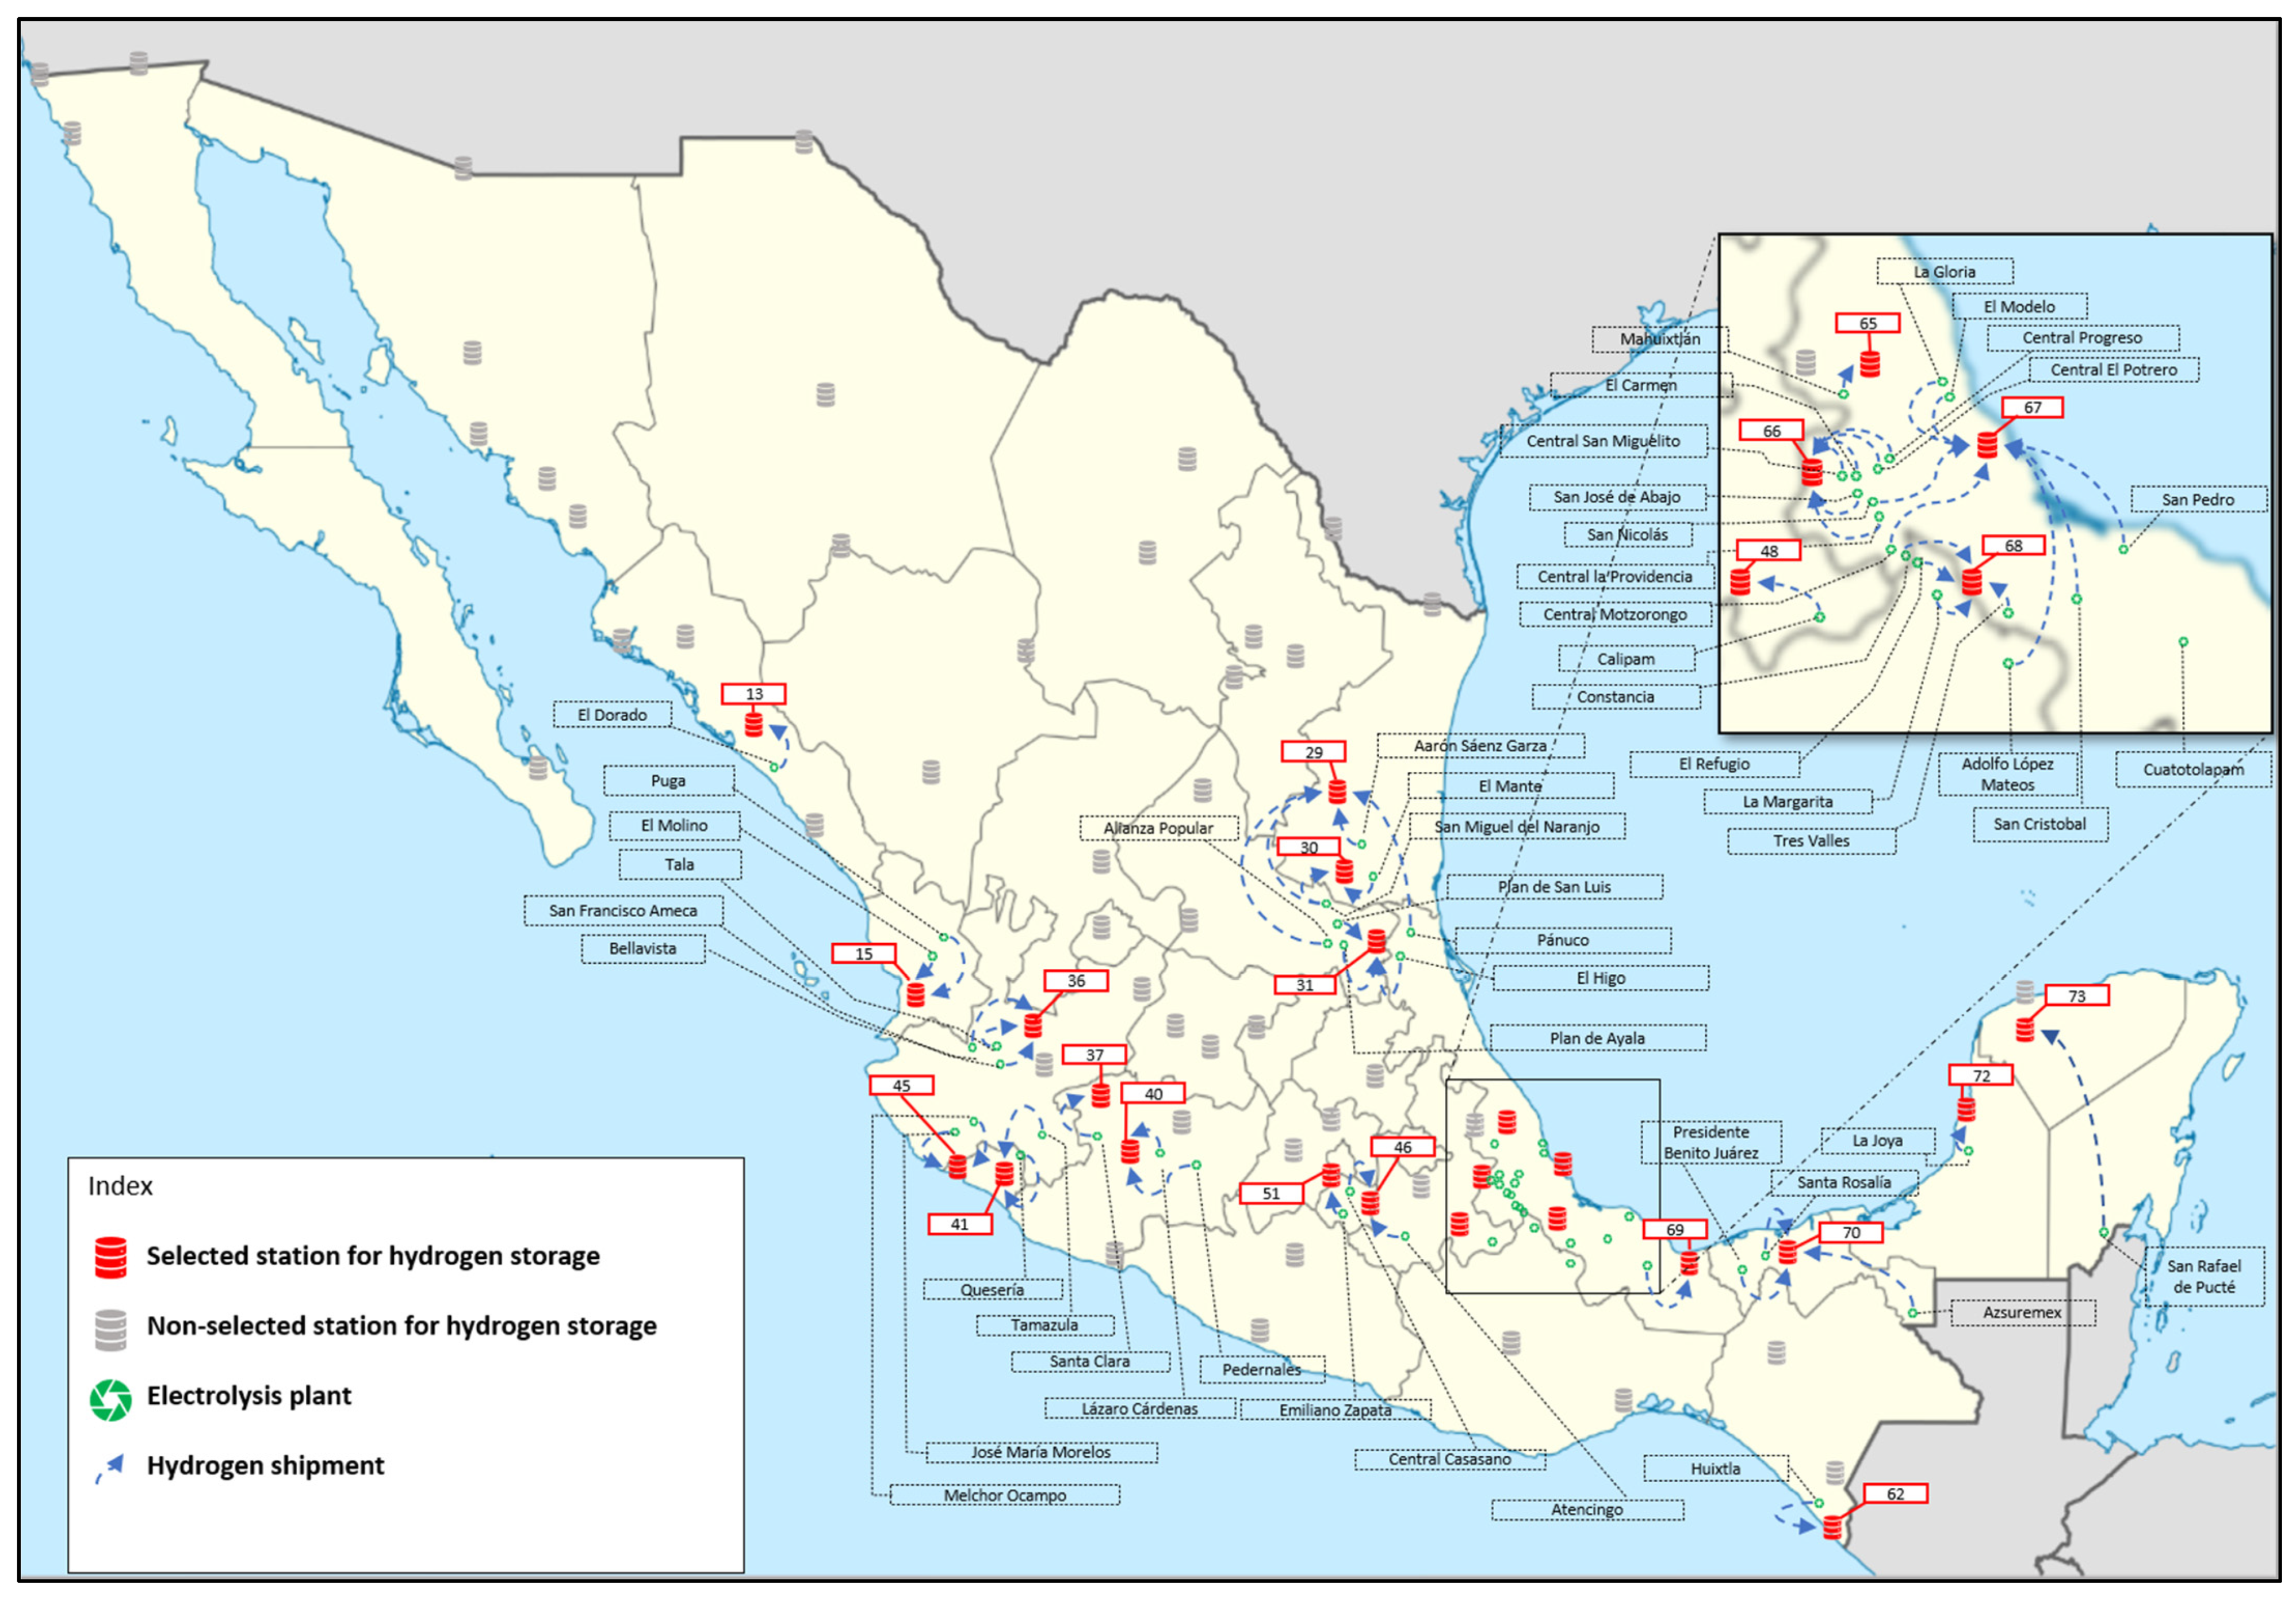
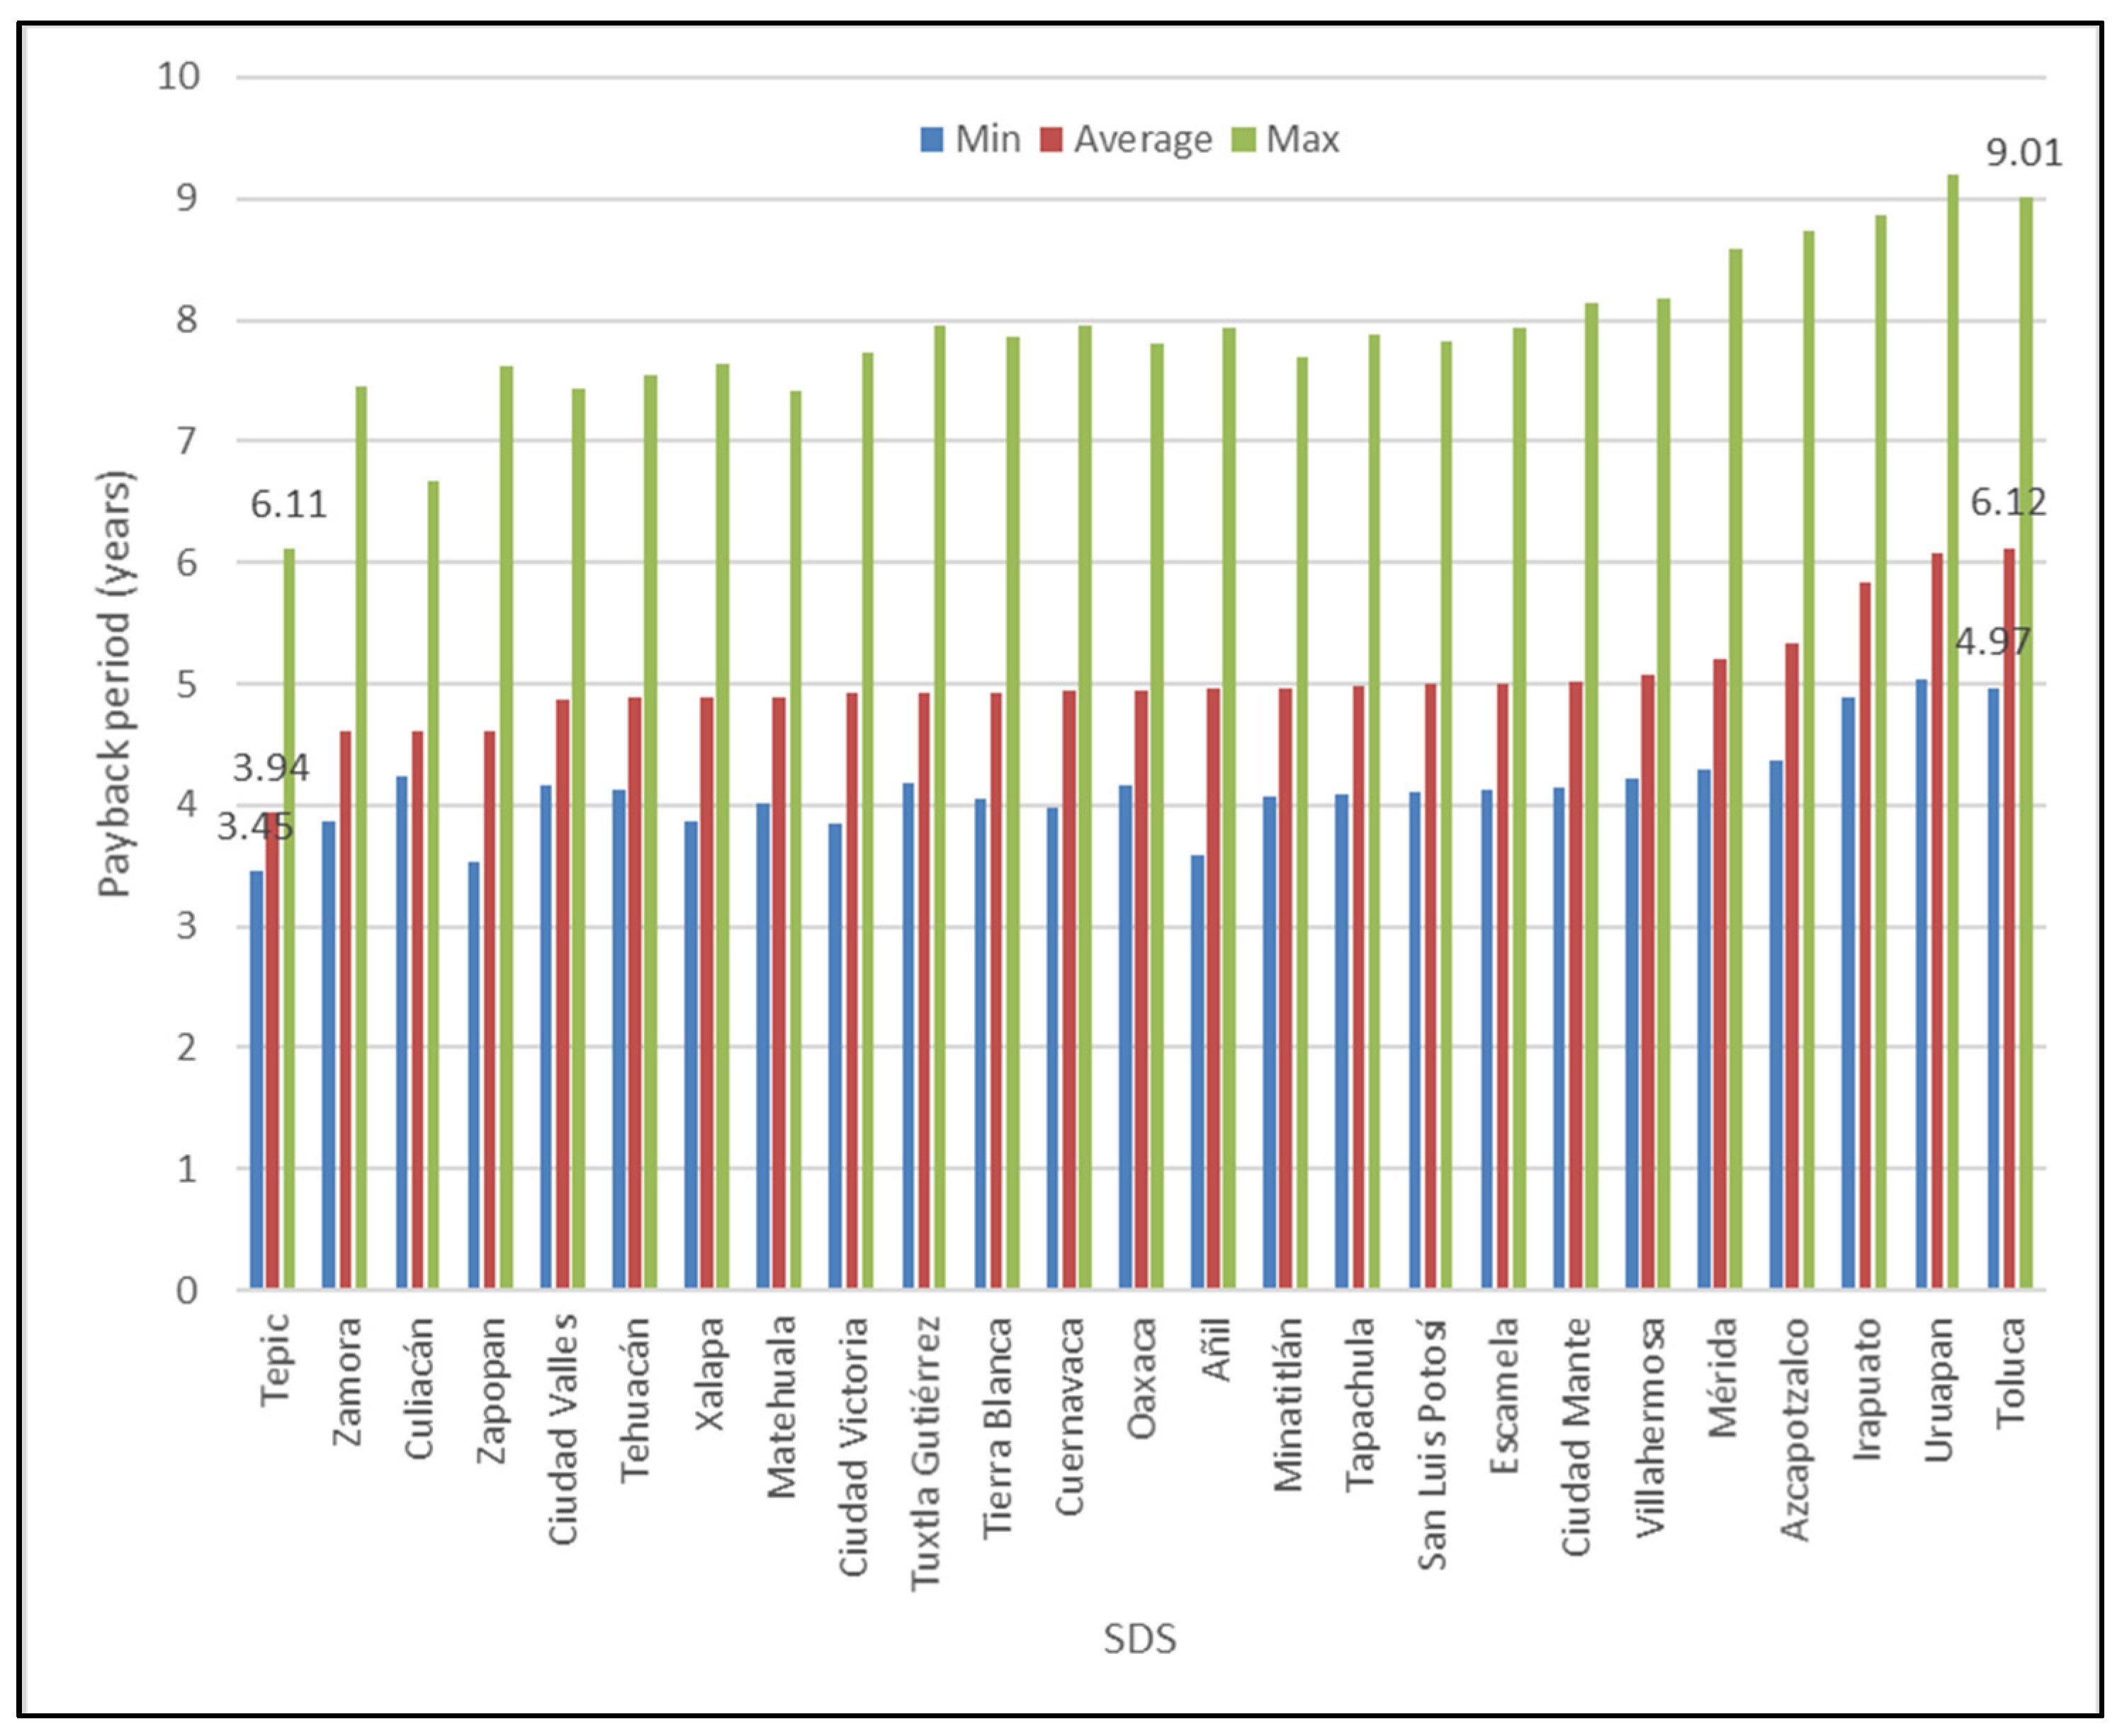
5.3. Optimal Hydrogen Supply Chain Configuration

Table 12 shows the results of the general economic and environmental system indicators for the optimal solution that TOPSIS selected from the Pareto front.
The average contribution of each element in the supply chain to the final cost of hydrogen in the storage station can be determined. The cost of hydrogen production adds an average of 85% to the total cost of the product in the supply chain. In this case, the transport costs add (on average) 2% to the total costs of hydrogen. Table 13 lists the economic details within the HSC, listing the SDSs selected for hydrogen storage and their supplier production points.
The CO2 emissions from transport and storage were estimated at 51,443,692 kg equivalent carbon dioxide per year, with transport processes contributing 23%. The optimal design of the HSC network is shown in Figure 10. The hydrogen produced is distributed across a larger number of storage terminals compared with the solution that minimized the GWP. On the other hand, it can also be observed that the distribution distances are usually shorter compared to the solution found, which maximizes the benefits of the system and reaches a central point from both limits.

Investment Assessment and Uncertainty Analysis

An investment assessment within a horizon of 10 years was performed to estimate the internal rate of return (IRR) and payback period, using probability distributions for modeling the uncertain behavior within model inputs. The uncertainty analysis was performed using the Monte Carlo simulation methodology. In Figure 11, IRR ranges are estimated for each hydrogen receiving SDS, where it can be observed that Tepic’s HSC is the most profitable case with an average of 28.90%, with minimum and maximum values oof about 15.10% and 34.20%, respectively, while Toluca’s HSC is the least profitable one, with an average IRR of 15.80%, and minimum and maximum values of about 7.10% and 21%, respectively. The average IRR for all SDS is 21.50%, which is considered an acceptable value in terms of this study.
In terms of payback period, the average value for all SDS is 5.02 years. As expected, and according to the IRR, the case with the shortest payback period is Tepic, with an average value of 3.94 years, and minimum/maximum values about 3.45 and 6.11 years, respectively. In the case of the largest payback period, Toluca presented 6.12 years on average, and minimum/maximum values of 4.97 and 9.01 years, respectively. This information is presented in Figure 12.
From the uncertainty analysis it can be concluded that, in most cases, the HSC’s deployment might turn out convenient in economic term, due to their acceptable IRR and short payback periods. There are some cases like Tepic’s where the case is extremely convenient and others like Toluca’s where economic indicators are not that favorable. The main reason why there are big differences between cases is the wide range of water, electricity, and fuel prices across the country, along with differences in raw sugar cane availability and quality.

6. Conclusions

The information gathered was used to develop a mathematical optimization model that estimates the main economic and environmental indicators of the HSC network operation; the optimization criteria are defined as the annual profits and GWP. The latter refers to the generation of equivalent carbon dioxide that comes from the HSC activities.
Once the optimization criteria were established, it was possible to find the optimal values of the mathematical model using the artificial intelligence tool known as GA, which was used as a first approximation under a single criteria approach to know the limits of the model and obtain the maximum and minimum values of the relevant parameters. Subsequently, both optimization criteria were optimized at the same time, so that many feasible solutions could be generated, from which the one that best met the specified criteria was selected. This optimal configuration selection was made using the TOPSIS multi-criteria decision technique. Based on these results, it was possible to observe the different configurations that the hydrogen supply chain can take, as well as the advantages and disadvantages associated with each solution. In addition, the proportion of the contribution of the many elements of the system to investment capital and operating costs, as well as their contribution to the equivalent CO2 emissions, could be defined. The obtained results show that it turns out to be economically convenient to produce hydrogen in each of the 50 proposed production points for all the scenarios, the storage infrastructure layout distributed across strategic parts of the country exposes several advantages in terms of resource utilization, since the closeness of multiple storage points from each production plant location brings a wide scope of possible solution alternatives. Several differences can be observed between the solutions: in the profit maximization function the profit ratio of 55.67% and 1057 kg of CO2 per ton of hydrogen is achieved, while the GWP minimization function offers an average profit ratio of 44.72% and 829 kg of CO2 emitted due to direct hydrogen transportation and storage activities. An evaluation to quantify the economic benefits of using the available electric energy and the utilization of already existing infrastructure for hydrogen production, storage and transportation can be exposed as a starting point for considering the integration of hydrogen as an energy carrier in developing countries, with the infrastructure deployment being the most capital-intensive phase of the energy transition to a hydrogen economy.
The impact of the study relies on putting into perspective the economic and environmental benefits obtained from non-conventional energy sources, and its integration to the national energy grid, directing such energy to sectors with higher demand, like the transportation sector. The knowledge acquired supports the decision-making process during the exploration of new alternatives in the search for supplying the energy deficit in a specific region—Mexico, in this case. This paradigm opens the scope of research to new possibilities for considering economically and environmentally convenient solutions, under resource constraints and the uncertainty contained in the system. The proposed model was validated in a case study of the Mexican sugarcane industry.
Further research is recommended by adding refueling station location capabilities to the model to complete the final HSC echelon. It is also recommended to evaluate social risk by quantifying possible hazards and optimizing the risk criteria along the economic and environmental objective functions. It can be highlighted from the reviewed literature that there are few studies that integrate biomass waste utilization and hydrogen production, and even less studies using electrolysis in a biomass to power to hydrogen configuration using existing infrastructure in all the HSC echelons. As far as we know, this is the only study that considers this type of hydrogen production scheme applied to Mexican territory.
Some model limitations include that it was designed for evaluating an operation year that is divided in two periods. Moreover, the model was built for considering only the electrolysis process for hydrogen production, and existing storage infrastructure, which restricts the possibilities of the model in terms of specific location of such facilities.

Author Contributions

Conceptualization, L.M.R.-B. and A.A.A.-L.; Data curation, L.M.R.-B.; Formal analysis, L.M.R.-B.; Investigation, L.M.R.-B., J.O.R.-C. and D.V.-V.; Methodology, L.M.R.-B. and A.A.A.-L.; Project administration, J.O.R.-C. and A.A.A.-L.; Resources, J.O.R.-C. and D.V.-V.; Software, C.A.-P.; Supervision, C.G.M.-S., M.A.G.-H. and A.A.A.-L.; Validation, C.G.M.-S. and M.A.G.-H.; Writing—original draft, L.M.R.-B.; Writing—review and editing, L.M.R.-B., J.O.R.-C., C.A.-P., C.G.M.-S., D.V.-V. and A.A.A.-L. All authors have read and agreed to the published version of the manuscript.

Funding

This research was funded by Tecnológico Nacional de México grant number 7737.20P, and by Consejo Nacional de Ciencia y Tecnología through a scholarship given to Luis Miguel Reyes Barquet (Main author) with CVU: 920654. The APC was funded by Daniel Villanueva Vásquez.

Institutional Review Board Statement

Not Applicable.

Informed Consent Statement

Not Applicable.

Data Availability Statement

Public data sets available at SAGARPA, “Planeación Agrícola Nacional 2017–2030,” 2016 (https://www.gob.mx/agricultura/acciones-y-programas/planeacion-agricola-nacional-2017–2030-126813 accessed on 22 March 2020); CONADESUCA, 6to. Informe Estadístico del Sector Agroindustrial de la Caña de Azúcar en México, zafras 2009–2010/2018–2019, Comité Nacional para el Desarrollo Sustentable de la Caña de Azúcar, 2019 (https://siiba.conadesuca.gob.mx/Archivos_Externos/6to_informe_estad%C3%ADstico.pdf accessed on 17 February 2020); Comisión Nacional de hidrocarburos, “Reservas de hidrocarburos en México conceptos fundamentales y análisis 2018” (https://www.gob.mx/cnh/documentos/analisis-de-informacion-de-las-reservas-de-hidrocarburos-de-mexico-al-1-de-enero-del-2018?idiom=es accessed on 25 February 2020); Mendoza A., Cadena A. and de Buen O., Estudio de pesos y transportes, Secretaría de comunicaciones y transporte, 2010.

Acknowledgments

We thank CONACYT, the Corporate Porres Group, Orizaba Institute of Technology, and all professor-researchers for their support, and the National Technology of Mexico for funding the project with reference number 7737.20-P, entitled “Multi-criteria Optimization of a Hydrogen Supply Chain Generated from Agro-industrial Waste”.

Conflicts of Interest

The authors declare that they have no known competing financial interests or personal relationships that could have appeared to influence the work reported in this paper.

Appendix A. Calculations for Estimating Model Inputs

In Equation (A1), the bagasse availability is calculated in tons for each sugar mill i using the quantity of raw sugarcane and the mass fraction of bagasse, both represented by probability distributions.
A v B a g i = t C a n e i % B a g I n C a n e i ,       i = 1 50
In Equation (A2) Operation hours parameter for each period z is calculated considering the number of operation days in each period z (modeled using probability distributions) and the downtime during operation.
O p H r s z = ( D O p z 24 ) ( 100 % % D o w n t i m e )   ,     1 ,   2
The quantity of bagasse per hour combusted in the boilers of each sugar mill i is calculated using Equation (A3).
B a g B r n i z = A v B a g i O p H r s z     ,     z = 1 ,   2   ; i = 1 50
The lower bagasse energy content in cal/ton is estimated using Equation (A4) extracted from [32], where bagasse humidity (BagHumi) is an uncertain parameter, modeled by probability distributions for each mill i.
B a g E C o n t i = 17 , 799.3 20 , 305.98 B a g H u m i     i = 1 50
Equation (A5) calculates the bagasse energy flow per hour.
B a g E F l o w i z = B a g B r n i z B a g E C o n t i   ,   i = 1 50
Steam production in tons at each sugar mill i is calculated using Equation (A6).
S t e a m i z = B a g E F l o w i ( B o i l e r E f D E n t h a l p y ) 1000 ,     i = 1 50
Electric power generation in MWh at each mill i is estimated using Equation (A7).
E l e c P w r i z = S t e a m i ( % S e l f C o n s S t e a m i )   G e n P e r f ,     i = 1 50
Table A1. Complementary calculations glossary.
VariableDescription
%Downtime Fraction of inactivity time (%)
%SteamSelfConsPercentage of steam consumption (%)
AvBagiAvailable bagasse at each sugar mill i (tons)
BagBrnizBagasse burning flow at mill i during period z (tons/hour)
BagEContiBagasse energy content at mill i (kcal/ton)
BagEFlowizBagasse energy content flow at mill i (kcal/hour)
BagHumiMass fraction of humidity content at mill i (%)
BagInCaneiMass fraction of bagasse in sugar cane at each sugar mill i (bagasse tons/sugarcane tons)
BoilerEfBoiler efficiency (%)
DEnthalpySteam delta enthalpy (kcal/cm2)
ElecPwrizElectric power generation at mill i during period z (MWh)
GenPerfElectric generator turbine performance (steam tons/MWh)
DOpzOperation days during period z (days)
OpHrszOperation hours during period z (hours)
SteamizSteam production at mill i during period z (tons/hour)
tCaneiSugar cane available at each sugar mill i (tons)

Appendix B

Table A2. Probability distributions for bagasse availability modelling.
Sugar MilltCane (Tons)BagInCaneBagHum (%)
Aaron SáenzRiskLaplace (1,062,951, 162,684.8)RiskExtvalueMin (0.28208, 0.0052635)RiskPareto (45.277, 50.01)
Alianza popularRiskPareto (15.534, 1,091,755)RiskPareto (17.647, 0.24674)RiskUniform (42.853, 54.287)
AmecaRiskUniform (1,032,772, 1,314,071)RiskExtvalueMin (0.24318, 0.007397)RiskPareto (47.183, 49.841)
AtencingoRiskUniform (1,539,709, 1,931,089)RiskExtvalueMin (0.28181, 0.0017849)RiskPareto (227.42, 50.64)
AzsuremexRiskUniform (111,320, 236,294)RiskExtvalueMin (0.35416, 0.024192)RiskExtvalueMin (51.1982, 0.88002)
BellavistaRiskUniform (544,556, 767,230)RiskLaplace (0.26549, 0.0042446)RiskExtvalueMin (51.7613, 0.39862)
Benito JuárezRiskUniform (915,567, 1,669,420)RiskExtvalueMin (0.29877, 0.0024705)RiskExtvalueMin (51.2247, 0.46764)
CalipamRiskLaplace (185,777.6667, 24,246.0872)RiskPareto (17.107, 0.31175)RiskExtvalueMin (50.8465, 0.70592)
Casasano La abejaRiskPareto (17.203, 581,923)RiskPareto (34.074, 0.25738)RiskKumaraswamy (0.075606,0.18032, 46.1,51.18)
ConstanciaRiskPareto (10.619, 751,826)RiskLaplace (0.27543, 0.010389)RiskPareto (98.361, 49.106)
CuatolapamRiskPareto (8.3168, 669,112)RiskExtvalue (0.283955, 0.016257)RiskUniform (49.9225, 51.9875)
El CarmenRiskExtvalueMin (565,173.2923, 110,856.4894)RiskExtvalueMin (0.323, 0.010938)RiskKumaraswamy (0.078411, 0.19166, 50.629, 53.053)
El HigoRiskNormal (1,758,914, 89,388)RiskNormal (0.3233037, 0.0076643)RiskUniform (51.7425, 56.0475)
El ManteRiskUniform (606,942, 1,101,350)RiskKumaraswamy (0.076156, 0.18217, 0.296446, 0.314114)RiskLaplace (51.1, 0.44173)
El ModeloRiskExtvalueMin (1,059,250.2819, 96,686.0013)RiskPareto (25.15, 0.26806)RiskTriang (48.7756, 50.41, 50.41)
El MolinoRiskPareto (5.0488, 681,227)RiskPareto (77.099, 0.27102)RiskPareto (135.6, 50.25)
El PotreroRiskNormal (1,629,870, 78,703)RiskPareto (66.285, 0.2666)RiskTriang (47.8444, 50.61, 50.61)
El RefugioRiskExtvalueMin (460,201.2784, 48,913.5247)RiskPareto (145.56, 0.28926)RiskPareto (63.715, 49.85)
El DoradoRiskNormal (451,622, 124,580)RiskPareto (20.357, 0.26842)RiskTriang (48.5712, 51.865, 51.865)
Emiliano ZapataRiskUniform (1,001,194, 1,241,654)RiskPareto (12.091, 0.26608)RiskKumaraswamy (0.079838, 0.18665, 48.426, 54.43)
HuixtlaRiskUniform (865,578, 1,386,963)RiskLaplace (0.27892, 0.016637)RiskLaplace (50.12, 0.52322)
José Ma MorelosRiskLaplace (573,662, 97,203.5759)RiskLaplace (0.30045, 0.0091253)RiskTriang (48.274, 52.01, 52.01)
La GloriaRiskExtvalue (1,387,788, 128,254)RiskLaplace (0.27426, 0.0057259)RiskKumaraswamy (0.073444, 0.19034, 47.59, 50.08)
La JoyaRiskPareto (6.2914, 662,566)RiskUniform (0.260448, 0.28558)RiskPareto (25.533, 48.01)
La MargaritaRiskExtvalueMin (1,114,659.5247, 65,442.6361)RiskPareto (69.982, 0.29615)RiskKumaraswamy (0.081137, 0.18753, 48.63, 51.85)
La providenciaRiskUniform (622,858, 921,585)RiskPareto (20.115, 0.25945)RiskKumaraswamy (0.074596, 0.18167, 47.5, 51.71)
Lázaro CárdenasRiskUniform (220,651, 420,987)RiskPareto (25.779, 0.21863)RiskKumaraswamy (0.074316, 0.18577, 49.732, 51.932)
López MateosRiskLaplace (1,552,596, 164,296.2606)RiskExtvalue (0.2769587, 0.004824)RiskPareto (51.682, 50.35)
MahuixtlanRiskUniform (345,480, 488,480)RiskExtvalueMin (0.27271, 0.0014487)RiskLaplace (49.9522, 0.10657)
Melchor OcampoRiskLaplace (1,110,585, 54,862.1928)RiskLaplace (0.28742, 0.0042788)RiskKumaraswamy (0.075628, 0.18143, 50.36, 53.11)
MotzorongoRiskLaplace (1,301,433, 203,462.3613)RiskPareto (24.532, 0.25684)RiskLaplace (49.89, 0.33796)
PanucoRiskUniform (1,299,749, 1,906,185)RiskPareto (48.802, 0.31117)RiskExtvalue (50.1014, 1.0208)
Table A3. Probability distributions for operation days and bagasse utilization.
VariableProbability DistributionUnit
OpDays during harvesting period (z = 1)Pert (155,160,179)Days
OpDays during non-harvesting season (z = 2)Pert (30,32.82,35.65)Days
AvBag for energy production (z = 1)Pert (52%,52.42%,52.848%)% de Bagazo
AvBag for energy production (z = 2)Pert (7%,7.33%,7.68%)% de Bagazo

Appendix C

Table A4. Probability distributions for electricity and water prices modelling.
Region (r)Electricity Price ($/MW)Water Price ($/m3)
NorthwestPert (26.23, 35.23, 44.19)Pert (0.18, 0.40, 0.56)
NorthPert (26.23, 35.23, 44.19)Pert (0.18, 0.40, 0.56)
NortheastPert (41.06, 64.33, 79.26)Pert (0.07, 0.24, 0.73)
WestPert (37.21, 60.66, 76.98)Pert (0.13, 0.23, 0.44)
CenterPert (42.99, 67.58, 86.21)Pert (0.038, 0.11, 0.238)
SouthPert (42.99, 67.58, 86.21)Pert (0.025, 0.093, 0.159)
GulfPert (41.23, 64, 81.47)Pert (0.105, 0.236, 0.236)
SoutheastPert (42.42, 66.28, 81)Pert (0.0951, 0.190, 0.190)

Appendix D

Table A5. Storage availability and probability distributions for fuel prices modelling.
RegionStateID (t)NameDesign Capacity (Barrels)Utilization Rate Fuel Price (MX$)
NorthwestB.C. Norte1ROSARITO1,393,0000.73RiskLogistic (19.20514, 0.18998)
B.C. Norte2ENSENADA135,0000.74RiskLogistic (19.39158, 0.18992)
B.C. Norte3MEXICALI155,0000.76RiskLogistic (19.45041, 0.19028)
Sonora4NOGALES45,0000.77RiskLaplace (19.6776, 0.30941)
Sonora5MAGDALENA40,0000.67RiskLaplace (19.6675, 0.32126)
Sonora6HERMOSILLO125,0000.69RiskLaplace (19.3266, 0.32346)
Sonora7GUAYMAS750,0000.71RiskLaplace (19.1096, 0.32513)
Sonora8CIUDAD OBREGÓN170,0000.66RiskLaplace (19.3257, 0.32251)
Sonora9NAVOJOA35,0000.72RiskLoglogistic (15.3836, 4.3047, 24.893)
B.C. Sur10LA PAZ230,0000.7RiskExtvalueMin (19.6679, 0.37766)
Sinaloa11TOPOLOBAMPO760,0000.71RiskTriang (17.9917, 19.7924, 20.1903)
Sinaloa12GUAMÚCHIL105,0000.71RiskTriang (18.7036, 20.2588, 20.8076)
Sinaloa13CULIACÁN115,0000.74RiskTriang (18.8595, 20.0375, 20.6478)
Sinaloa14MAZATLÁN620,0000.75RiskWeibull (5.175, 1.5556)
Nayarit15TEPIC95,0000.7RiskLaplace (19.6781, 0.27458)
NorthChihuahua16CIUDAD JUÁREZ245,0000.75RiskLaplace (18.6858, 0.32223)
Chihuahua17CHIHUAHUA420,0000.8RiskLaplace (19.1491, 0.30599)
Durango18DURANGO75,0000.69RiskLaplace (19.6863, 0.27829)
Chihuahua19PARRAL55,0000.73RiskLaplace (19.6639, 0.3026)
Durango20GÓMEZ PALACIO475,0000.72RiskLaplace (19.5364, 0.30492)
NortheastCoahuila21SABINAS100,0000.73RiskLaplace (19.5153, 0.319)
Coahuila22MONCLOVA235,0000.77RiskLaplace (19.4711, 0.33153)
Tamaulipas23NUEVO LAREDO75,0000.78RiskLaplace (19.34, 0.3101)
Tamaulipas24REYNOSA23,5000.62RiskLaplace (19.3046, 0.33903)
Nuevo León25SANTA CATARINA850,0000.69RiskLoglogistic (18.23, 1.0127, 6.1548)
Nuevo León26SALTILLO151,0000.78RiskLaplace (19.4162, 0.33261)
Nuevo León27CADEREYTA100,0000.75RiskLoglogistic (17.4049, 1.7244, 10.6)
SLP28MATEHUALA33,0000.74RiskLoglogistic (18.1427, 1.272, 7.2404)
Tamaulipas29CIUDAD VICTORIA195,0000.75RiskLoglogistic (17.8593, 1.2518, 7.2491)
Tamaulipas30CIUDAD MANTE21,0000.71RiskLaplace (19.0238, 0.35456)
SLP31CIUDAD VALLES75,0000.74RiskLoglogistic (17.792, 1.2502, 7.2677)
SLP32SAN LUIS POTOSÍ100,0000.69RiskLaplace (19.1377, 0.34971)
WestZacatecas33ZACATECAS85,0000.68RiskLaplace (19.5594, 0.3408)
Aguascalientes34AGUASCALIENTES105,0000.65RiskLaplace (19.5644, 0.33496)
Guanajuato35LEÓN110,0000.73RiskLaplace (19.5183, 0.32495)
Jalisco36ZAPOPAN390,0000.72RiskLoglogistic (18.47193, 0.94869, 5.5621)
Michoacán37ZAMORA90,0000.71RiskLaplace (19.6637, 0.32359)
Guanajuato38IRAPUATO430,0000.73RiskLaplace (19.5297, 0.31447)
Guanajuato39CELAYA180,0000.72RiskLaplace (19.5235, 0.32444)
Michoacán40URUAPAN130,0000.79RiskLoglogistic (18.1592, 1.2971, 7.5307)
Colima41COLIMA55,0000.79RiskLoglogistic (18.1186, 1.1784, 7.112)
Michoacán43MORELIA135,0000.73RiskLaplace (19.5371, 0.30931)
Jalisco44EL CASTILLO345,0000.64RiskLoglogistic (18.52751, 0.91876, 5.1437)
Michoacán45LÁZARO CÁRDENAS830,0000.73RiskLaplace (18.7947, 0.33233)
Colima46MANZANILLO465,0000.71RiskLaplace (18.773, 0.31928)
CenterMorelos47CUAUTLA60,0000.75RiskLaplace (19.3723, 0.31474)
Puebla48PUEBLA425,0000.71RiskLaplace (19.2147, 0.31217)
Puebla49TEHUACÁN45,0000.72RiskLaplace (19.2166, 0.32322)
Querétaro50QUERÉTARO230,0000.72RiskLaplace (19.4604, 0.31185)
Edo. De México51SAN JUAN IXHUATEPEC225,0000.62RiskLoglogistic (18.26004, 0.9894, 5.5995)
Morelos52CUERNAVACA135,0000.76RiskLoglogistic (18.0638, 1.2074, 7.239)
Edo. De México53TOLUCA195,0000.69RiskLoglogistic (17.5463, 1.7658, 11.077)
CDMX54AZCAPOTZALCO1,500,0000.74RiskLoglogistic (18.0401, 1.1, 6.6497)
Hidalgo55PACHUCA170,0000.71RiskLoglogistic (18.0877, 1.0409, 6.3148)
CDMX56BARRANCA DEL MUERTO125,0000.73RiskLoglogistic (18.26353, 0.99106, 5.6165)
CDMX57AÑIL235,0000.67RiskLoglogistic (18.24477, 0.99028, 5.7233)
SouthGuerrero58IGUALA60,0000.7RiskLaplace (19.4913, 0.30988)
Guerrero59ACAPULCO235,0000.62RiskLaplace (19.1366, 0.31701)
Oaxaca60OAXACA110,0000.76RiskLaplace (19.3487, 0.31066)
Oaxaca61SALINA CRUZ*1,479,0000.76RiskLogistic (18.86307, 0.18242)
Oaxaca62SALINA CRUZ205,0000.75RiskLogistic (18.86307, 0.18242)
Chiapas63TUXTLA GUTIÉRREZ105,0000.71RiskLogistic (19.02036, 0.17406)
Chiapas64TAPACHULA*24,5000.62RiskLaplace (19.3375, 0.30994)
Chiapas65TAPACHULA II65,0000.78RiskLaplace (19.3375, 0.30994)
GulfVeracruz66POZA RICA55,0000.7RiskLaplace (18.8571, 0.31891)
Veracruz67PEROTE25,0000.74RiskLoglogistic (17.8551, 1.265, 7.42)
Veracruz68XALAPA45,0000.6RiskLoglogistic (17.8126, 1.2419, 7.1738)
Veracruz69ESCAMELA98,0000.72RiskLaplace (19.0548, 0.32629)
Veracruz70VERACRUZ536,0000.66RiskLaplace (18.4593, 0.32756)
Veracruz71TIERRA BLANCA71,0000.69RiskLaplace (19.0025, 0.31694)
Veracruz72MINATITLÁN10,0000.59RiskLogistic (18.67753, 0.18353)
Tabasco73VILLAHERMOSA328,5000.72RiskLaplace (18.9172, 0.31921)
SoutheastYucatán74PROGRESO280,5000.71RiskLaplace (18.4223, 0.32023)
Campeche75CAMPECHE265,0000.79RiskLaplace (18.9739, 0.31608)
Yucatán76MÉRIDA148,0000.77RiskLaplace (18.4635, 0.31978)

Appendix E

Figure A1. Distance matrix for hydrogen transportation.
Mathematics 10 00437 g0a1aMathematics 10 00437 g0a1b
Figure A2. Toll cost matrix for hydrogen transportation.
Mathematics 10 00437 g0a2aMathematics 10 00437 g0a2b

References

  1. Morales, A.; Pérez, M.; Pérez, J.; De León, S. Energías renovables y el hidrógeno: Un par prometedor en la transición energética de México. Investig. Cienc. 2017, 25, 92–101. [Google Scholar] [CrossRef]
  2. Ehsan, S.; Abdul, M. Hydrogen production from renewable and sustainable energy resources: Promising green energy carrier for clean development. Renew. Sustain. Energy Rev. 2016, 57, 850–866. [Google Scholar] [CrossRef]
  3. Orecchini, F.; Bocci, E. Biomass to hydrogen for the realization of closed cycles of energy resources. Energy 2007, 32, 1006–1011. [Google Scholar] [CrossRef]
  4. De León Almaráz, S. Multi-Objective Optimization of a Hydrogen Supply Chain. Ph.D. Thesis, Toulouse Institute of Technology, Toulouse, France, 2014. [Google Scholar]
  5. Parker, N. Optimizing the Design of Biomass Hydrogen Supply Chains Using Real-Word Spatial Distributions: A Case of Study Using California Rice Straw. Master’s Thesis, University of California, Berkeley, CA, USA, 2007. [Google Scholar]
  6. Rico, J. Desarrollo de una Red de Valor Con Base a la Gestión de Bioenergía, Para Determinar Estrategias de Negocios. Ph.D. Thesis, Instituto Tecnológico de Orizaba, Orizaba, Mexico, 2015. [Google Scholar]
  7. Azzaro-Pantel, C. Hydrogen Supply Chain Design, Deployment and Operation; Elsevier: Amsterdam, The Netherlands, 2018; ISBN 9780128111987. [Google Scholar]
  8. Kim, J.; Moon, I. Strategic design of hydrogen infrastructure considering cost and safety using multiobjective optimization. Int. J. Hydrogen Energy 2008, 33, 5887–5896. [Google Scholar] [CrossRef]
  9. Almansoori, A.; Shah, N. Design and operation of a stochastic hydrogen supply chain network under demand uncertainty. Int. J. Hydrogen Energy 2012, 37, 3965–3977. [Google Scholar] [CrossRef]
  10. Güler, M.G.; Geçici, E.; Erdoğan, A. Design of a future hydrogen supply chain: A multi period model for Turkey. Int. J. Hydrogen Energy 2021, 46, 16279–16298. [Google Scholar] [CrossRef]
  11. Gabrielli, P.; Charbonnier, F.; Guidolin, A.; Mazzotti, M. Enabling low-carbon hydrogen supply chains through use of biomass and carbon capture and storage: A Swiss case study. Appl. Energy 2020, 275, 115245. [Google Scholar] [CrossRef]
  12. Quarton, C.J.; Samsatli, S. The value of hydrogen and carbon capture, storage and utilization in decarbonizing energy: Insights from integrated value chain optimization. Appl. Energy 2020, 257, 113936. [Google Scholar] [CrossRef]
  13. Li, L.; Manier, H.; Manier, M.-A. Hydrogen supply chain network design: An optimization-oriented review. Renew. Sustain. Energy Rev. 2019, 203, 342–360. [Google Scholar] [CrossRef]
  14. Ochoa, J.; Azzaro, C.; Martinez, G.; Aguilar, A. Social cost-benefit assessment as a post-optimal analysis for hydrogen supply chain design and deployment: Application to Occitania (France). Sustain. Prod. Consum. 2020, 24, 105–120. [Google Scholar] [CrossRef]
  15. Zakaria, I.H.; Ibrahim, J.A.; Othman, A.A. Waste biomass toward hydrogen fuel supply chain management for electricity: Malaysia perspective. In Proceedings of the AIP Conference Proceedings, Kedah, Malaysia, 11–13 April 2016; Volume 1761, p. 020111. [Google Scholar] [CrossRef] [Green Version]
  16. Lam, H.L.; Ng, W.P.; Ng, R.T.; Ng, E.H.; Aziz, M.K.A.; Ng, D.K.S. Green strategy for sustainable waste-to-energy supply chain. Energy 2013, 57, 4–16. [Google Scholar] [CrossRef]
  17. Gumte, K.; Pantula, P.; Miriyala, S.; Mitra, K. Achieving wealth from bio-waste in a nationwide supply chain setup under uncertain environment through data driven robust optimization approach. J. Clean. Prod. 2021, 291, 125702. [Google Scholar] [CrossRef]
  18. Goodzarzian, F.; Wamba, S.; Mathiyazhagan, K.; Taghipour, A. A new bi-objective green medicine supply chain network design under fuzzy environment: Hybrid metaheuristic algorithms. Comput. Ind. Eng. 2021, 160, 107535. [Google Scholar] [CrossRef]
  19. Abdolazimi, O.; Esfandarani, M.S.; Shishebori, D. Design of a supply chain network for determining the optimal number of items at the inventory groups based on ABC analysis: A comparison of exact and meta-heuristic methods. Neural Comput. Appl. 2021, 33, 6641–6656. [Google Scholar] [CrossRef]
  20. Paul, A.; Shukla, N.; Paul, S.K.; Trianni, A. Sustainable supply chain management and multi-criteria decision-making methods: A systematic review. Sustainability 2021, 13, 7104. [Google Scholar] [CrossRef]
  21. Tordecilla, R.; Juan, A.; Montoya, J.; Quintero, C.; Panadero, J. Simulation-optimization methods for designing and assessing resilient supply chain networks under uncertainty scenarios: A review. Simul. Model. Pract. Theory 2021, 106, 102166. [Google Scholar] [CrossRef]
  22. Hosseini, S.; Ghatreh, M.; Abbasi, F. A novel hybrid approach for synchronized development of sustainability and resiliency in the wheat network. Comput. Electron. Agric. 2020, 168, 105095. [Google Scholar] [CrossRef]
  23. Gital, Y.; Bilgen, B. Multi-objective optimization of sustainable biomass supply chain network design. Appl. Energy 2020, 272, 115259. [Google Scholar] [CrossRef]
  24. Rasi, R.; Sohanian, M. A multi-objective optimization model for sustainable supply chain network with using genetic algorithm. J. Model. Manag. 2021, 16, 714–727. [Google Scholar] [CrossRef]
  25. Zailan, R.; Lim, J.; Manan, Z.; Wan, S.; Mohammadi, B.; Jamaluddin, K. Malaysia scenario of biomass supply chain-cogeneration system and optimization modeling develpment: A review. Renew. Sustain. Energy Rev. 2021, 148, 111289. [Google Scholar] [CrossRef]
  26. Nunes, L.; Causer, T.; Ciolkosz, D. Biomass for energy: A review on supply chain management models. Renew. Sustain. Energy Rev. 2020, 120, 109658. [Google Scholar] [CrossRef]
  27. Seo, S.-K.; Yun, D.-Y.; Lee, C.-J. Design and optimization of a hydrogen supply chain using a centralized storage model. Appl. Energy 2020, 262, 114452. [Google Scholar] [CrossRef]
  28. Yuen, S.; Shen, B.; Dong, W.; Yong, S.; Akbar, M.; Sunarso, J. Techno-economic analysis for biomass supply chain: A state-of-the-art review. Renew. Sustain. Energy Rev. 2021, 135, 110164. [Google Scholar] [CrossRef]
  29. Rafique, R.; Jat, M.; Rehman, H.; Zahid, M. Bioenergy supply chain optimization for addressing energy deficiency: A dynamic model for large-scale network designs. J. Clean. Prod. 2021, 318, 128495. [Google Scholar] [CrossRef]
  30. Li, L.; Manier, H.; Manier, M.-A. Integrated optimization model for hydrogen supply chain network design and hydrogen fueling station planning. Comput. Chem. Eng. 2020, 134, 106683. [Google Scholar] [CrossRef]
  31. Ochoa, J.; Azzaro, C.; Aguilar, A. Optimization of a hydrogen supply chain network design under demand uncertainty by multi-objective genetic algorithms. Comput. Chem. Eng. 2020, 140, 106853. [Google Scholar] [CrossRef]
  32. Debernardi, H.; Ortiz, H.; Rosas, D. Energía Disponible en el Campo Cañero Mexicano. Códoba, Veracruz. 2014. Available online: https://www.atamexico.com.mx/wp-content/uploads/2017/11/3-DIVERSIFICACI%C3%93N-2015.pdf (accessed on 3 April 2020).
  33. SAGARPA. Planeación Agrícola Nacional 2017–2030. 2016. Available online: https://www.gob.mx/agricultura/acciones-y-programas/planeacion-agricola-nacional-2017-2030-126813 (accessed on 22 March 2020).
  34. CONADESUCA. 6to. Informe Estadístico del Sector Agroindustrial de la Caña de Azúcar en México, Zafras 2009–2010/2018–2019, Comité Nacional para el Desarrollo Sustentable de la Caña de Azúcar. 2019. Available online: https://siiba.conadesuca.gob.mx/Archivos_Externos/6to_informe_estad%C3%ADstico.pdf (accessed on 17 February 2020).
  35. Comisión Nacional de Hidrocarburos. Reservas de Hidrocarburos en México Conceptos Fundamentales y Análisis. 2018. Available online: https://www.gob.mx/cnh/documentos/analisis-de-informacion-de-las-reservas-de-hidrocarburos-de-mexico-al-1-de-enero-del-2018?idiom=es (accessed on 25 February 2020).
  36. IRENA. Hydrogen from Renewable Power: Technology Outlook for the Energy Transition; International Renewable Energy Agency: Abu Dhabi, United Arab Emirates, 2018; Available online: www.irena.org (accessed on 30 March 2020).
  37. Ferrero, D.; Gamba, M.; Lanzini, A.; Santarelli, M. Power-to-gas hydrogen: Techno-economic assessment of processes towards a multi-purpose energy carrier. Energy Procedia 2016, 101, 50–57. [Google Scholar] [CrossRef] [Green Version]
  38. Mendoza, A.; Cadena, A.; de Buen, O. Estudio de Pesos y Trasnportes, Secretaría de Comunicaciones y Transporte. 2010. Available online: http://www.dof.gob.mx/nota_detalle.php?codigo=5508944&fecha=26/12/2017 (accessed on 18 April 2020).
Figure 1. Methodological framework applied.
Mathematics 10 00437 g001
Figure 2. Hydrogen supply chain superstructure.
Mathematics 10 00437 g002
Figure 3. Hydrogen production scheme.
Mathematics 10 00437 g003
Figure 4. Hydrogen distribution scheme.
Mathematics 10 00437 g004
Figure 5. Pie chart of the hydrogen total cost composition obtained from Profit O.F.
Mathematics 10 00437 g005
Figure 6. Pie chart of the hydrogen total cost composition obtained from GWP O.F.
Mathematics 10 00437 g006
Figure 7. HSC configuration obtained by profit O.F. optimization.
Mathematics 10 00437 g007
Figure 8. HSC configuration obtained by GWP O.F. optimization.
Mathematics 10 00437 g008
Figure 9. Pareto front chart and TOPSIS selected solution.
Mathematics 10 00437 g009
Figure 10. Optimal design for hydrogen supply chain network.
Mathematics 10 00437 g010
Figure 11. IRR for each SDS case.
Mathematics 10 00437 g011
Figure 12. Payback period for each SDS Case.
Mathematics 10 00437 g012
Table 1. Summary of the reviewed literature with a supply chain optimization approach.
ReferenceObjective FunctionFeedstock
(Energy Source)
Hydrogen Production TechnologyCase Study
[8]Total cost minimization
Total relative risk minimization
NG, renewable electricitySMR, electrolysisSouth Korea
[9]Total cost minimizationNG, oil, coal, biomass, solar powerSMR, biomass and coal gasification, electrolysisGreat Britain
[10]Total cost minimizationNG, coal, biomass, solar, wind, hydroelectric, geothermalSMR, coal and biomass gasification, electrolysisTurkey
[11]Total cost minimization
GWP minimization
NG, biomass, electricitySMR, gasification, electrolysisSwiss
[12]NPV maximization
Emissions minimization
NG, wind powerElectrolysisGreat Britain
[14]Total Cost minimization
GWP minimization
NG, renewable electricity, nuclear powerSMR, electrolysisFrance (Midi-Pyrénées)
[15]-Coal, biomassElectrolysis, gasificationMalaysia
[16]NPV maximization
Transport cost minimization
Biomass-Malaysia
NG = Natural Gas, SMR = Steam Methane Reforming, GWP = Global Warming Potential, NPV = Net Present Value.
Table 2. Glossary.
Table 2. Glossary.
NomenclatureDescription
AlkAlkaline electrolysis
CCUSCarbon capture, utilization and storage
CONACYTConsejo Nacional de Ciencia y Tecnología
CONADESUCA Comité Nacional para el Desarrollo Sustentable de la Caña de Azúcar
FCEVFuel cell electric vehicle
GAGenetic algorithm
GHGGreenhouse gas
GWPGlobal warming potential
HSCHydrogen supply chain
HSCNHydrogen supply chain network
MILPMixed integer linear programming
MinMinimize
MWMega watt
MWhMega watt hour
NGNatural gas
NPVNet present value
O&MOperation and maintenance
OFObjective function
PEMProton exchange membrane electrolysis
SCBASocial cost–benefit analysis
SDSStorage and dispatch station
SMRSteam methane reforming
TOPSISTechnique for order of preference by similarity to ideal solution
Indices
i Sugar mills
pHydrogen production technology
rIdentification number for regions
tIdentification number for storage and dispatch stations
zProduction period
Decision Variables
FitHydrogen flow rate between sugar mill i and station t (ton/year)
PEipElectrolysis plant type p at sugar mill i logic variable with values of 0 or 1
PH2ipzHydrogen production rate during period z from plant type p at sugar mill i (ton/year)
Parameters
ADtAvailable storage capacity at station t (m3)
AExptTotal annual expenses of hydrogen stored at station t ($/year)
AProftAnnual profit generated at station t ($/year)
ATollCitAnnual toll costs between sugar mill i and storage station t ($/year)
CAlmtAnnual storage cost at station t ($/year)
CapexpCapital expenditures for electrolysis plant type p ($/MW)
CapInstipInstalled capacity of plant type p at sugar mill i (MW)
CapTransTransportation mode capacity (ton)
CCombitFuel transportation costs between sugar mill i and storage station t ($/year)
CCondtConditioning cost per ton of hydrogen at station t ($/ton)
CFPipAnnual fixed production cost for plant type p at sugar mill i ($/year)
CFUPipFixed production costs per ton of hydrogen for plant type p at sugar mill i ($/ton)
CIPipProduction investment capital ($)
CMantitMaintenance expenses for transportation mode between sugar mill i and storage station t ($/year)
CMOitAnnual transportation labor costs between sugar mill i and station t ($/year)
CProdtAnnual hydrogen production costs stored at station t ($/year)
CTransitTransportation cost between sugar mill i and storage station t ($/year)
CUAlmStorage cost per ton of hydrogen at station t ($/ton)
CUPipProduction cost per ton of hydrogen for plant type p at sugar mill i ($/ton)
CVUPipVariable production cost per ton of hydrogen for plant type p at sugar mill i ($/ton)
ditDistance between sugar mill i and storage station t (km)
DMTAvailability of transportation mode (days/year)
DOpzOperational days during period z (days)
ECFuel economy of transportation mode (km/L)
EConspElectricity consumption per ton of hydrogen p (MW/ton)
EnAcConditioning energy required per ton of hydrogen (MW/ton)
FCEVPerfFCEV performance (km/ton of hydrogen)
FPtFuel price per liter at station t ($/L)
GasPerfMedium size combustion vehicle performance (km/L of gasoline)
GMMaintenance expenses of transportation mode ($/km)
GWPTotalSystem’s annual total GWP (eq kg CO2/year)
NUTitNumber of transport units between sugar mill i and station t
OpexpAnnual operating expense ratio to CAPEX of plant type p (%)
PCGAlmStorage GWP per ton of hydrogen (kg CO2 eq/ton)
PCGPProduction GWP per ton of hydrogen (kg CO2 eq/ton)
PCGTransTransportation GWP per ton of hydrogen (kg CO2 eq/ton)
PEErElectric power price at station t ($/MW)
PGWPProduction GWP (eq. kg CO2/year)
PHMaxipzMaximum hydrogen production during period z from plant type p at sugar mill i (ton)
PVArWater cubic meter price at region r ($/m3)
PVGastReference fuel price per liter at station t ($/L)
PVH2tHydrogen selling price at station t ($/ton)
SCMonthly driver wage ($/month)
SGWPStorage GWP (eq kg CO2/year)
TCDCharge and discharge time of transportation mode (h/trip)
TGWPTransportation GWP (eq. kg CO2/year)
TollCitToll cost for hydrogen transportation units per trip ($)
TotalUttAnnual total utilities at station t ($/year)
TripsitAnnual trips amount required between sugar mill i and station t (trips/year)
TUWTransport unit weight (ton)
VmAverage speed for transportation Unit (km/h)
WConspWater consumption per ton of hydrogen at plant type p (m3/ton)
Table 3. Genetic algorithm parameters and stopping conditions for mono-objective optimization.
ParameterValue
Population30,000
Crossing rate0.5
Mutation rate0.1
Solution methodOrder
Stopping conditions
Max. Change0.005%
Max. Iterations without improvement20,000
Table 4. Multi-objective genetic algorithm configuration.
ParameterValue
Population36,500
Number of generations73,000
Crossing rate0.9
Mutation rate0.5
Table 5. Production parameters.
ParameterAlkalinePEMReference
ECons (kWh/kgH2)49 52 [36]
Performance (HHV) (%)7164
CAPEX ($/kW)507.8 740.5
Opex (%CAPEX/year)32
Lifetime (years)20 20
WCons (m3/ton H2)9
Table 6. Hydrogen storage parameters.
ParameterStorage Unit
Minimum Capacity (kg)500[7,9]
Maximum capacity (kg)10,000
Investment capital ($)5,542,595
CAlm ($/kg H2)0.722
Lifetime (years)20
SGWP (kg CO2 per ton H2)704
Maximum storage time (days)10 Assumption
Table 7. Hydrogen transportation parameters.
ParameterValueScaleReference
TUW40Ton[9]
SC736$/month[35]
EC2.3km/L[7]
FP--Appendix D
TCD2Hours per trip[7]
CMant2.42$/km[7]
Vm67km/h
DMT18Hours/dayAssumption
TGWP62g CO2 per ton-km[4]
CapTrans3.5Ton
TransCapex293,756$[7]
Table 8. Hydrogen selling price parameters.
ParameterValue
FCEVPerf0.98 kg H2/100 km
Annual average distance traveled for medium size vehicles15,000 km/year
Table 9. Mono-objective optimization results.
ParameterProfit O.F.GWP O.F.
Number of production units50 ALK50 ALK
Number of transport units7355
Number of storage units275286
Investment capital costs
Production capital cost$373,654,974 $373,654,974
Transport capital cost$5,402,025$4,070,019
Storage capital cost$1,524,213,622$1,585,182,167
Total capital cost$1,903,270,621$1,962,907,160
Operating costs
Production$188,692,213$188,692,213
Transport$5,682,987$2,242,429
Storage$27,354,603$28,880,026
Total Outcome$221,729,804$219,815,777
Average cost per unit ($/kg H2)$3962$3928
Profit estimation
Total hydrogen production (ton/year)55,96555,965
Average selling price ($/ton)$8938$8782
Total income$500,220,813$491,490,525
Annual profit$278,491,009$271,675,857
Net profit margin55.67%44.72%
GWP (kg eq. CO2)
Production--
Transport39,399,36039,399,360
Storage19,783,3617,015,414
Total GWP (kg eq.CO2)59,182,72146,414,774
GWP per unit (kg eq. CO2/ton H2)1057829
Optimization time (s)17,38821,728
Table 10. Profit O.F. detailed economic report.
E.P. LocationSDSHydrogen Flow (Ton/Year)Production Cost ($/Ton)Transportation Cost ($/Ton)Storage Cost ($/Ton)Total Cost per Unit ($/Ton)Selling Price ($/Ton)Profit ($/Year)
El MolinoGuamúchil8801984.82265.82290.912541.559198.385,858,008
Puga14141984.82266.11290.912541.859198.389,412,337
El DoradoCuliacán4791984.8235.71290.912311.449163.753,282,257
Quesería12923269.16367.73290.913927.809163.756,764,828
AmecaTepic10503269.1681.73290.913641.809085.175,715,544
Bellavista6413269.1697.94290.913658.019085.173,478,795
José Ma Morelos6483269.16151.03290.913711.109085.173,482,392
Melchor Ocampo11623269.16138.41290.913698.489085.176,259,316
Tala17143269.1682.71290.913642.839085.179,328,207
Aarón SáenzZacatecas11043456.53171.07500.744128.349030.355,411,801
El Mante9763456.53172.05500.744129.329030.354,783,390
San Miguel del Naranjo19803456.53163.51500.744120.789030.359,720,987
Alianza PopularAguascalientes12163456.53161.64500.794118.969032.665,975,092
Plan de Sal Luis14003456.53225.29500.794182.619032.666,790,102
Lázaro CárdenasZamora2733269.1681.68500.793851.629078.541,426,943
Pedernales4363269.16106.04500.793875.989078.542,268,306
Santa Clara6553269.1638.51500.793808.459078.543,451,896
Tamazula15663269.1659.58500.793829.529078.548,219,934
Plan de AyalaCelaya13253456.53201.18500.794158.509013.806,433,280
El Higo19573436.98182.47500.794120.249013.809,576,710
Pánuco19183436.98254.86500.794192.639013.809,247,004
AtencingoCuautla18273617.0925.44557.814200.348944.018,666,645
Casasano6453617.0919.30557.814194.208944.013,063,613
CalipamTehuacán2333617.1453.49557.814228.448872.101,081,978
El refugio4753616.8076.18557.814250.798872.102,195,132
Constancia8863436.9864.24557.814059.048872.104,264,358
Motzorongo13413436.9858.99557.814053.788872.106,461,356
Emiliano ZapataIguala11873617.0950.39557.814225.298998.925,666,304
López MateosOaxaca16073616.8076.47557.814251.088933.107,523,971
Tres Valles23963436.9886.00557.814080.808933.1011,626,096
HuixtlaTapachula12023616.8025.98557.814200.598927.955,682,255
El ModeloPerote10793436.9844.20528.294009.488845.385,217,947
Mahuixtlán4363436.9848.72528.294014.008845.382,106,469
La GloriaXalapa15813436.9829.91528.293995.198816.017,621,740
San Pedro12733436.9882.86528.294048.138816.016,069,513
El CarmenEscamela5773436.9819.79528.293985.078797.402,776,722
El Potrero17073436.9821.91528.293987.188797.408,211,057
La providencia8113436.9830.11528.293995.388797.403,894,444
Progreso9133436.9848.23528.294013.518797.404,367,711
San Cristobal5603436.9818.81528.293984.098797.402,695,459
San Miguelito5253436.9855.60528.294020.878797.402,507,675
San Nicolas11033436.9823.48528.293988.758797.405,303,941
La margaritaTierra Blanca12263616.8017.04528.294162.138773.285,653,241
Cuatotolapan8353436.9860.31528.294025.598773.283,964,315
San Cristobal25843436.9828.68528.293993.968773.2812,349,672
Benito JuárezVillahermosa14383436.9826.18528.293991.458733.896,819,600
Santa Rosalia7813436.9827.31528.293992.588733.893,702,945
AzsuremexCampeche2233436.98166.31547.354150.698760.071,027,891
La Joya8263553.4932.12547.354132.968760.073,821,972
Pucte16023553.49103.05547.354203.888760.077,298,984
-Total55,965-----278,491,009
-Average11193352.1194.50486.003961.948938.115,569,820
Table 11. GWP O.F. detailed economic report.
E.P. LocationSDSHydrogen Flow (Ton/Year)Production Cost ($/Ton)Transportation Cost ($/Ton)Storage Cost ($/Ton)Total Cost per Unit ($/Ton)Selling Price ($/Ton)Profit ($/Year)
El DoradoCuliacán4791984.8235.71290.912311.449163.753,282,247
El MolinoTepic8801984.8212.03290.912287.829085.175,981,676
Puga14141984.8212.18290.912287.929085.179,611,305
Aarón SáenzCd. Victoria11043456.5841.85531.244029.678841.905,312,714
Alianza Popular12163456.58102.55531.244090.378841.905,777,865
San Miguel del Naranjo15623456.5863.65531.244051.478841.907,482,657
Pánuco19183436.9894.70531.244062.928841.909,166,055
El ManteCd. Mante9763456.5810.36531.243998.188783.104,670,094
San Miguel del Naranjo4183456.5839.24531.244027.068783.101,988,030
Plan de AyalaCd. Valles13253456.587.66531.243995.488809.976,379,213
Plan de SL14003456.5819.55531.244007.378809.976,723,660
El Higo19573436.9837.03531.244005.268809.979,402,801
AmecaZapopan10503269.1630.40500.793800.348990.475,449,620
Bellavista6413269.1628.83500.793798.778990.473,327,871
Tala17143269.1615.08500.793785.028990.478,922,122
Santa ClaraZamora6553269.1638.56500.793808.509078.543,451,876
Lázaro CárdenasUruapan2733269.1639.15500.793809.099000.491,417,253
Pedernales4363269.1669.30500.793839.249000.492,250,304
QueseríaColima12923269.1617.34500.793787.288927.316,640,918
Tamazula15663269.1643.32500.793813.268927.318,008,598
José María MorelosManzanillo6483269.1690.77500.793860.718667.293,114,665
Melchor Ocampo11623269.1698.62500.793868.578667.295,576,116
AtencingoCuautla18273617.1425.44557.814200.398944.018,666,588
Casasano6453617.1419.30557.814194.258944.013,063,593
CalipamTehuacán2333617.1453.44557.814228.398872.101,081,986
Emiliano ZapataCuernavaca11873617.1422.74557.814197.698915.185,599,657
HuixtlaTapachula12023616.8025.98557.814200.598927.905,682,213
MahuixtlánXalapa4363436.9827.31528.293992.588816.012,103,009
El CarmenEscamela5773436.9819.74528.293985.028797.402,776,734
El Potrero17073436.9821.91528.293987.188797.408,211,016
La Providencia8113436.9831.58528.293996.868797.403,893,227
Progreso9133436.9848.23528.294013.518797.404,367,679
San José de Abajo5603436.9833.79528.293999.078797.402,687,057
San Miguelito5253436.9855.60528.294020.878797.402,507,667
Adolfo López MateosVeracruz16073616.8062.97528.294208.068522.456,933,222
El Modelo10793436.9828.44528.293993.718522.454,886,503
La Gloria15813436.9829.32528.293994.608522.457,158,529
Motzorongo13413436.9850.34528.294015.628522.456,043,655
San Cristobal25843436.9868.22528.294033.508522.4511,599,444
San Nicolás11033436.9855.80528.294021.078522.454,965,017
San Pedro12733436.9844.25528.294009.538522.455,744,944
El RefugioTierra Blanca4753616.8033.74528.294178.838773.232,182,339
La Margarita12263616.8017.04528.294162.138773.235,653,206
Constancia8863436.9826.62528.293991.908773.234,236,264
Tres Valles23963436.9812.13528.293977.418773.2311,490,797
CuatotolapamMinatitlán8353436.9844.94528.294010.228623.233,851,868
AzsuremexVillahermosa2233436.98109.48528.294074.758733.891,038,987
Benito Juárez14383436.9826.18528.293991.458733.896,819,623
Santa Rosalía7813436.9827.31528.293992.588733.893,702,960
La JoyaCampeche8263553.4932.12547.354132.968760.073,822,004
San Rafel PuctéYucatán16023553.4974.71547.354175.548524.366,966,830
-Total55,965-----271,675,857
-Average1097335440.72513.113907.968803.935,433,517
Table 12. Multi-objective optimization results.
ParameterValues
Number of production units50 ALK
Number of transport units59
Number of storage units279
Investment capital costs
Production capital cost$373,654,974
Transport capital cost$4,366,020
Storage capital cost$1,546,384,002
Total capital cost$1,924,404,997
Operating costs
Production$188,692,213
Transport$3,550,495
Storage$29,250,926
Total outcome$275,197,558
Average cost per unit ($/kg H2)$3958
Profit estimation
Total hydrogen production (ton/year)55,965
Average selling price ($/ton)$8875
Total income$496,691,192
Annual profit$275,226,444
Net profit margin55.40%
GWP (kg CO2 eq.)
Production0
Transport39,399,360
Storage12,044,332
Total GWP (kg CO2 eq.)51,443,692
GWP per unit (kg CO2/ton H2)919
Optimization time (s)19,879
Table 13. Multi-objective optimal solution detailed economic report.
E.P. LocationSDSHydrogen Flow (Ton/Year)Production Cost ($/Ton)Transportation Cost ($/Ton)Storage Cost ($/Ton)Total Cost Per Unit ($/Ton)Selling Price ($/Ton)Profit ($/Year)
El DoradoCuliacán4791984.8235.71290.912311.449163.753,282,247
El MolinoTepic8801984.8212.03290.912287.829085.175,981,676
Puga14141984.8212.18290.912287.929085.179,611,305
San Miguel del NaranjoMatehuala19803456.5886.84531.244074.668982.429,717,387
Aarón SáenzCd. Victoria11043456.5841.85531.244029.678841.905,312,714
Pánuco19183436.9894.70531.244062.928841.909,166,055
El ManteCd. Mante9763456.5810.36531.243998.188783.104,670,094
Plan de AyalaCd. Valles13253456.587.17531.243994.998809.976,379,864
Alianza Popular12163456.5826.96531.244014.788809.975,830,960
El Higo19573436.9837.03531.244005.268809.979,402,801
Plan de SLS.L.P.14003456.58126.67531.244114.498835.666,609,652
AmecaZapopan10503269.1630.40500.793800.348990.475,449,620
Bellavista6413269.1628.83500.793798.778990.473,327,871
José María Morelos6483269.1684.53500.793854.478990.473,328,129
Melchor Ocampo11623269.1664.73500.793834.688990.475,991,035
Tala17143269.1615.08500.793785.028990.478,922,122
QueseríaZamora12923269.16124.41500.793894.359078.546,697,967
Santa Clara6553269.1638.56500.793808.509078.543,451,876
Tamazula15663269.1659.58500.793829.529078.548,219,962
PedernalesIrapuato4363269.16122.64500.793892.589016.652,234,093
Lázaro CárdenasUruapan2733269.1639.15500.793809.099000.491,417,253
CalipamTehuacán2333617.1453.44557.814228.398872.101,081,986
Constancia8863436.9864.24557.814059.048872.104,264,375
Motzorongo13413436.9858.99557.814053.788872.106,461,367
AtencingoCuernavaca18273617.1444.01557.814218.968915.238,580,084
Casasano6453617.1424.66557.814199.618915.233,041,575
Emiliano Zapata11873617.1422.74557.814197.698915.235,599,716
MahuixtlánToluca4363436.98188.75557.814183.558927.212,068,232
El RefugioAzcapotzalco4753616.80194.60557.814369.208856.192,131,316
La Margarita12263616.80195.83557.814370.438856.195,499,534
El PotreroAñil17073436.98167.39557.814162.188904.428,094,980
Progreso9133436.98188.65557.814183.458904.424,310,236
Adolfo López MateosOaxaca16073616.8076.47557.814251.088933.107,524,008
Tres Valles23963436.9886.00557.814080.808933.1011,626,131
Benito JuárezTuxtla Gutiérrez14383436.9879.47557.814074.268781.486,768,982
HuixtlaTapachula12023616.8025.98557.814200.598927.955,682,272
El ModeloXalapa10793436.9829.96528.293995.248816.015,201,617
La Gloria15813436.9829.91528.293995.198816.017,621,725
El CarmenEscamela5773436.9819.79528.293985.078797.402,776,706
La Providencia8113436.9830.11528.293995.388797.403,894,422
San José de Abajo5603436.9833.79528.293999.078797.402,687,057
San Miguelito5253436.9855.60528.294020.878797.402,507,667
San Nicolás11033436.9823.48528.293988.758797.405,303,935
San CristobalTierra Blanca25843436.9828.68528.293993.968773.2812,349,769
San Pedro12733436.9863.21528.294028.498773.286,040,122
CuatotolapamMinatitlán8353436.9844.94528.294010.228623.233,851,868
Santa RosalíaVillahermosa7813436.9827.31528.293992.588733.893,702,960
AzsuremexMérida2233436.98208.10547.354192.448524.41966,030
La Joya8263553.4979.57547.354180.408524.413,588,160
San Rafel Pucté16023553.4974.71547.354175.548524.416,966,908
-Total55,965-----275,198,425
-Average11193352.1166.40519.013937.528874.715,503,968
Publisher’s Note: MDPI stays neutral with regard to jurisdictional claims in published maps and institutional affiliations.

