
The Grey Ten-Element Analysis Method: A Novel Strategic Analysis Tool


1
Geneva School of Economics and Management, University of Geneva, 1211 Geneva, Switzerland
2
Geneva School of Business Administration, University of Applied Sciences Western Switzerland, HES-SO, 1211 Geneva, Switzerland
*
Author to whom correspondence should be addressed.
Mathematics 2022, 10(5), 846; https://0-doi-org.brum.beds.ac.uk/10.3390/math10050846
Submission received: 21 February 2022
/
Revised: 28 February 2022
/
Accepted: 3 March 2022
/
Published: 7 March 2022
(This article belongs to the Special Issue Recent Advances in Applications of Fuzzy Logic and Soft Computing)
Abstract
:In this paper, a new strategic analysis method is introduced, called the ten-element analysis (TEA) method to determine the firm’s strategic position in the market. The new method is grounded on the computation of the reflections of the external factors on the firm’s internal factors through the changes of the values of the internal factors throughout the time when a lack of complete information regarding the environmental factors exists. The TEA method takes ten effective key elements of the firm into account and investigates their changes through a maximum of nine periods and a minimum of two periods. To conduct the model, the paper is mainly focused on four main rubrics, including the detection of the reflection of the firm’s environmental factors on the internal factors, deriving the strategic position of the firm from the reflections, the capability of the existing strategic models in determining the strategic position from the reflections in presence of uncertainty and incomplete information of the external factors. The method is applied to a dairy company in order to find its strategic position in the market. The results showed that the output of the TEA method and SWOT analysis is similar which makes the new method reliable to employ. The TEA method is developed under the grey environment to harness the uncertainty where a new grey comparison method is introduced to compare the grey numbers.
MSC:
91B24; 91B541. Introduction
For a firm to survive in the market, the need for information and resources is increasing due to the alterations in the firms’ external factors and volatility in their activities and the generated uncertainty [1]. Surviving from this chaotic environment, which is woven with the uncertainties, along with taking into account the fact that firms are constantly wrestling with adjusting their internal forces, needs selecting of the most appropriate strategies that also leads to maintaining the firms’ competitive advantages. In fact, the firm’s strategies are the result of strategic planning [2]. It is widely accepted that strategic planning is currently one of the five most employed managerial approaches in contemporary organizations [3,4]. As Bryson [5] and Kools and George [6] defined, “strategic planning is a deliberative, disciplined effort to produce fundamental decisions and actions that shape and guide what an organization (or other entity) is, what it does, and why”. In other words, strategic planning could be defined as a systematic approach for generating strategies with long-term thinking and an efficient strategic decision-making tool [7,8,9].
To achieve the firm’s objectives, the firm needs to assess its current situation. In the case of strategic planning, this process executes by internal and external analysis. As a strategic planning tool, the strength, weakness, opportunity and treat (SWOT) analysis has been widely employed for the decision-making process [10]. The SWOT analysis process takes into two layers of the environment concept account, which have been surrounded by/around the firm called, internal and external layers. The internal layer consists of the firm’s internal variables, such as the internal environment, and the external layer incorporates the firm’s external variables. These different layers contain distinct variables where each variable has a unique effect on the firm’s position in the market. Ultimately, the resultant of these variables and their interactions determine the situation of the company in the market, i.e., the internal and external forces, which are derived from the internal and external dynamic variables that affect the firm’s position in the market in different periods. Strategies ranking and selection of the best strategies, which lead the firm to their long-term and short-term goals are the final products of the SWOT analysis.
As every process that deals with the human decision, perceptions and actions have involved uncertainty, selection of the best strategies, which emanates from experts’ decisions and perceptions, is tangled with uncertainty. In order to make the best decision, managers need to deal with the factors, which are interlaced with ambiguity and can barely be predicted; additionally, they do not have control on those factors. Hence, knowing the behavioral pattern of the market’s factors would help the managers to have more efficient decision-making for the selection of the best strategies based on the strategic position of the firm in the market. On the other hand, the lack of knowledge generated by the uncertainty of the environment has made determining the pattern difficult. Yet, the reflection of the environmental factors could potentially be extracted from the changes in the internal factors of the firm through the years. In this paper, a strategic analysis tool is proposed called the grey ten-element analysis (TEA) method to bring solutions for five questions. In contrast with the conventional analysis tools such as SWOT and SPACE matrices, the TEA method analyzes the internal environment of the firm, without consideration of the external environment, in order to determine the firm’s strategic position. Uncertainty is an integral part of strategic planning, specifically the strategic analysis due to the volatility in the information sources inside and outside of the firms. Hence, in order to formulate the uncertainty of the mentioned process, TEA deals with the grey systems theory which is an effective tool in formulating uncertainty.
The new strategic analysis tool embraces the answers to the following five questions. These questions are fundamentally structured on an assumption that perception and prediction of the market in some periods would be challenging due to the rapid changes in the industries’ environments or lack of precise recognition of the effective elements of the changes. Inexorably, these changes spontaneously make their effects known on the firm’s internal factors which could be detected by the observer.
- Is it possible to track the reflection of the firm’s external environment on its internal environment? There are two forces that affect the firm and also interact. The first force is originated from inside the firm, while the sources of the second are located in the environment that surrounds the firm. Typically, the forces originated from the firm’s environment have a stronger effect on the internal forces; hence, there should be a reflection on the changes of the environmental factors through periods. The aim of this question is to realize a solution for the recognition of these reflections.
- How can these reflections be utilized to arrange a prospect of the strategic position of the firm in the market? A strategic position shapes the strategy that the firm needs to have against the competitors to gain more share of the market(s), conserve its share, or penetrate new markets. Furthermore, the strategic position signifies the strategies that the firm ought to select to reach the aforementioned goals. The strategic position is the output of the evaluation of the firm’s strengths and weaknesses against the opportunities and threats the firm encounters in the market. The purpose of this question is the finding of possibilities for creating an image of the firm’s external environment by observing the changes that happened over time on the firm’s internal factors. Inevitably, this process involves uncertainty, which will be discussed further.
- Are there any strategic analysis models, which cover those reflections to achieve the strategic position? The conventional strategic analysis models, such as the strategic position and action evaluation (SPACE) matrix and SWOT matrix, consider both internal and external factors to conclude what type of strategy a firm should undertake, while, in advance, they have located the firm in one of the four strategic positions, including the aggressive, competitive, conservative, and defensive positions. The aim of this question is to reach a solution, as a strategic analysis model/tool, which does not consider the external factors while generating the same output.
- How can this solution harness uncertainty? The cognition of the reflections and processing them into one image in order to construct a framework for determining the firm’s strategic position unavoidably deals with uncertainty. To fashion a reliable output, the model needs to employ an appropriate approach to handle the uncertainty of the mentioned process where human decision-making is also involved. In order to offer a reliable product, the intention of this question is to conduct the model to run by the systems that formulate the uncertainty of the processes.
- Is the model reliable? Ultimately, the reliability of a strategic analysis model/tool could be extracted from the results of implementing of the strategies in terms of achieving long-term and the short-term goals, nevertheless, the result of the method could be compared with other accepted existing methods to investigate its reliability.
The rest of this paper is composed as follows: the second section is devoted to literature review; in the third section, grey systems theory and its theoretical background is discussed. The new strategic analysis tool and a new grey comparison method is introduced in the fourth section. The TEA method was applied to a real-world case in the fifth section; the sixth section is devoted to the discussion, and finally, the seventh section is dedicated to the conclusion and suggestions for future research.
2. Literature Review
This section has been divided into three divisions. The first section is devoted to reviewing strategic analysis concepts and strategic analysis tools. In the second section, the application of the uncertainty in the strategic analysis has been investigated to answer the fourth question, then, the grey systems theory is extensively reviewed.
2.1. Strategic Analysis
In a three to five-year period framework, Uzarski and Broome [11] pictured strategic planning as a set of processes that fashion the firm’s strategies mainly for reaching firms’ short-term and long-term goals. In line with the mentioned definition, Spee and Jarzabkowski [12] argued that strategic planning is constructed on a set of planning activities including goal setting, developing targets and performance indices, and resource allocation. The strategic management process is usually recognized as a frame in which strategic decisions are in line with the understanding and prediction of the environment development as an integral part of the strategic analytical phase [13]. The strategic analysis methods are the common tools for performing strategic decision-making. According to Petrou et al. [14], strategic decision-making processes involve the firms’ managers as the decision-makers to make decisions regarding the arrangement and configuration of resources.
Typically, strategic planning comports two main activities, where the first activity is the evaluation of the firms’ internal and external factors, strengths, weaknesses, opportunities, and threats (SWOT), and the second activity focuses on formulating strategic plans [15]. This analytic model is the most popular method used in strategic analysis [16]. SWOT is a structured approach that is architected on the identification of firms’ goals and evaluates the current situation of the firms on the basis of their strengths, weaknesses, opportunities, and threats; the output affects the firms in a positive and negative manner in achieving their goals [17]. The main purpose of the SWOT analysis process is to provide strategies that take the firm’s external and internal factors into consideration [18]. By dint of defining the organization’s mission and vision, the original SWOT analysis initiates with the identification of firms’ internal factors, strengths, and weaknesses, and their environmental factors, opportunities, and threats, where the evaluation of the aforementioned factors is performed in two matrices, the evaluation of the internal factors (IFE) matrix and external factors evaluation (EFE) matrix [19]. Regarding the aforementioned matrices, as the output of SWOT analysis, the strategies that should be considered are classified into four categories [20]: 1—the aggressive strategies or strategies that result from the strengths–opportunities (SO); 2—the competitive strategies which are the output of strengths–threats (ST); 3—the conservative strategies employed with consideration of the firm’s weaknesses–opportunities (WO); and 4—the defensive strategies which are generated from the weaknesses–threats (WT).
As a strategic decision-making tool, SWOT analysis process, in its classic form, prioritizes the strategies though the quantitative strategic planning matrix (QSPM). Yet, due to the fact that SWOT provides only a qualitative analysis that merely ranks the factors’ importance by measuring them quantitatively, it fails to address the priority of the strategies; hence, it is mostly integrated with other decision-making methods, such as multi-criteria decision-making (MCDM) techniques [21,22]. Amongst MCDM methods, the analytic hierarchical process (AHP) is most commonly combined with SWOT. AHP imports the decision problem into a hierarchy structure fashioned with the goal, decision criteria, and alternatives; then, benefiting from the pairwise comparisons, it computes the importance weights of the components of the structure and finally ranks the problems’ alternative. The AHP structure makes it an ideal tool to incorporate with the SWOT analysis process to rank and select the best strategies in various studies. Another application of AHP in the SWOT analysis could be found in [23], where it is employed to assess and prioritize the effective factors on the diffusion and implementation of the biorefinery concept in the European PPI. Haque et al. [24] used a combined model of SWOT and AHP to identify the barriers and opportunities for electricity trading for Bangladesh, focusing on the stakeholders’ perceptions. By using a combined model of SWOT, AHP, and fuzzy technique for order of preference by similarity to ideal solution (TOPSIS), Papapostolou et al. [25] focused on decreasing greenhouse gas emissions by the consolidation of renewable energy.
In the SWOT analysis, experts have the responsibility to monitor the firm’s internal and external environment, then, SWOT composes their opinions and interpretation along with statistical reports into the IFE and EFE matrices, while some strategic analysis tools offer their unique variables and measurement approaches for the analysis of the environment, such as the SPACE matrix. The SPACE matrix is designed based on the four dimensions, which embrace the firm’s internal and external environments. The internal dimensions embrace the financial strength and competitive advantage which are the major indicators for the organization’s strategic position; on the other hand, the external dimensions, which contain the environmental stability and industry strength, characterize the strategic position of the entire industry [26]. SPACE matrix is not as popular as SWOT; however, it has been employed in the literature as an analytical tool in different industries, such as tourism and leisure [27,28,29], manufacturing [30,31], biotechnology [31]; and British professional soccer [32].
In general, the external environment includes two separate layers, called “the macro environment” and “the microenvironment”, which are also called “far” and “near” environments, correspondingly. In recent years, various methods have been used to analyze the external environment of the company. The most used tool to give a diaphanous image of macro environment is the PEST analysis, where P, E, S, and T stand for political, economic, social, and technical analysis, respectively. Barbara et al. [33] used PEST analysis to update the main political, legislative, economic, social, demographic, technological, and environmental changes that affect the insurance industry in the European market. Alava et al. [34] proposed a new form of PEST analysis constructed on the neutrosophic cognitive maps static analysis for the food industry. Gong et al. [35] investigated China’s geothermal energy industry exercising an integrated model of SWOT-PEST analysis. The following list shows the extensions of the PEST analysis and their additional factors [36].
- STEEPV analysis, which includes political, economic, social, technical, environmental, and value analysis [40].
- SPENT analysis, which is established based on political, economic, social, technical, and natural environment analysis.
- STEEPLE analysis [41]; this tool analyzes political, economic, social, technical, environmental, and ethics factors.
The conventional strategic analysis tools, such as SWOT and SPACE, cover both internal and external factors. SWOT relies on the experts’ knowledge about the firm’s internal and external environments’ effective factors on the firm’s position in the market. In addition to involving human decision-making in the process, which inevitably adds uncertainty, the level of their knowledge is another problem that emerges during the process which causes the output to not be reliable. Thus, in order to improve the results some scholars tried to integrate SWOT with PEST analysis to analyze the external environment [42,43,44] or merged it with MCDM methods. PESTEL itself is not a comprehensive method; hence, it has been extended to other versions to cover the mentioned lack. On the other hand, SPACE matrix, specifically, provides factors for investigation of both internal and external environments, while it suffers from the lack of a holistic view to embrace all internal and external factors where it arises as critical in the chaotic environment. Thus, there is no specific method to provide and formulate the reflections of the environmental factors on the internal factors. Consequently, the aforementioned methods are not able to extract the firm’s strategic position in order to provide appropriate strategies.
2.2. Uncertainty and Strategic Analysis
Strategic analysis deals with the uncertainty since the process needs to determine the results of interactions between internal and external dynamic factors. The rapid changes in the environmental factors, especially in this COVID-19 era, have emerged as the intense uncertainty, which has made the prediction the market factor trends severely difficult and impacted the decision-making on the selection of the most appropriate strategies. As Knight [45] implied, uncertainty is the incapability to predict the possibility of events occurring. Smales [46] brought up the following question: “why does uncertainty have such a significant economic impact?” Then, he replied that the explanation may be found at the microlevel where uncertainty is shown to have a deep impact on decision-making, see also [47,48,49,50].
Fuzzy set theory [51] was primarily developed to formulate imprecise information in order to make it a logical conclusion for any decision-making problem, in which the imprecise linguistic terms, such as poor, high, good, low, etc., are translated into numeric values using fuzzy membership functions [52]. In addition, modeling imprecise concepts in fuzzy sets performs through allocating a membership degree to the elements of the set [53].
Grey systems theory was developed by Deng [54]. The grey information refers to the partial knowledge and incomplete information, which is located among two other colors, white and black, which are referred to as the complete and known information, and the unknown information [55,56]. Grey numbers and fuzzy numbers share the same root, yet the fundamental difference comes from the grey number where its precise value is unknown but the intervals at which it is located are known [57].
To overcome the uncertainty that appears during the strategic analysis process, former studies employed fuzzy logic and grey systems theory in the strategic analysis procedures, especially in SWOT. Yet, the application of different fuzzy sets extensions, e.g., the intuitionistic fuzzy sets, could be widely found in various works to furnish the mathematical platforms for dealing with uncertainty in strategic decision-making and strategic analysis. The recent applications of the intuitionistic fuzzy sets are addressed in [58,59,60,61,62]. The application of the grey systems theory on SWOT analysis could also be found in [19,63,64]. In contrast to the grey systems theory, fuzzy logic has been widely used for SWOT analysis [65,66,67,68,69,70], especially, in the integration of the SWOT with MCDM methods [71,72,73]. To calculate the reflections, linear changes between two different times must be taken into account. Therefore, a method needs to embrace this need and also benefits from the advantages of each uncertainty formulation methods.
3. Materials and Methods
As mentioned earlier, the TEA method is fundamentally fabricated around the uncertainty of information since the inputs stem from the complete information regarding the firm’s external factors; hence, the method is developed under the grey environment and uses grey systems theory operations to deal with the uncertainty. In this section, in addition to discussing the grey systems theory, a novel method is proposed to compare the grey numbers.
3.1. Grey Systems Theory Background
To handle the uncertainty, the TEA method mainly deals with the grey systems theory. In this section, the grey systems theory, the grey numbers, and the grey operations are discussed. We also discuss the difference between a grey number and a fuzzy number in this section.
Grey systems theory is developed to deal with the complexities of and to formulate the uncertainty levels associated with every type of natural and artificial system and sub-systems [74]. It is a channel that materializes incomplete information into discrete data as Karimi and Hojati [75] argued.
When a decision model comprises grey elements, it results in a grey decision [76]. The grey systems theory and its branches have been applied extensively in various decision-making problems [77,78,79,80,81,82].
Grey systems theory and grey operations have been established on the grey numbers which play a pivotal role in the application and development of the grey-based models [83]. Grey numbers stand for numbers that are not crisp and carries some incomplete information yet bounded between two crisp values which demonstrate complete information [84]. The definition of a grey number has been provided as follows (Darvishi et al., 2019): An interval grey number is a number that is surrounded by two crisp upper and lower boundaries, but its position within the boundaries is not clear. Mathematically, an interval grey number is represented as where is a grey number, shows the information, and are the lower and upper boundaries, while [85].
With proposing the concept of general grey numbers, Jiang et al. [86] stated three main methods to deal with interval grey numbers:
- Decompose the sequence of the interval grey number into two parts using information decomposition—one is the “white part sequence”, and the other is the “grey part sequence”, and then the decision-making model is constructed.
- Transform the interval grey number into a grey belt and grey layer by means of geometric coordinates.
- Whiten the interval grey number with the help of “kernel” and “degree of greyness”, and then propose various types of grey models based on “grey number attribute”.
The following equations address the grey number operations [87]:
If and , then:
The possibility degree of :
where
As debated before, fuzzy sets and grey systems are two main players for formulating problems that deal with uncertainty. The grey numbers are similar to fuzzy numbers, however, there is a fundamental difference. The grey numbers do not offer the exact value of the number while it presents an interval in which two lower and upper bounds are certain and the number’s value is floating between these two bounds. On the other hand, fuzzy numbers give an interval as well, while, in contrast to the grey numbers, the upper and lower bounds are not certain in the fuzzy numbers, and they follow the membership functions. This arises as an advantage for the grey numbers in the formulation and calculation process. It also gives more flexibility to put the information with different contexture in an interval with two certain bounds. In our case, the analysis is based on yearly/monthly information with two certain pieces of information which makes grey numbers, with two certain intervals, perfect to exercise.
3.2. Grey Multiple Triangles Comparing Method
In many situations, when the purpose is the ranking of the generated grey intervals, the products of a grey-based algorithm need to be compared, especially when there are common intervals. There are different approaches to comparing/ranking the outputs of grey-based methods. Darvishi et al. [88] reviewed the approaches employed to compare the grey numbers such as the Moore’s approach [89], Ishibuchi and Tanaka’s approach [90], Hu and Wang’s approach [91], kernel and degree of greyness of grey numbers approach [92], grey possibility degree [92], and Xie and Liu’s approach [93].
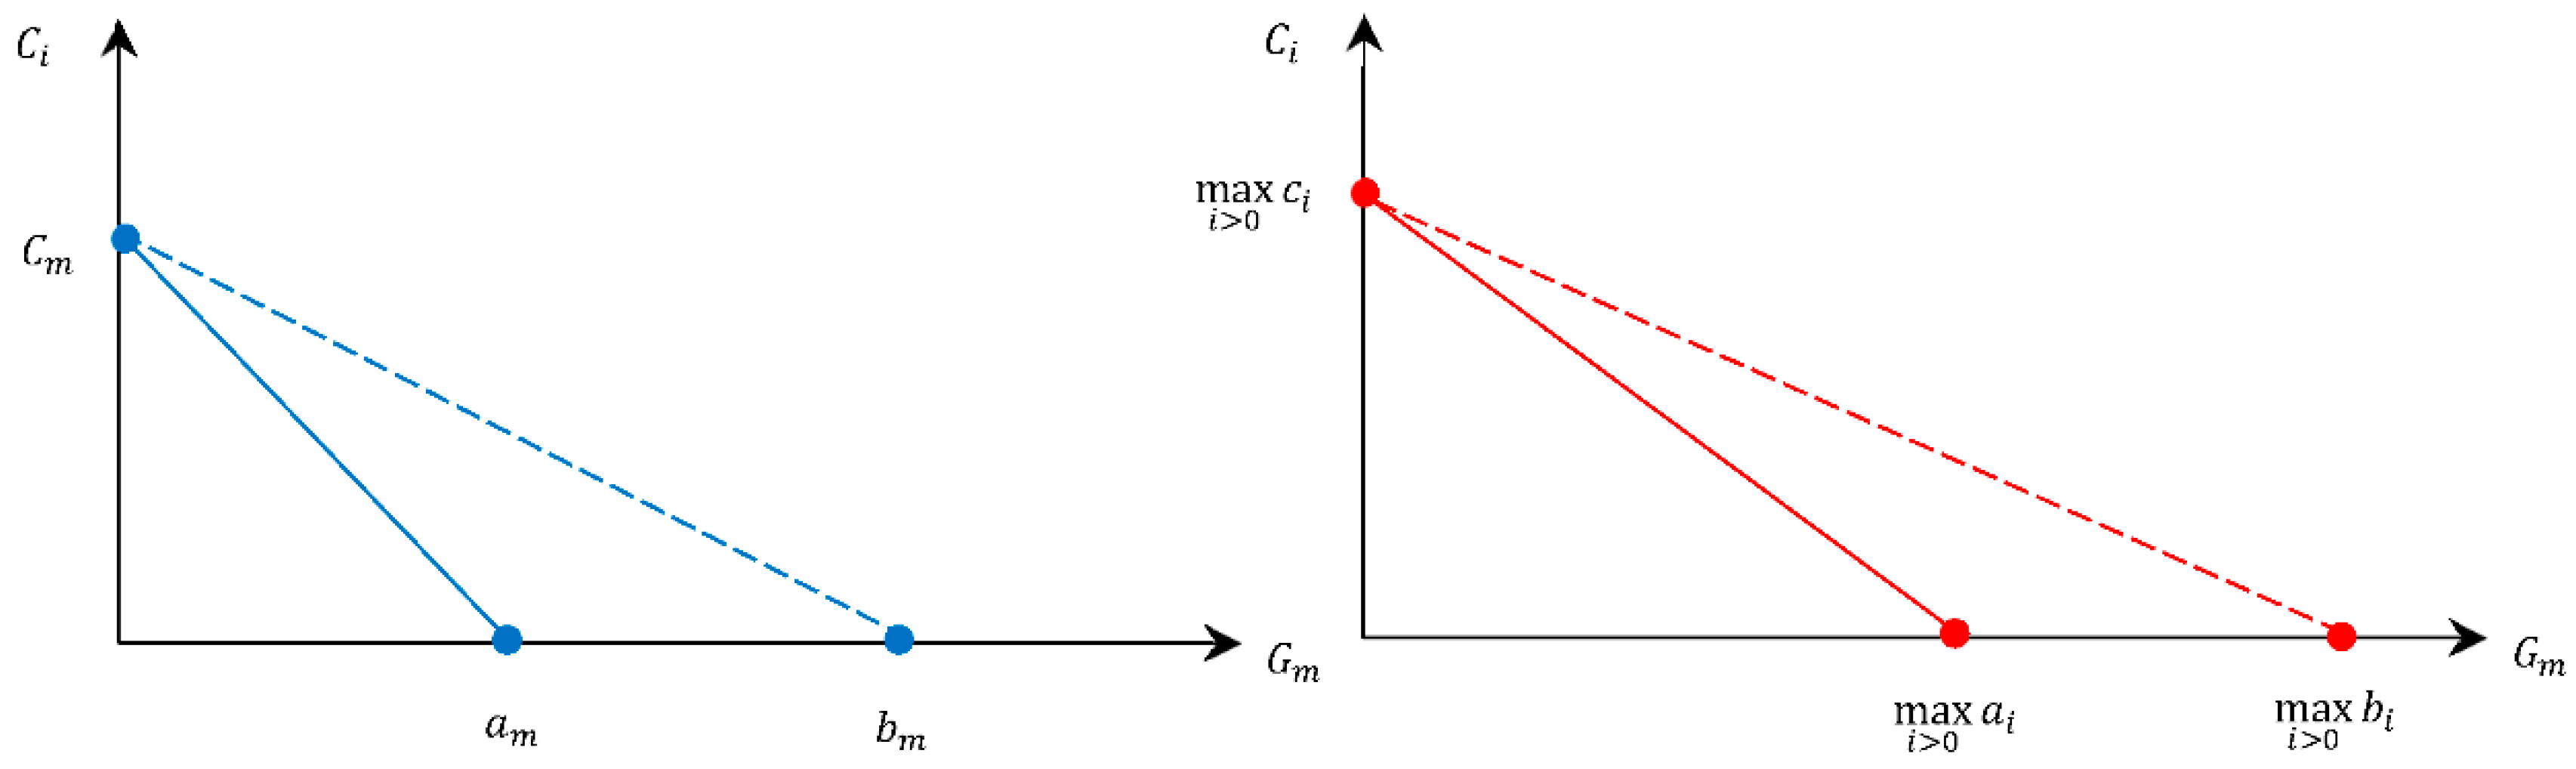
In this paper, a new comparative grey numbers model is proposed called grey multiple triangles method (G-MUTRICM) in order to compare grey numbers in a simple way. The new method is based on the computation of areas of the triangles that each bound creates with the center of the interval. If stands for the center of the interval (Equation (19)), then, Equations (17) and (18) demonstrate the G-MUTRIM process.
then
where
The higher value of shows the higher ranking compared with other grey numbers (Equation (18)). The triangles that a grey number’s bounds makes with its center compared with its max interval has been portrayed in Figure 1 where .
4. Methodology
The ten-element analysis (TEA) method is introduced to determine the strategic position of the firm based on the analysis of the company’s internal activities/factors. The TEA method evaluates ten key-factors of the firm involving human resources, marketing and advertising, public relations and branding, the firm’s technology, the firm’s operations/processes, information technology, its logistic and supply chain, company’s products and services, its finance, and the firm’s infrastructures at the current time. The TEA method’s output determines the company’s situation in the market without considering the external elements of the industry. Similar to other strategic analysis methods, the TEA method’s product places firms in four states, i.e., aggressive, competitive, conservative, and defensive, thus, managers can designate and select strategies with respect to each status.
This section is subdivided into two sections. The first section discusses the TEA method as a new strategic analysis tool and its algorithm. In the second section, the grey multiple triangles comparing method is presented as a novel method that facilities the comparison between two grey numbers.
The Ten-Element Analysis (TEA) Method
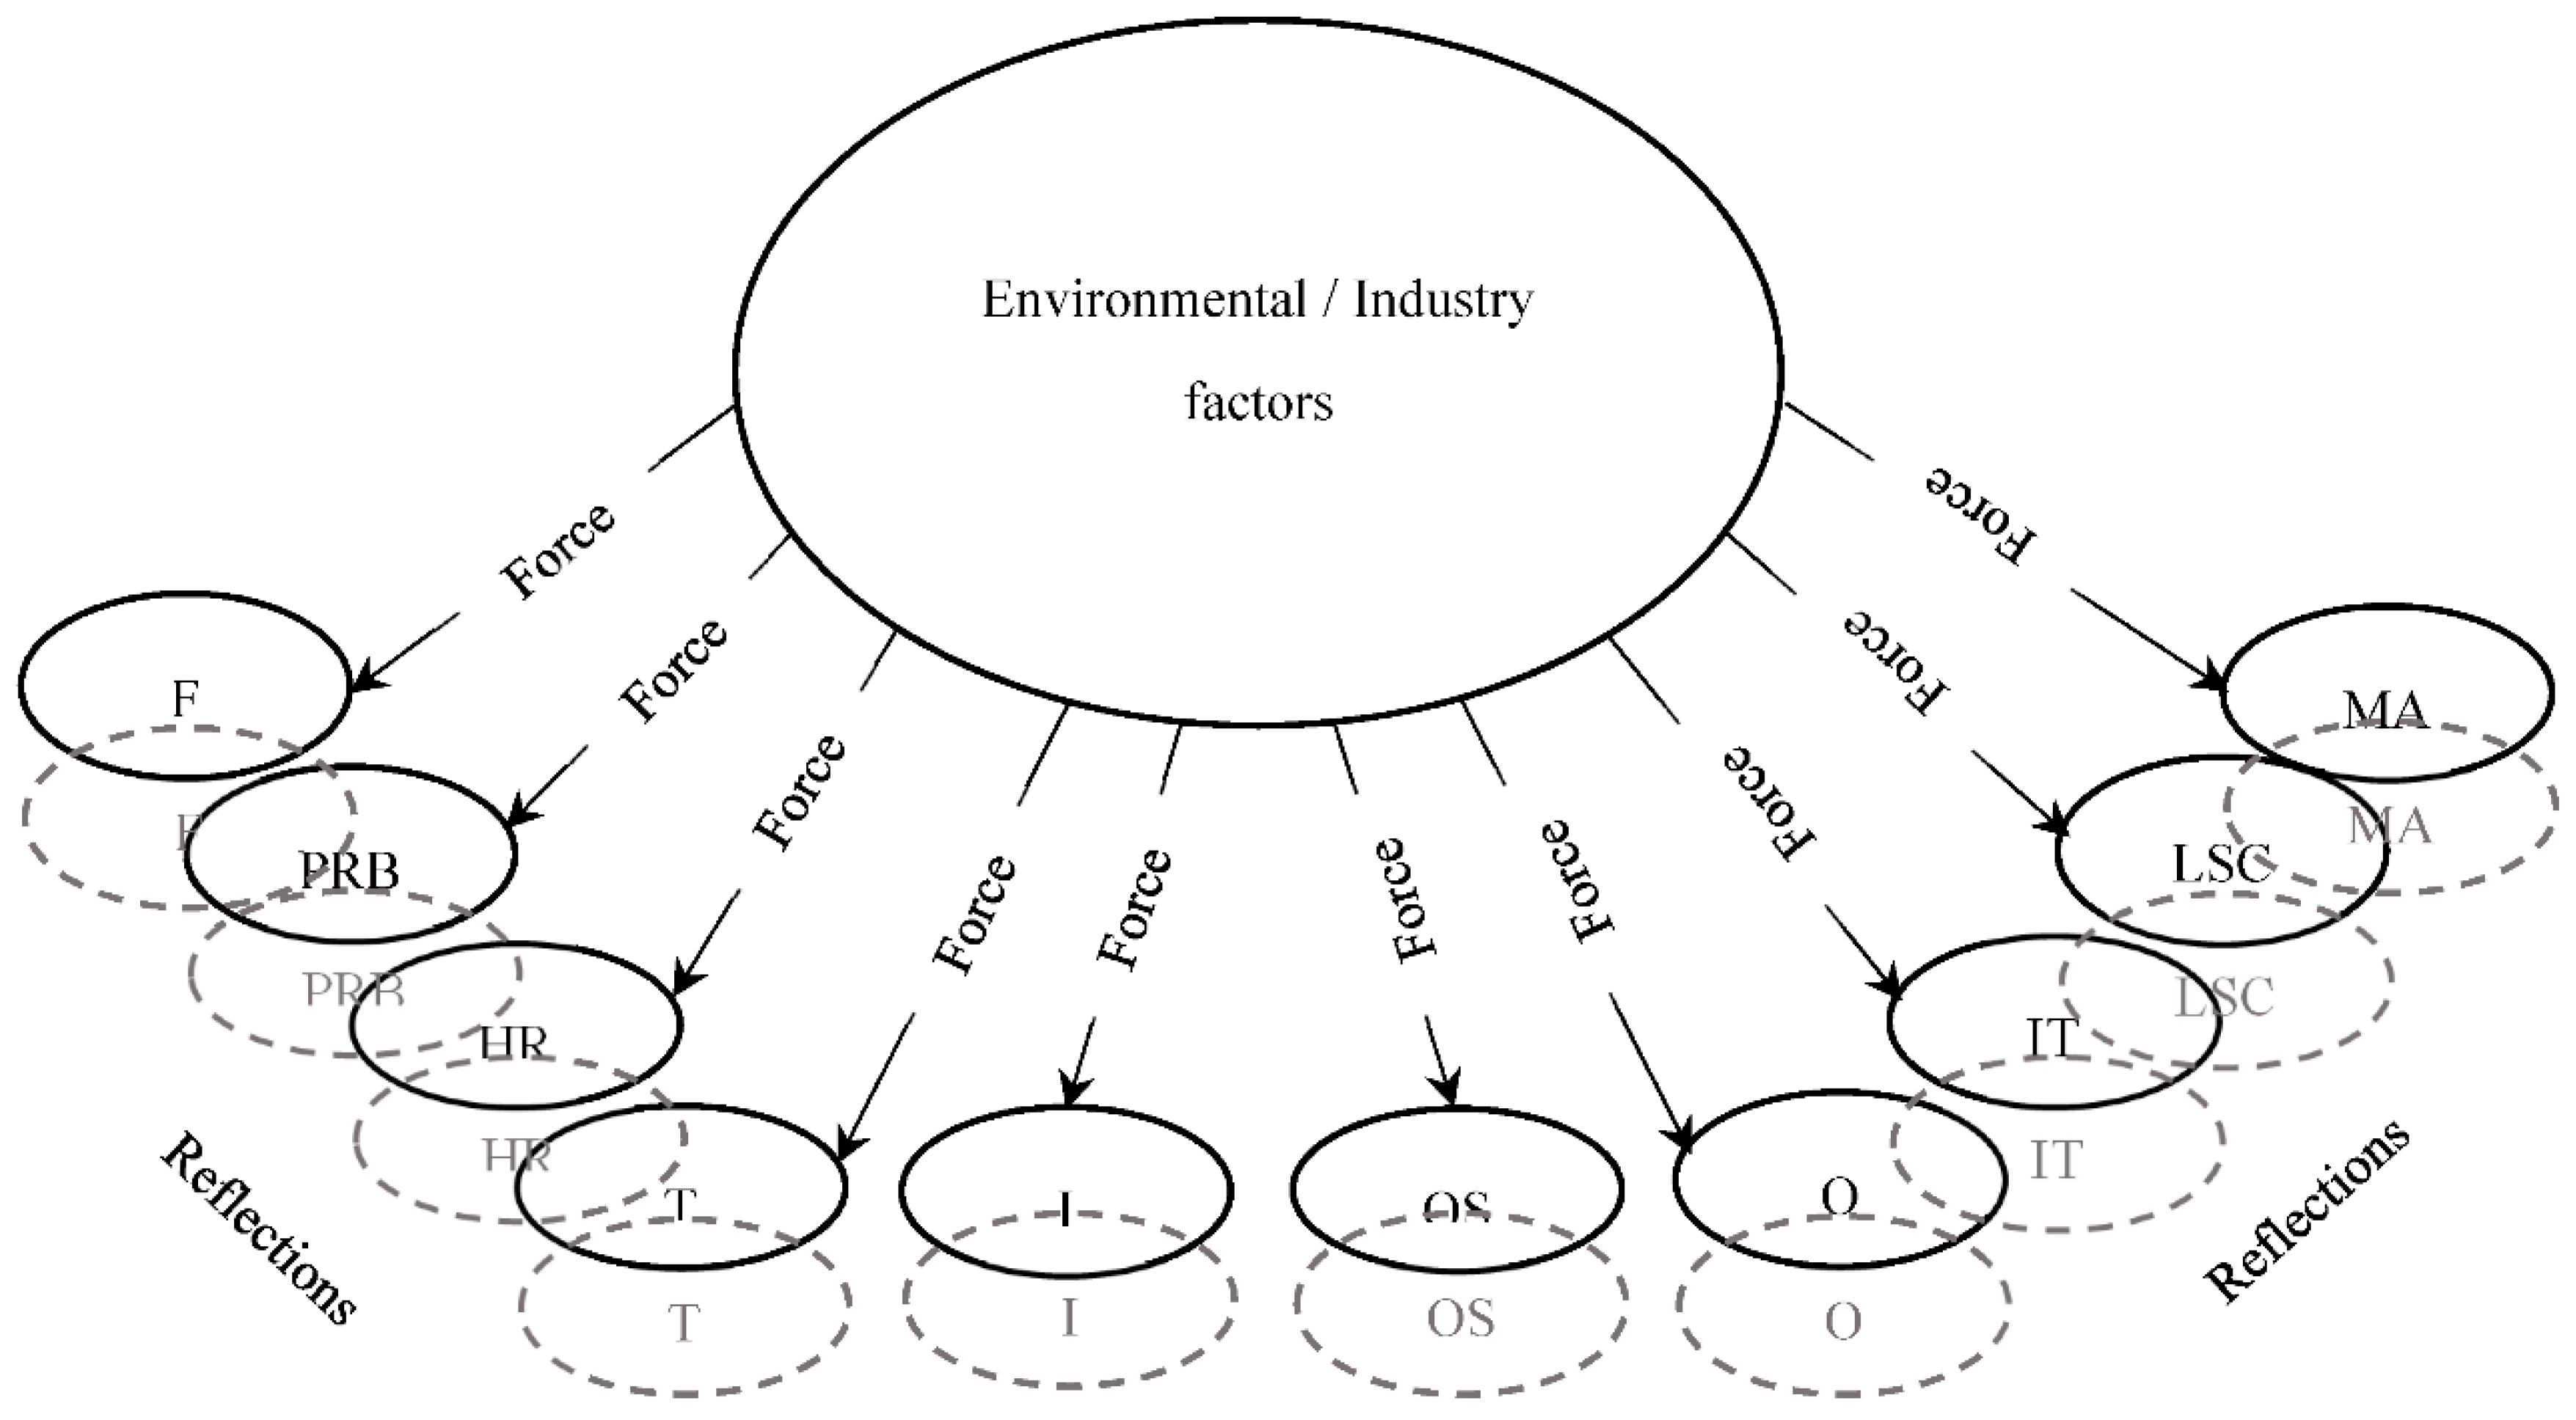
The foundation of the TEA method is the company’s internal factors’ trends of more than two years or two periods. The TEA method’s philosophy is that the overall score of the company’s internal factors is the reflection of the external environment. Assuming each year as a distinct mirror that reflects the outside’s circumstances, the TEA method compares the reflections, then offers the company’s real-time situation in the market. The reflections are made by the firm’s external factors’ forces. The schematic process of reflections is portrayed in Figure 2.
The “time” is considered as a flexible variable that alters due to the industry’s behavioral pattern, which is in line with the yearly or monthly analysis. The TEA method takes times into account as a set of consecutive numbers with a difference of “1”, e.g., the second year, the third year, and the fourth year, not jumping from the second year to the fourth year, etc. Time can be selected from the second year to the th year where (); thus, the maximum periods that can be considered in the method are nine periods of time prior to the current time. The brand evaluation is considered in the “PR and branding” section where its value has a double value of the finance element since the TEA method is a brand-focused method. In the new method, the finance element has a double value of the largest value of remain elements.
In this paper, the fourth represented question is trying to find the most well-fit approach to formulate the uncertainty of the proposed method. In spite of the fact that grey systems theory has been exercised less than the fuzzy logic in the SWOT applications based on the literature reviewing, the grey systems theory is employed to achieve the fourth question’s goal in accordance with the advantages and the characteristic it possesses, which makes it an ideal tool for the TEA method analysis [94,95,96]. In order to find the firm’s strategic position in the market and determining the best strategies, the TEA method calculates the reflection of the environmental factors based on the changes of the firm’s internal factors over time. This creates another level of uncertainty alongside the human involved decision-making processes. Moreover, the method needs a linear interval with the two boundaries to embrace the variables’ values at different times. To harness the uncertainty of the aforementioned levels, the TEA method employs the grey systems theory, which is an appropriate tool to formulate the uncertainty and handle the vagueness generated during the decision-making process. The following steps demonstrate the TEA method’s algorithm where HR, MA, PRB, T, O, IT, LSC, OS, F, and I stand for the company’s human resources, marketing and advertising, public relations and branding, technology, operations, information technology, logistic and supply chain, products and services, finance, and infrastructures.
Step 1—Computing the overall score of the main elements. In the algorithm where , and each element comprises sub-elements that are expressed as () where , and () stands for the corresponding value for the th sub-element of the th main element, therefore:
where
The coefficient of F and PRB in calculating and could be altered in accordance with the experts’ decisions or the firm’s corporate strategy. In the equations, () represents overall score of the th main element, () stands for the importance weight of each sub-element, () represents the score of each sub-element, and () displays importance weight of the th main element where (0, ).
Step 2—Computing the firm’s internal analysis score in accordance with the time intervals. The company’s internal analysis score in the th period is consistent with the following equation where and . The () sign implies the previous period times.
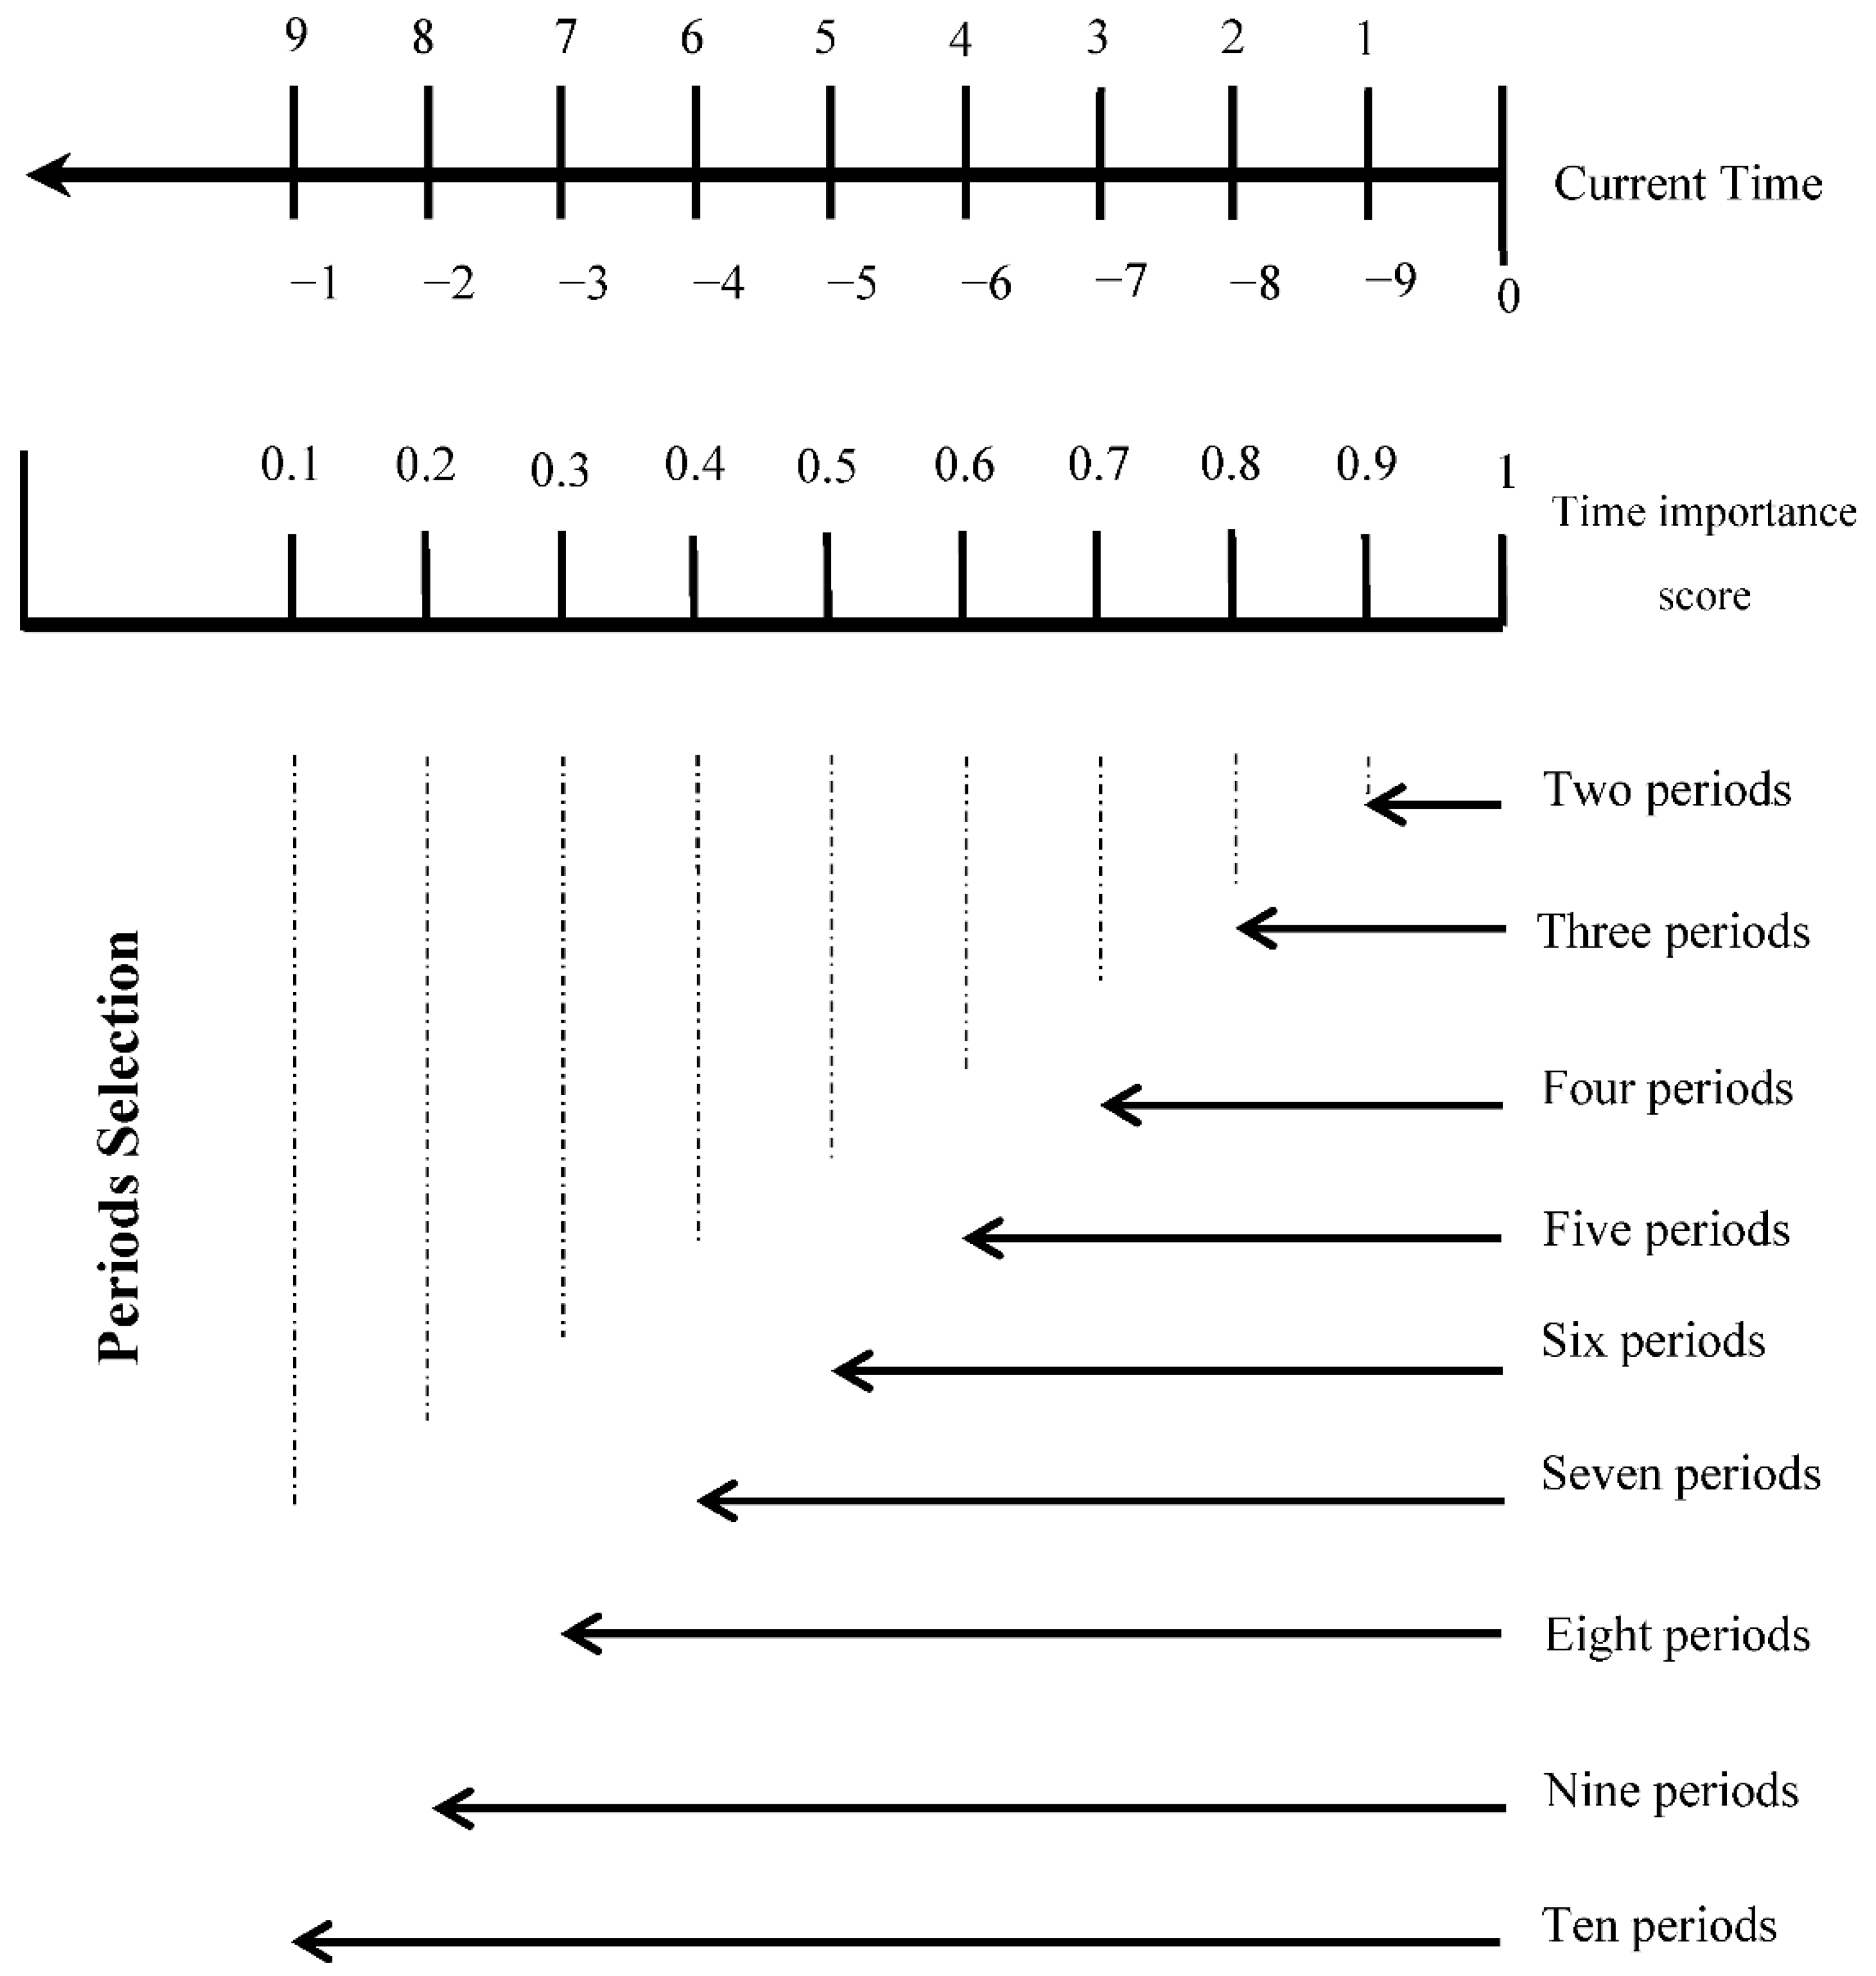
where () exhibits the importance score of the th period where , and () is the time importance weight based on the decision maker(s)’ decision(s) where (). Hence, (0.1) is assigned to the first selected period and is held as its importance score, and the period before the current time possesses the maximum score (0.9), while the importance score of the current time is (1). The following pattern (Figure 3) shows how to select the periods in the TEA method.
Step 3—Determining the firm’s strategic position. To determine the company’s situation in the market and select the best strategies in accordance with its situation, the following equations were employed, where () is the company’s internal analysis score at the current time, and () is the grade of the trend.
Therefore if
- then, the company is in the aggressive zone.
- then, the company is playing in the competitive arena.
- then, the company needs to choose conservative strategies.
- then, the company must select defensive strategies.
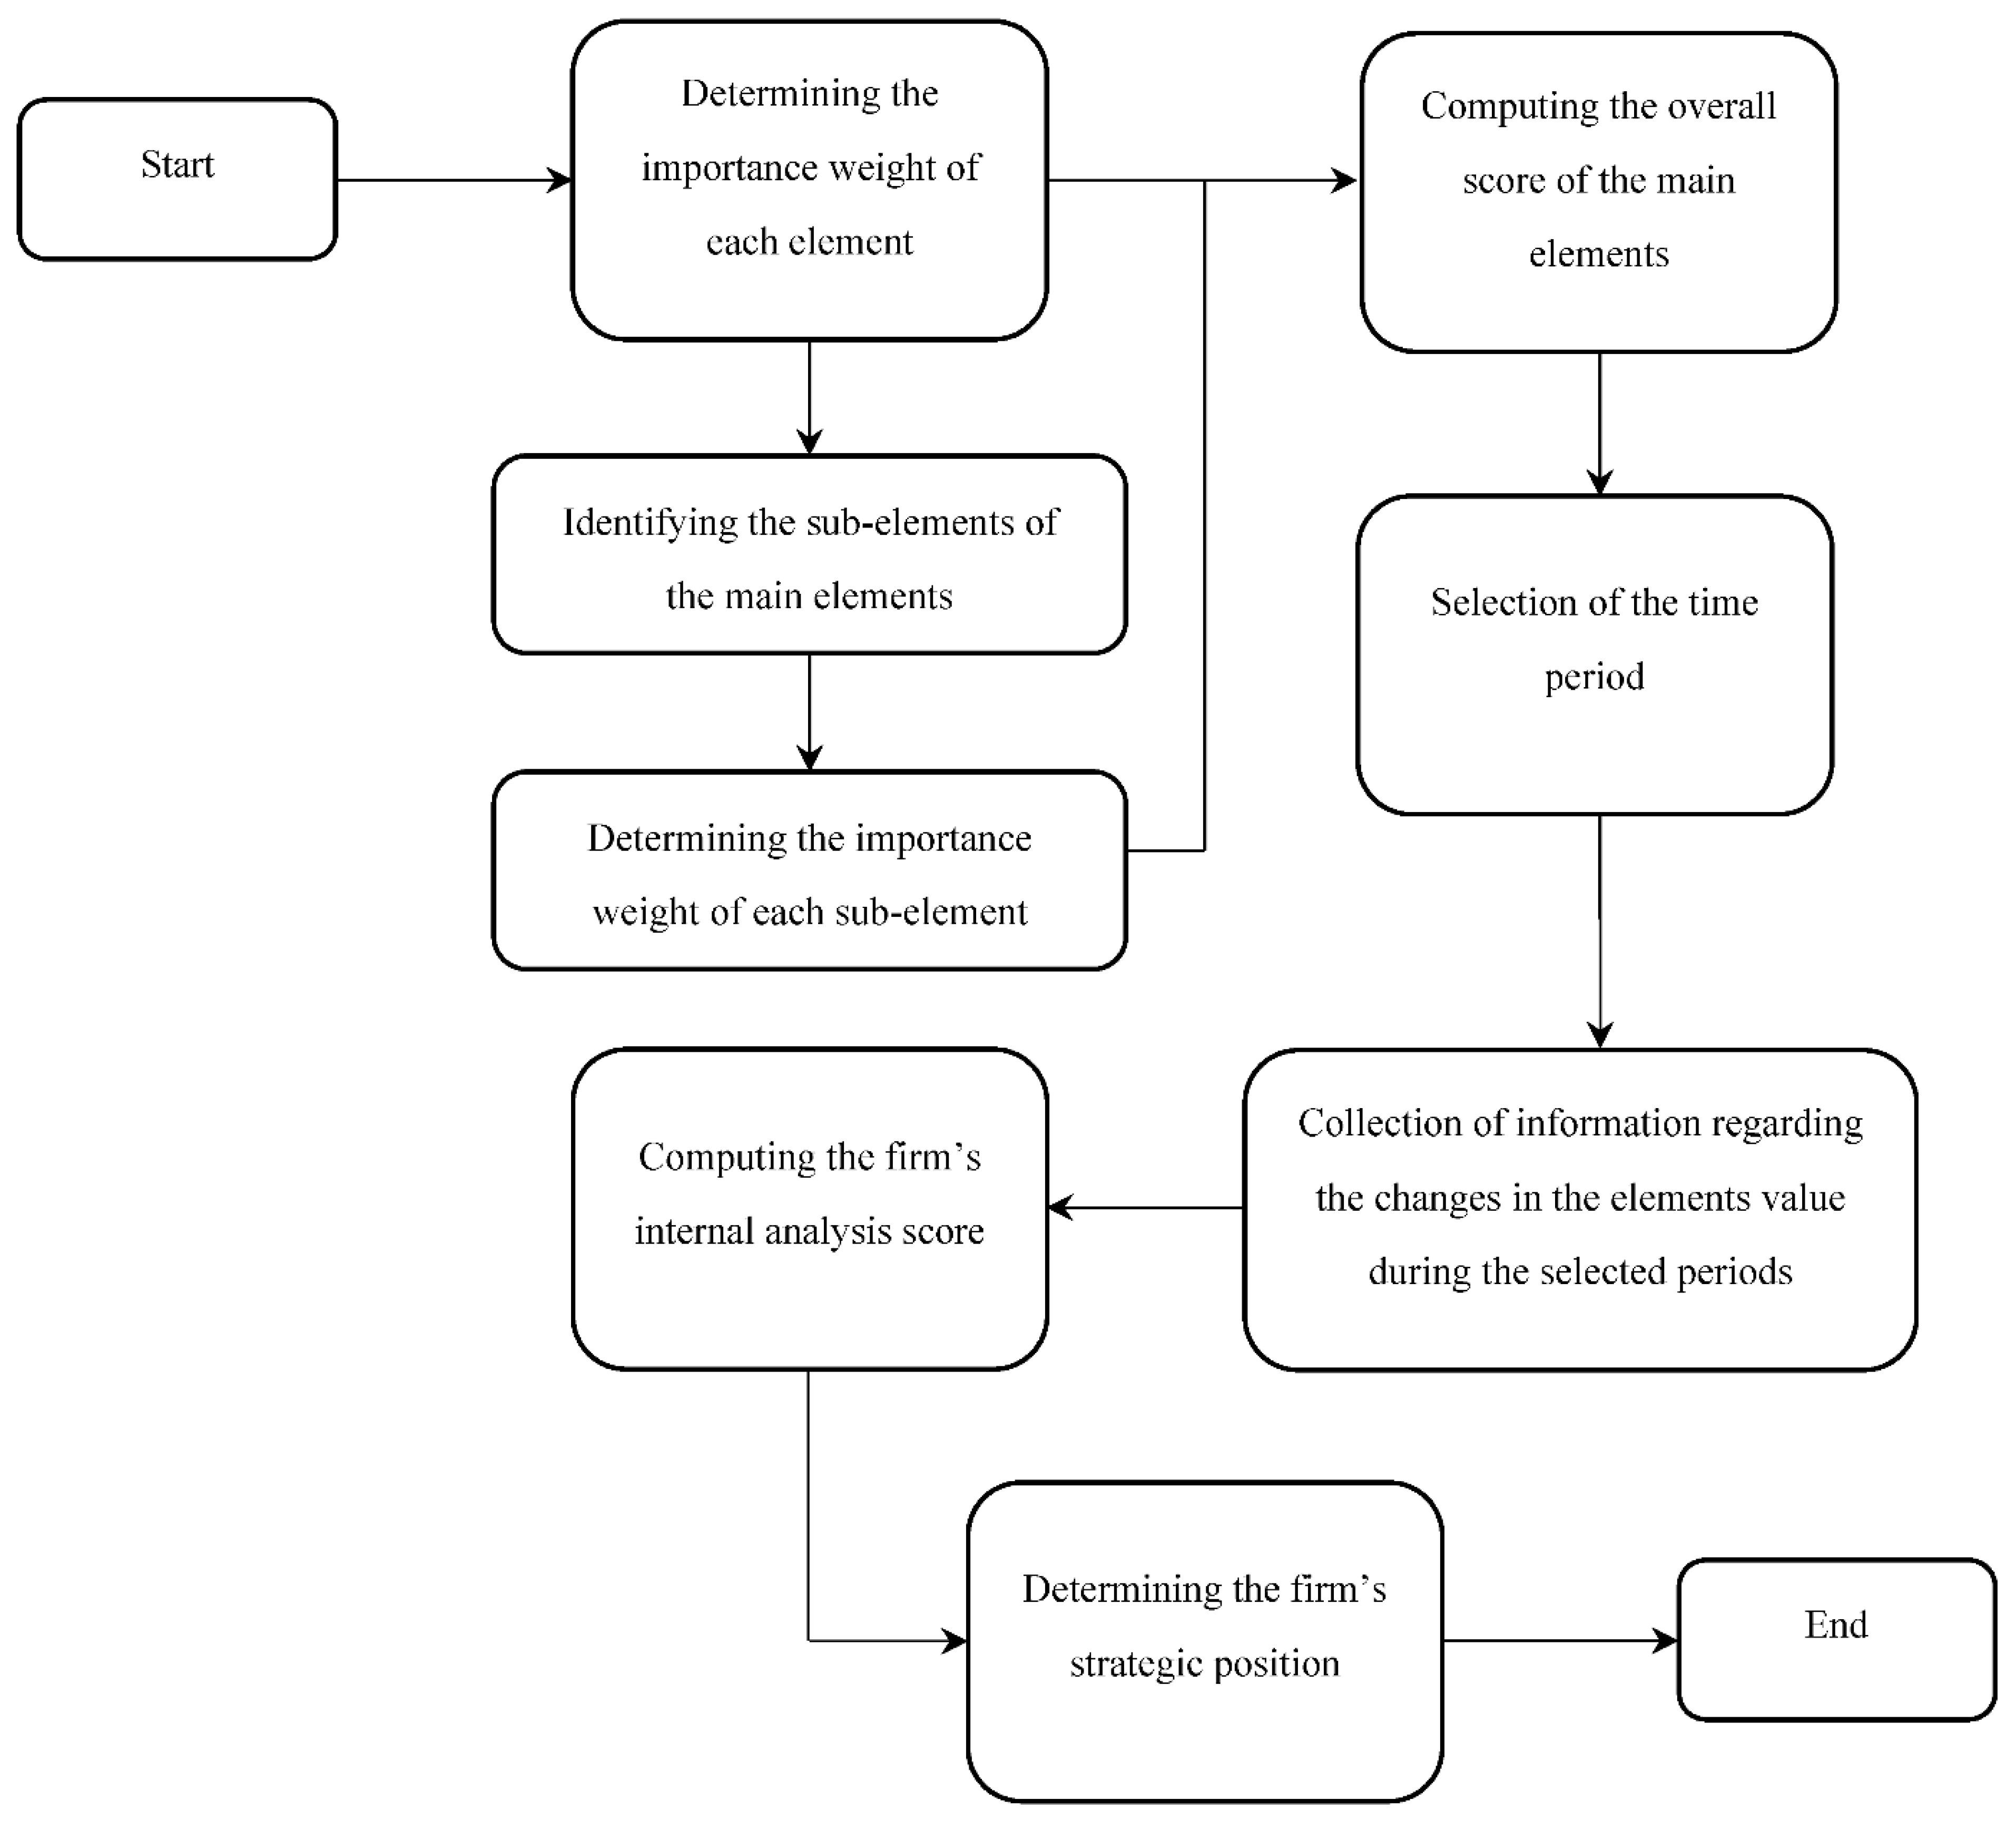
The TEA method implementation process for determining the firm’s strategic position is demonstrated in Figure 4.
5. Application and Results
To evaluate the adaptability and applicability of the method, and also to assess it in terms of determining the firm’s strategic position, the TEA method is applied to a real-world case, adopted from Zakeri et al.’s [19] study, where the information was accessible for the authors. This section is constructed on the three sub-sections containing (1) as the first section, case background discussing information regarding the dairy company, the process of the collection data, and the decision-makers; (2) the TEA method application; and (3) the result.
5.1. The Case Backgrounds
The dairy company is located in Iran and the aim is to determine its strategic position in the domestic market. In accordance with Zakeri et al.’s [19] study, the current status of the firm has been addressed as a competitive position. According to the study, the firm’s internal factors are listed as the high quality of products, usage of high-quality raw materials, innovation and variety, fiscal discipline (revenues, expenses and obligations), flexible production as the strengths’ indicators, and market research, branding, ERP software, and distribution as the firm’s weak points.
In accordance with the information obtained from the firm and according to the framework used by the TEA method, the following table displays the information we need to run the TEA method. In the table, in the HR: recruitment/laying off section, “+” and “−” stand for recruitment and laying off, respectively, and the information is provided based on the last year’s results comparison; in the T section, production lines’ flexibility represents the make-to-order capability of the lines; and in the I section, “the numbers of factories” includes the third parties the company employed for outsourcing production.
To cover the entire ten elements, the scoring process has been performed by the firm’s experts including the chief executive officer, chief financial officer, marketing and sales manager, HR and strategic director, logistic and transportation manager, production and engineering director, and the IT director. The data collection has been collected by direct interview and filling in of a questionnaire.
5.2. Application
The TEA method’s process, variables, and results are represented in Table 3. In the process, there are two added values named benefit and cost. These values address the contexture of the sub-elements. When a sub-element is categorized as the benefit sub-element, its higher value is favorable; on the other hand, if the sub-element is classified as the cost sub-element, its lower value is favorable.
In order to analyze the matrix, all sub-elements’ values ought to be positive; then, to transform the cost sub-elements to benefits, their opposite linguist scale is used. The benefit and cost sub-elements are shown as “+” and “−“ correspondingly in Table 3.
5.3. Results
In accordance with Equations (13) and (14), to compute the and , needs be computed first. To determine , G-MUTRICM is employed (Equations (17)–(19)). The results of the aforementioned process are stated in Table 4.
With respect to Equation (15), the internal analysis of the firm in three periods is represented in Table 5.
By following Equation (15), the grade of trends is [0.46152, 0.50336], where is [7.951, 8.976].
where
Based on the obtained results and also using G-MUTRICM (Equations (17)–(19)), the next step is determining the firm’s position in the market where:
Therefore, the strategic position of the firm is narrowly the competitive position, where .
6. Discussion
Structurally, the TEA method is performed with a more complex process than the SPACE matrix. Furthermore, it deals with higher levels of uncertainty through the process and the final product is woven with uncertainty as well, due to using reflections to determine the fluctuations of the firm’s environment. On the other hand, to determine the firm’s position in the market, SWOT deals with a longer process compared with the TEA method due to the consideration of external factors in its process. Gathering information is more precise in the TEA method in order to find the changes, and also taking time into consideration, makes the TEA method process more complex in order to generate the final result. Yet, when there is a higher uncertainty than the natural uncertainty in the firm’s environment and information is also difficult to obtain, employing the TEA method gives managers a pattern to determine the current situation.
In this paper, we have brought up five questions. Through reviewing the literature, we did not find any model that answers the represented questions. Hence, to answer these questions, a new strategic tool was designed called the ten-element analysis (abbreviated to TEA) method, which is executed under the grey environment.
In answering the first question, “is it possible to track the reflection of the firm’s external environment on its internal environment?”, the TEA method’s process initiates with recording the information of ten basic dimensions of each firm including the human resources, marketing and advertising, public relations and branding, technology, operations/processes, information technology, logistic and supply chain, products and services, finance, and the firm’s infrastructures. The TEA method finds the changes through ten periods compared with the current information of the firm. The changes illustrate the forces from the opportunities and stem from the firm’s environment which compelled the firm to change these key-elements through the period to overcome the environment’s threats or strengthen the opportunities in the environment. To apply the new method on the dairy company case, 27 sub-factors were extracted including recruitment/laying off, budget, social network engagement, number of events, budget, flexibility, human errors, agility, complexity, budget for BPR, number of clients, implementation of ERP, transportation, automation, number of dairy suppliers, quality of the raw materials, portfolio size, product SKUS, quality of the products, operating profit, business units, number of distribution centers, production lines, numbers of factories.
The second question has concentrated on the utilization of the changes in order to determine the firm’s strategic position. According to Equation (16), the TEA method made use of the results that were obtained from the comparisons of the changes of the 27 aforementioned sub-factors and determined the dairy company’s strategic position. Those changes reveal how the firm dealt with the opportunities and threats of the environment in the strategic position where it stands. Therefore, the obtained results from Equation (16) conduces the observer to determine the firm’s strategic position.
The third question focuses on existing strategic analysis methods. In general, strategic analysis tools take internal and external factors into consideration to determine the firm’s strategic position in the market. Based on the literature reviewing process, using the reflection of the external factors on the internal factors to specify the strategic position is a novel approach.
The fourth question regards uncertainty and how the proposed method deals with it. There are four types of uncertainty that the TEA method ought to deal with them. The first one includes the uncertainty generated during/by gathering information to import into the algorithm; this type of uncertainty is mainly produced because of the possible lack of expertise in gathering information and also exercising wrong models and methods for extracting data mainly from past records. The second type of uncertainty stems from the human perception and interpretation of some factors, which are stated as the linguistic variables; to a large extent, this uncertainty emerges when a human is struggling with the lack of knowledge, incomplete information, and available noisy information. The third type arises from the possible changes of variables through the periods which are not accessible. The final type is uncertainty in the nature of the information that is used in the TEA method. Due to the fact that the obtained data during a period are merged and they are not used as discrete data, they are naturally uncertain. Thus, the model is executed in the grey environment due to the advantages the grey systems theory possesses rather than other theories in dealing with the information uncertainty types that were discussed earlier. Moreover, it enables the model to utilize data in an interval form, e.g., the values of a variable in the beginning and end of an accounting year (the value of the beginning, the value of the ending), in order to cover all possible changes through the accounting period. During the implementation of the TEA method to determine the dairy company’s strategic position in the domestic market, all grey intervals followed the aforesaid order and have been stated as “the value of the beginning, the value of the ending” in three accounting years.
The fifth question strives to assess the reliability of the proposed model. The answer to this question is vital due to the structure of the algorithm used by the TEA method, which does not take the external factors into account. Therefore, to show the reliability of the proposed method, comparing the output of the TEA method with the output obtained from the existing methods could be a potential solution. As Zakeri et al. [19] determined in their study, the dairy company’s position is competitive. Our proposed method also determined that the company’s strategic position is competitive. However, due to the fact that the TEA method process’ basis is architected on the external factors’ reflections, to obtain more accurate results, the number of periods should be closer to the nine periods, as predicted in the TEA method. Furthermore, the discussed uncertainty resources need to be as limited as possible.
7. Conclusions and Future Research
In this paper, a new strategic analysis tool is introduced called the ten-element analysis method. It is implemented under the grey environment. The new method takes the reflection of the firm’s external factors on the internal factors to derive the firm’s strategic position in the market. The TEA method embraces ten key elements of a firm and their changes through at least two periods and maximum of nine periods, which make a clear pattern to determine the reflection of the external forces.
In contrast with the conventional strategic analysis methods, such as SWOT analysis and SPACE matrix, which are designed to evaluate the firm’s internal and external factors in order to derive the strategies, the TEA method merely focuses on the computation of the reflections of the external forces on the internal forces where a lack of complete information regarding the environmental factors exists. In spite of the fact that the new method follows a different approach compared to the other strategic analysis methods, the results showed that it is a reliable method. Furthermore, according to the results, it could be concluded that the TEA method deals well with the uncertainty and determines the strategic position as well as other tools.
To run the conventional strategic analysis tools, such as the SWOT analysis, all effective factors, the external and internal factors, need to be listed, then, the evaluation process begins. However, when the complete information is not available, or in the chaotic environment, such as the current situation in which markets are struggling with intense changes stemming from COVID-19 impacts, the detection of the changes of the internal factors even in the short period makes determining of the firm’s strategic position available for an external observer. Moreover, when a firm is struggling and there is a lack of integrated information from the environment, the TEA method would be an appropriate tool to determine the firm’s strategic position in the market.
The main limitation of the method emerges when the number of selected periods tends to two periods, where the method’s output could be questionable. Yet, with increasing periods, the reliability of the output is enhanced. Another limitation of the method could be raised from the lack of proper information collection (see Figure 3). In order to generate a reliable output, the TEA method requires complete information regarding the main elements and their sub-elements.
The method is designed to generate output by evaluating ten key elements of a business, yet it is suggested to change the elements according to the nature of the business and to assess the method’s applicability and reliability. The utilization of the group decision-making methods and MCDM techniques in determining the weights of the ten elements and their corresponding sub-elements would be another interesting suggestion for future research. Application of the fuzzy set theory’s extension, such as the intuitionistic fuzzy and the hesitant fuzzy sets theory, in order to deal with uncertainty and compare them with the grey system theory’s application is an interesting suggestion for future work.
Author Contributions
Data curation, S.Z.; Formal analysis, S.Z.; Methodology, S.Z.; Supervision, D.K.; Writing—original draft, S.Z.; Writing—review & editing, S.Z., D.K. and N.C. All authors have read and agreed to the published version of the manuscript.
Funding
This research received no external funding.
Institutional Review Board Statement
Not applicable.
Informed Consent Statement
Not applicable.
Data Availability Statement
Not applicable.
Conflicts of Interest
The authors declare no conflict of interest.
References
- Ahmadi, M.; Abadi, M.Q.H. A review of using object-orientation properties of C++ for designing expert system in strategic planning. Comput. Sci. Rev. 2020, 37, 100282. [Google Scholar] [CrossRef]
- Hill, C.W.; Jones, G.R.; Schilling, M.A. Strategic Management: Theory & Cases: An Integrated Approach. Cengage Learning. 2016. Available online: https://www.amazon.com/Strategic-Management-Theory-Integrated-Approach/dp/1305502272 (accessed on 20 February 2022).
- Wolf, C.; Floyd, S.W. Strategic Planning Research: Toward a Theory-Driven Agenda. J. Manag. 2013, 43, 1754–1788. [Google Scholar] [CrossRef] [Green Version]
- George, B.; Walker, R.M.; Monster, J. Does Strategic Planning Improve Organizational Performance? A Meta-Analysis. Public Adm. Rev. 2019, 79, 810–819. [Google Scholar] [CrossRef]
- Bryson, J.M. The Future of Public and Nonprofit Strategic Planning in the United States. Public Adm. Rev. 2010, 70, s255–s267. [Google Scholar] [CrossRef]
- Kools, M.; George, B. Debate: The learning organization—A key construct linking strategic planning and strategic management. Public Money Manag. 2020, 40, 262–264. [Google Scholar] [CrossRef]
- Frankel, E.G. Strategic planning applied to shipping and ports. Marit. Policy Manag. 1989, 16, 123–132. [Google Scholar] [CrossRef]
- Ioppolo, G.; Cucurachi, S.; Salomone, R.; Saija, G.; Shi, L. Sustainable Local Development and Environmental Governance: A Strategic Planning Experience. Sustainability 2016, 8, 180. [Google Scholar] [CrossRef] [Green Version]
- Wu, X.; Zhang, L.; Luo, M. Current strategic planning for sustainability in international shipping. Environ. Dev. Sustain. 2018, 22, 1729–1747. [Google Scholar] [CrossRef]
- Sanito, R.C.; You, S.-J.; Chang, T.-J.; Wang, Y.-F. Economic and environmental evaluation of flux agents in the vitrification of resin waste: A SWOT analysis. J. Environ. Manag. 2020, 270, 110910. [Google Scholar] [CrossRef] [PubMed]
- Uzarski, D.; Broome, M.E. A Leadership Framework for Implementation of an Organization’s Strategic Plan. J. Prof. Nurs. 2019, 35, 12–17. [Google Scholar] [CrossRef] [PubMed]
- Spee, A.P.; Jarzabkowski, P. Strategic planning as communicative process. Organ. Stud. 2011, 32, 1217–1245. [Google Scholar] [CrossRef]
- Papulova, Z.; Gazova, A. Role of Strategic Analysis in Strategic Decision-Making. Procedia Econ. Financ. 2016, 39, 571–579. [Google Scholar] [CrossRef] [Green Version]
- Petrou, A.P.; Hadjielias, E.; Thanos, I.C.; Dimitratos, P. Strategic decision-making processes, international environmental munificence and the accelerated internationalization of SMEs. Int. Bus. Rev. 2020, 29, 101735. [Google Scholar] [CrossRef]
- Ojha, D.; Patel, P.C.; Sridharan, S.V. Dynamic strategic planning and firm competitive performance: A conceptualization and an empirical test. Int. J. Prod. Econ. 2020, 222, 107509. [Google Scholar] [CrossRef]
- Tavana, M.; Zareinejad, M.; DI Caprio, D.; Kaviani, M.A. An integrated intuitionistic fuzzy AHP and SWOT method for outsourcing reverse logistics. Appl. Soft Comput. 2016, 40, 544–557. [Google Scholar] [CrossRef]
- Ashutosh, A.; Sharma, A.; Beg, M.A. Strategic analysis using SWOT-AHP: A fibre cement sheet company application. J. Manag. Dev. 2020, 39, 543–557. [Google Scholar] [CrossRef]
- Büyüközkan, G.; Ilıcak, Ö. Integrated SWOT analysis with multiple preference relations. Kybernetes 2019, 48, 451–470. [Google Scholar] [CrossRef]
- Zakeri, S.; Yang, Y.; Hashemi, M. Grey strategies interaction model. J. Strat. Manag. 2019, 12, 30–60. [Google Scholar] [CrossRef]
- Shahba, S.; Arjmandi, R.; Monavari, M.; Ghodusi, J. Application of multi-attribute decision-making methods in SWOT analysis of mine waste management (case study: Sirjan’s Golgohar iron mine, Iran). Resour. Policy 2017, 51, 67–76. [Google Scholar] [CrossRef]
- Ren, J.; Gao, S.; Tan, S.; Dong, L. Hydrogen economy in China: Strengths–weaknesses–opportunities–threats analysis and strategies prioritization. Renew. Sustain. Energy Rev. 2015, 41, 1230–1243. [Google Scholar] [CrossRef]
- Xu, D.; Dong, L. Strategic diagnosis of China’s modern coal-to-chemical industry using an integrated SWOT-MCDM framework. Clean Technol. Environ. Policy 2018, 21, 517–532. [Google Scholar] [CrossRef]
- Brunnhofer, M.; Gabriella, N.; Schöggl, J.-P.; Stern, T.; Posch, A. The biorefinery transition in the European pulp and paper industry—A three-phase Delphi study including a SWOT-AHP analysis. For. Policy Econ. 2020, 110, 101882. [Google Scholar] [CrossRef]
- Haque, H.E.; Dhakal, S.; Mostafa, S. An assessment of opportunities and challenges for cross-border electricity trade for Bangladesh using SWOT-AHP approach. Energy Policy 2020, 137, 111118. [Google Scholar] [CrossRef]
- Papapostolou, A.; Karakosta, C.; Apostolidis, G.; Doukas, H. An AHP-SWOT-Fuzzy TOPSIS Approach for Achieving a Cross-Border RES Cooperation. Sustainability 2020, 12, 2886. [Google Scholar] [CrossRef] [Green Version]
- Radder, L.; Louw, L. The SPACE matrix: A tool for calibrating competition. Long Range Plan. 1998, 31, 549–559. [Google Scholar] [CrossRef]
- Benson, A.M.; Henderson, S. Strategic characteristics of sport and recreation provision: An application of SPACE analysis. Manag. Leis. 2005, 10, 251–267. [Google Scholar] [CrossRef]
- Benson, A.M.; Henderson, S. A strategic analysis of volunteer tourism organisations. Serv. Ind. J. 2011, 31, 405–424. [Google Scholar] [CrossRef] [Green Version]
- Benson, A.; Henderson, S. UK leisure centres under best value: A strategic analysis. Int. J. Public Sect. Manag. 2005, 18, 196–215. [Google Scholar] [CrossRef]
- Li, X.; Hamblin, D.J. The impact of performance and practice factors on UK manufacturing companies’ survival. Int. J. Prod. Res. 2003, 41, 963–979. [Google Scholar] [CrossRef]
- Ranchhod, A.; Henderson, S. Strategic management in smaller bio-technology companies. Enterp. Action 1995, 1, 12–19. [Google Scholar]
- Cross, J.; Henderson, S. Strategic challenges in the football business: A SPACE analysis. Strat. Chang. 2003, 12, 409–420. [Google Scholar] [CrossRef]
- Barbara, C.; Cortis, D.; Perotti, R.; Sammut, C.; Vella, A. The European Insurance Industry: A PEST Analysis. Int. J. Financ. Stud. 2017, 5, 14. [Google Scholar] [CrossRef] [Green Version]
- Alava, R.P.; Murillo, J.M.; Zambrano, R.B.; Zambrano Vélez, M.I. PEST Analysis Based on Neutrosophic Cognitive Maps: A Case Study for Food Industry. Neutrosophic Sets Syst. 2018, 21, 10. Available online: https://digitalrepository.unm.edu/nss_journal/vol21/iss1/10 (accessed on 20 February 2022).
- Gong, H.; Wang, B.; Liang, H.; Luo, Z.; Cao, Y. Strategic analysis of China’s geothermal energy industry. Front. Eng. Manag. 2021, 8, 390–401. [Google Scholar] [CrossRef]
- Sammut-Bonnici, T.; Galea, D. PEST analysis. In Wiley Encyclopedia of Management; Wiley: Hoboken, NJ, USA, 2015; p. 1. [Google Scholar] [CrossRef]
- Song, J.; Sun, Y.; Jin, L. PESTEL analysis of the development of the waste-to-energy incineration industry in China. Renew. Sustain. Energy Rev. 2017, 80, 276–289. [Google Scholar] [CrossRef]
- Nurmi, J.; Niemelä, M.S. PESTEL analysis of hacktivism campaign motivations. In Proceedings of the Nordic Conference on Secure IT Systems, Oslo, Norway, 29–30 November 2018; Springer: Cham, Switzerland, 2018; pp. 323–335. [Google Scholar]
- Pan, W.; Chen, L.; Zhan, W. PESTEL Analysis of Construction Productivity Enhancement Strategies: A Case Study of Three Economies. J. Manag. Eng. 2019, 35, 05018013. [Google Scholar] [CrossRef]
- Geluyake HA, P.; Moodi, M.M.; Afin, M.H.; Rafsanjani, H.K. Using Foresight to Create Political and Economic Collective Endeavor Based on the STEEPV Analysis. Int. SAMANM J. Mark. Manag. 2014, 2, 129–137. Available online: http://citeseerx.ist.psu.edu/viewdoc/download?doi=10.1.1.671.5685&rep=rep1&type=pdf (accessed on 20 February 2022).
- More, E.; Probert, D.; Phaal, R. Improving long-term strategic planning: An analysis of STEEPLE factors identified in environmental scanning brainstorms. In Proceedings of the 2015 Portland International Conference on Management of Engineering and Technology (PICMET), Portland, OR, USA, 2–6 August 2015; IEEE: Manhattan, NY, USA, 2015; pp. 381–394. [Google Scholar]
- Chen, J.H.; Wang, Y. SWOT-PEST Analysis of China’s Dry Port. Adv. Mater. Res. 2012, 479-481, 1004–1012. [Google Scholar] [CrossRef]
- Zhu, L.; Hiltunen, E.; Antila, E.; Huang, F.; Song, L. Investigation of China’s bio-energy industry development modes based on a SWOT–PEST model. Int. J. Sustain. Energy 2014, 34, 552–559. [Google Scholar] [CrossRef]
- Han, W.; Guangrui, T. The SWOT-PEST Analysis of the Construction of Incentive System for State-owned Enterprises’ Scientific Researchers. IOP Conf. Ser. Mater. Sci. Eng. 2018, 439, 032032. [Google Scholar] [CrossRef]
- Knight, F.H. Risk, Uncertainty and Profit; Houghton Mifflin: Boston, MA, USA, 1921; Volume 31. [Google Scholar]
- Smales, L.A. Examining the relationship between policy uncertainty and market uncertainty across the G7. Int. Rev. Financ. Anal. 2020, 71, 101540. [Google Scholar] [CrossRef]
- Gneezy, U.; List, J.A.; Wu, G. The Uncertainty Effect: When a Risky Prospect is Valued Less than its Worst Possible Outcome. Q. J. Econ. 2006, 121, 1283–1309. [Google Scholar] [CrossRef]
- Hsu, M.; Bhatt, M.; Adolphs, R.; Tranel, D.; Camerer, C.F. Neural Systems Responding to Degrees of Uncertainty in Human Decision-Making. Science 2005, 310, 1680–1683. [Google Scholar] [CrossRef] [PubMed] [Green Version]
- Bloom, N. The Impact of Uncertainty Shocks. Econometrica 2009, 77, 623–685. [Google Scholar] [CrossRef] [Green Version]
- Carney, M. Uncertainty, the Economy and Policy; Bank of England: London, UK, 2016. [Google Scholar]
- Zadeh, L.A. Fuzzy sets. Inf. Control 1965, 8, 338–353. [Google Scholar] [CrossRef] [Green Version]
- Chakraborty, S.; Das, P.P.; Kumar, V. Application of grey-fuzzy logic technique for parametric optimization of non-traditional machining processes. Grey Syst. Theory Appl. 2018, 8, 46–68. [Google Scholar] [CrossRef]
- Naimi, M.; Tahayori, H. Centroid of polygonal fuzzy sets. Appl. Soft Comput. 2020, 95, 106519. [Google Scholar] [CrossRef]
- Deng, J.L. Fundamental Methods of Grey Systems; Huazhoug University of Science and Technology: Wuhan, China, 1985. [Google Scholar]
- Mierzwiak, R.; Xie, N.; Nowak, M. New axiomatic approach to the concept of grey information. Grey Syst. Theory Appl. 2018, 8, 199–209. [Google Scholar] [CrossRef]
- Zakeri, S. Ranking based on optimal points multi-criteria decision-making method. Grey Syst. Theory Appl. 2019, 9, 45–69. [Google Scholar] [CrossRef]
- Zakeri, S.; Keramati, M.A. Systematic combination of fuzzy and grey numbers for supplier selection problem. Grey Syst. Theory Appl. 2015, 5, 313–343. [Google Scholar] [CrossRef]
- Zhang, G.; Zhou, S.; Xia, X.; Yuksel, S.; Bas, H.; Dincer, H. Strategic Mapping of Youth Unemployment With Interval-Valued Intuitionistic Hesitant Fuzzy DEMATEL Based on 2-Tuple Linguistic Values. IEEE Access 2020, 8, 25706–25721. [Google Scholar] [CrossRef]
- Qi, W.; Huang, Z.; Dinçer, H.; Korsakienė, R.; Yüksel, S. Corporate Governance-Based Strategic Approach to Sustainability in Energy Industry of Emerging Economies with a Novel Interval-Valued Intuitionistic Fuzzy Hybrid Decision Making Model. Sustainability 2020, 12, 3307. [Google Scholar] [CrossRef] [Green Version]
- Büyüközkan, G.; Feyzioğlu, O.; Havle, C. Intuitionistic Fuzzy AHP Based Strategic Analysis of Service Quality in Digital Hospitality Industry. IFAC-PapersOnLine 2019, 52, 1687–1692. [Google Scholar] [CrossRef]
- Karasan, A.; Erdogan, M.; Ilbahar, E. Prioritization of production strategies of a manufacturing plant by using an integrated intuitionistic fuzzy AHP & TOPSIS approach. J. Enterp. Inf. Manag. 2018, 31, 510–528. [Google Scholar] [CrossRef]
- Wei, G. Some Cosine Similarity Measures for Picture Fuzzy Sets and Their Applications to Strategic Decision Making. Informatica 2017, 28, 547–564. Available online: https://content.iospress.com/articles/informatica/inf1150 (accessed on 20 February 2022). [CrossRef] [Green Version]
- Karimi, M.; Niknamfar, A.H.; Niaki, S.T.A. An application of fuzzy-logic and grey-relational ANP-based SWOT in the ceramic and tile industry. Knowl.-Based Syst. 2019, 163, 581–594. [Google Scholar] [CrossRef]
- Mostamand, M.; Hajiagha, S.H.R.; Daneshvar, M. Selecting Strategies by Considering Budget Limitation: A Hybrid Algorithm of SWOT-DEMATEL-ANP and Binary Programming with Grey Information. Informatica 2017, 28, 485–503. [Google Scholar] [CrossRef] [Green Version]
- Ghazinoory, S.; Esmail Zadeh, A.; Memariani, A. Fuzzy SWOT analysis. J. Intell. Fuzzy Syst. 2007, 18, 99–108. Available online: https://content.iospress.com/articles/journal-of-intelligent-and-fuzzy-systems/ifs00334 (accessed on 20 February 2022).
- Kheirkhah, A.S.; Esmailzadeh, A.; Ghazinoory, S. Developing strategies to reduce the risk of hazardous materials transportation in Iran using the method of fuzzy SWOT analysis. Transport 2009, 24, 325–332. [Google Scholar] [CrossRef] [Green Version]
- Amin, S.H.; Razmi, J.; Zhang, G. Supplier selection and order allocation based on fuzzy SWOT analysis and fuzzy linear programming. Expert Syst. Appl. 2011, 38, 334–342. [Google Scholar] [CrossRef]
- Taghavifard, M.T.; Mahdiraji, H.A.; Alibakhshi, A.M.; Zavadskas, E.K.; Bausys, R. An Extension of Fuzzy SWOT Analysis: An Application to Information Technology. Information 2018, 9, 46. [Google Scholar] [CrossRef] [Green Version]
- Lee, K.-L.; Lin, S.-C. A fuzzy quantified SWOT procedure for environmental evaluation of an international distribution center. Inf. Sci. 2008, 178, 531–549. [Google Scholar] [CrossRef]
- Adem, A.; Çolak, A.; Dağdeviren, M. An integrated model using SWOT analysis and Hesitant fuzzy linguistic term set for evaluation occupational safety risks in life cycle of wind turbine. Saf. Sci. 2018, 106, 184–190. [Google Scholar] [CrossRef]
- Büyüközkan, G.; Mukul, E.; Kongar, E. Health tourism strategy selection via SWOT analysis and integrated hesitant fuzzy linguistic AHP-MABAC approach. Socio-Econ. Plan. Sci. 2021, 74, 100929. [Google Scholar] [CrossRef]
- Wang, Y.; Xu, L.; Solangi, Y.A. Strategic Renewable Energy Resources Selection for Pakistan: Based on SWOT-Fuzzy AHP Approach. Sustain. Cities Soc. 2020, 52, 101861. [Google Scholar] [CrossRef]
- Aghasafari, H.; Karbasi, A.; Mohammadi, H.; Calisti, R. Determination of the best strategies for development of organic farming: A SWOT—Fuzzy Analytic Network Process approach. J. Clean. Prod. 2020, 277, 124039. [Google Scholar] [CrossRef]
- Diba, S.; Xie, N. Sustainable supplier selection for Satrec Vitalait Milk Company in Senegal using the novel grey relational analysis method. Grey Syst. Theory Appl. 2019, 9, 262–294. [Google Scholar] [CrossRef]
- Karimi, T.; Hojati, A. Designing a medical rule model system by using rough–grey modeling. Grey Syst. Theory Appl. 2020, 10, 513–527. [Google Scholar] [CrossRef]
- Li, B.; Zhu, X. Grey relational decision making model of three-parameter interval grey number based on AHP and DEA. Grey Syst. Theory Appl. 2019, 10, 25–37. [Google Scholar] [CrossRef]
- Khan, A.; Maity, K. Estimation of optimal cutting conditions during machining of CP-Ti grade 2 in fuzzy–VIKOR context. Grey Syst. Theory Appl. 2020, 10, 293–310. [Google Scholar] [CrossRef]
- Mahmoudi, A.; Abbasi, M.; Deng, X.; Ikram, M.; Yeganeh, S. A novel model for risk management of outsourced construction projects using decision-making methods: A case study. Grey Syst. Theory Appl. 2020, 10, 97–123. [Google Scholar] [CrossRef]
- Jiang, P.; Wang, W.; Hu, Y.-C.; Chiu, Y.-J.; Tsao, S.-J. Pattern classification using tolerance rough sets based on non-additive grey relational analysis and DEMATEL. Grey Syst. Theory Appl. 2020, 11, 166–182. [Google Scholar] [CrossRef]
- Zhang, Y.; Liu, C.; Xu, T.; Huang, Y.; Tao, L. Impact analysis and classification of aircraft functional failures using improved FHA based on grey evaluation. Grey Syst. Theory Appl. 2020, 10, 159–171. [Google Scholar] [CrossRef]
- Hao, X.; Li, M.; Chen, Y. China’s overcapacity industry evaluation based on TOPSIS grey relational projection method with mixed attributes. Grey Syst. Theory Appl. 2020, 11, 288–308. [Google Scholar] [CrossRef]
- Wiecek-Janka, E.; Nowak, M.; Borowiec, A. Application of the GDM model in the diagnosis of crises in family businesses. Grey Syst. Theory Appl. 2019, 9, 114–127. [Google Scholar] [CrossRef]
- Wang, Z.-X. Correlation analysis of sequences with interval grey numbers based on the kernel and greyness degree. Kybernetes 2013, 42, 309–317. [Google Scholar] [CrossRef]
- Darvishi, D.; Liu, S.; Forrest, J.Y.-L. Grey linear programming: A survey on solving approaches and applications. Grey Syst. Theory Appl. 2020, 11, 110–135. [Google Scholar] [CrossRef]
- Chang, F.-J.; Hui, S.-C.; Chen, Y.-C. Reservoir operation using grey fuzzy stochastic dynamic programming. Hydrol. Process. 2002, 16, 2395–2408. [Google Scholar] [CrossRef]
- Jiang, S.Q.; Liu, S.; Liu, Z. General grey number decision-making model and its application based on intuitionistic grey number set. Grey Syst. Theory Appl. 2020, 11, 4. [Google Scholar] [CrossRef]
- Zakeri, S.; Delavar, M.; Cheikhrouhou, N. Dairy Market Selection Approach Using MCDM Methods: A Case Of Iranian Dairy Market. Int. J. Manag. Dec. Mak. 2020, 19, 267. [Google Scholar] [CrossRef]
- Darvishi, D.; Forrest, J.; Liu, S. A comparative analysis of grey ranking approaches. Grey Syst. Theory Appl. 2019, 9, 472–487. [Google Scholar] [CrossRef]
- Moore, R.E. Methods and Applications of Interval Analysis; SIAM (Society for Industrial & Applied Math): Philadelphia, PA, USA, 1979; pp. 74–79. [Google Scholar] [CrossRef] [Green Version]
- Ishibuchi, H.; Tanaka, H. Multiobjective programming in optimization of the interval objective function. Eur. J. Oper. Res. 1990, 48, 219–225. [Google Scholar] [CrossRef]
- Hu, B.Q.; Wang, S. A novel approach in uncertain programming part I: New arithmetic and order relation for interval numbers. J. Ind. Manag. Optim. 2006, 2, 351–371. [Google Scholar] [CrossRef]
- Guo, S.-D.; Liu, S.; Fang, Z.; Xie, N. Algorithm rules of interval grey numbers based on different “kernel” and the degree of greyness of grey numbers. Grey Syst. Theory Appl. 2017, 7, 168–178. [Google Scholar] [CrossRef]
- Xie, N.M.; Liu, S.F. On comparing grey numbers with their probability distributions. Syst. Eng.-Theory Pract. 2009, 29, 169–175. [Google Scholar]
- Ng, D.K.W.; Deng, J. Contrasting grey system theory to probability and fuzzy. ACM Sigice Bull. 1995, 20, 3–9. [Google Scholar] [CrossRef]
- Yang, Y.; John, R. Grey systems and interval valued fuzzy sets. In Proceedings of the EUSFLAT Conference, Zittau, Germany, 10–12 September 2003; pp. 193–197. Available online: http://www.ifigenia.org/images/2/23/EUSFLAT-2003-193-197.pdf (accessed on 20 February 2022).
- Khuman, A.S.; Yang, Y.; John, R. A commentary on some of the intrinsic differences between grey systems and fuzzy systems. In Proceedings of the 2014 IEEE International Conference on Systems, Man, and Cybernetics (SMC), San Diego, CA, USA, 5–8 October 2014; IEEE: Manhattan, NY, USA, 2014; pp. 2032–2037. [Google Scholar]
Figure 1.
The triangles of a grey number compared with the max interval.

Figure 2.
The impact of forces on the firm’s internal factors and the generated reflections.

Figure 3.
The times periods and their values.

Figure 4.
The TEA method implementation workflow.


Table 1.
The ten elements information for three years.
| HR | MA | PRB | T | O | IT | LSC | PS | F | I | ||||||||||||||||||
|---|---|---|---|---|---|---|---|---|---|---|---|---|---|---|---|---|---|---|---|---|---|---|---|---|---|---|---|
| Recruitment/Laying off | Budget | Social Network Engagement | Number of Events | Budget | Production Lines Flexibility | Human Errors | Budget | Agility | Complexity | Automation | Budget for BPR | Number of Clients | Implementation of ERP | Number of Distribution Centers | Transportation | Automation | Number of Dairy Suppliers | Quality of the Raw Materials | Portfolio Size | Product SKUS | Quality of the Products | Operating Profit | Business Units | Number of Distribution Centers | Production Lines | Numbers of Factories | |
| [+0.01, +0.015] | [0, 0.01] | P | [2, 5] | [0, 0.2] | VG | MP | [0, 0.8] | MG | M | MG | [0, 0.01] | [470, 482] | MH | [8, 12] | G | G | [10, 12] | VG | [120, 145] | [361, 420] | VG | [+0.08, 0.105] | [5, 8] | [8, 12] | [19, 31] | [7, 8] | |
| [0, +0.01] | [0, 0.01] | P | [2, 5] | [0, 0.01] | G | F | [0, 0.3] | F | MH | M | [0, 0.01] | [465, 470] | M | [6, 8] | G | MG | [6, 10] | VG | [116, 120] | [346, 361] | VG | [0.07, 0.08] | [4, 5] | [6, 8] | [13, 19] | [3, 7] | |
| [0, +0.007] | [0, 0.01] | VP | [1, 3] | [0, 0.01] | MG | F | [0, 0.5] | F | H | M | [0, 0.01] | [450, 465] | ML | [5, 6] | G | MG | [4, 6] | VG | [112, 116] | [333, 346] | VG | [0.05, 0.07] | [3, 4] | [5, 6] | [11, 13] | [2, 3] | |
Table 2.
The grey attributes scale of rating.
| Scale | Grey | Scale |
|---|---|---|
| Very Poor (VP) | [0, 1] | Very Low (VL) |
| Poor (P) | [1, 3] | Low (L) |
| Medium Poor (MP) | [3, 4] | Medium Low (ML) |
| Fair (F) | [4, 5] | Medium (M) |
| Medium Good (MG) | [5, 6] | Medium High (MH) |
| Good (G) | [6, 9] | High (H) |
| Very Good (VG) | [9, 10] | Very High (VH) |
Table 3.
The data aggregated table of variables and results.
| HR | MA | PRB | T | O | IT | LSC | PS | F | I | |||||||||||||||||||
|---|---|---|---|---|---|---|---|---|---|---|---|---|---|---|---|---|---|---|---|---|---|---|---|---|---|---|---|---|
| Recruitment/Laying off | Budget | Social Network Engagement | Number of Events | Budget | Production Lines Flexibility | Human Errors | Budget | Agility | Complexity | Automation | Budget for BPR | Number of Clients | Implementation of ERP | Number of Distribution Centers | Transportation | Automation | Number of Dairy Suppliers | Quality of the Raw Materials | Portfolio Size | Product SKUS | Quality of the Products | Operating Profit | Business Units | Number of Distribution Centers | Production Lines | Numbers of Factories | ||
| [+0.01, +0.015] | [0, 0.01] | [1, 3] | [2, 5] | [0, 0.2] | [9, 10] | [3, 4] | [0, 0.8] | [5, 6] | [4, 5] | [5, 6] | [0, 0.01] | [470, 482] | [5, 6] | [8, 12] | [6, 9] | [6, 9] | [10, 12] | [9, 10] | [120, 145] | [361, 420] | [9, 10] | [+0.08, 0.105] | [5, 8] | [8, 12] | [19, 31] | [7, 8] | ||
| [0, +0.01] | [0, 0.01] | [1, 3] | [2, 5] | [0, 0.01] | [6, 9] | [4, 5] | [0, 0.3] | [4, 5] | [5, 6] | [4, 5] | [0, 0.01] | [465, 470] | [4, 5] | [6, 8] | [6, 9] | [5, 6] | [6, 10] | [9, 10] | [116, 120] | [346, 361] | [9, 10] | [0.07, 0.08] | [4, 5] | [6, 8] | [13, 19] | [3, 7] | ||
| [0, +0.007] | [0, 0.01] | [0, 1] | [1, 3] | [0, 0.01] | [5, 6] | [4, 5] | [0, 0.5] | [4, 5] | [6, 9] | [4, 5] | [0, 0.01] | [450, 465] | [3, 4] | [5, 6] | [6, 9] | [5, 6] | [4, 6] | [9, 10] | [112, 116] | [333, 346] | [9, 10] | [0.05, 0.07] | [3, 4] | [5, 6] | [11, 13] | [2, 3] | ||
| [0.00033, 0.00050] | [0, 0.000497] | [0.39780, 0.44200] | [0.19350, 0.23220] | [0.00000, 0.03976] | [0.22100, 0.26520] | [0.15480, 0.19350] | [0.22100, 0.26520] | [0.00000, 0.00033] | [18.189, 18.653] | [0.13260, 0.17680] | [0.30960, 0.46440] | [0.29820, 0.44730] | [0.26520, 0.39780] | [0.49700, 0.59640] | [0.44730, 0.49700] | [5.304, 6.409] | [17.942, 20.874] | [0.44730, 0.49700] | [0.16550, 0.26480] | [0.39760, 0.59640] | [0.73530, 1.19970] | [0.30940, 0.3536] | ||||||
| [0.00000, 0.00033] | [0, 0.000497] | [0.26520, 0.39780] | [0.15480, 0.19350] | [0.00000, 0.01491] | [0.11610, 0.15480] | [0.17680, 0.22100] | [0.00000, 0.00033] | [17.996, 18.189] | [0.17680, 0.22100] | [0.23220, 0.30960] | [0.23220, 0.30960] | [0.29820, 0.44730] | [0.22100, 0.26520] | [0.29820, 0.49700] | [0.44730, 0.49700] | [5.127, 5.304] | [17.196, 17.942] | [0.44730, 0.4970] | [0.13240, 0.16550] | [0.29820, 0.39760] | [0.50310, 0.73530] | [0.13260, 0.3094] | ||||||
| [0.00000, 0.00023] | [0, 0.000497] | [0.22100, 0.26520] | [0.15480, 0.19350] | [0.00000, 0.02485] | [0.17680, 0.22100] | [0.03870, 0.11610] | [0.17680, 0.22100] | [0.00000, 0.00033] | [17.415, 17.996] | [0.22100, 0.35360] | [0.19350, 0.23220] | [0.29820, 0.44730] | [0.22100, 0.26520] | [0.19880, 0.29820] | [0.44730, 0.49700] | [4.950, 5.127] | [16.550, 17.196] | [0.44730, 0.4970] | [0.09930, 0.13240] | [0.24850, 0.29820] | [0.42570, 0.50310] | [0.08840, 0.13260] | ||||||
| [0.00004, 0.00006] | [0.00000, 0.00007] | [0.07628, 0.0921] | [0.06738, 0.08177] | [2.06851, 2.12588] | [0.08545, 0.11212] | [1.14839, 1.34542] | [0.06738, 0.10046] | |||||||||||||||||||||
| [0.00000, 0.00004] | [0.00000, 0.00007] | [0.05418, 0.0782] | [0.05303, 0.06742] | [2.05171, 2.07849] | [0.07063, 0.09533] | [1.10348, 1.15086] | [0.04453, 0.06738] | |||||||||||||||||||||
| [0.00000, 0.00003] | [0.00000, 0.00007] | [0.04848, 0.06238] | [0.04429, 0.06305] | [1.9911, 2.07167] | [0.06419, 0.08246] | [1.06356, 1.10595] | [0.03602, 0.04453] | |||||||||||||||||||||
Table 4.
The computation process of and .
| [0.00004, 0.00006] | [0.00000, 0.00007] | [0.07628, 0.0921] | [0.06738, 0.08177] | [2.06851, 2.12588] | [0.08545, 0.11212] | [1.14839, 1.34542] | [0.06738, 0.10046] | |
| [0.00000, 0.00004] | [0.00000, 0.00007] | [0.05418, 0.0782] | [0.05303, 0.06742] | [2.05171, 2.07849] | [0.07063, 0.09533] | [1.10348, 1.15086] | [0.04453, 0.06738] | |
| [0.00000, 0.00003] | [0.00000, 0.00007] | [0.04848, 0.06238] | [0.04429, 0.06305] | [1.9911, 2.07167] | [0.06419, 0.08246] | [1.06356, 1.10595] | [0.03602, 0.04453] | |
| [2.06851, 2.12588] | [2.05171, 2.07849] | [1.9911, 2.07167] | ||||||
| [4.13702, 4.25176] | [4.10342, 4.15698] | [3.9822, 4.14334] | ||||||
| [8.27404, 8.50352] | [8.20684, 8.31396] | [7.9644, 8.28668] | ||||||
Table 5.
The firm’s internal analysis.
| 0.9 | 0.8 | 0.7 | |
| 0.5 | 0.2 | 0.3 | |
| [15.92449, 16.61316] | [15.68782, 16.00873] | [15.19424, 15.86016] | |
| [7.166, 7.476] | [2.510, 2.561] | [3.191, 3.331] |
Publisher’s Note: MDPI stays neutral with regard to jurisdictional claims in published maps and institutional affiliations. |
© 2022 by the authors. Licensee MDPI, Basel, Switzerland. This article is an open access article distributed under the terms and conditions of the Creative Commons Attribution (CC BY) license (https://creativecommons.org/licenses/by/4.0/).
Share and Cite
MDPI and ACS Style
Zakeri, S.; Konstantas, D.; Cheikhrouhou, N. The Grey Ten-Element Analysis Method: A Novel Strategic Analysis Tool. Mathematics 2022, 10, 846. https://0-doi-org.brum.beds.ac.uk/10.3390/math10050846
AMA Style
Zakeri S, Konstantas D, Cheikhrouhou N. The Grey Ten-Element Analysis Method: A Novel Strategic Analysis Tool. Mathematics. 2022; 10(5):846. https://0-doi-org.brum.beds.ac.uk/10.3390/math10050846
Chicago/Turabian StyleZakeri, Shervin, Dimitri Konstantas, and Naoufel Cheikhrouhou. 2022. "The Grey Ten-Element Analysis Method: A Novel Strategic Analysis Tool" Mathematics 10, no. 5: 846. https://0-doi-org.brum.beds.ac.uk/10.3390/math10050846
Note that from the first issue of 2016, this journal uses article numbers instead of page numbers. See further details here.