
Combining Data Envelopment Analysis and Machine Learning


Center of Operations Research (CIO), Miguel Hernandez University of Elche (UMH), 03202 Elche, Spain
*
Author to whom correspondence should be addressed.
Mathematics 2022, 10(6), 909; https://0-doi-org.brum.beds.ac.uk/10.3390/math10060909
Submission received: 20 February 2022
/
Revised: 5 March 2022
/
Accepted: 9 March 2022
/
Published: 11 March 2022
(This article belongs to the Topic Multi-Criteria Decision Making)
Abstract
:Data Envelopment Analysis (DEA) is one of the most used non-parametric techniques for technical efficiency assessment. DEA is exclusively concerned about the minimization of the empirical error, satisfying, at the same time, some shape constraints (convexity and free disposability). Unfortunately, by construction, DEA is a descriptive methodology that is not concerned about preventing overfitting. In this paper, we introduce a new methodology that allows for estimating polyhedral technologies following the Structural Risk Minimization (SRM) principle. This technique is called Data Envelopment Analysis-based Machines (DEAM). Given that the new method controls the generalization error of the model, the corresponding estimate of the technology does not suffer from overfitting. Moreover, the notion of -insensitivity is also introduced, generating a new and more robust definition of technical efficiency. Additionally, we show that DEAM can be seen as a machine learning-type extension of DEA, satisfying the same microeconomic postulates except for minimal extrapolation. Finally, the performance of DEAM is evaluated through simulations. We conclude that the frontier estimator derived from DEAM is better than that associated with DEA. The bias and mean squared error obtained for DEAM are smaller in all the scenarios analyzed, regardless of the number of variables and DMUs.
Keywords:
data envelopment analysis; PAC learning; support vector regression; machine learning; structural risk minimizationMSC:
90C081. Introduction
One of the most important issues in the field of statistical learning is the reliability of statistical inference methods. In this framework, a sophisticated theory, the so-called Generalization Theory, explains which factors must be controlled to achieve good generalization. Optimal generalization is achieved when the error generated on evaluating new data through an inference learning method is minimized. The Generalization Theory copes with those factors that allow for the minimization of the prediction or generalization error.
In terms of pattern classifiers, the generalization error is the probability of misclassifying a randomly chosen example that holds with high probability over randomly chosen training sets, and then, a good generalization is achieved when this is minimized. This aim is possible if an upper bound of the generalization error is found, and the parameters on which it depends are controlled in order to reduce it. These bounds are understood as Probably Approximately Correct (PAC) bounds, which specifically means that the probability of the bound failing is small (Probably) when the bound is achieved through the classifier that has a low error rate (Approximately Correct). The standard PAC learning model implements the idea of finding this classifier: it considers a fixed hypothesis (classifier) class together with a required accuracy and confidence, and takes into account the theory that characterizes when a function from this class can be learned from examples (training sample) in terms of a measure called the Vapnik–Chervonenkis dimension (VC dimension).
However, the statistical learning theory (Vapnik [1]) reveals that it is much more interesting not to preselect the class that will contain the target function to be learned. Instead, it is defined a set of hypothesis classes saved as a hierarchy, and the target function to be learned lies in one of them. The Structural Risk Minimization (SRM) copes with the problem of minimizing an upper bound on the expected risk over each of these hypothesis classes (Vapnik [2]). To implement the SRM in Support Vector Machines (SVM), one must consider the structures (classes) that control two factors that appear in the bound of the expected risk: the value of empirical risk and the complexity (the appropriate bound for the generalization error). Thus, under this principle, to select a learning algorithm, it is necessary to have the theoretical bound of the generalization error (PAC bounds) and to deal with the minimization of this bound together with the empirical risk.
In addition, standard regression methods are only concerned with the minimization of the empirical risk. This is the one based on the error produced by the regressors with respect to the observed dataset. This error is defined as the distance between the data to the approximation function; thus, it is a measure of the deviation of the data with respect to the regressors. It is characterized as a residual. The vertical distance is the most common way to measure the regression error, although it is not induced by a mathematical norm. In Support Vector Regression (SVR) (Vapnik [1]), for example, the residuals that participate in the empirical risk are measured through the vertical distance. Other distances, in this case based on a norm, have been used in order to establish these residuals, such as the , the and the (Blanco et al. [3,4]).
The estimation of production functions and measures of efficiency and productivity have been the focus of a relatively large body of articles in the literature in both the economic and engineering contexts, as well as in operations research and statistics. In particular, Data Envelopment Analysis (DEA) (Charnes et al. [5] and Banker et al. [6]) is one of the existing techniques for estimating production functions and measuring efficiency. DEA relies on the construction of a polyhedral technology in the space of inputs and outputs that satisfies certain classical axioms of production theory (e.g., monotonicity and convexity). It is a non-parametric data-driven approach with many advantages from a benchmarking point of view. Additionally, the treatment of the multi-output multi-input framework is relatively straightforward with DEA, in comparison with other methods available. However, Data Envelopment Analysis has been criticized for its non-statistical nature, even being labeled as a pure descriptive tool of the data sample at a frontier level with little inferential power (its inferential power is exclusively based on the property of consistency and the increase in sample size instead of on the fundamentals of the method) (Esteve et al. [7]). DEA suffers from an overfitting problem because of the application of the minimal extrapolation principle, which places the estimator of the production function as close to the dataset as possible. This principle is also related to exclusively minimizing the empirical error (at a frontier level).
Regarding the literature related to this topic, some previous authors have tried to modify the standard DEA technique such that the new approaches work as inferential methods (with the focus on the DGP) rather than as mere descriptive tools. For example, Banker and Maindiratta [8] and Banker [9] associated DEA with maximum likelihood. Simar and Wilson [10,11,12] adapted bootstrapping to DEA. Kuosmanen and Johnson [13,14] introduced the Corrected Concave Nonparametric Least Squares. Unfortunately, despite the importance of machine learning techniques in the current literature, there have been few attempts to adapt DEA to the field of machine learning (see, for example, Esteve et al. [7], or Olesen and Ruggiero [15]). In this sense, our contribution could be seen as a new bridge between these two worlds: machine learning and efficiency measurement.
In this paper, our main objective is to propose, for the first time in the literature, a PAC bound in the context of the estimation of polyhedral technologies in microeconomics and engineering, enabling the possibility of controlling the generalization error of the estimation of the production frontier. Accordingly, we construct a model that controls the empirical error, together with the generalization error, through a PAC bound implementing the philosophy of Structural Risk Minimization by analogy with SVM. Our modeling has several implications:
- (a)
- For the first time, a bound of the generalization error is implemented to determine the degree of technical inefficiency of a set of Decision Making Units (DMUs).
- (b)
- We implement the minimization of the balance between the generalization error and the empirical error through a quadratic optimization model that will be called Data Envelopment Analysis-based Machines (DEAM), which has DEA as a particular case.
- (c)
- Through a computational simulation experience, we show that DEAM outperform DEA regarding bias and mean squared error.
- (d)
- We estimate production technologies using robust regression models that use the concept of margin. Due to that, the problem of efficiency measurement becomes a classification problem: to be efficient (being located within the margin) or not to be efficient (being located out of the margin).
Finally, we mention that the expected new insights gained by applying our approach (DEAM) are related to the determination of better estimates of production functions in engineering and microeconomics, in terms of bias and mean squared error. Additionally, these gains will also benefit the technical efficiency measures that can be derived from calculating the distance from a given observation to the production function estimate.
The rest of the paper is organized as follows. The following section provides the basic background. Next, in the third section, we introduce a new PAC for the class of piece-wise linear functions. In Section 4, a new approach called Data Envelopment Analysis-based Machines (DEAM) is defined and analyzed. Section 5 shows the main results associated with a computational experience for checking the new approach in comparison with DEA. Section 6 contains a discussion on the main results. Finally, the article ends with the conclusions section.
2. Background
In this section, we briefly introduce elemental notions of Support Vector Regression, Statistical Learning and Data Envelopment Analysis.
2.1. Support Vector Regression (SVR)
Machine learning (ML) is a methodology that studies computer processes that learn from experience and make improvements automatically. ML works with computer algorithms based on a learning sample (training data) and can make predictions about the behavior of future data. The study of this behavior is produced in two different scenarios: the scenario of supervised learning in which training data are vectors of predictors and responses, and the scenario of unsupervised learning, where no responses are considered in the data sample. In the first field, the objective of learning techniques is to determine the functional relationship between the predictors and the responses. In this case, the nature of the responses, if they come from a binary variable or are real values, determines the kind of problem to solve: a classification problem or a regression problem, respectively. In the second field, since there are no responses, the objective is to gain knowledge about the processes lying behind data generation, such as density estimation or clustering. Our paper largely focuses on the regression problem within supervised learning, bearing in mind that our data comprise inputs utilized by firms to produce outputs (real values).
Support Vector Machines (Vapnik [1,16]) is a technique that stands out in ML in the world of supervised learning. SVM represents an algorithm constructed on the foundations of statistical learning theory and is in line with the Structural Risk Minimization (SRM) method. SRM is implemented to construct support vector machines, where the objective is to control the value of empirical risk and the value of the VC dimension, which is the regularization term that appears when the generalization error must be minimized rather than minimizing only the empirical error (Vapnik [1,16]). In particular, the definition of the notion of the VC dimension is as follows:
Definition 1 (VC dimension).
Let be a set of binary-valued functions. A set of points is shattered by if for all binary vectors indexed by ; there is a function performing on . The VC dimension, , of the set is the size of the largest shattered set.
With regard to the classification problem (for the regression problem, the generalization error is defined in the same way, because the regression problem can be turned in to a classification problem, as we will go on to explain) in SVM, minimizing the generalization error consists of minimizing the probability of incorrectly classifying any new data that emerges from the unknown distribution that was generated by the learning sample. This aim is possible if a bound of the generalization error is found, and the parameters on which it is dependent are controlled to reduce the bound. These bounds are understood as Probably Approximately Correct (PAC) bounds, which were first proposed by Valiant [17]. The standard PAC learning implements the idea of finding this classifier: it considers a fixed hypothesis (classifier) class together with a required accuracy and confidence, and takes into account the theory that characterizes when a function from this class can be learned from examples (data). In the case of regression, the exercise involves converting the regression problem (estimation function) into a classification problem because bounds in the generalization error are precisely based on the VC dimension or when a margin is considered on the fat-shattering dimension (effective VC dimension).
Next, we show the definition of the fat-shattering dimension. Notice that bold will be utilized for denoting vectors, and non-bold for scalars.
Definition 2 (fat-shattering dimension).
Let be a set of real-valued functions. A set of points is by if there are real numbers indexed by such that for all binary vectors indexed by , there is a function such that
The fat-shattering dimension of the set , , is a function from the positive real numbers to the integers that maps a value to the largest set. The VC dimension corresponds to the largest shattered set, considering , which is the concept first used by Vapnik to state a bound for the generalization error. This is the reason why the fat-shattering dimension is also known as the effective VC dimension.
To convert the regression problem into a classification problem, a threshold that marks the limit needs to be set, such that a mistake will be considered to have been made if it is exceeded by the loss function when testing with new data in the model. The function that determines the distance between the real value of the output and the estimated value of said output through the model is called the loss function. Given a margin , in the case of the training point, if the loss function exceeds the value , it will be considered as a mistake. Then, measures the discrepancy between the two losses: those measured on test data and those measured on training data. Under this re-interpretation of the regression problem, it is possible to use the dimension free bounds already constructed in the case of classification. In our case, we focus on the bound obtained by Shawe-Taylor and Cristianini [18], based on the fat-shattering dimension.
Theorem 1 (Shawe-Taylor and Cristianini [18]).
whereand
provided.
Let be a sturdy class of real-valued functions with range and fat-shattering dimension bounded by . Fix with , and a scaling of the output range . Consider a fixed but unknown probability distribution in the space . Then, with probability over randomly drawn training sets of size for all with , the probability that a training set filtered function has an error larger than on a randomly chosen input is bounded by
In the statement of Theorem 1, and , where is the loss function that the analyst selects in order to measure how much exceeds the error margin . In addition, the theorem introduces the concept of the fat-shattering dimension, , that is, the generalization of the VC dimension, which is sensitive to the size of the margin .
Theorem 1 is a general result, which in the case of each function class , will be particularized: for each function class, the fat-shattering dimension is bounded in a different way, and consequently, the same happens with respect to the expected error proposed in (1). In the case of linear function classes, the fat-shattering dimension is bounded by Bartlett and Shawe-Taylor [19].
Theorem 2 (Bartlett and Shawe-Taylor [19]).
Suppose that is a ball of radius and center in , i.e., , and consider the set
Then
The most general version of this theorem, in which is not restricted to be at most , bounds the fat-shattering dimension of linear classifiers as .
The following two previously published lemmas are significant for our purposes throughout this paper (see Bartlett and Shawe-Taylor [19]).
Lemma 1.
For every input set
by (the linear hypothesis class) and for every subset , holds.
Lemma 2.
For all with for , certain satisfies that .
Then, . In particular, , and it is possible to conclude that all sets of inputs
by are bounded. Therefore, the set by with higher cardinality is also bounded, which is known as the fat-shattering dimension: .
Now, if is fixed in such a way that , and disregarding the logarithmic factors in (1), the only term to reduce the expected error is (2). This process can be performed by implementing the minimization of its bound, which in the case of linear functions, is as follows:
This expected error bound meets the SRM objective: the minimization process leads to more than minimizing the empirical risk, i.e., . Instead, it minimizes the capacity of the estimation function to provide a suitable prediction when a new observation (out of sample) is introduced and that is given by the appearance of the regularization term, that is which bounds the fat-shattering dimension (PAC bound). The minimization of this bound corresponds to the objective of the regression problem associated with Support Vector Regression (SVR).
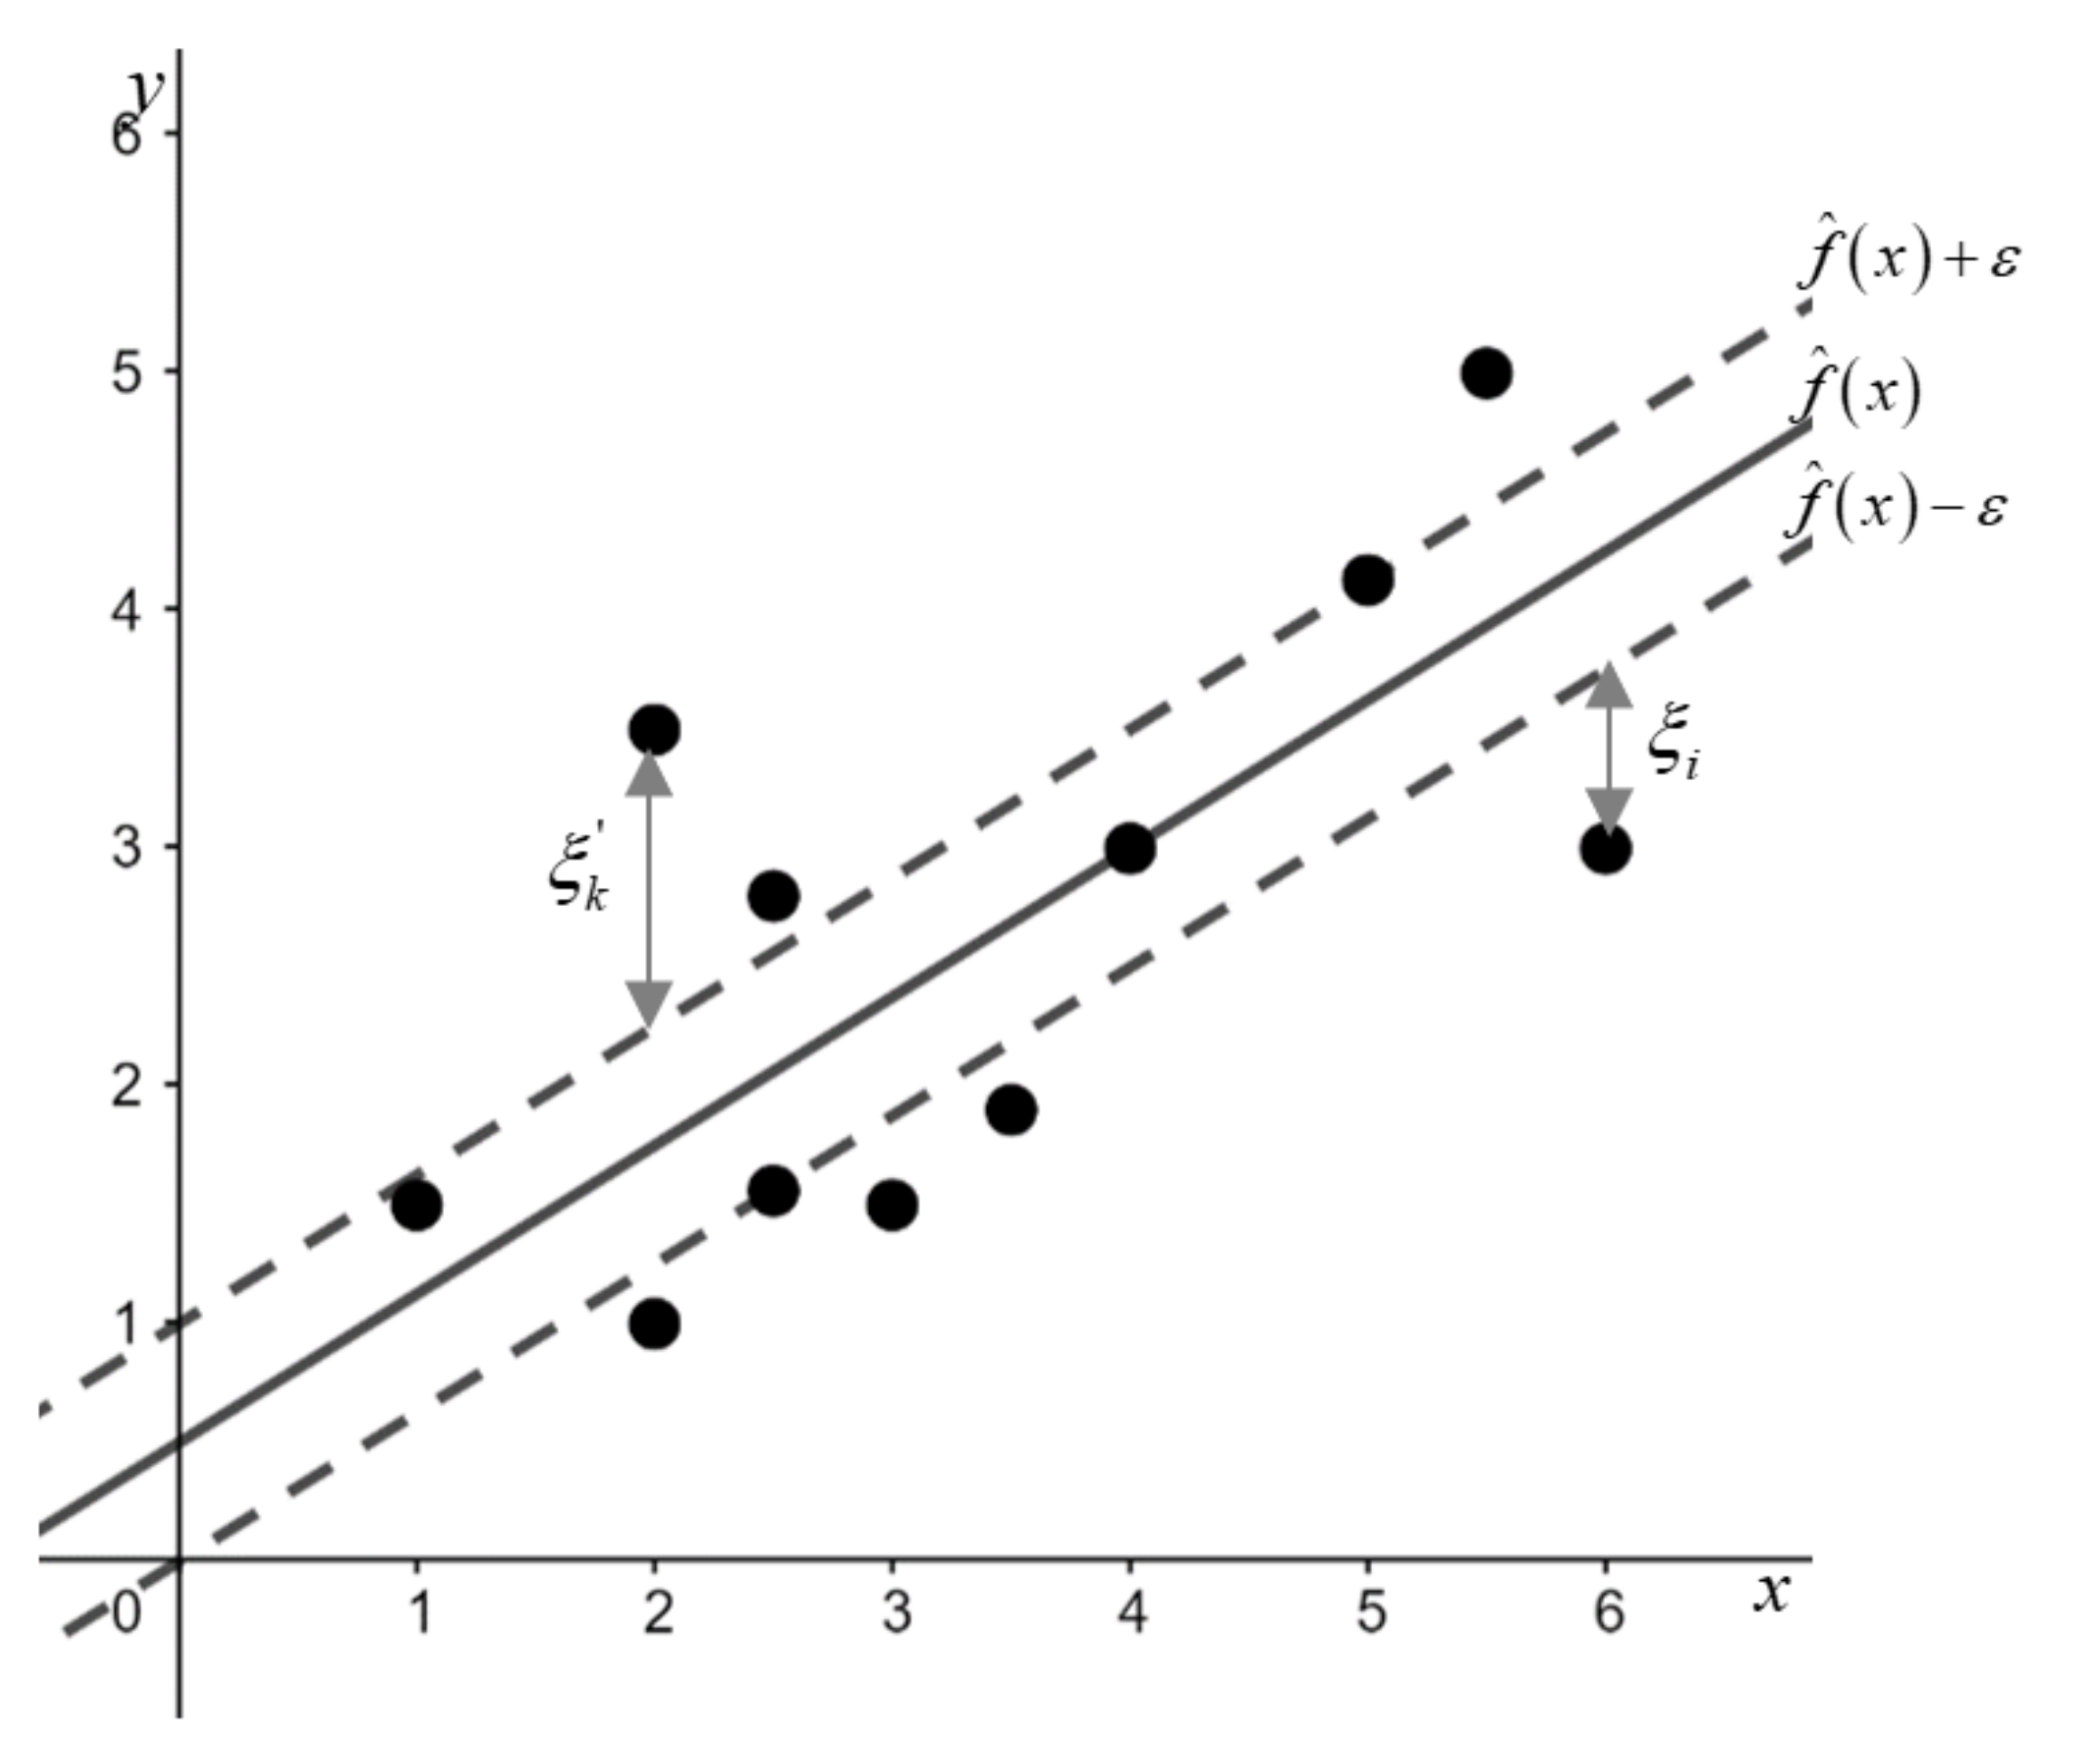
Support Vector Regression (SVR), as with any regression approach, attempts to construct a function that is capable of predicting the behavior of the response variable under the study. SVR sets out to predict the value of a continuous response variable given a vector of covariables . Hence, SVR establishes a function such that, given , yields the response variable prediction. Under the SVR principle, the linear predictor can be defined as , where and are optimal solutions of the optimization model below:
In performing this methodology, the values of and are obtained by a cross-validation process. The SVR yields an estimator of the response variable given as well as lower and upper ‘correcting’ surfaces, defined as and , where is a margin that enhances the estimator linked to SVR with robustness (see Figure 1). Additionally, observations below the surface reveal an associated (empirical) error of (with ), while observations above the surface present an (empirical) error of (with ). Observations between the surfaces and reveal an error of zero (with ). The objective function, however, represents the combination of regression and regularization involved in SVR, combining the empirical error term and the regularization term through a weight , thus balancing both components (Vazquez and Walter [20]). Moreover, although hyperplanes are linear in shape, it must be highlighted that SVR is able to generate estimation functions that are not necessarily linear in the original space, and that can be achieved by using a transformation function , a conversion arising from the covariable space, . Figure 1 shows the solution of the linear estimator achieved by an SVR model, as well as the graphical representation of the residuals (empirical error) for two points and the hyperplanes that define the margins (dashed lines).
The next subsection explains how Data Envelopment Analysis (DEA) works.
2.2. Data Envelopment Analysis (DEA)
Let us consider the observation of Decision Making Units (DMUs). takes up amounts of inputs to generate amounts of outputs. The relative efficiency of each unit in the sample is evaluated by referring to the so-called production possibility set or technology, which is essentially the set of producible bundles of . It is generally defined as:
Under Data Envelopment Analysis (DEA) (Charnes et al. [5] and Banker et al. [6] and more recently, Villa et al. [21], Sahoo et al. [22], and Amirteimoori [23]), is usually assumed to satisfy free disposability with regard to inputs and outputs; that is, if , then with and . Convexity of T is also generally assumed (see, e.g., Färe and Primont [24]).
Insomuch as the measurement of technical efficiency is concerned, a certain subset of is of interest. We allude to the weakly efficient set of , defined as (Let and . Then, means for all ). Some authors (see, for example, Briec and Lesourd [25]) define technical efficiency as the distance from a point in to the weakly efficient set.
When , this context is confined to the central concept of production function . Accordingly, input variables are used to yield a univariate output, and hence, we can define the technology as:
According to the selected distance for measuring technical inefficiency, different DEA models emerge (Cooper et al. [26]). The directional distance function (DDF) is a relevant example of them. For inputs and one output, resorting to the directional vector , where and , the DDF problem has the following structure when the efficiency level of is assessed, :
Given that (6) is a linear program, we can equivalently solve its corresponding dual formulation:
DEA models must be solved for each , , in the sample.
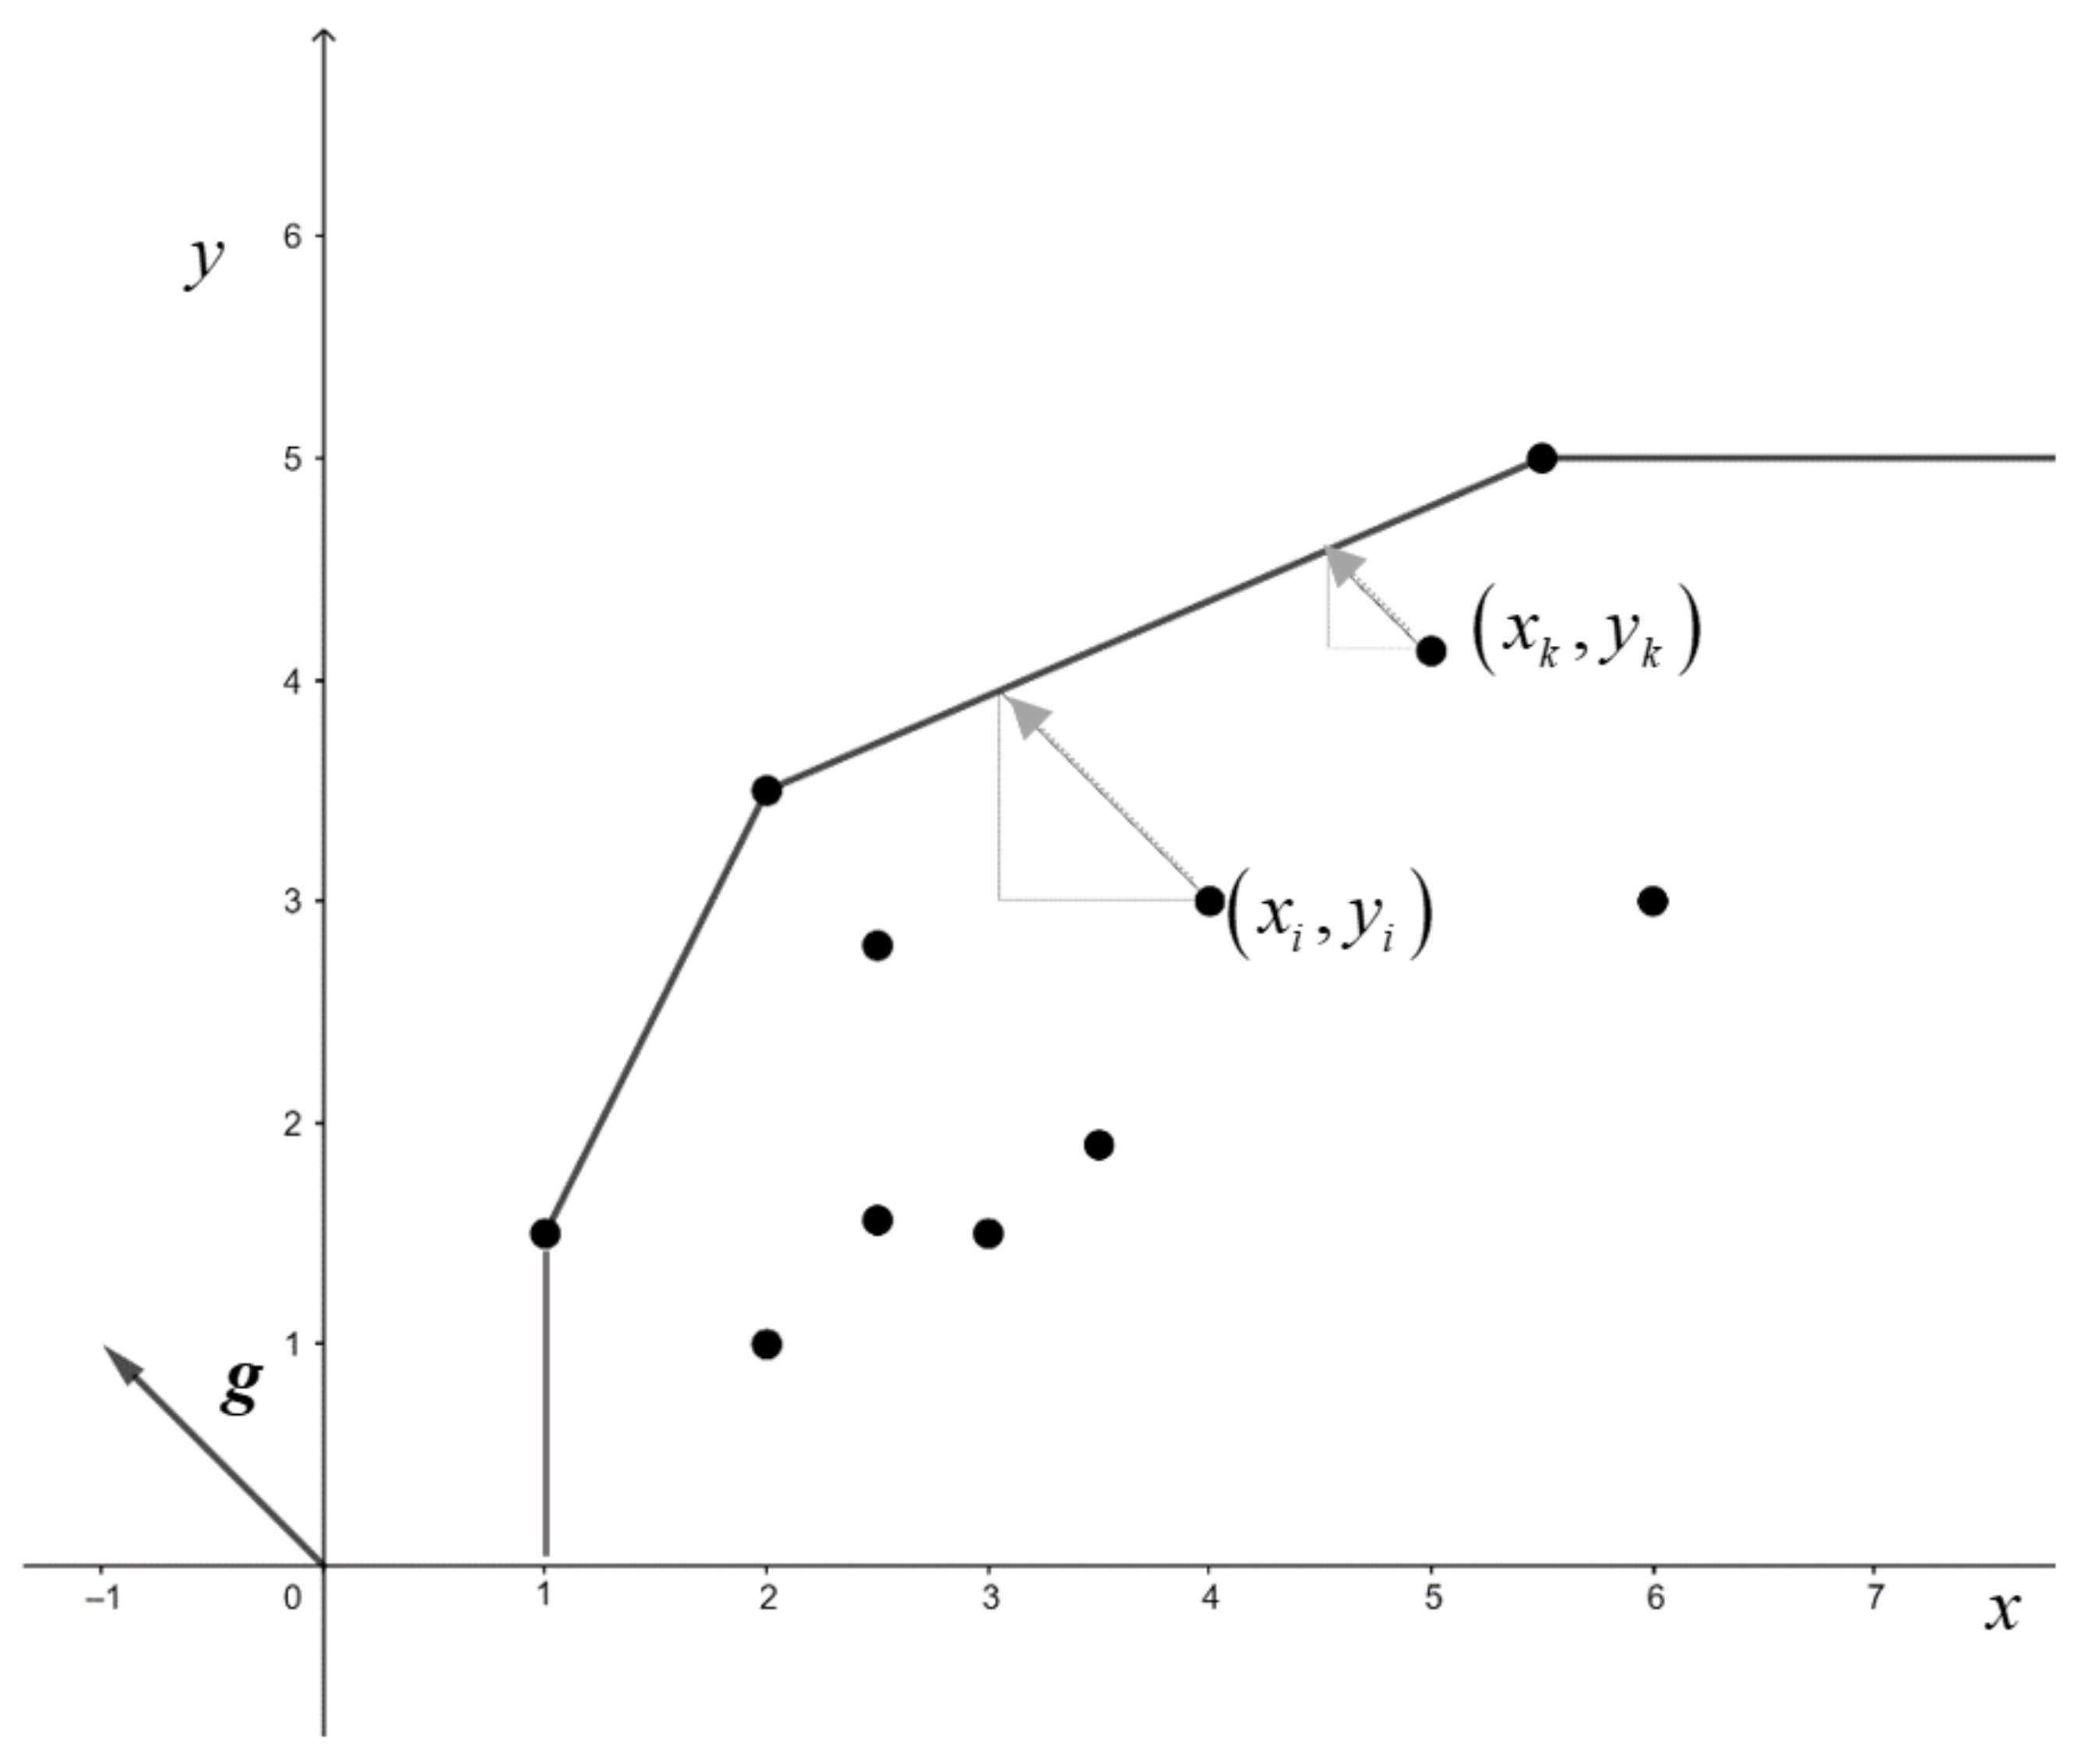
Figure 2 shows an example of the DDF model with a distance vector . Note that DEA generates a piece-wise linear technology (the region below the line), satisfying free disposability in inputs and outputs and convexity. Note also that the DEA estimate envelops all the observations from above. In this case, with , the DDF coincides with a particular distance between data and : the -distance (Briec [27] and Briec and Lesourd [25]).
In this paper, our purpose is to construct a method that generates piece-wise linear frontiers as in Figure 2, by implementing the minimization of the generalization error of the model.
3. New PAC Learning with Piece-Wise Linear Hypothesis
This section revolves around two stages in the search for the generalization error bound: the first stage is based on the construction of the class of piecewise linear hypotheses whose elements are hyperplanes that are located as close as possible to the data sample through , and the second stage is based on the construction of the bound of the fat-shattering dimension of the class of hypothesis constructed in the first stage. The minimization of the bound of the expected error using the bound of the fat-shattering dimension calculated gives rise to the Data Envelopment Analysis-based Machines (DEAM) model as a method for estimating piecewise linear production functions, which minimizes the generalization error as well as the empirical error.
To obtain this bound of the class of functions of our interest, we must derive the fat-shattering dimension bound for the hypothesis class with the piece-wise structure we desire. Then, minimizing the generalization error will be implemented through the minimization of the fat-shattering dimension bound. For this task, a previous step must be taken: a class of piece-wise linear hypothesis must be defined. A piece-wise linear hypothesis target is defined by a combination of hyperplanes that are selected to evaluate the data depending on their input values. The hyperplanes will be defined for each input value as follows:
Then, if we suppose , , each output value estimation through the set of hyperplanes can be written as a function of the input value vector :
with and . The value of , in our case, is chosen by considering two desired conditions that are inherited from production theory:
and
Condition (8) ensures that the estimation of the output value associated with an input will be always non-negative. Additionally, condition (9) guarantees that the estimation through the hyperplane is less or equal than the estimation through any other hyperplane . Condition (9) is the one that imposes concavity on the model. This type of condition was the key for stating concavity in the general multiple-regressor modeling in microeconomics (Afriat [28]; Kuosmanen et al. [13]). In particular, if the production function is concave, then the technology defined from this production function is convex.
The function class of piece-wise linear hypothesis can be constructed as follows:
Now, we can proceed with the second step: to establish a bound for the fat-shattering dimension of this function class to control the generalization error. Before proving the main theorem of this section, we need to state a necessary technical lemma. In the results, is the radius of the ball centered in that bounds the input data in the data sample.
Lemma 3.
If an input learning sample, is -shattered through defined in (10), then every subset satisfies
Proof.
See Appendix A. ☐
Next, we prove the main theorem of this section. In particular, we state the bound for the fat-shattering dimension for piece-wise linear hypothesis classes.
Theorem 3.
Let be the ball of radius and center in , i.e., , and let the hypothesis class be as follows
then
Proof.
See Appendix A. ☐
The next section involves the task of achieving a model that minimizes the established generalization error through the -distance.
4. Data Envelopment Analysis-Based Machines (DEAM)
Data Envelopment Analysis-based Machines (DEAM) can be defined from the idea of minimizing the expected error proposed in (1). If we do not consider the logarithmic factors, we can directly focus on minimizing in this expression, for which a bound on the generalization error has been found in the case of the piece-wise linear hypothesis class defined in (12):
Because of the complexity of implementing an optimization model in which the objective function has the aim of minimizing the above bound, we will break up the minimization of the whole bound into different objectives, which will be collected in an aggregation function that will conform the objective function of the final optimization program associated with DEAM, which will be shown later in this section.
Once the number of different hyperplanes in each hypothesis is set as the number of elements in the learning sample , minimizing the bound of the fat-shattering dimension requires minimizing part in (14). This is equivalent to maximizing . Regarding this last expression, we must maximize the numerator and minimize the denominator, as follows:
- (i)
- The vector of coefficients (slopes) corresponding to the hyperplane is . We can consider, without loss of generality, that . Then, minimizing , is equivalent to minimizing since , . Focusing on that last equivalence, this objective can be directly translated into minimizing .
- (ii)
- Maximizing with a fixed value of the margin is equivalent to minimizing . Because of , by minimizing in (i), at the same time, the maximization of the elements is achieved. In this way, it is only necessary to minimize to maximize .
Finally, a way of implementing (i) and (ii) is minimizing , where , ,. Accordingly, minimizing the bound of the fat-shattering dimension, , leads to minimizing , where and is a parameter to be tuned by, for example, a cross-validation process. As a loss function we use the following: . Finally, the objective function has the following structure:
Accordingly, we introduce the optimization model that defines DEAM:
Model (16) determines a maximum of different hyperplanes. The intersection of the half-spaces defined from these hyperplanes gives rise to the estimator of the underlying (convex) production technology. The number of hyperplanes to be considered in the implementation of the DEAM model can be seen as a key parameter of our approach since the results could be different depending on it. However, we suggest using n hyperplanes, which coincide with the number of DMUs. This is due to the experimental evidence found in the simulation study carried out in Section 5. We analyzed 2000 databases, and in all these cases, the number of hyperplanes at optimum were less than the number of DMUs in the corresponding data sample. This situation can be identified because some hyperplanes are repeated at the optimal solution of each problem.
Let us now explain each constraint of model (16) in detail. Constraints (16.1) and (16.2) come from , ,, respectively. The norm is used to be consistent with constraint (16.8). Additionally, this type of norm is associated with the definition of linear constraints, which are easier to be solved from a computational point of view. Constraint (16.3) is equivalent to , , i.e., it ensures that the hyperplanes envelop the data sample from above. Condition (16.4) forces that the hyperplanes are monotonic non-decreasing and will be responsible for the satisfaction of the property of free disposability, as we will show later in the text (see Proposition 2 below). Constraints (16.5), (16.6), (16.7), and (16.8) allow for characterizing as . The parameter will be chosen by cross validation. Let us now interpret specifically the value at optimum of the decision variable . Let us pay attention to constraint (16.5). If , then since is minimized in the objective function. In this way, considering (16.8), (16.3) and , can be interpreted as the -distance from the observation to the hyperplane :
where (Mangasarian [29]). If , then by (16.7) and the minimization of . Additionally, regarding the value of , , by constraints (16.3), (16.6), and the minimization of , we obtain for all at optimum. This point has computational implications on the model since constraint (16.6) can be removed from it because (16.3) holds. Finally, constraint (16.9) guarantees that, for each in the data sample, the hyperplane of the piece-wise linear production function associated with that point is the closest one to . Note that constraint (16.9), by (16.3) and (16.8), is equivalent to writing (see Mangasarian [29]).
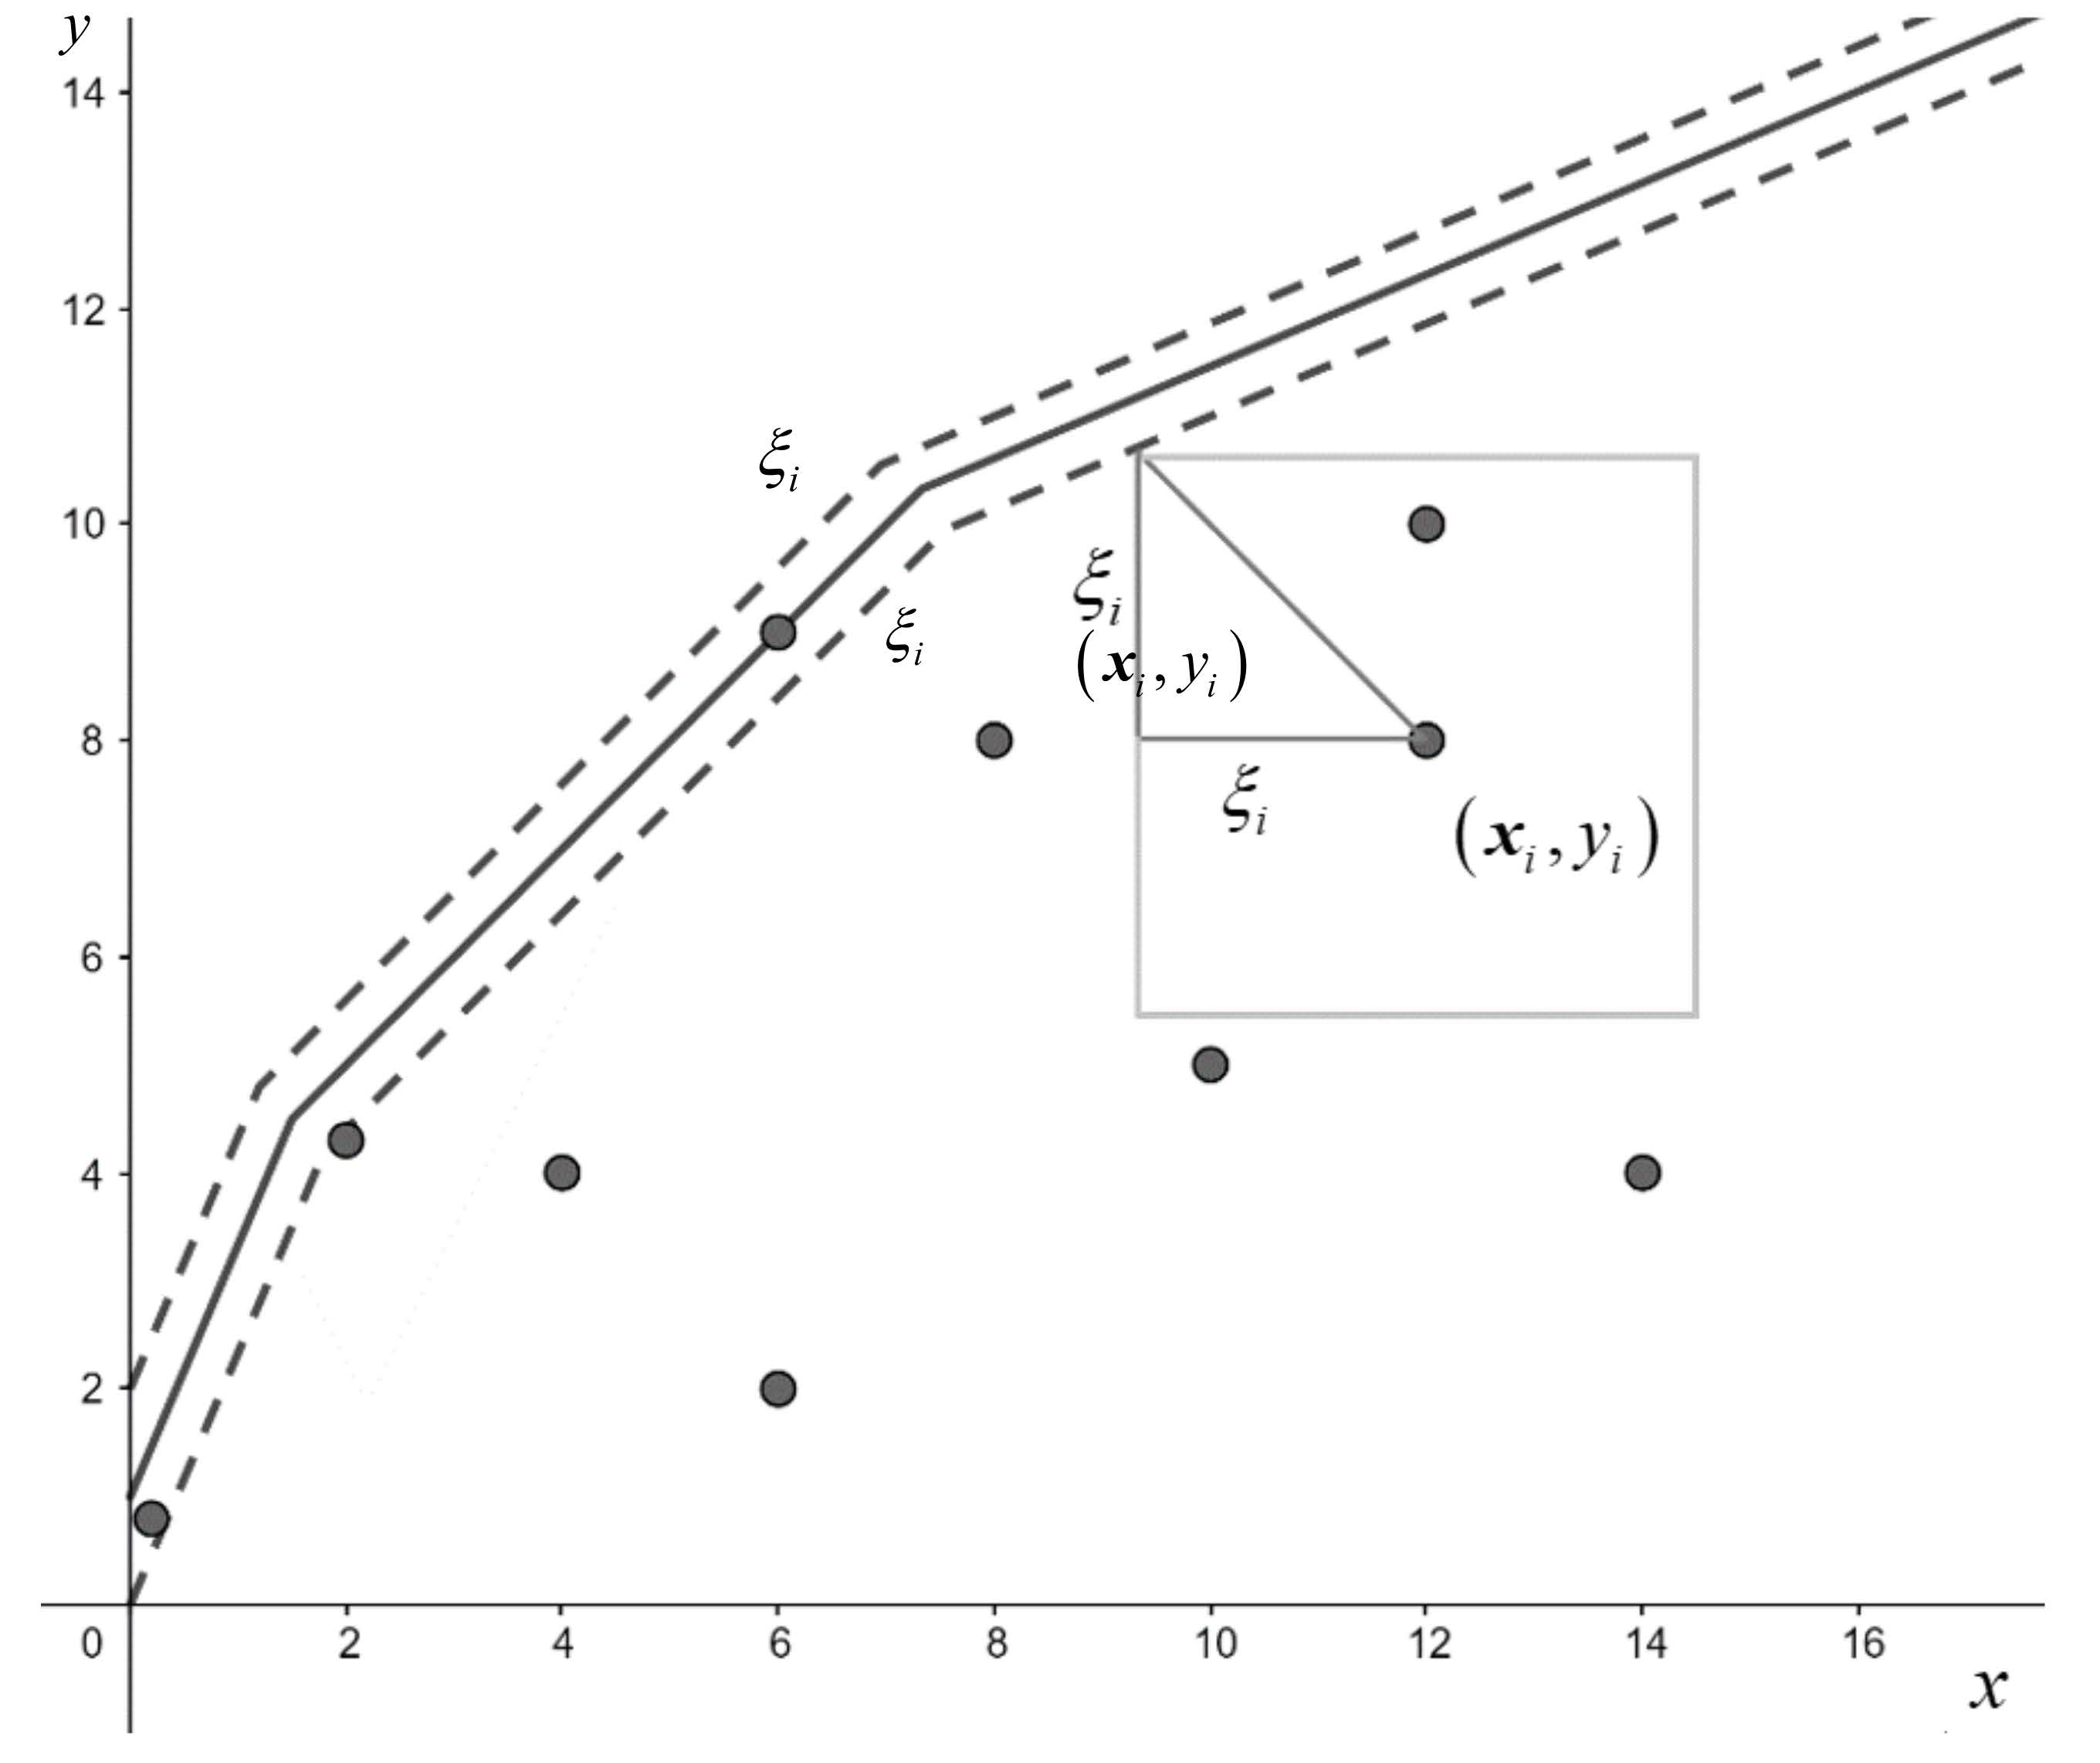
Figure 3 shows the shape of the function that will be generated by the model as an estimate of the underlying production function. Note that the estimate satisfies monotonicity and concavity, as happens with the DEA estimator. However, the DEAM estimator does not satisfy minimal extrapolation. Additionally, it implements a certain idea of robustness because of the margin notion inherited from SVR. Additionally, Figure 3 shows the possible interpretation of as . In particular, is the ‘radius’ of the squared ball in the figure.
As the technology generated by DEA, DEAM provides a piece-wise linear technology that can be defined as , given an optimal solution of model (16).
The next propositions state that the derived technology from model (16) satisfies convexity and free disposability.
Proposition 1.
is a convex set.
Proof.
The intersection of half-spaces is a convex set. ☐
Proposition 2.
satisfies free disposability in inputs and outputs.
Proof.
The result holds because for all (see Kuosmanen and Johnson [13]). ☐
Additionally, by constraint (16.3), we have that , . Therefore, for any observation , we have that , , which implies that since . In this way, we can establish the following corollary.
Corollary 1.
The production possibility set generated by DEA is a subset of the production possibility set generated by DEAM.
Proof.
The result holds because the production possibility set generated by DEA and the production possibility set yielded by DEAM satisfy convexity, free disposability, and contain all observations, but only the technology related to DEA meets minimal extrapolation. ☐
In this way, we have that DEAM does not satisfy the minimal extrapolation principle, but its associated estimation of the technology always contains the observations.
As for the measurement of technical inefficiency of the observations, due to the nature of the technique used and based on the original ideas derived from Support Vector Regression, any located within the margin will be identified as technically efficient (with ). Otherwise, i.e., if is located below the margin (see Figure 3), we have that is the -distance from the observation to the (efficient) frontier of a ‘robust’ technology. This robust technology is defined by the translation of the original technology downward following the value of the margin . If we define this translated technology as , then (this result can be derived from Aparicio and Pastor [30]).
Now, we show the relationship between the Directional Distance Function (DDF) in DEA, model, and the DEAM model (16): The DDF model always yields a feasible solution of the model associated with Data Envelopment Analysis-based Machines.
Theorem 4.
Let be a set of optimal solutions of model (7) for each DMUi, i = 1, …, n. Then, , with , , , , is a feasible solution of model (16).
Proof.
and
and,
Let be a set of optimal solutions of model (7) for each DMUi, i = 1, …, n. By the characterization of and as and , the following inequalities are true:
Then, satisfies (16.1) and (16.2) in the DEAM model. Because of the fact that is a set of optimal solutions of model (7) for each DMUi, i = 1, …, n, the constraints of this model are satisfied for this solution:
Then, trivially satisfies (16.3), (16.4) and (16.8) in the DEAM model. Because of the definition of the variables and as , , , we have that:
, and . Then, satisfies (16.5) and (16.6) in the DEAM model. Additionally, we have
Constraint (22) is satisfied by (19.1), and (23) is trivially satisfied. Then, satisfies (16.7) in the DEAM model. Finally, the objective in (7) is to minimize , ,
that implies
Then, satisfies (16.9) in the DEAM model. Consequently, is a feasible solution of (16). ☐
However, it can be shown that the DDF model (7) does not always yield an optimal solution of model (16).
5. Computational Experience
This section compares the performance of DEA and DEAM for estimating production functions. For this task, we designed five typical production scenarios in Table 1.
The simulations implement Cobb–Douglas production functions, which are frequently used in econometrics for establishing the relation between the maximum amount of outputs that can be produced from a set of inputs. Thereby, scenario I implements a mono-input mono-output case, while the other scenarios represent multi-input mono-output cases. For each scenario, we ran 100 trials with sample sizes: . The inputs were calculated randomly from . For simulating inefficiencies, we selected a random distribution for Mean squared error (MSE) and bias were the two measures employed to assess the performance of each method.
The DEAM model (16), as other machine learning techniques, needs to find the best model through a cross-validation process. For this task and exclusively for the DEAM model, we implemented a five-fold cross validation using a certain grid of hyperparameters. This grid was arbitrarily set as: and . Note that DEA does not need to apply a cross-validation process. Instead, DEA uses the whole dataset to evaluate efficiency scores.
Table 2 sums up the results obtained for each scenario when DEA (without cross validation) and DEAM (with cross validation) are applied. The first two columns present the type of scenario and the sample size. The following columns show the mean and standard deviation (in brackets) of MSE obtained by DEA and DEAM. Fraction of trial reports the proportion of trials in which DEAM either improves upon or equals the MSE given by the DEA method, while the next column illustrates the percentage of improvement of DEAM with respect to DEA. The four subsequent columns are similar to the previous ones, but with regard to bias.
Regarding the results, the DEAM method performed better than DEA, with improvements ranging from 5% to 45% on average in MSE and 2% to 28% in bias. This fact increased when the number of inputs were higher. In addition, the results illustrate how the model worked better when the number of DMUs was around 50–75. Scenario I, i.e., the single input single output framework, shows small differences between the two methods. Nevertheless, in the trials, DEAM outperformed DEA in more than 95% of the cases. In contrast, the best analyzed situation was scenario V (one output and five inputs) with , showing a 45% reduction in MSE and 28% in bias, on average. This last result could be interpreted in favor of the DEAM approach as an indication that DEAM also seemed to outperform DEA with respect to the curse of dimensionality (Charles et al. [31]).
6. Discussion
In this section, we briefly discuss the main results of this paper and how they can be interpreted from the perspective of previous studies, mainly those based on Data Envelopment Analysis. Our findings and their implications are also discussed. Some limitations of our approach are highlighted.
In this paper, we have introduced a new way of estimating production frontiers in engineering and microeconomics, which is based upon the same fundamentals of Support Vector Machines (SVM), which is a well-known machine learning technique. Our numerical results have demonstrated that the frontier estimator derived from the new methodology (DEAM) is better than that associated with Data Envelopment Analysis (DEA), which represents the standard non-parametric technique for determining technical efficiency in the literature. The bias and mean squared error obtained for DEAM are smaller in all the scenarios analyzed, regardless of the number of variables and DMUs.
In comparison with the standard literature, the new methodology is more flexible. It generates production possibility sets that satisfy convexity, free disposability in inputs and outputs, and contain all the observations, but they do not meet the postulate of minimal extrapolation. In contrast, DEA satisfies all the above properties. In particular, minimal extrapolation is the reason why DEA can be seen as an overfitted model to estimate the underlying Data Generating Process (DGP) that is behind the generation of the data sample. DEAM does not suffer from this overfitting problem. However, it is not evident where the production possibility set, estimated by a non-overfitted model, should be located in the input–output space to correctly approximate the underlying technology, which, by definition, is unknown to us. In this regard, in this paper, we have implemented for the first time a strategy based on the idea of Structural Risk Minimization (Vapnik [1]) and cross validation, introducing a new PAC (Probably Approximately Correct) bound in production theory with the aim of solving the overfitting problem linked to DEA.
Some other authors have tried to modify the standard DEA technique such that the new approaches work as inferential methods (with the focus on the DGP) rather than as mere descriptive tools. For example, Banker and Maindiratta [8] and Banker [9] associated DEA with maximum likelihood. Simar and Wilson [10,11,12] adapted bootstrapping to DEA. Kuosmanen and Johnson [13,14] introduced the Corrected Concave Nonparametric Least Squares. Unfortunately, despite the importance of machine learning techniques in the current literature, there have been few attempts to adapt DEA to the field of machine learning (see, for example, Esteve et al. [7], or Olesen and Ruggiero [15]). In this sense, DEAM has allowed us to build a new bridge between these two worlds: machine learning and efficiency measurement.
Finally, we would like to highlight a clear limitation associated with the new approach. DEAM is linked to an intensive computational procedure based on cross validation. This feature contrasts sharply with the simplicity of Data Envelopment Analysis.
7. Conclusions and Future Work
In this paper, for the first time, a bound on the generalization error for a piece-wise linear hypothesis has been established in the context of Support Vector Regression (SVR), by also considering typical axioms from production theory: convexity and free disposability. It shapes a new nexus between non-parametric frontier analysis and machine learning in the line recently followed by Esteve et al. [7], Valero-Carreras et al. [32], and Olesen and Ruggiero [15]. The new formulation on the bound of the generalization error of this kind of hypothesis gives rise to a new way of bounding the whole expected error when we approximate a target function through a piece-wise linear function, also controlling the empirical error. Minimizing this bound led to the definition of a new model, called Data Envelopment Analysis-based Machines (DEAM), which generates production function estimations that seek a balance between the empirical error and the generalization error.
Classical non-parametric techniques, such as DEA, suffer from the overfitting problem because they assume the axiom of minimal extrapolation (Banker et al. [6], Afriat [28], and Farrell [33]). The DEAM model, however, is more flexible when it comes to estimating production frontiers through a cross-validation process, disregarding the minimal extrapolation axiom, as was shown by a computational experience in this paper.
Finally, we finish by mentioning several lines that pose interesting avenues for further research. The first one is the possibility of extending the method to model multi-output situations. This could be interesting for dealing with more realistic production situations, considering information on the correlation among several outputs. Second, we could use other transformation functions (kernel methods) for the input space, in the same way as standard Support Vector Regression.
Author Contributions
Conceptualization, N.M.G. and J.A.; methodology, N.M.G. and J.A.; software, D.V.-C.; validation, N.M.G. and D.V.-C.; formal analysis, N.M.G., J.A. and D.V.-C.; investigation, N.M.G., J.A. and D.V.-C.; resources, N.M.G., J.A. and D.V.-C.; data curation, N.M.G. and D.V.-C.; writing—original draft preparation, N.M.G., J.A. and D.V.-C.; writing—review and editing, N.M.G., J.A. and D.V.-C.; visualization, N.M.G. and D.V.-C.; supervision, J.A.; project administration, J.A.; funding acquisition, J.A. All authors have read and agreed to the published version of the manuscript.
Funding
This research was funded by Ministerio de Ciencia e Innovación/Agencia Estatal de Investigación/10.13039/501100011033 grant number PID2019-105952GB-I00, by Generalitat Valenciana grant number ACIF/2020/155, and by Miguel Hernández University of Elche grant number 01623/2020.
Acknowledgments
The authors are grateful to the two anonymous reviewers for providing constructive comments and helping in improving the contents and presentation of this paper. Additionally, the authors are thankful for grant PID2019-105952GB-I00 funded by Ministerio de Ciencia e Innovación/Agencia Estatal de Investigación/10.13039/501100011033. D. Valero-Carreras is thankful for the financial support from the Generalitat Valenciana under grant ACIF/2020/155. Finally, N. Guerrero is thankful for the financial support from the Miguel Hernández University of Elche under grant 01623/2020.
Conflicts of Interest
The authors declare no conflict of interest.
Appendix A
Proof of Lemma 3.
witnessed by . Then, for all , there are , and satisfying for all the following inequality:
that is
is satisfied . Finally,
and by (A2), the following inequality holds:
and then,
which implies that
that is,
and then, we have
Let be -shattered by
Let set , and consider two cases:
- Case 1: If , then if and only if
- Case 2: If , then if and only if
Let us suppose that , with if and only if (CASE 1). For all , we have
Then, taking the sum over the elements in the set , we obtain the expression which yields the following inequality:
From , we have , for all . Thereby, the inequality
Now, let , then
Then,
Following the idea of applying the summary of elements, but now considering the inequality holds. It can be rewritten as
Now, there is such that for all . Consequently, we have that . because is the cardinal of the set . Conversely, by definition of . Then, . Now, we can guarantee that
Considering inequalities (25) and (28), for , we have that (.)
Under the supposition in the case 1 that , we have that
Therefore, for , we have
Under the Cauchy–Schwarz inequality, we have
In this way, it is possible to obtain
Because and , then
Finally,
The proof for case 2 is analogous. ☐
Proof of Theorem 3.
for every subset , with being an input learning sample -shattered through defined in (10). Additionally, by Lemma 2, for all with for , some satisfies the following condition:
☐
By Lemma 3, we have
Then, for certain , we have
Therefore,
Finally,
Because this is true for all
-shattered by , it will be also true for the largest set -shattered by , which means that will be bound in that way:
References
- Vapnik, V. Statistical Learning Theory; Wiley: New York, NY, USA, 1998. [Google Scholar]
- Vapnik, V. Principles of risk minimization for learning theory. In Advances in Neural Information Processing Systems; Morgan Kaufmann Publishers Inc.: San Francisco, CA, USA, 1992; pp. 831–838. [Google Scholar]
- Blanco, V.; Puerto, J.; Salmerón, R. Locating hyperplanes to fitting set of points: A general framework. Comput. Oper. Res. 2018, 95, 172–193. [Google Scholar]
- Blanco, V.; Puerto, J.; Rodriguez-Chia, A.M. On lp-Support Vector Machines and Multidimensional Kernels. J. Mach. Learn. Res. 2020, 21, 14. [Google Scholar]
- Charnes, A.; Cooper, W.W.; Rhodes, E. Measuring the efficiency of decision making units. Eur. J. Oper. Res. 1978, 2, 429–444. [Google Scholar] [CrossRef]
- Banker, R.D.; Charnes, A.; Cooper, W.W. Some models for estimating technical and scale inefficiencies in data envelopment analysis. Manag. Sci. 1984, 30, 1078–1092. [Google Scholar] [CrossRef] [Green Version]
- Esteve, M.; Aparicio, J.; Rabasa, A.; Rodriguez-Sala, J.J. Efficiency analysis trees: A new methodology for estimating production frontiers through decision trees. Expert Syst. Appl. 2020, 162, 113783. [Google Scholar] [CrossRef]
- Banker, R.D.; Maindiratta, A. Maximum likelihood estimation of monotone and concave production frontiers. J. Product. Anal. 1992, 3, 401–415. [Google Scholar] [CrossRef]
- Banker, R.D. Maximum likelihood, consistency and data envelopment analysis: A statistical foundation. Manag. Sci. 1993, 39, 1265–1273. [Google Scholar] [CrossRef]
- Simar, L.; Wilson, P.W. Sensitivity analysis of efficiency scores: How to bootstrap in nonparametric frontier models. Manag. Sci. 1998, 44, 49–61. [Google Scholar]
- Simar, L.; Wilson, P.W. A general methodology for bootstrapping in non-parametric frontier models. J. Appl. Stat. 2000, 27, 779–802. [Google Scholar]
- Simar, L.; Wilson, P.W. Statistical inference in nonparametric frontier models: The state of the art. J. Product. Anal. 2000, 13, 49–78. [Google Scholar] [CrossRef]
- Kuosmanen, T.; Johnson, A.L. Data envelopment analysis as nonparametric least-squares regression. Oper. Res. 2010, 58, 149–160. [Google Scholar] [CrossRef] [Green Version]
- Kuosmanen, T.; Johnson, A. Modeling joint production of multiple outputs in StoNED: Directional distance function approach. Eur. J. Oper. Res. 2017, 262, 792–801. [Google Scholar]
- Olesen, O.B.; Ruggiero, J. The hinging hyperplanes: An alternative nonparametric representation of a production function. Eur. J. Oper. Res. 2022, 296, 254–266. [Google Scholar]
- Vapnik, V. The Nature of Statistical Learning Theory; Springer: New York, NY, USA, 1995. [Google Scholar]
- Valiant, L.G. A theory of the learnable. Commun. ACM 1984, 27, 1134–1142. [Google Scholar]
- Cristianini, N.; Shawe-Taylor, J. An Introduction to Support Vector Machines and Other Kernel-Based Learning Methods; Cambridge University Press: Cambridge, MA, USA, 2000. [Google Scholar]
- Bartlett, P.; Shawe-Taylor, J. Generalization Performance of Support Vector Machines and Other Pattern Classifiers. Adv. Kernel Methods Support Vector Learn; MIT Press: Cambridge, MA, USA, 1999; pp. 43–54. [Google Scholar]
- Vazquez, E.; Walter, E. Multi-output suppport vector regression. IFAC Proc. Vol. 2003, 36, 1783–1788. [Google Scholar] [CrossRef]
- Villa, G.; Lozano, S.; Redondo, S. Data envelopment analysis approach to energy-saving projects selection in an energy service company. Mathematics 2021, 9, 200. [Google Scholar] [CrossRef]
- Sahoo, B.K.; Saleh, H.; Shafiee, M.; Tone, K.; Zhu, J. An Alternative Approach to Dealing with the Composition Approach for Series Network Production Processes. Asia-Pac. J. Oper. Res. (APJOR) 2021, 38, 2150004. [Google Scholar]
- Amirteimoori, A.; Sahoo, B.K.; Charles, V.; Mehdizadeh, S. Stochastic Network Data Envelopment Analysis. In Stochastic Benchmarking; Springer: Cham, Switzerland, 2022; pp. 77–117. [Google Scholar]
- Färe, R.; Primont, D. Distance functions. In Multi-Output Production and Duality: Theory and Applications; Springer: Dordrecht, The Netherlands, 1995; pp. 7–41. [Google Scholar]
- Briec, W.; Lesourd, J.B. Metric distance function and profit: Some duality results. J. Optim. Theory Appl. 1999, 101, 15–33. [Google Scholar]
- Cooper, W.W.; Seiford, L.M.; Tone, K. Data Envelopment Analysis: A Comprehensive Text with Models, Applications, References and DEA-Solver Software; Springer: New York, NY, USA, 2007; Volume 2. [Google Scholar]
- Briec, W. Hölder distance function and measurement of technical efficiency. J. Product. Anal. 1999, 11, 111–131. [Google Scholar]
- Afriat, S.N. Efficiency estimation of production functions. Int. Econ. Rev. 1972, 13, 568–598. [Google Scholar]
- Mangasarian, O.L. Arbitrary-norm separating plane. Oper. Res. Lett. 1999, 24, 15–23. [Google Scholar]
- Aparicio, J.; Pastor, J.T. A well-defined efficiency measure for dealing with closest targets in DEA. Appl. Math. Comput. 2013, 219, 9142–9154. [Google Scholar]
- Charles, V.; Aparicio, J.; Zhu, J. The curse of dimensionality of decision-making units: A simple approach to increase the discriminatory power of data envelopment analysis. Eur. J. Oper. Res. 2019, 279, 929–940. [Google Scholar]
- Valero-Carreras, D.; Aparicio, J.; Guerrero, N.M. Support vector frontiers: A new approach for estimating production functions through support vector machines. Omega 2021, 104, 102490. [Google Scholar]
- Farrell, M.J. The measurement of productive efficiency. J. R. Stat. Soc. Ser. A 1957, 120, 253–281. [Google Scholar]
Figure 1.
Support Vector Regression.

Figure 2.
Illustration of the Directional Distance Function in Data Envelopment Analysis.

Figure 3.
Illustration of the DEAM estimation of a production function.


Table 1.
Simulated scenarios.
| Scenario | Inputs | Production Function |
|---|---|---|
| I | ||
| II | ||
| III | ||
| IV | ||
| V |
Table 2.
Performance of DEA and DEAM.
| MSE | BIAS | ||||||||
|---|---|---|---|---|---|---|---|---|---|
| Fraction of Trials | Improvement (%) | Fraction of Trials | Improvement (%) | ||||||
| Scenario | Number of Obs. | DEA | DEAM | DEAM<= DEA | DEAM vs. DEA | DEA | DEAM | DEAM<= DEA | DEAM vs. DEA |
| I | 25 | 0.027(0.020) | 0.024(0.019) | 1.000 | 11.609% | 0.125(0.046) | 0.119(0.046) | 1.000 | 4.873% |
| I | 50 | 0.011(0.007) | 0.010(0.007) | 0.990 | 8.005% | 0.076(0.026) | 0.075(0.026) | 0.990 | 2.822% |
| I | 75 | 0.007(0.005) | 0.007(0.005) | 0.990 | 7.622% | 0.060(0.019) | 0.059(0.019) | 0.980 | 2.194% |
| I | 100 | 0.005(0.004) | 0.005(0.004) | 0.990 | 5.231% | 0.051(0.019) | 0.050(0.019) | 0.950 | 1.936% |
| II | 25 | 0.151(0.084) | 0.108(0.067) | 1.000 | 27.109% | 0.276(0.071) | 0.240(0.072) | 1.000 | 13.460% |
| II | 50 | 0.091(0.043) | 0.067(0.037) | 0.980 | 24.012% | 0.206(0.045) | 0.184(0.045) | 0.990 | 10.587% |
| II | 75 | 0.060(0.029) | 0.040(0.024) | 1.000 | 32.846% | 0.160(0.032) | 0.138(0.035) | 1.000 | 14.252% |
| II | 100 | 0.049(0.022) | 0.033(0.019) | 1.000 | 32.636% | 0.140(0.031) | 0.122(0.030) | 1.000 | 13.285% |
| III | 25 | 0.451(0.236) | 0.287(0.199) | 0.960 | 35.967% | 0.470(0.126) | 0.380(0.125) | 0.960 | 19.215% |
| III | 50 | 0.270(0.121) | 0.165(0.090) | 0.990 | 36.812% | 0.347(0.077) | 0.280(0.072) | 0.980 | 19.075% |
| III | 75 | 0.211(0.091) | 0.119(0.050) | 0.990 | 39.786% | 0.291(0.056) | 0.229(0.050) | 0.980 | 20.996% |
| III | 100 | 0.171(0.076) | 0.112(0.053) | 1.000 | 32.405% | 0.257(0.047) | 0.213(0.043) | 1.000 | 16.971% |
| IV | 25 | 1.046(0.457) | 0.804(1.070) | 0.880 | 14.949% | 0.727(0.177) | 0.623(0.264) | 0.860 | 12.086% |
| IV | 50 | 0.728(0.246) | 0.471(0.265) | 0.960 | 35.859% | 0.571(0.113) | 0.469(0.146) | 0.880 | 18.295% |
| IV | 75 | 0.605(0.191) | 0.384(0.154) | 0.990 | 35.084% | 0.497(0.079) | 0.403(0.079) | 0.960 | 18.539% |
| IV | 100 | 0.462(0.162) | 0.308(0.114) | 1.000 | 30.776% | 0.418(0.068) | 0.342(0.064) | 0.990 | 17.912% |
| V | 25 | 1.896(0.766) | 1.009(0.563) | 0.980 | 44.803% | 0.984(0.224) | 0.703(0.211) | 0.980 | 28.043% |
| V | 50 | 1.396(0.478) | 0.922(0.566) | 0.900 | 32.353% | 0.801(0.140) | 0.648(0.218) | 0.870 | 18.492% |
| V | 75 | 1.057(0.303) | 0.750(0.315) | 0.950 | 28.473% | 0.673(0.107) | 0.567(0.152) | 0.880 | 15.677% |
| V | 100 | 0.914(0.261) | 0.624(0.211) | 0.980 | 29.296% | 0.613(0.090) | 0.502(0.087) | 0.970 | 17.543% |
Publisher’s Note: MDPI stays neutral with regard to jurisdictional claims in published maps and institutional affiliations. |
© 2022 by the authors. Licensee MDPI, Basel, Switzerland. This article is an open access article distributed under the terms and conditions of the Creative Commons Attribution (CC BY) license (https://creativecommons.org/licenses/by/4.0/).
Share and Cite
MDPI and ACS Style
Guerrero, N.M.; Aparicio, J.; Valero-Carreras, D. Combining Data Envelopment Analysis and Machine Learning. Mathematics 2022, 10, 909. https://0-doi-org.brum.beds.ac.uk/10.3390/math10060909
AMA Style
Guerrero NM, Aparicio J, Valero-Carreras D. Combining Data Envelopment Analysis and Machine Learning. Mathematics. 2022; 10(6):909. https://0-doi-org.brum.beds.ac.uk/10.3390/math10060909
Chicago/Turabian StyleGuerrero, Nadia M., Juan Aparicio, and Daniel Valero-Carreras. 2022. "Combining Data Envelopment Analysis and Machine Learning" Mathematics 10, no. 6: 909. https://0-doi-org.brum.beds.ac.uk/10.3390/math10060909
Note that from the first issue of 2016, this journal uses article numbers instead of page numbers. See further details here.