1. Introduction
From 2021, the European Union (EU) requires its member states to guarantee that all new buildings will be nearly zero-energy buildings [
1]. This is expected to be a decisive movement towards a sustainable energy transition [
2]. To meet this goal, the use of proper building materials and renewable energy sources (RES) are encouraged [
3]. Similarly, in the research community, the adoption of such actions in areas with multiple buildings is also under investigation, through the smart city concept, while from an electric power perspective, such a structure could be regarded as a microgrid [
4,
5].
Microgrids are usually based on RES and correspond to a set of closely located distributed energy resources (DERs), including renewable energy sources, battery energy storage systems (BESS) and loads. Microgrids can operate either connected to the main electrical grid or in islanded mode. In the latter case (i.e., islanded mode), the BESS system is of crucial importance since it is responsible for maintaining a balance between the production and consumption of electricity [
6]. All these features require advanced control and protection devices, which contain the “smartness” of the microgrid operation.
University campuses are a promising application for the establishment of smart microgrids [
7,
8], while they could be also characterized as small-scale smart cities [
8], since they are formed by several adjacent buildings [
1]. Apart from the smart microgrid concept, the smart energy system concept has recently been introduced, with emphasis on HVAC needs and water consumption, further from the electrical energy vector [
1]. A thorough review of smart energy systems in university campuses is performed in [
1]. Nevertheless, the emphasis in this paper will be on the electrical energy vector and the concept of microgrids [
9], which can play a crucial role towards the energy transition of power systems [
2].
As is common in power system sizing studies, the first factor to be considered during a microgrid sizing study is the expected load to be supplied. The electrical load profile of university campuses is investigated in [
10], using the Democritus University of Thrace, Greece, as an example. Based on that case study, a simulation tool is developed for smart microgrids, which aims to minimize electricity cost and achieve optimal components sizing, in [
11]. The financial feasibility of campus microgrids is extensively investigated in [
7], where an economic model for the analysis and planning of microgrids and hybrid energy systems is proposed, while in [
8], a communication framework for the smart campus operation is presented. In fact, many case studies for the transition of campuses into smart campus microgrids have been reported, either focusing on the system sizing [
12], the energy management system [
13] or the different components under consideration [
14]. As discussed in [
15], many of the tools employed when a microgrid sizing or operational characterization has to be performed are based on optimization techniques.
Indeed, from an optimization perspective, the desired functionality of a microgrid is usually either to minimize the cost of electricity [
16], which can be achieved by a load curve optimization alleviating the peaks in load demand and hence avoiding the spikes in electricity price in hours of high system stress (load shifting), or possibly to govern the power flow through the microgrid/main grid tie-line for multiple objectives. In a microgrid under operation, these functionalities are usually governed through an energy management system (EMS) that gathers all the required measurements and data to perform the optimization-based control action [
17]. Note that similar objectives may also be considered during the preliminary sizing study of a microgrid, which is also usually performed through optimization techniques [
15].
To highlight the benefits of smart campus microgrids while aiming towards a sustainable energy transition, this paper will consider as a case study a campus on the island of Crete, Greece. Crete, in general, is an interesting case with a significant number of universities and research institutions. In particular, the island hosts four universities (Hellenic Mediterranean University, University of Crete, Technical University of Crete, Patriarchal University Ecclesiastical Academy of Crete), with a total of nine main campuses, as well as three independent research centers (Foundation of Research and Technology Hellas, Hellenic Centre for Marine Research, Orthodox Academy of Crete). Hence, there is a total of twelve campuses on the island. Thus, the results of this study could motivate all academic institutions on the island and play a vital role towards the energy transition, while also providing a useful case study for power systems with similar characteristics around the world. In particular, apart from the high density of university/research campuses, Crete has a high maximum load of almost 700 MW, especially due to the tourism industry that is active during the summer months. Crete also hosts a large capacity of renewable energy generation sources, especially through wind and sun. As it is a weakly interconnected insular power system, the maximum level of RES units has been reached and the installation of new ones for electricity generation is not allowed, until the new HVDC interconnection with the Hellenic Transmission System is established. Hence, novel concepts on the demand side, such as campus microgrids, will significantly support the grid operation reducing the load demand locally, especially in periods of high system stress.
In this paper, the smart campus microgrid concept is considered and its applicability towards a sustainable energy transition is emphasized through the performed case study. The case study investigates such an approach for the campus of the Hellenic Mediterranean University (HMU) in Heraklion, Crete, Greece. More specifically, the performance of the microgrid is examined for two operational cases: (1) HMU to act as an autoproducer and (2) the installation of an independent MV station between HMU load and the grid, which offers an increased power transfer capability. According to the microgrid optimal sizing results, based on financial or environmental indices, the cost of batteries seems to be a crucial factor; thus, a sensitivity analysis of the battery cost is also implemented. Additionally, through the sensitivity analysis, the impact of solar and wind potential is studied using weather data from university campuses located in northern Europe. Overall, it is shown that this kind of investment can be feasible for the second case of operation (MV station) and especially in areas that have a high RES potential, while it further supports the main power system with a significant load reduction and its behavior as a RES producer for many hours of the year. Moreover, due to the large number of university and research campuses on the island, the concept of campus microgrids can lead to significant effects in the plans for energy transition on the island of Crete, a fact that highlights the scope of this paper. To support the replicability of the performed case study in other areas with or without similar characteristics, policy directions that could make such investments sustainable are also highlighted.
This paper is organized as follows: In
Section 2, the concept of smart campus microgrids is reviewed and their benefits are categorized with regards to the possible directions through which their expansion could be facilitated. In
Section 3, an introduction to microgrid planning is performed. In
Section 4, the case study of this paper, which concerns the campus of HMU in Crete, is presented. Finally,
Section 5 concludes the paper.
3. Optimal Sizing during the Planning Procedure of Microgrids
With the aim of performing a case study that will justify the benefits of campus microgrids, a representative smart campus microgrid will be financially and environmentally sized in the next section. Note that a crucial component of microgrids, that usually take care of the power balance in the islanded mode or of the optimal operation in the grid-connected mode, is the BESS. Hence, apart from the microgrid planning, optimization becomes a vital tool for the real-time microgrid operation too, since the operation of the BESS is subject to strict constraints that need to be considered during the microgrid operation. These constraints mainly relate to the acceptable state of charge (SOC) ratios of the BESS unit and their capacity. With regards to the BESS control hierarchy, the inner control algorithm of a BESS unit is described in [
24]. Then, the bidirectional converter responsible for interfacing the battery to the grid controls the power flow, usually based on an outer voltage control scheme, while also respecting the SOC limits. On top of this local control action, an EMS is used to optimize the overall microgrid operation, as previously explained [
6,
30].
It is clear that optimization in microgrids has different applications at different stages, i.e., the planning and the operation. The different microgrid planning problems are reviewed in [
15], with the most important being the microgrid sizing, sitting and scheduling issues, which can all be addressed through optimization techniques. In this paper, emphasis is given on the sizing part of the planning procedure instead of the operational EMS development [
13,
31]. Conventionally, the sizing of microgrids has been performed through software tools such as HOMER [
32]. Optimization in HOMER is implemented through complete enumeration, which ensures that the solution is the optimal one, based on the measured or estimated load, but it can be very time-consuming in complex problems that contain many alternative combinations. Complete enumeration will be also used in the simple in-house optimizer of this paper, as the RES-based examined systems consist of three components (photovoltaics, wind turbines and BESS units), and the optimal solution is obtained after only a few minutes of simulation runs.
4. Planning of a Smart Campus Microgrid in Crete
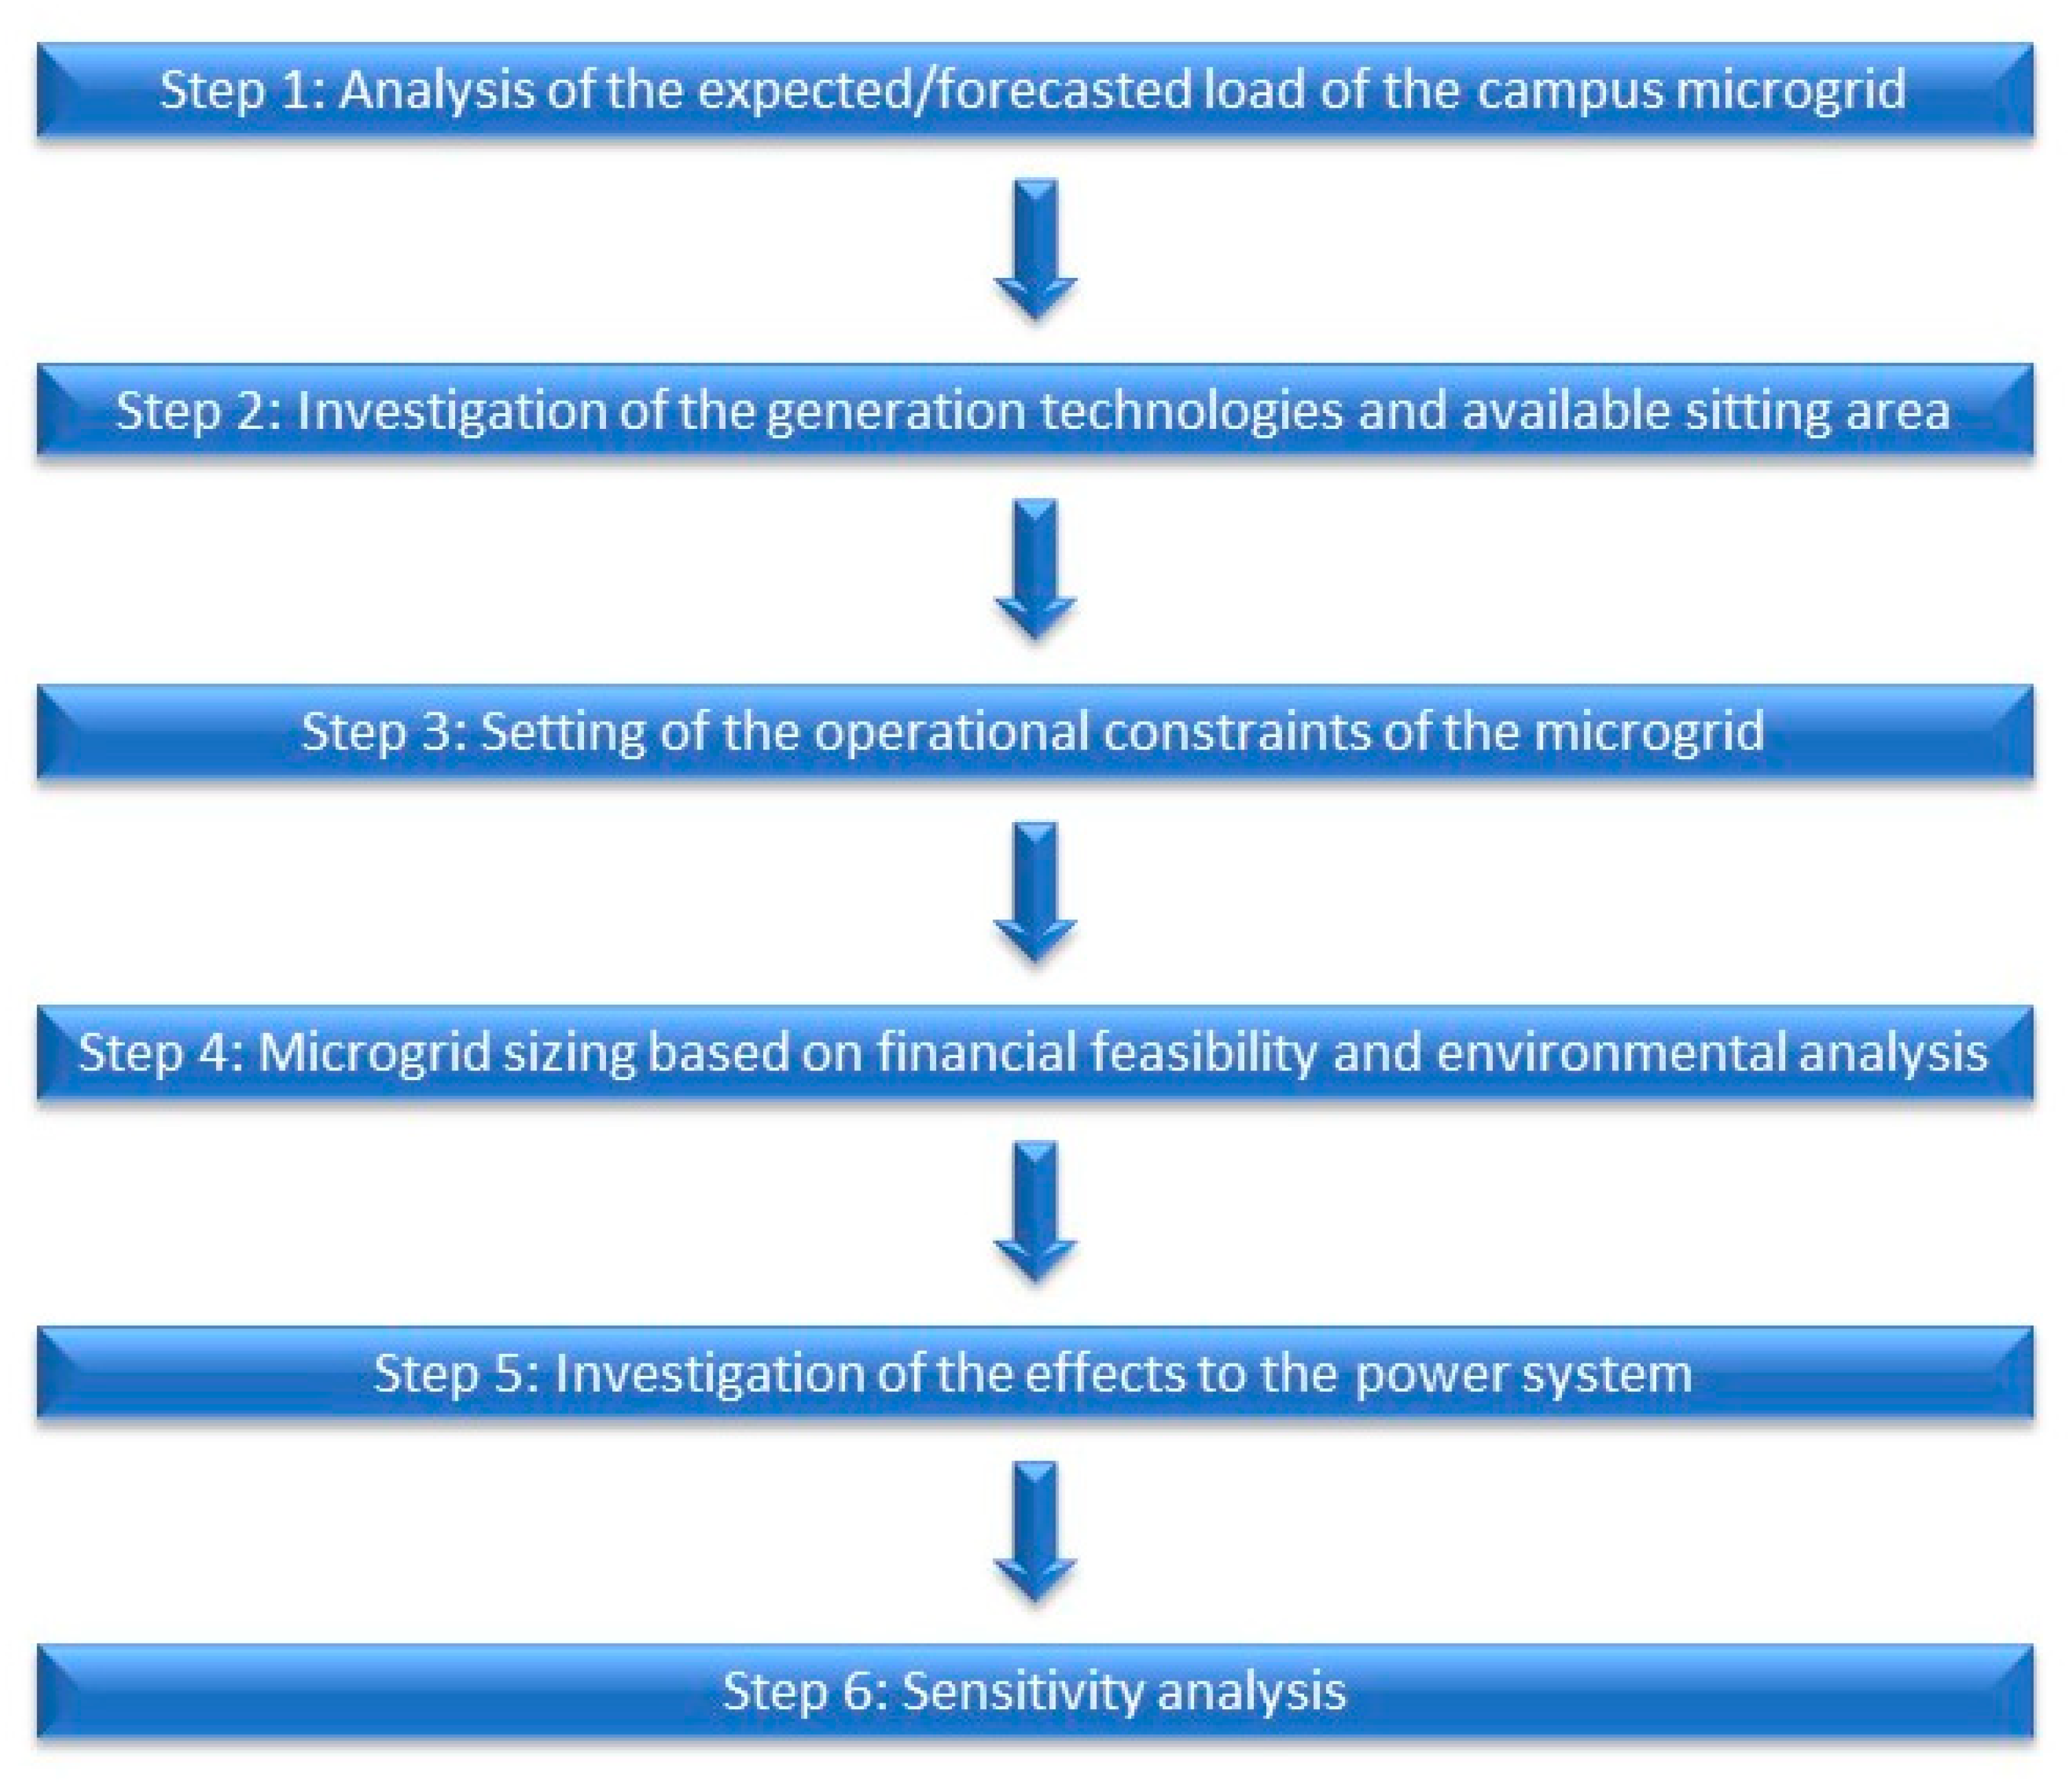
In this section, the planning in terms of sizing of a smart campus microgrid in Crete will be performed, with the aim of showcasing the benefits that it can bring to the environment, the power system and the institution in financial terms. The methodology that will be followed for the case study of this paper is highlighted in the flow chart of
Figure 1, while a sensitivity analysis will be further performed, considering the weather data of the microgrid and the cost of the storage system.
The Hellenic Mediterranean University is a young university on the island of Crete, Greece. HMU consists of five campuses in the major cities of Crete (Heraklion, Chania, Rethymno, Agios Nikolaos and Siteia). Among the five campuses, the Heraklion campus hosts the largest number of academic departments and students. Moreover, the Heraklion campus is home to the Laboratory of Energy and Photovoltaic Systems (LEPS) and to the Institute of Environment, Energy and Climate Change (IEECC) of the university’s research center, i.e., institutions that perform teaching and research in the smart grids area.
4.1. Data Elaboration
An analysis of the load profile of the HMU campus in Heraklion, in its current state, is presented in this section. The analysis is based on hourly data of the campus’s load demand during the year 2020–2021 (which is the first 12-month period that such data were stored), referring to its (main) grid power supply at medium voltage level (20 kV). At the moment, the overall electricity demand of the campus is exclusively serviced from the main electrical grid. Therefore, the aim is to significantly reduce the demand supplied from the electrical grid, taking as input the data of the following study.
Figure 2 shows the hourly time series of load demand for the HMU campus, with the average value of load demand being equal to 167.49 kW. The peak load demand is equal to 394.65 kW and was observed during a cold winter day in January. However, the corresponding value for the summer period is only 9.85 kW less than the season peak (384.8 kW), which shows that the load demand depends, at a significant level, on the needs for heating and cooling. It is worth mentioning that the peak load demand for each month is observed during 10 am–2 pm, which are working and teaching hours. From the duration curve of
Figure 3, it can be concluded that for over half of the year’s hours, the load demand exceeds 150 kW.
As previously mentioned, a factor affecting the campus’s energy consumption is the weather conditions. July, with 144,652 kWh, is the month with the highest total energy consumption, as shown in
Figure 4. The neutral climate conditions, in combination with the public holidays due to the Orthodox Easter, make April the month with the lowest energy consumption (107,987.05 kWh). Similar results are also obtained for August due to the summer holidays that are generally applied to all levels of education, including universities and research centers.
Figure 5 shows that the highest energy consumption appears on weekdays instead of weekends mainly due to the usage of academic premises (teaching rooms, offices). However, there are no significant variations in the rate of consumption between weekdays. Making a step forward, the hours of the day with the highest energy consumption are the three hours of 12–3 pm which account for 16.15% of the annual energy consumption, as shown in
Figure 6. Thus, the utilization of PV technology seems to be an ideal means of electrical energy saving for the examined load profile.
4.2. DERs Considerations
Indeed, based on the estates’ department sitting areas investigations, the HMU campus microgrid could include photovoltaic (PV) systems, small wind turbines (WT) and batteries. Thereafter, all implemented calculations are based on components’ technical data and HMU meteorological data, provided on an hourly basis.
Regarding the PV array, its output power
PPV (kW) is calculated from [
33]:
where is the
fPV is the PV derating factor which accounts for losses related to dust cover, aging and the unreliability of the PV array;
PSTC (kW) is the peak power of the PV array;
GA is the global solar radiation incident on the PV array (kW/m
2);
GSTC = 1 kW/m
2 is the solar radiation under PV Standard Test Conditions (STC);
TC is the temperature of the PV cells (°C);
TSTC is the PV temperature under STC (25 °C) and
CT is the PV temperature coefficient (–0.36%/°C). The value of
fPV is considered to be 0.90.
TC can be estimated from the ambient temperature
Tα (°C) and the global horizontal solar irradiance G (kW/m
2) [
34]:
where
NOCT is the normal operating cell temperature, which is considered equal to 42 °C. From the description above, the needed weather data for
PPV estimation are global horizontal solar irradiance G and ambient temperature
Tα. Global solar radiation incident on the PV array (
GA) is calculated from the HDKR model [
35], which for each hour takes into account the current value of
G, the orientation of the PV array, the location on the Earth’s surface, the time of year and the time of day.
Regarding the small WT, the Aeolos-H 60 kW model is considered. Its rated power is on the upper bound of small WTs according to the Greek Legislative Framework. Moreover, this model has a large diameter (22.3 m) considering its rated power. This characteristic provides improved performance of the WT for small and medium wind speeds, which are typical in most of the university campuses.
Figure 7 shows the power curve of this WT. The required weather data for WT estimation include wind speed, which has been measured at a 10 m height. In order to estimate wind speed at WT hub height (30 m), the power law has been used with a power law exponent equal to α = 1/7, which is a typical value for flat terrain [
36].
For the BESS components, two alternative container models provided by Narada were examined and compared. Both models have an installed capacity of 250 kWh, installed power of 500 kW and efficiency of 98.5%. The first model is a lead–carbon battery with an expected life of 5000 daily cycles (around 15 years) operating at 40% depth of discharge (DOD). The second model is a lithium battery with an expected life of 6000 daily cycles (around 18 years) operating at 60% DOD.
The basic financial and technical characteristics of the above-mentioned components are summarized in
Table 1. In all cases, the lifetime of the project is considered equal to the batteries’ lifetimes.
4.3. Load Considering Electric Vehicle Charging
The evaluation of the HMU campus microgrid is based on its current electric load consumption, with the addition of 20 electric vehicle (EV) chargers of 7 kW AC. The estimation of the additional load due to EV charging in a university campus took into account information of arrival time at the Campus (85% of arrivals are between 7–9 am) [
38], EV charging time [
14] and reduced EV charging in certain periods of the year (weekends, Christmas and Easter vacations, July and August). The comparison of current and expected load duration curves is shown in
Figure 8. Most of the additional load consumption happens in the morning and noon hours. The study of the load curves shows that EV chargers increase the annual load consumption by 6% and the peak load demand by more than 17%.
4.4. Scenarios of HMU Microgrid Operation
Regarding the operation of the HMU campus microgrid, two cases were examined and compared: (1) HMU to act as an autoproducer and (2) installation of an independent MV station that contains PV/WTs and batteries as well as the university load. In the first case, the maximum power that can be exchanged with the grid is equal to the agreed power between the HMU and the power system operator (1000 kVA). Moreover, HMU purchases power at retail cost (80 EUR/MWh) and sells electricity to the grid at the system’s marginal price (SMP). In the second case, the maximum power that can be purchased or sold to the grid can be increased (in our case, it is considered equal to 2000 kVA). Moreover, grid purchases and grid sales are implemented in the system’s SMP.
Figure 9 shows the annual variation of the SMP for Crete Island. It must be noted that these values correspond to the autonomous operation of the Cretan power system. From late 2021, the first phase of Cretan interconnection (weak interconnection) with the Hellenic Transmission System is under operation. This project consists of the construction of 150 kV AC 2 × 200 MVA interconnection between Crete and the Peloponnese Peninsula. The second phase (strong interconnection) through 400 kV HVDC 2 × 500 MW interconnection is expected to start its operation in 2024.
4.5. Sizing and Financial Feasibility of the Campus Microgrid
The financial evaluation of alternative configurations of the HMU microgrid is implemented using the criterion of Net Present Value (NPV). The annual discount rate is equated to 6%, whereas the evaluation takes into account the capital costs, O&M costs and salvage values of the components, the new load demand, and the electricity purchases and sales with the main grid. The maximum WT number is set at 5 due to spatial constraints provided by the estates’ department. The step size for the PV array size is equated to 10 kWp.
Table 2 shows the optimal results for the autoproducer case. It can be seen that although there is no configuration with NPV > 0, optimal solutions tend to have large PV array sizes (1000 kWp is the maximum considered value), no WTs (although their installation does not significantly increase overall costs) and no batteries due to their high costs. Regarding energy storage installation, the most preferable option includes one battery container, 1000 kWp of PV and no WT, with NPV equal to EUR −148,055 for lead–carbon batteries and EUR −195,744 for lithium batteries.
The operation of the HMU microgrid considering the existence of a MV station requires battery installation, because its operation is based on purchasing electricity at a low SMP and selling electricity at a high SMP.
Table 3 shows the optimal results for this case. It can be seen that the best configurations have positive NPVs and tend to have large PV array sizes (2000 kWp is the maximum considered value due to spatial constraints), no WTs (although their installation does not significantly increase overall costs) and one container of lead–carbon batteries, which is their lowest possible size. The configuration with lithium batteries with the highest NPV contains 2000 kWp of PV, no WT and one battery container, with NPV equal to EUR 572,098.
Complementary to the aforementioned financial analysis, an environmental analysis is also implemented in relation to the annual greenhouse gas (GHG) emissions reduction in the entire insular power system of Crete, due to the installation of RES technologies (WTs and PVs) in the HMU microgrid. An important factor in this analysis is the definition of the fuel mix for electricity generation on the island of Crete. These data are shown in
Table 4 and refer to the year 2020, having been extracted from [
39]. The next step in the analysis is the calculation of the annual GHG emission reduction for each MWh that is generated from WTs and PVs in the HMU campus, which was provided by RETScreen 4.0 software [
40]. The results indicate that each MWh generated from RES technologies reduces the GHG emissions of the Cretan power system by 0.307 tCO
2(eq.)/year. The term (eq.) stands for equivalent and takes into account the emissions of other GHGs apart from CO
2, such as CH
4 and N
2O. The final step of the analysis relates to the estimation of a non-dominated solutions set according to financial and environmental criteria, i.e., NPV and annual GHG emissions reduction. This set consists of solutions that are better in one criterion and worse in the other criterion, and is also known as the Pareto-optimal set [
16].
Table 5 and
Table 6 present the Pareto-optimal sets for the two considered cases (autoproducer and MV station installation).
The results provided in
Table 5 and
Table 6 show that the optimal solutions of the Pareto-sets contain the maximum installed PV power for each case, whereas the addition of WTs in most cases reduces the NPV and increases the annual GHG emissions reduction. An exception to the latter is the installation of 3 and 4 WTs (for 1000 kWp installed PVs) in the autoproducer case, where the NPV is slightly smaller compared to this in the case of 5 WTs. The benefit of these Pareto-sets is that the optimal solution will be included in these independently of the criterion (or the combination of financial–environmental criteria) that will be used. For the analyses in the sequel of this article, the financially optimal solutions will be considered.
4.6. Effect to the Power System
Table 7 summarizes the annual simulation results for the financially optimal solutions of the autoproducer and MV station cases (second rows of
Table 2 and
Table 3). For the autoproducer case (no battery is included), it can be seen the surplus of PV generation over load demand on an annual basis is equal to the surplus of excess electricity over purchases from the grid (energy balance). In the case of the MV station installation, the lead–carbon battery can store electricity either from PVs or from the grid, depending on the hour of the day and the load demand characteristics.
Since all the results have considered an additional loading due to EV chargers,
Figure 10 shows the impact of EV chargers’ installation in the HMU campus compared to its current load demand (see
Figure 2), as it depicts the annual variation of the additional load taking into account the considerations of
Section 4.3. More specifically, the limited additional load around hour 3000 refers to Easter vacations and between hours 4000–6000 refers to the July and August reduced HMU operation, whereas the beginning and end of the year relates to Christmas vacations. On a typical weekday, the load addition can reach up to 120 kW for specific morning and midday hours.
Regarding the autoproducer case (considering the EV chargers’ operation) and for its financially optimal solution from
Table 2, an overall load reduction exists during daytime (when PVs generate electricity), whereas the maximum load reduction is observed during the hours of the year that the PVs are operating under conditions similar to STC (Standard Test Conditions: 1000 W/m
2 of solar irradiance and 25 °C of PV temperature). The maximum value of approximately 1000 kW is explained by the installed PV power (1000 kW
p).
Figure 11 shows the load duration curve that refers to an external transformer in the HMU campus microgrid. It can be seen that for approximately 3000 h of the year, the HMU microgrid exports electricity to the grid.
For the case of the MV bus installation and its financially optimal solution shown in
Table 3, the maximum overall load reduction is approximately double the previous case due to the double PV installed capacity (2000 kW
p).
Figure 12 shows the load duration curve that refers to an external transformer in the HMU campus microgrid. It can be concluded that the number of hours that the microgrid exports electricity to the grid is slightly increased, while the amount of maximum power that is exported is also approximately double.
Based on the above results, the HMU campus microgrid acts as a RES producer for many hours during the year, hence ensuring a decrease in grid congestion and therefore supporting the overall power system operation, apart from driving the energy mix to a greener manner, which was highlighted in the previous section.
4.7. Sensitivity Analysis
From the results of
Section 4.5, it can be concluded that in both cases, the financially optimal solution contains the smallest available number of batteries. As a result, the cost of batteries is an essential factor affecting the results. According to recent studies [
41], the cost of utility-scale lithium batteries is expected to decrease by 50% by the end of this decade, so the effect of battery cost reduction by 25% and 50% is examined in
Table 8 and
Table 9, respectively. In the autoproducer case, the reduction of battery costs does not have any effect on optimal results, so the solutions are identical to these provided in
Table 2. Regarding MV station installation, the reduction of battery costs increases the NPV (as expected), though the configurations with the minimum available batteries number remain dominant.
An additional criterion that significantly affects the results is the campus microgrid location, since renewable energy production may vary significantly.
Table 10 presents these variabilities for three different university locations: (1) HMU in Heraklion, Crete, Greece; (2) Imperial College London, UK; and (3) Stockholm University, Sweden, assuming the HMU loading case, available space for RES and electricity prices. Data for London and Stockholm have been extracted from Typical Model Years (TMYs) provided by the PV-GIS software tool [
42].
Table 10 shows that HMU presents significantly better PV potential, whereas Stockholm University provides better WT electricity production.
Table 11 and
Table 12 provide the optimal results for HMU load (considering EV charging) using weather data from Imperial College and Stockholm University. The analysis of the results and the comparison with
Table 11 and
Table 12 show that the location of the microgrid plays a crucial role in the financial feasibility of its operation. Both locations have significantly lower solar potential compared to HMU and, as a result, all configurations for each case (autoproducer and MV station) have large negative NPVs. In all cases, the most dominant solutions contain large PV arrays and the lowest possible number of batteries. In the case of the MV station, lead–carbon batteries are preferable compared to lithium batteries.
The comparison of the two alternative cases shows that the installation of an MV station provides lower costs than the autoproducer operation. However, the differences in NPV between these two cases are small compared to the HMU campus. The effect of increased wind potential in Stockholm University is obvious in autoproducer results, as the optimal solutions contain a large number of WTs. In the MV station operation, the battery that helps to sell electricity at higher prices plays a more significant role than WT installation.
In summary, from the financial analysis of all case studies, it can be concluded that the autoproducer case is not economically viable, as it presents negative NPV even in the HMU campus microgrid, which presents the best combination of weather conditions from all examined locations. Moreover, these results do not depend on the expected battery cost reduction by the end of this decade, as they do not contain any electricity storage technology. Regarding the case of MV station installation, the variation of NPV is even larger for different locations and can provide significant financial benefits for the HMU case. The optimal solutions present a small number of batteries and the reduction of storage costs does not significantly improve the results.
5. Conclusions
Campus microgrids are a promising solution as nations move towards their energy transition. The significant benefits they bring can support their utilization around the world, while they can have a vital impact in areas with high RES potential and a high density of university and research campuses.
Indeed, in the performed case study, it was shown that campus location plays a significant role, while the MV station case is preferable to the autoproducer case (which always presents a negative NPV). In particular, in the case of Crete, the MV station case can provide positive financial results. In all cases (even in northern locations), PVs are the preferred RES technology due to their lower installation and O&M costs. Batteries are an expensive component, and even their expected cost reduction does not significantly changes the results. Finally, it was shown that a significant load reduction (for the main grid) is obtained through the development of the HMU campus microgrid, which also behaves as a RES electricity producer supporting the power system for many days of the year. This feature is especially important during hours of stress and in reducing the environmental burden, which was also observed through an elaborate environmental analysis.
Future research will focus on evaluating the total impact of all campuses in Crete towards the energy transition of the island, as well as investigating the impact of the COVID-19 pandemic on the load of the HMU campus and the relevant results of microgrid sizing.


