
3D22MX: Performance Subjective Evaluation of 3D/Stereoscopic Image Processing and Analysis

 , and
, and
Abstract
:1. Introduction
2. Related Work
- JPEG: Compression rate ranging from 0.244 bpp to 1.3 bpp.
- JPEG2000: Compression rate ranging from 0.16 bpp to 0.71 bpp.
- Sixty-degraded images in addition to six-original or source images.
- Average image size is 512 × 448 pixels viewed in standard resolution (without scaling, centered on the screen) at a resolution of 1024 × 768 on a 21″ Samsung Sync Master 1100 MB TV.
- Test is carried out based on recommendations of the ITU BT 500-11 [10], similar to the ITU BT 500-10 standard, containing aspects such as:
- -
- Monitor resolution.
- -
- Monitor contrast.
- -
- Source of the signals.
- -
- Selection of materials for the subjective study exam.
- -
- Range of conditions.
- Observer:
- -
- Examination session.
- -
- Presentation of results.
3. Materials and Methods
3.1. Human Stereoscopic Vision
3.2. Noises for Image Distortion
3.3. Scenario for 3D Image Capture
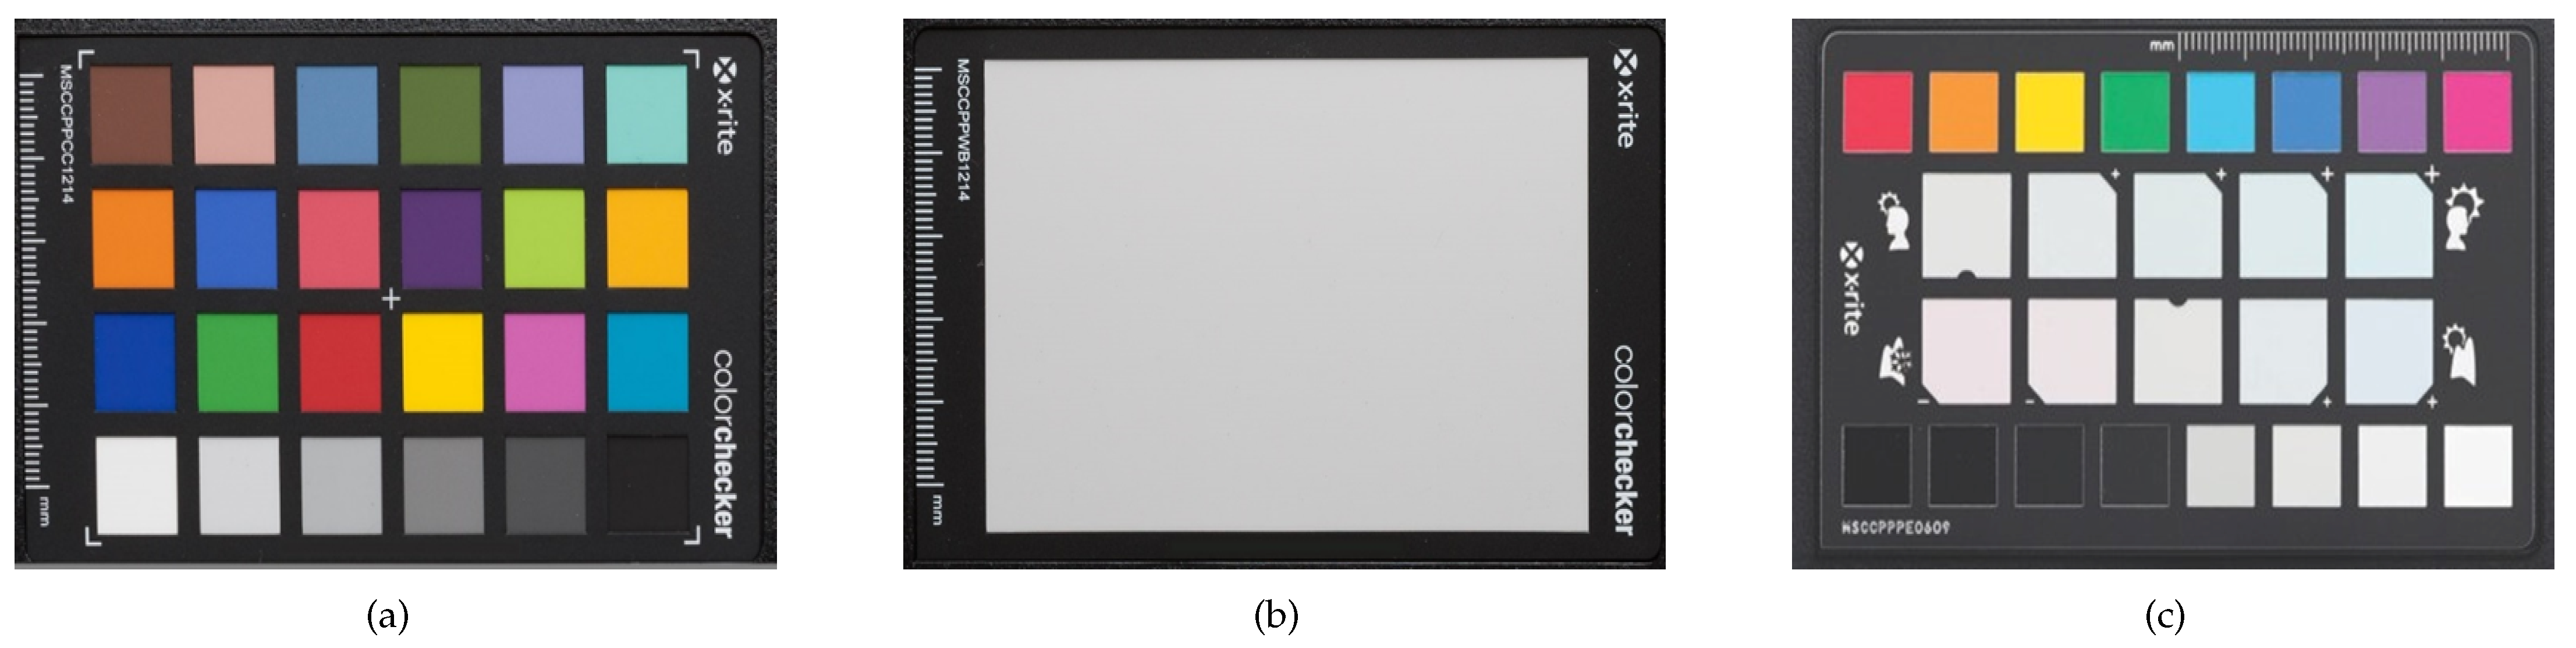
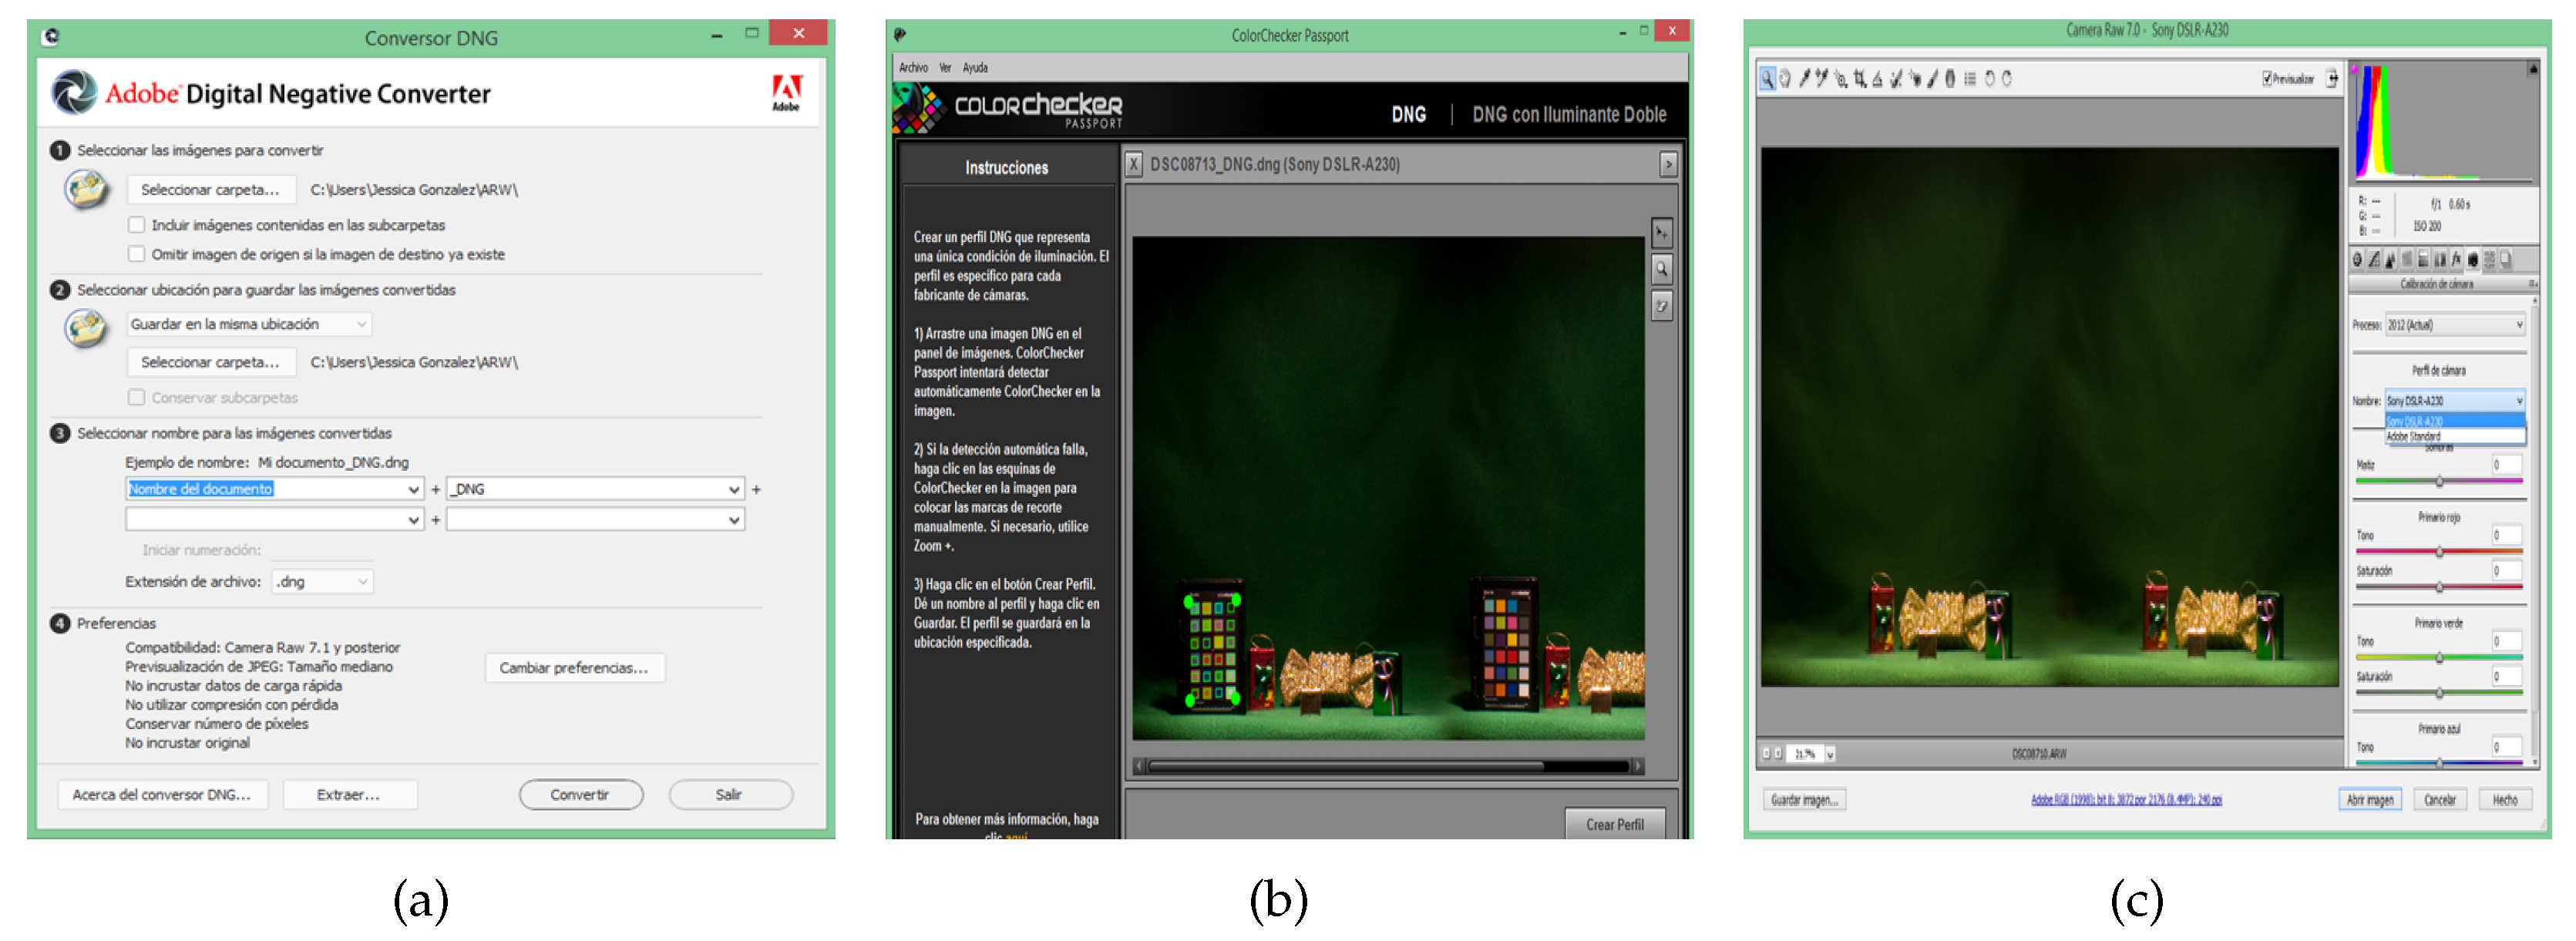
- Figure 7a depicts a classic CCP containing 24-color patches when combined with the camera-calibration software to produce DNG profiles, to respond to the lighting of the scene to achieve consistency, forecasting respectable results from image-to-image and camera-to-camera. This classic chart provides a visual color reference point, where each 24-color patch represents colors of natural objects, such as sky blue, skin tones, and leaf green; moreover, each patch reflects light as it is in its real equivalence. Moreover, each patch is individually colored using a solid shade to produce pure, flat, rich colors without smudges or mixing of dyes. In addition, this chart helps correct globally based on accurate information.
- Figure 7b shows the White-Balance chart, ensuring that the color captured is real and provides a reference point for post-capture editing. This chart is spectrally flat, facilitating a neutral reference through different lighting conditions encountered during the photographs capture. Light is reflected equally through the visible spectrum, creating a customized white balance in the camera to compensate correctly for the lighting variation. The White Balance chart allows one to eliminate the color tones and improve color preview on any screen for getting a more reliable histogram, producing faster color editing in post-production.
- Figure 7c shows the CCP Creative Improvement chart generated for high-level color creativity and workflow control. The enhancement chart includes four lines of colored patches designed for image editing. Whether shooting in a studio or in colorful nature, or in multiple scenes of photography events, CCP Creative Improvement is able to expand the powerful-photo editing software into a virtual Raw processing software. When cropping is needed, the improvement card highlights working in Raw. A cropped-patches line from the beginning to the end serves as a visual reference for judging, controlling, and editing images, to highlight shadow or crop details. Despite shadow or highlight details have been lost because the processing software has cropped them, they are still available in Raw file, and with a few adjustments, CCP Creative Improvement can recover them again. Moreover, trimmed patches are separated into two groups: (i) lighter and (ii) darker. The former is ordered with a third part of an F-Stop difference among them, while the latter are ordered the same, with an exception of the last patch due to it representing the blackest patch on the color-checker passport card. The exposure difference between the darkest and the next darkest patch is out one-tenth part of a Stop, and the chart’s dynamic range is 32:1 (5 Stop).
4. 3D22 Image Database
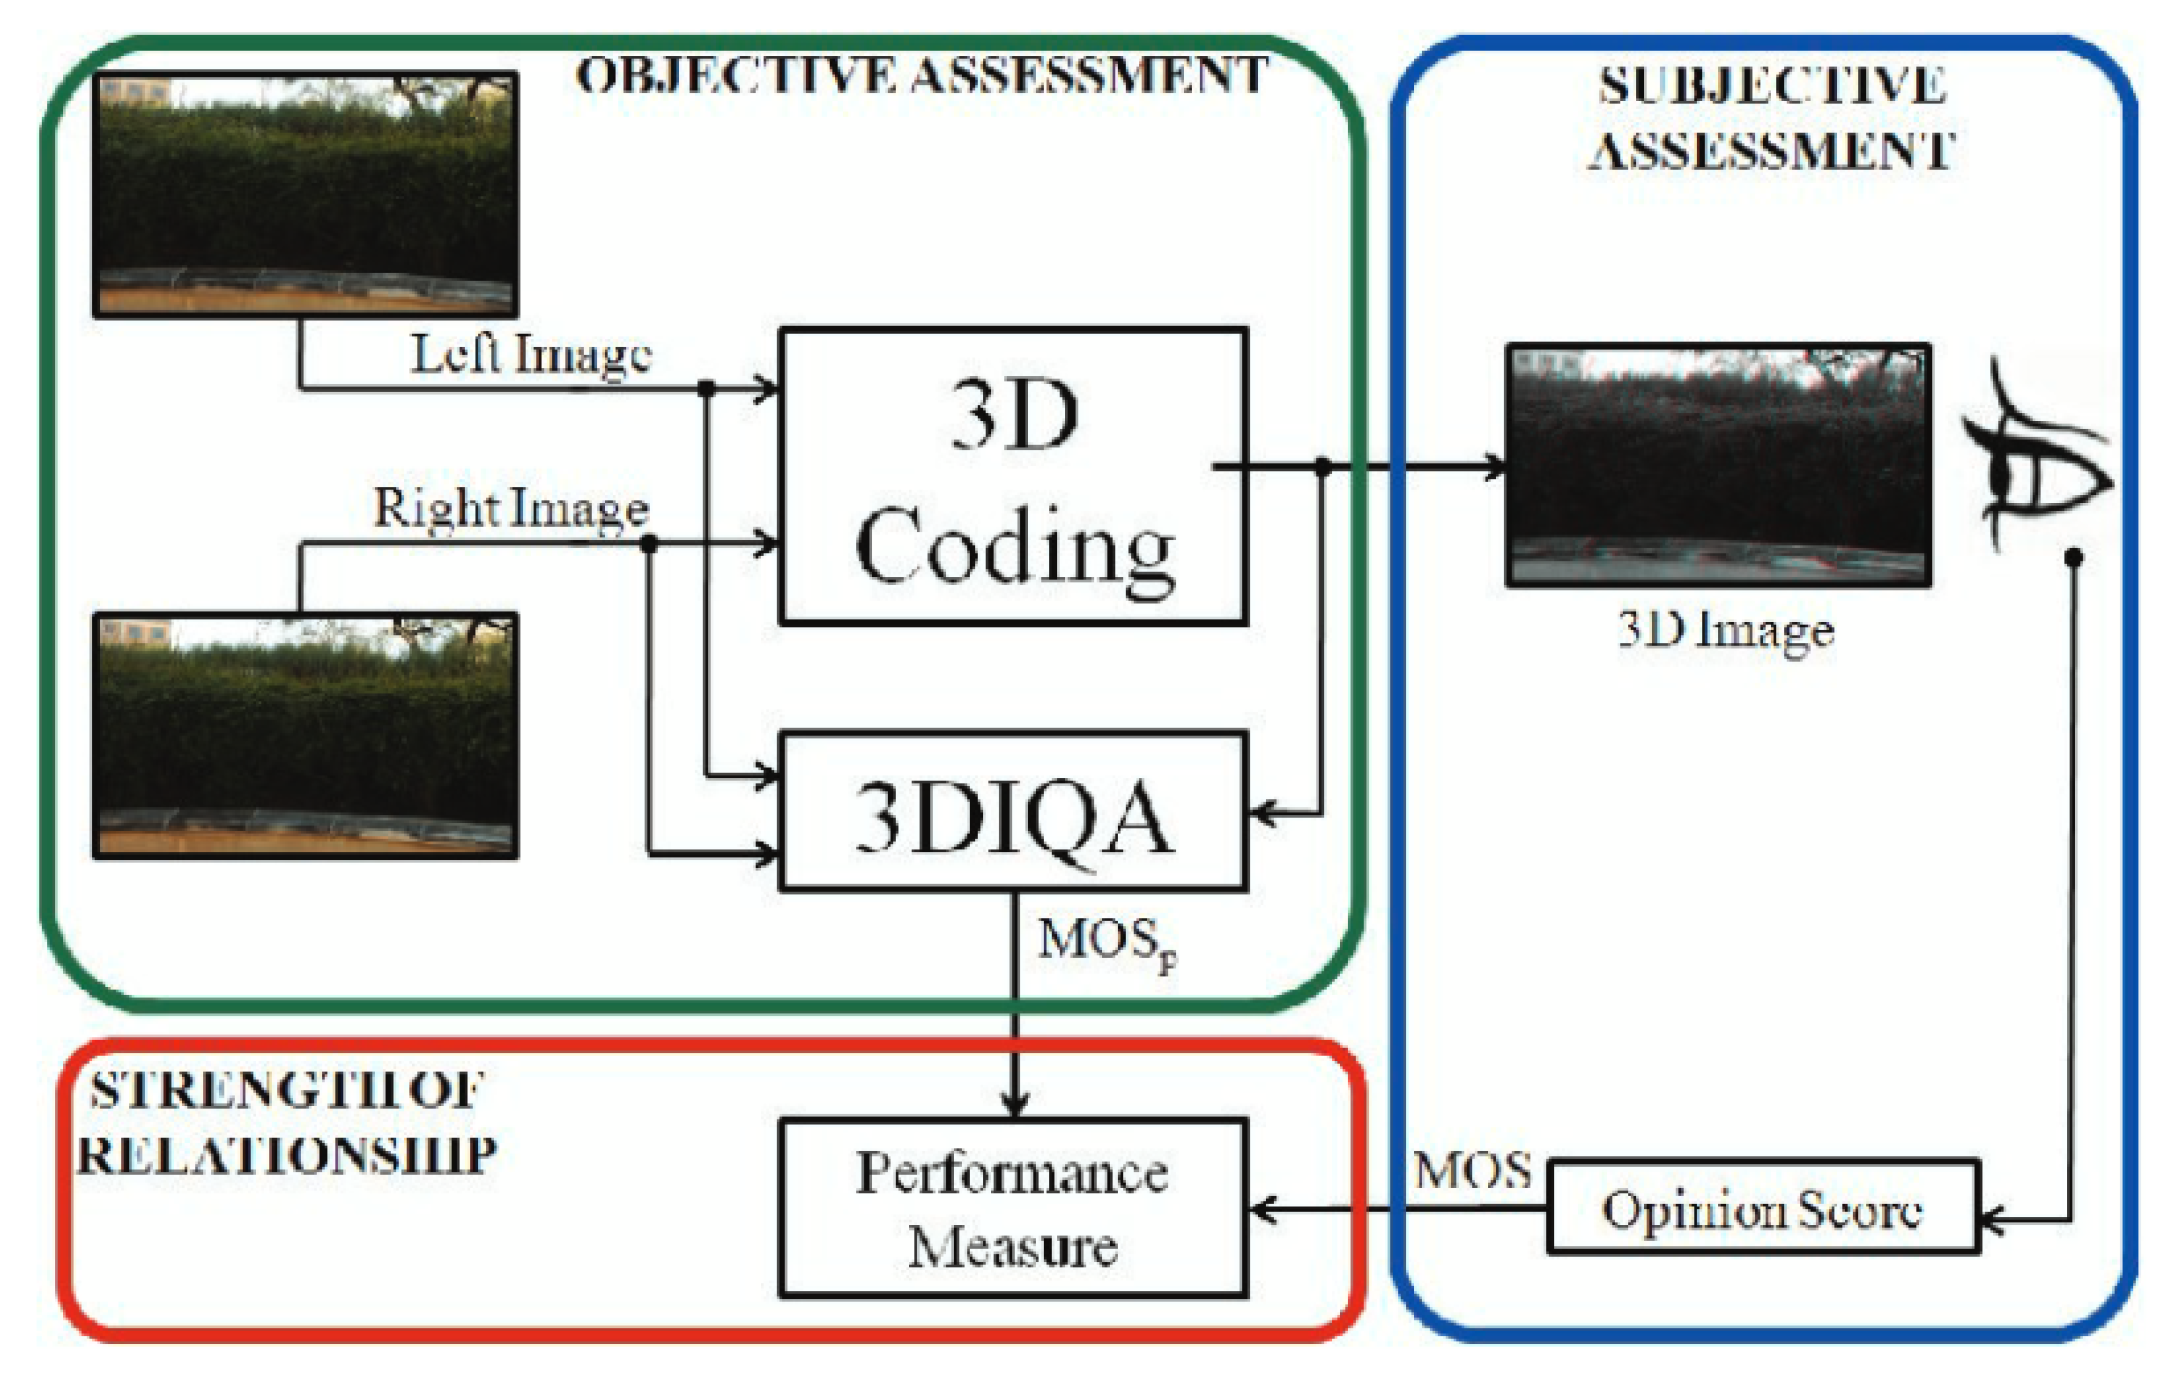
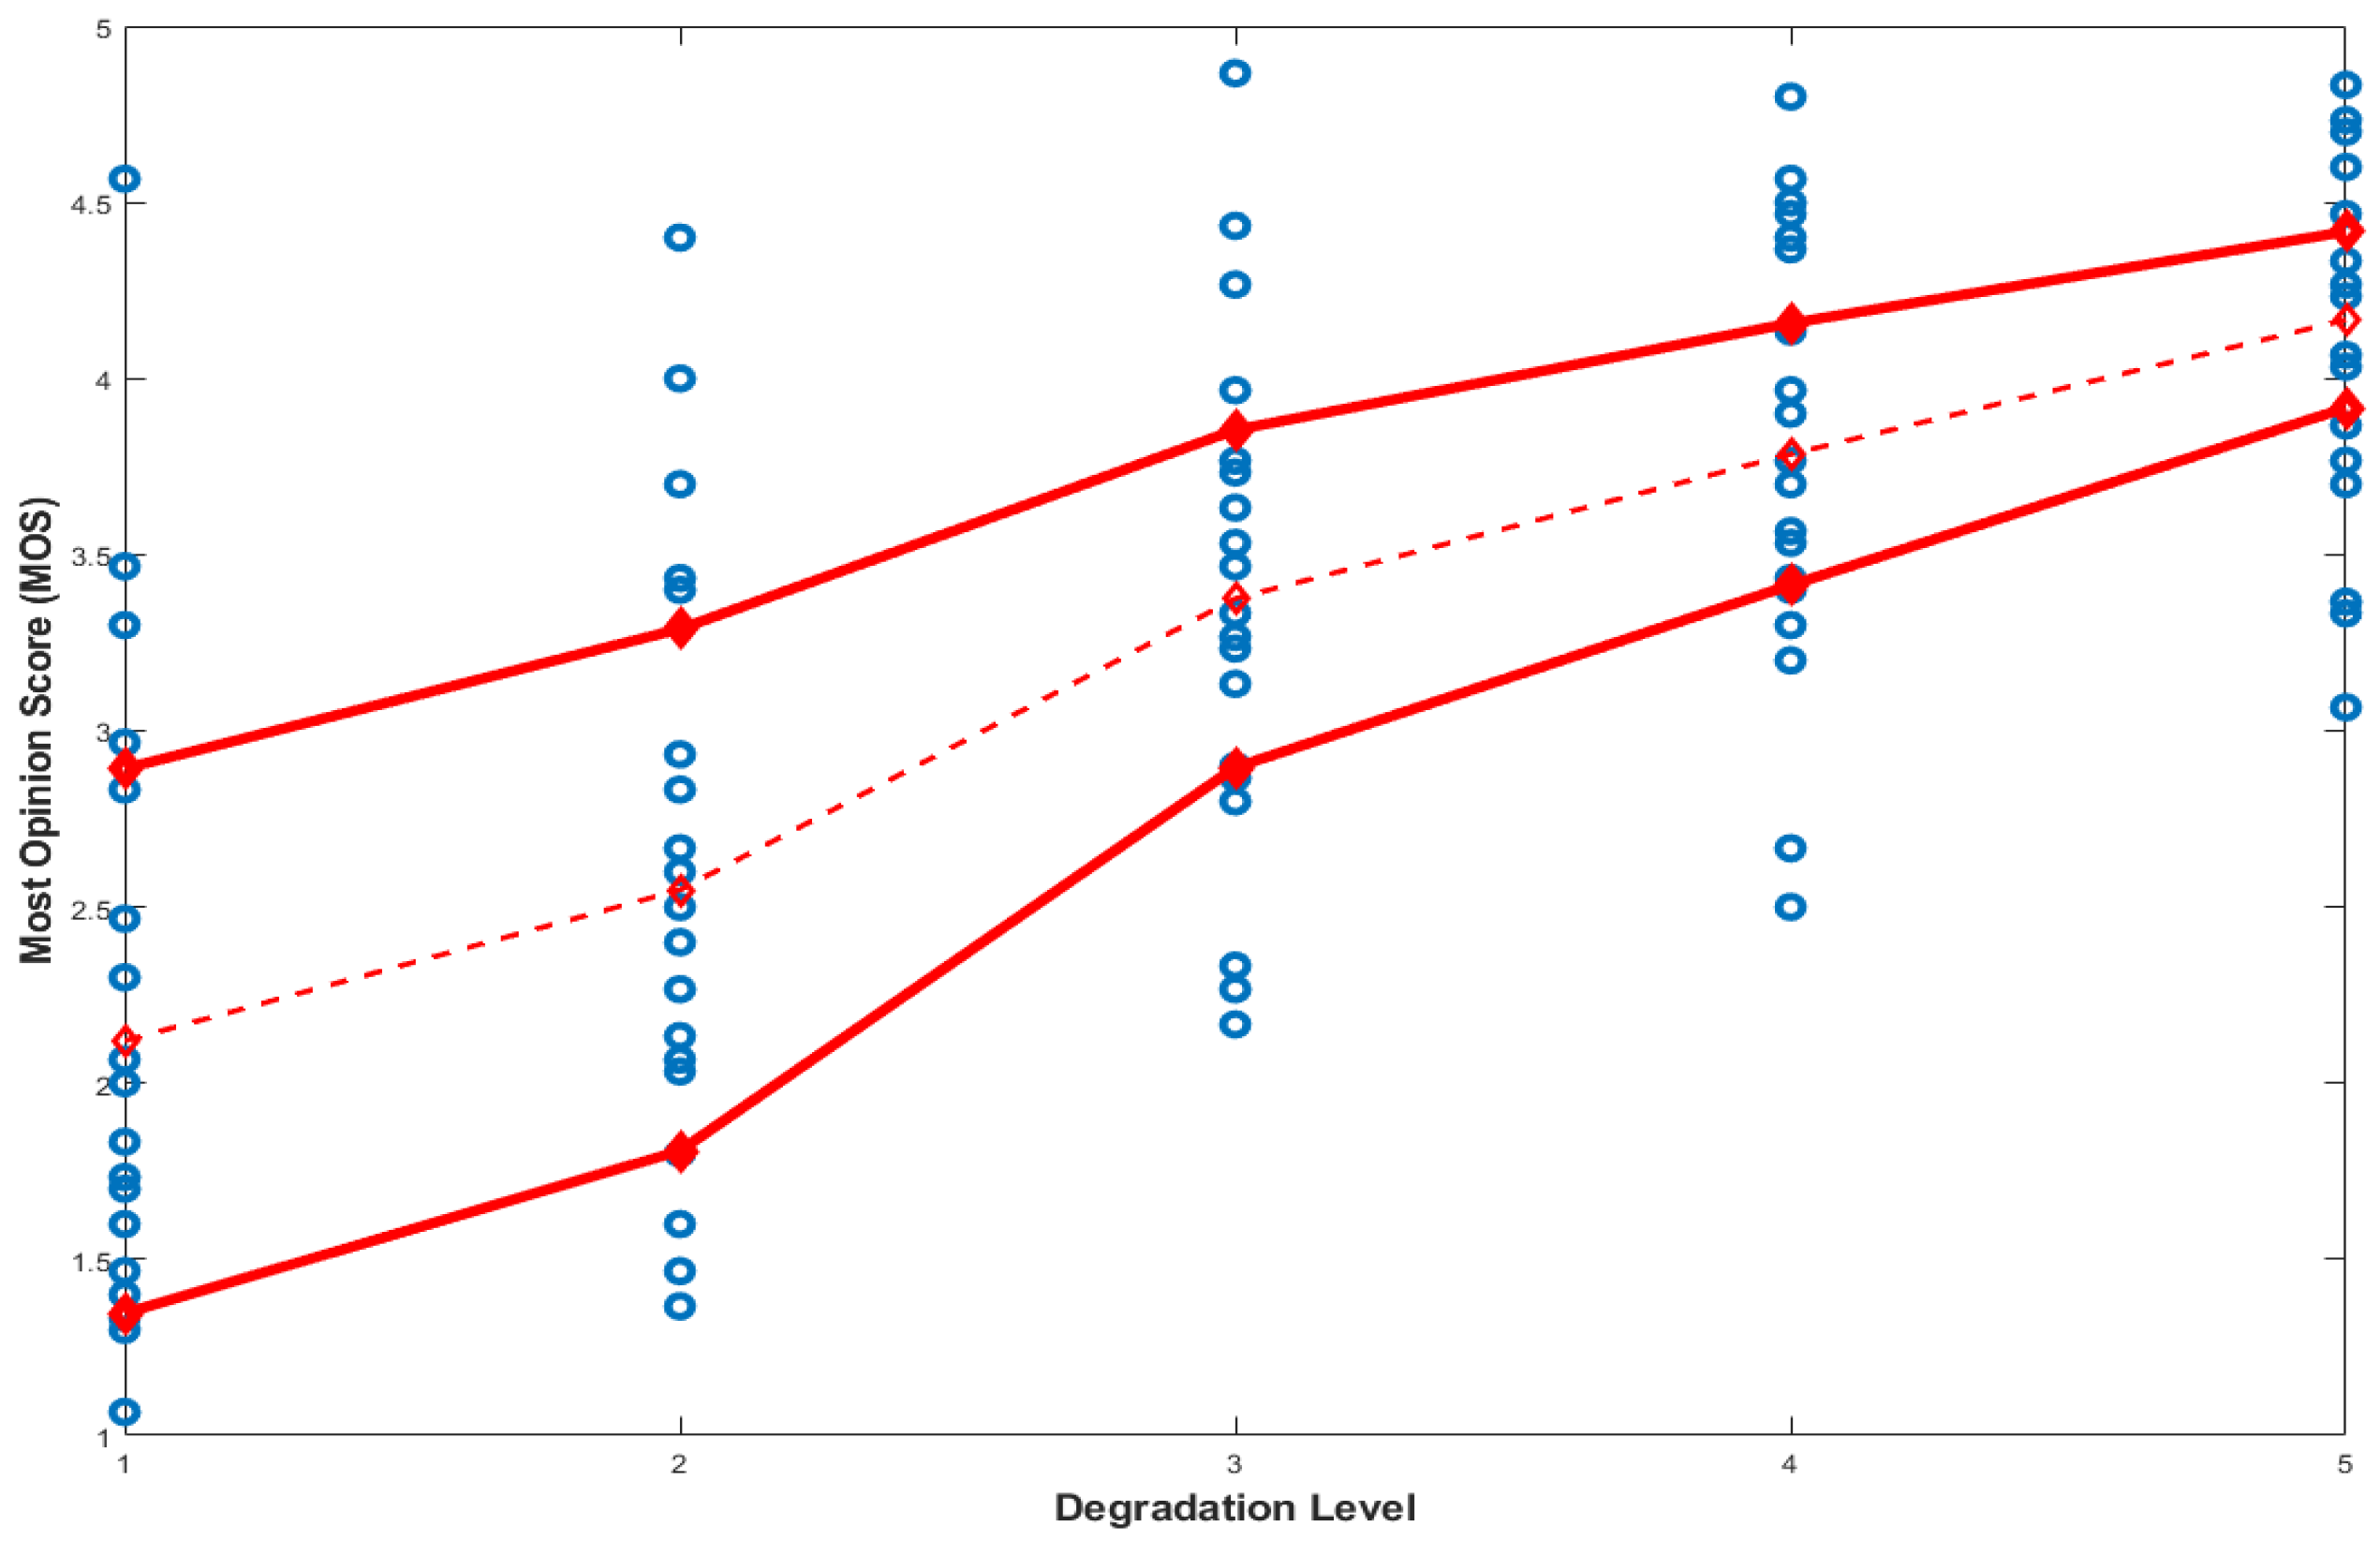
- Subjective Assessment. Observers will give their opinion on the quality of the stereoscopic images (the input). This part is considered subjective since the same stereoscopic pair can have a different evaluation by two observers due to their visual perception;
- Objective Assessment of a 3D Coding process by a 3D Image Quality Assessment (3DIQA). This part is considered objective since the same input stereoscopic pair will be given the same output evaluation; and
- Strength of the relationship between the objective and subjective assessments to estimate the correlation between the observer’s opinion and a 3DIQA. The more these evaluations are correlated, the greater the relationship they will have with the average opinion of a human being.
- Capture,
- Coding, and
- Representation.
4.1. Capture Phase
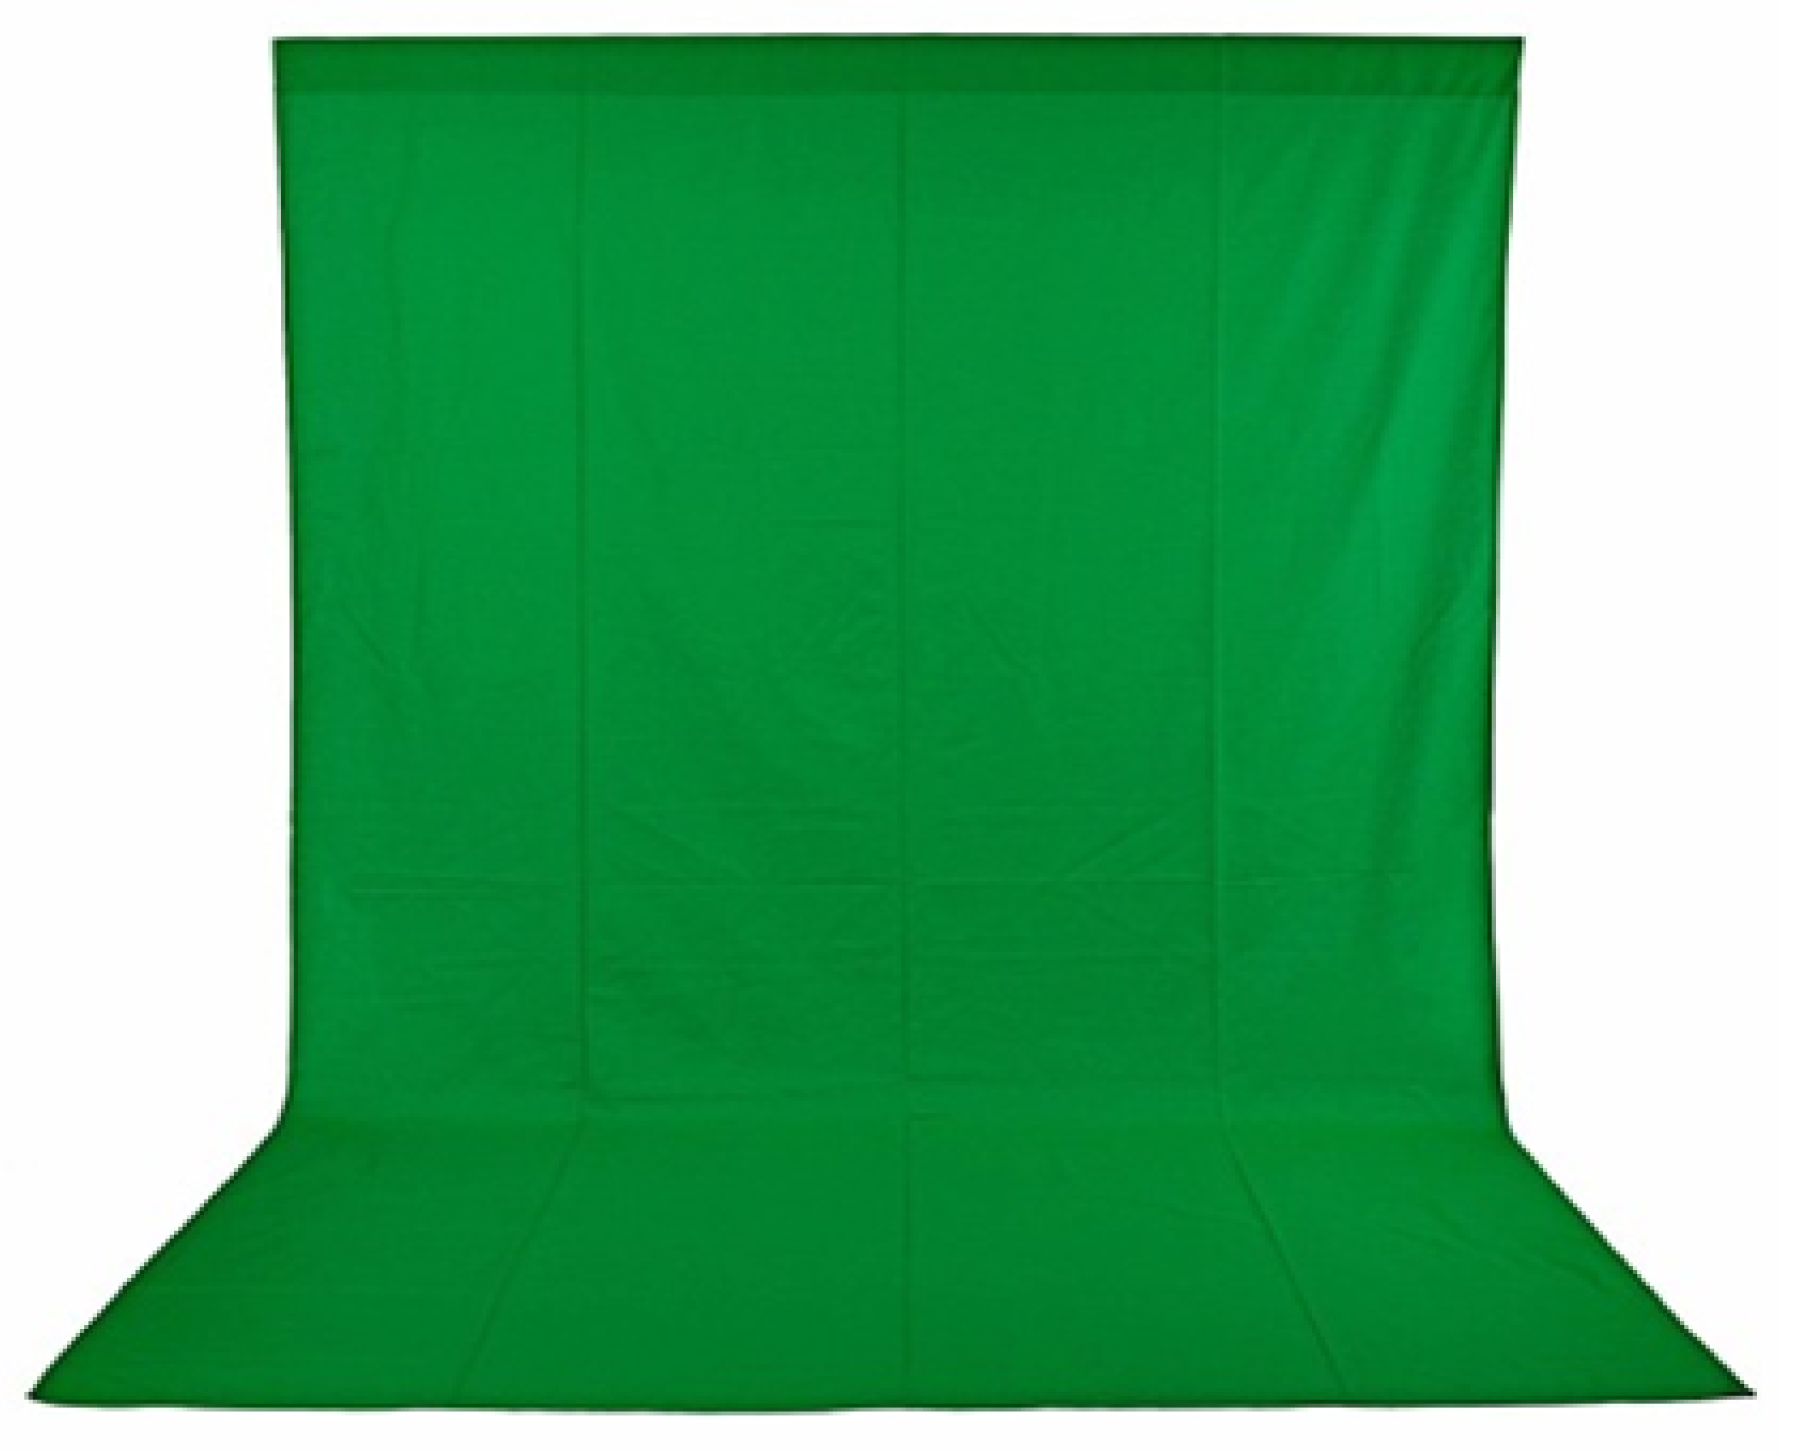
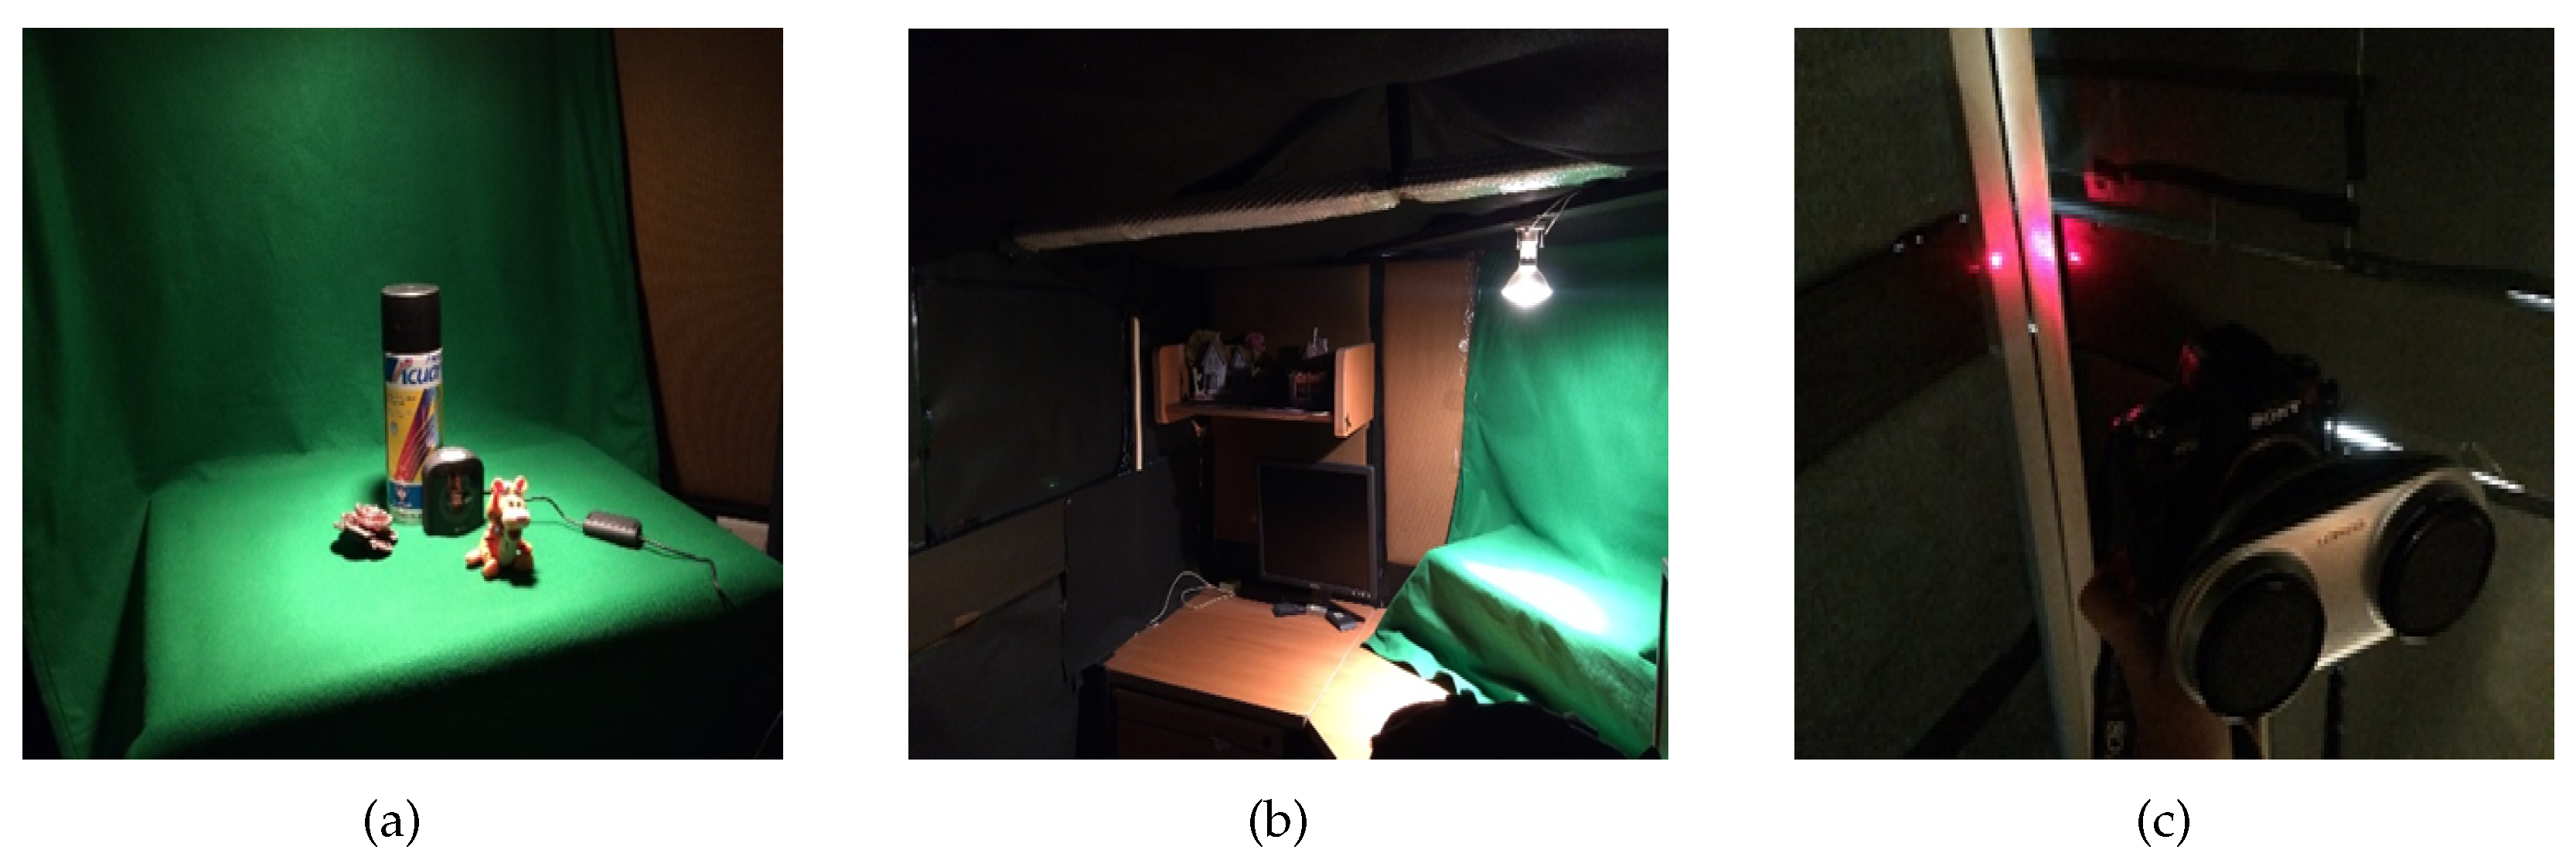
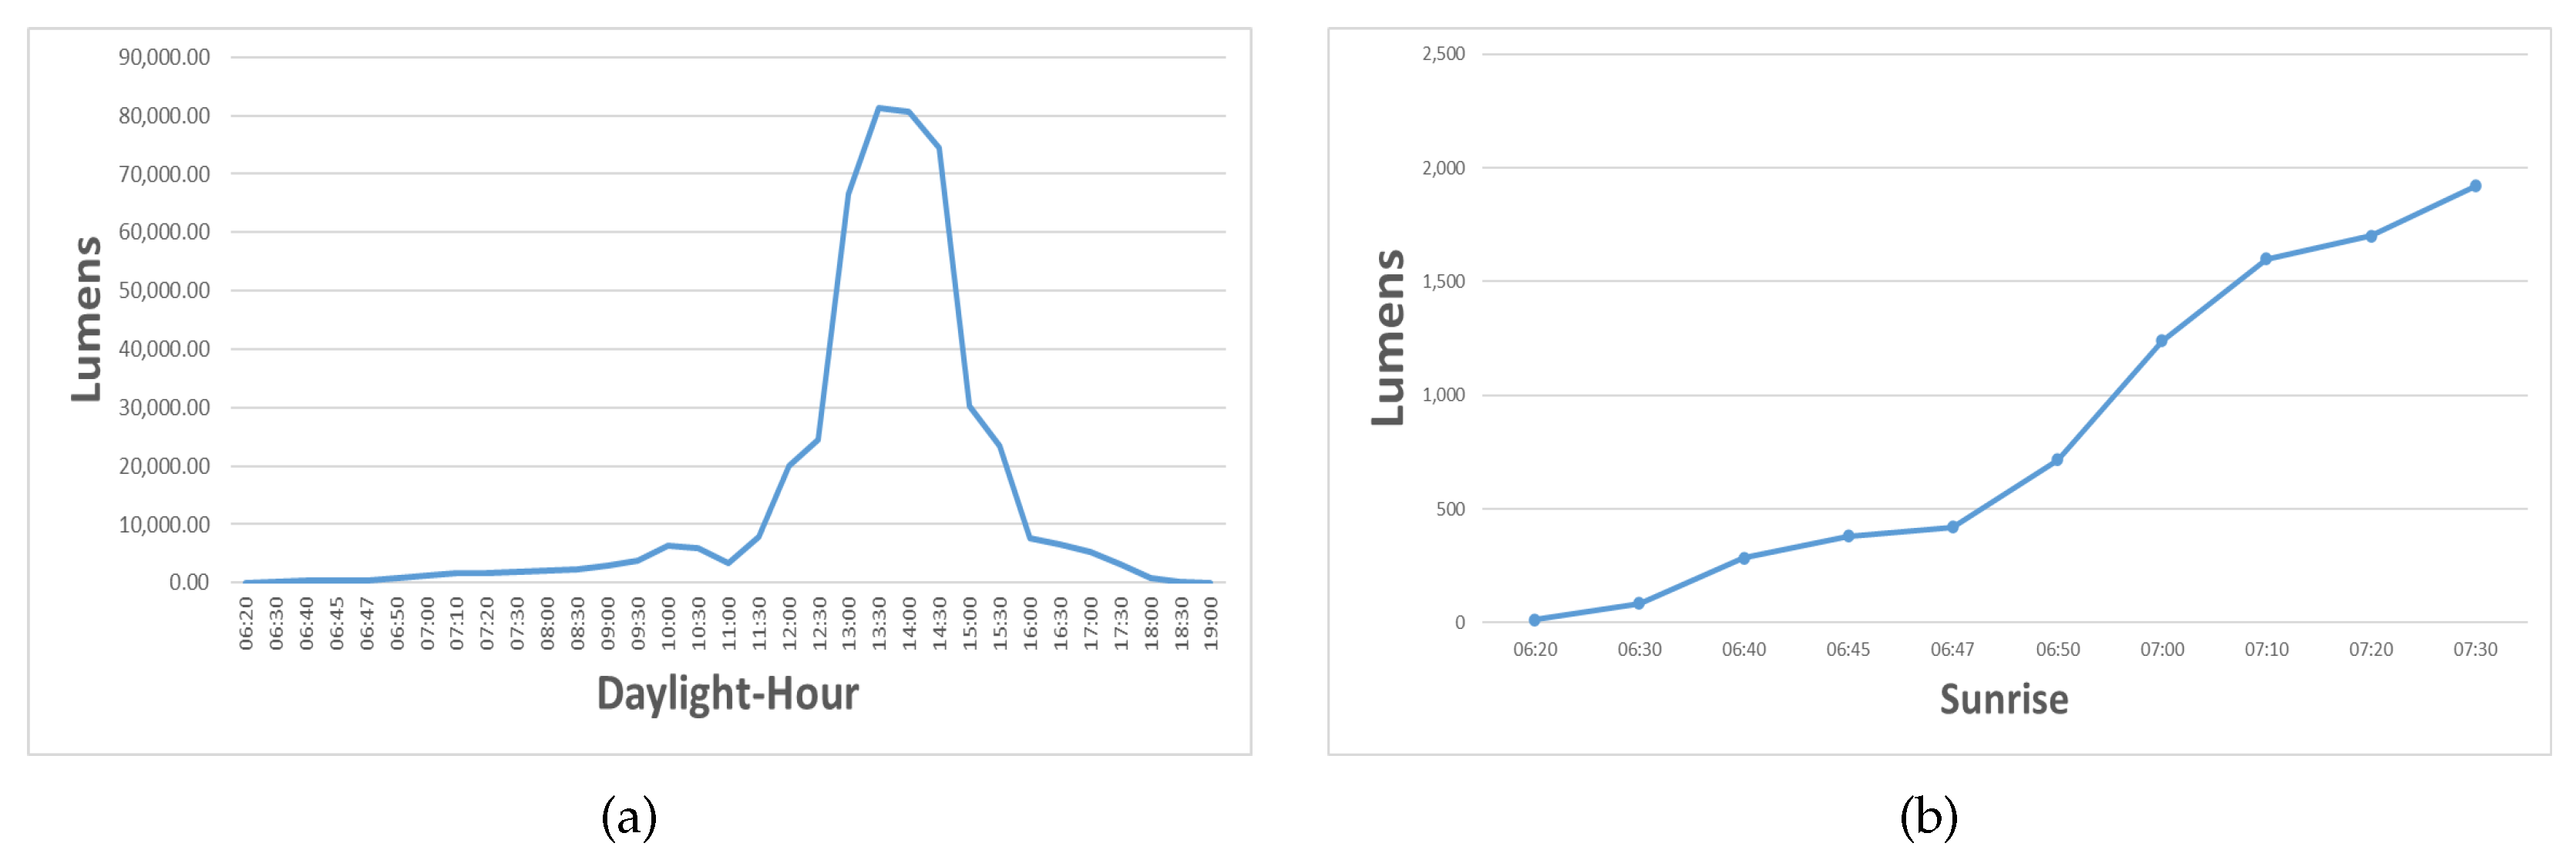
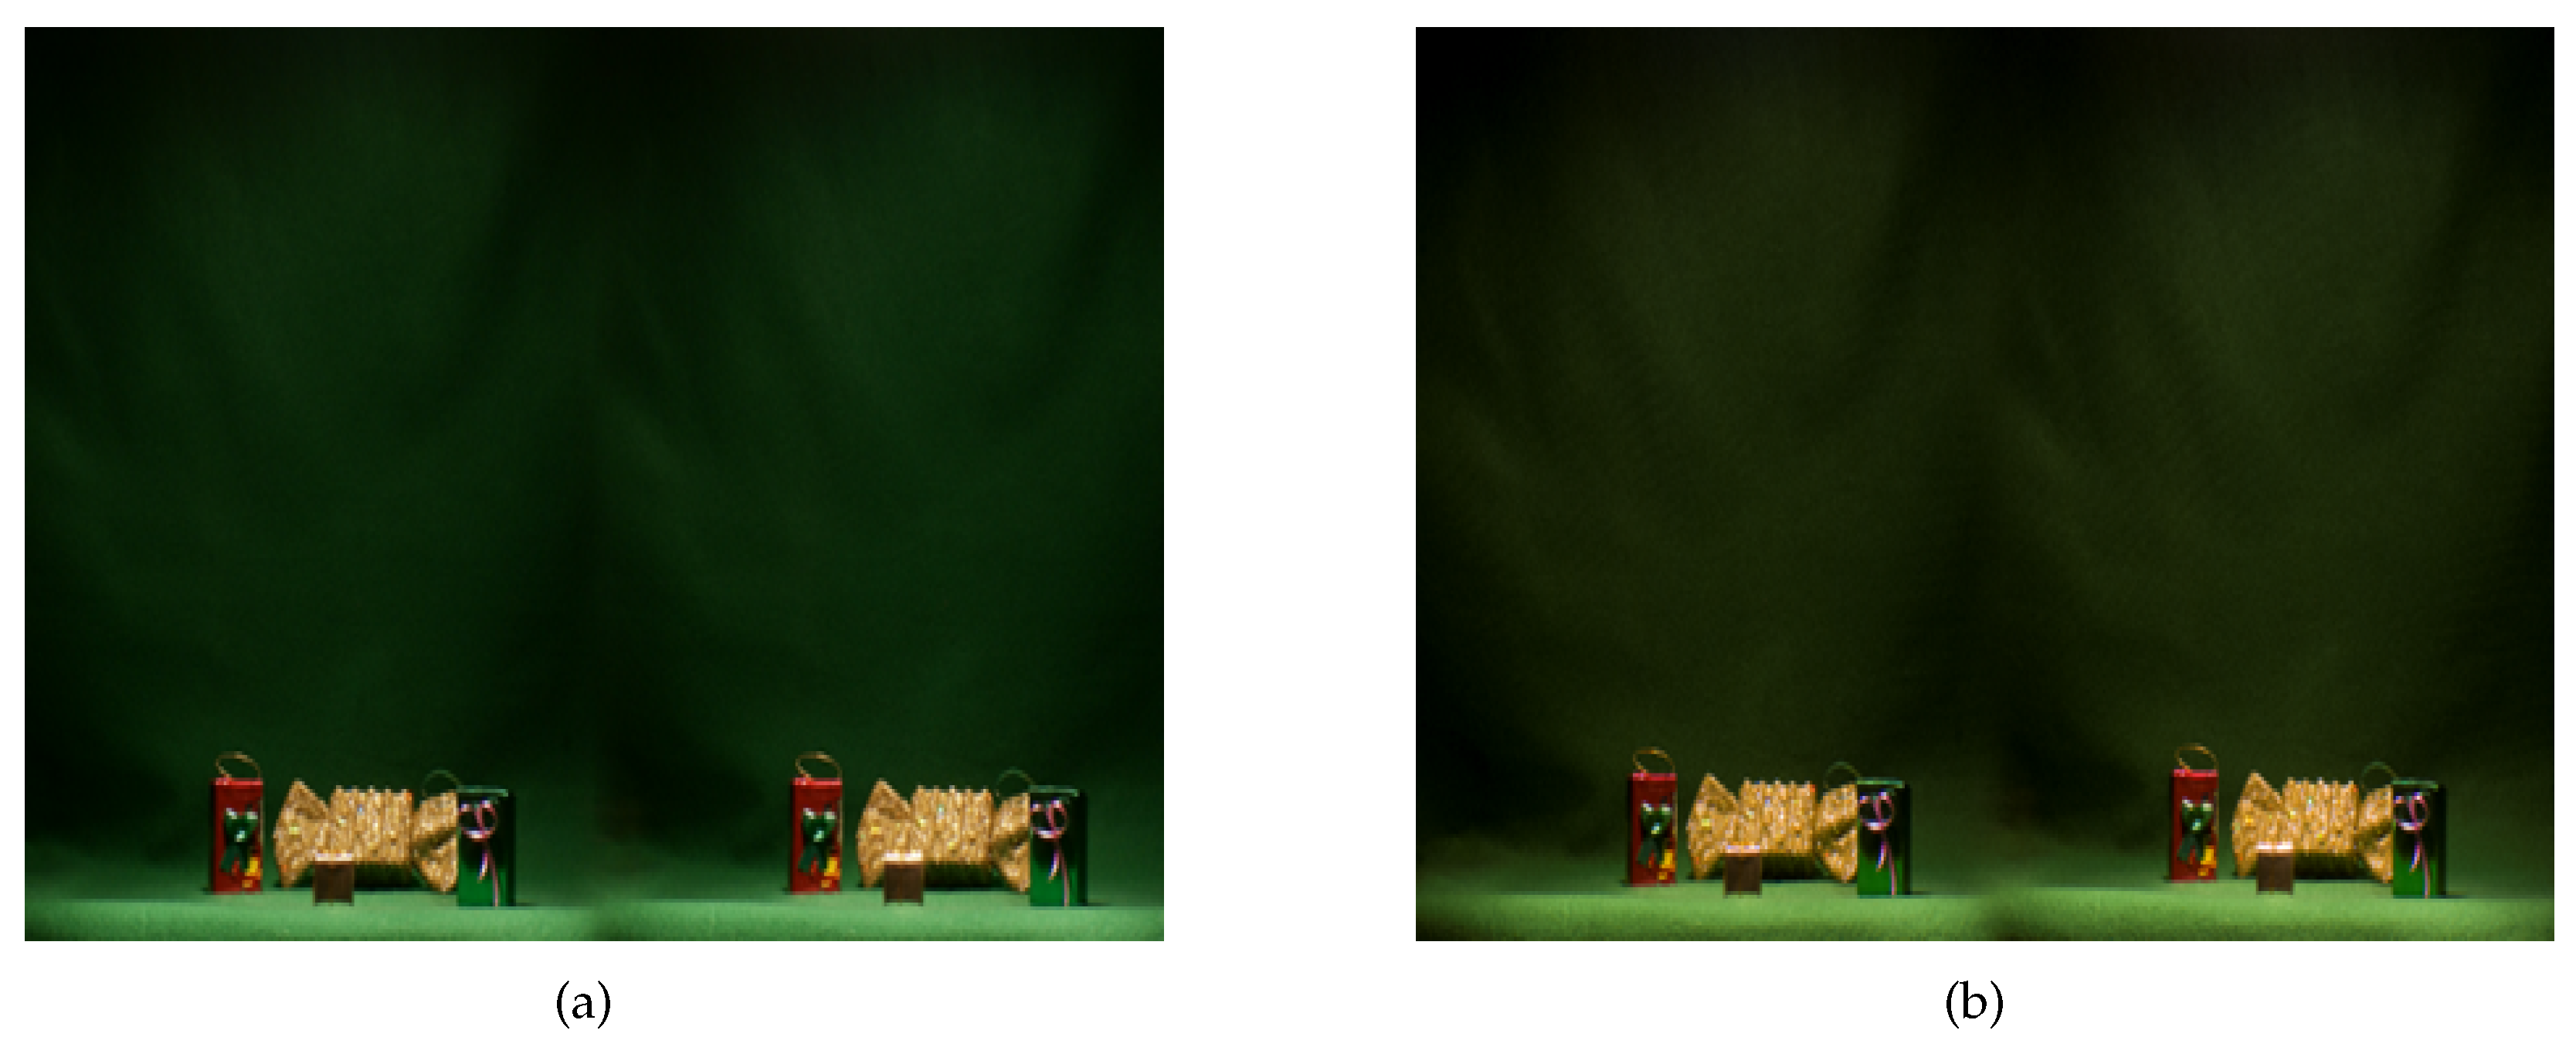
- Stage: This part consists of a wooden table -whose dimensions are cm- to put the objects to be captured, this table is placed behind the green muslin so that the captured objects are placed on top, Figure 9a. For lighting this stage, we use an arrangement of 75-Watt halogen lamps with a light dimmer, Figure 9b. This arrangement is placed above the stage to control the amount of Luminous Intensity or in luxes (), where in lumens is the amount of light in the stage, and m in meters is the distance from this arrangement to the stage. Moreover, for covering the stage, we use a muslin, i.e., a piece of chromatically green, blue, or white fabric; the main objective of this background is to help researchers develop better segmentation algorithms.
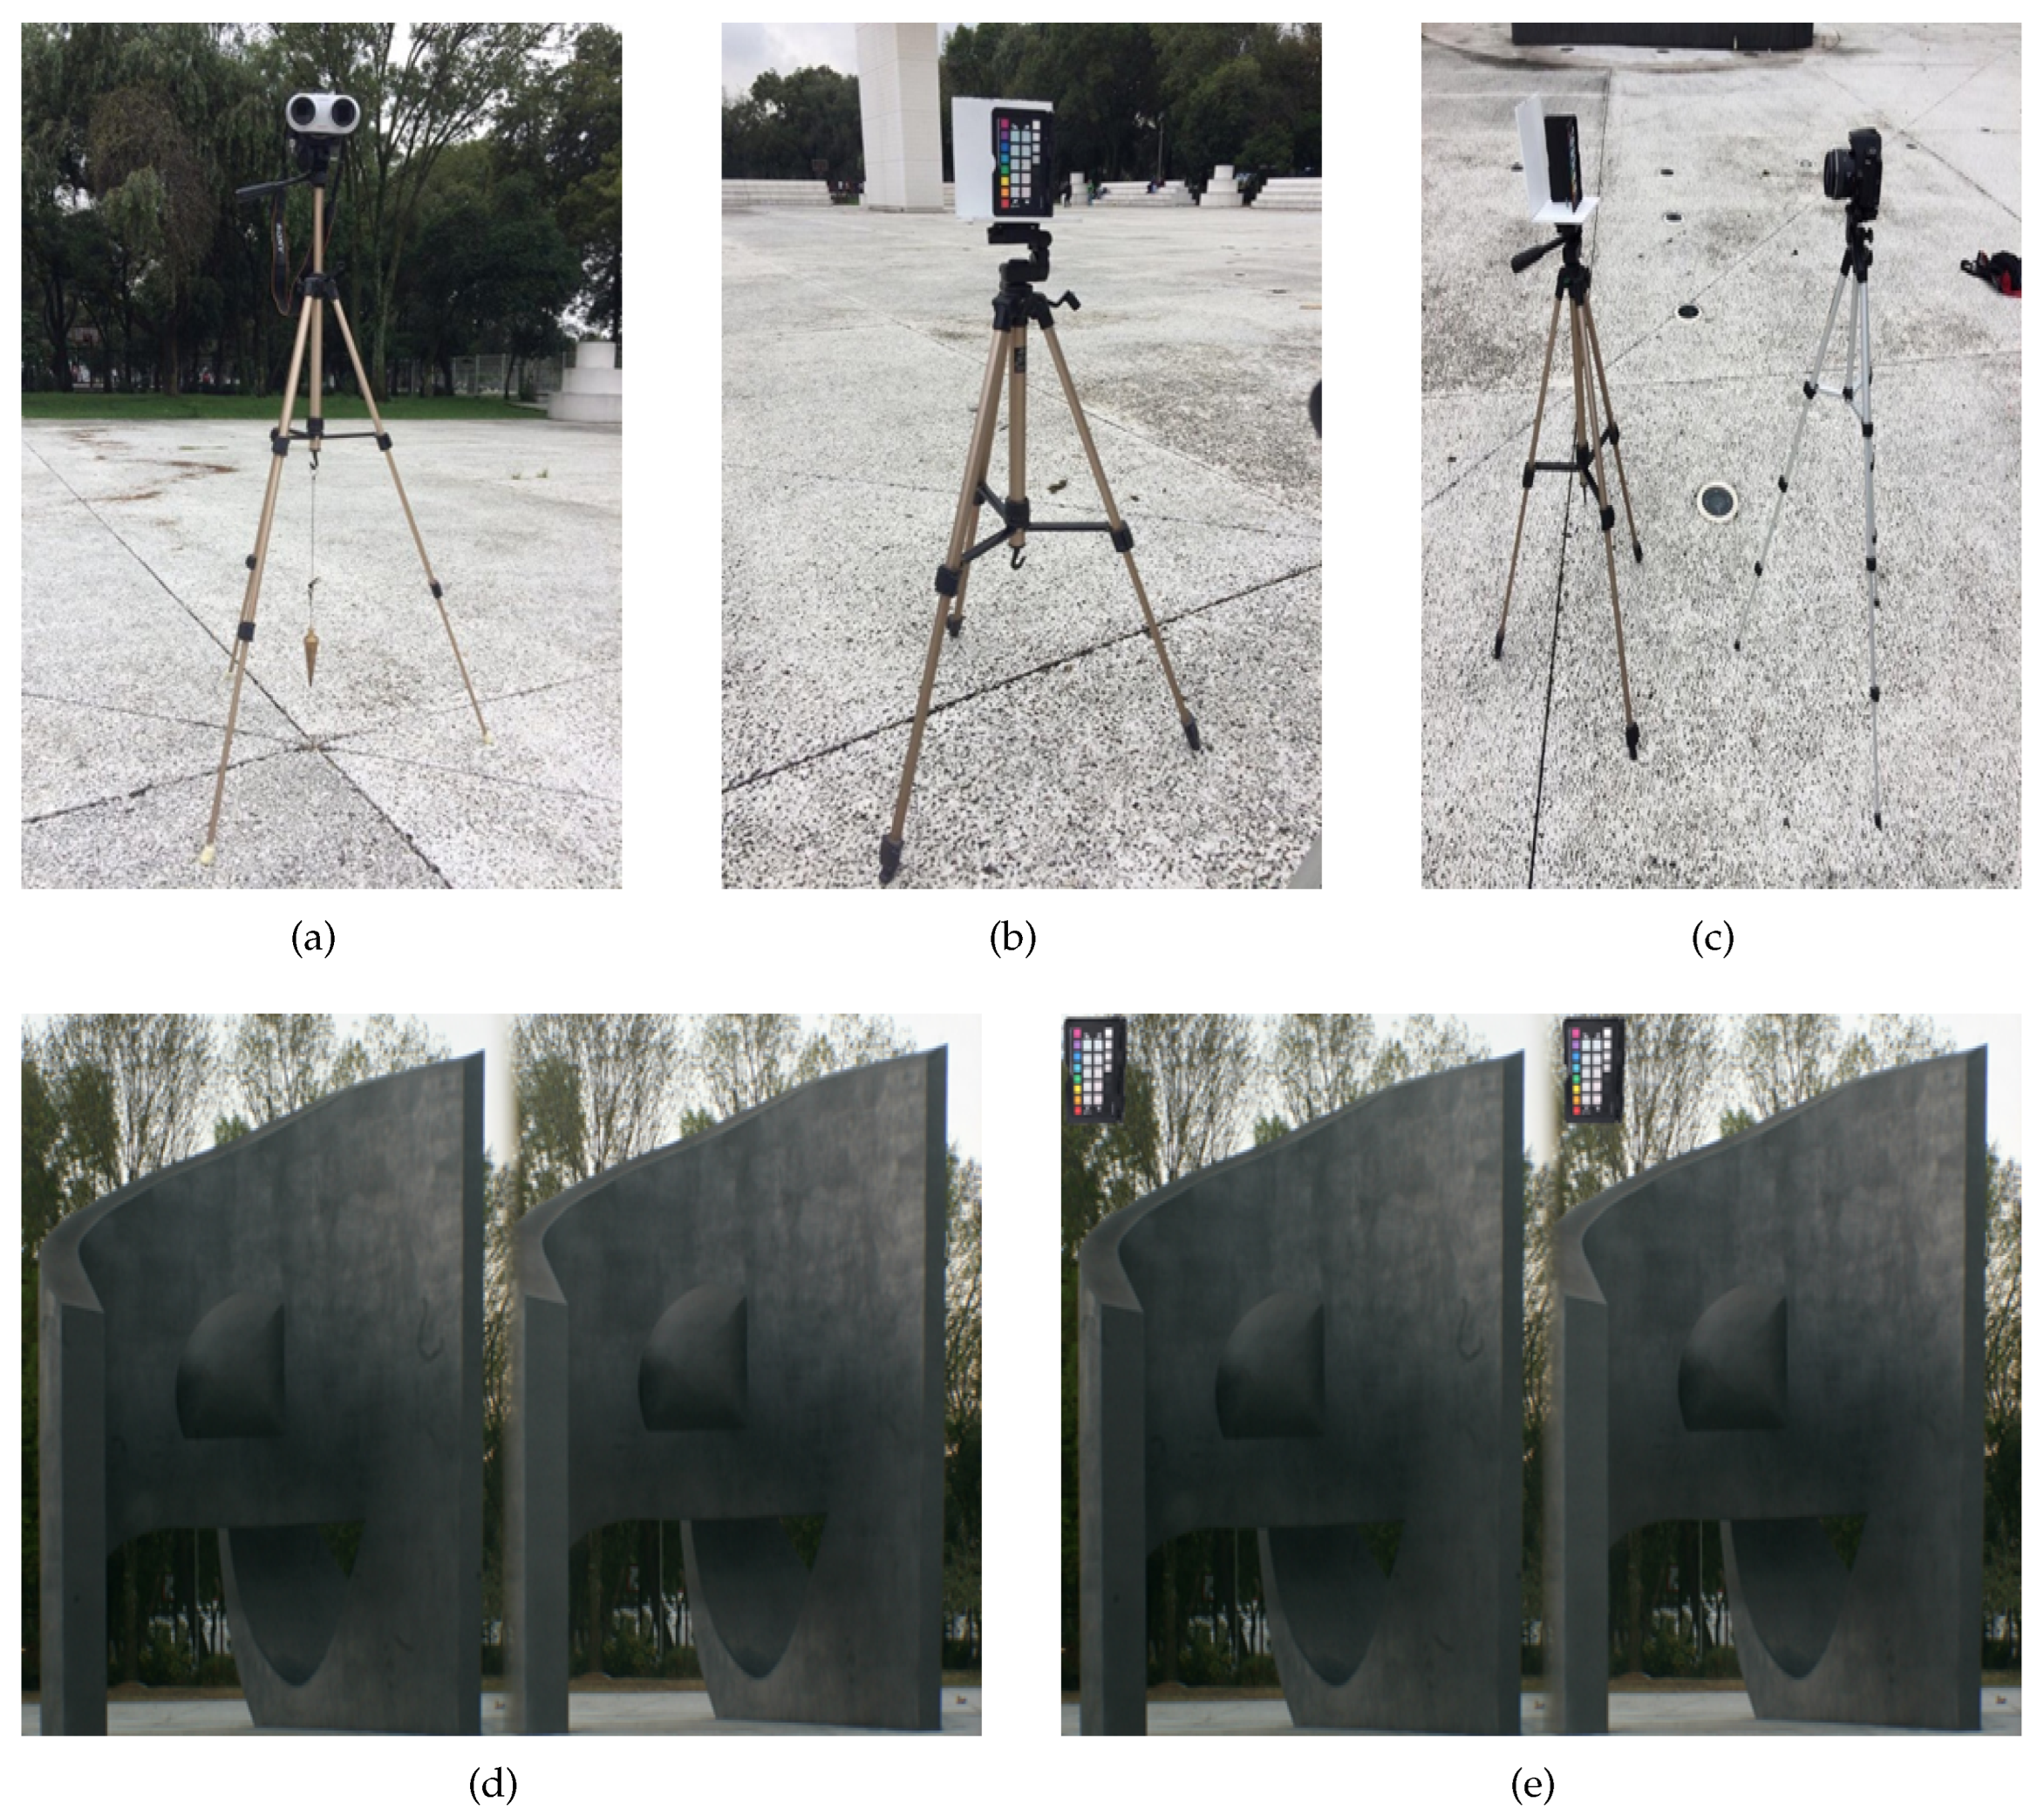
- Camera: We used a Sony camera with a LOREO lens, Figure 9c. When LOREO Lens is used, it is not necessary to calibrate the captured stereoscopic images because it is a device based on a three-dimensional single camera model, but the lens reduces the resolution by half since a single 3D-image has left and right stereoscopic pair in the same arrangement. Moreover, we use a tripod, placed at 1.30 m from the stage, to be the measure recommended by the LOREO’s manufacturer to achieve a 3D effect. In fact, a laser was calibrated in the three axes to have an accurate capture of the stage with the same conditions at all times.
4.2. Coding Phase
- Properties of images taken for the 3D22 Image Database,
- Amount of images that were taken for the full light intensity and average light intensity, and
- Usage of Color Checker Passport (CCP) for color calibration in each element of 3D22 image database.
- Shot of the stage indoors and outdoors in full light.
- Indoor and outdoor scene shot in full light with CCP Classic.
- Indoor and outdoor scene shot in full light with CCP white balance.
- Indoor and outdoor scene shot in full light with CCP creative improvement.
- Shot of the scene indoors and outdoors in medium light.
- Indoor and outdoor scene shot in medium light with CCP classic.
- Indoor and outdoor scene shot in medium light with CCP white balance.
- Indoor and outdoor scene shot in medium light with CCP creative improvement.
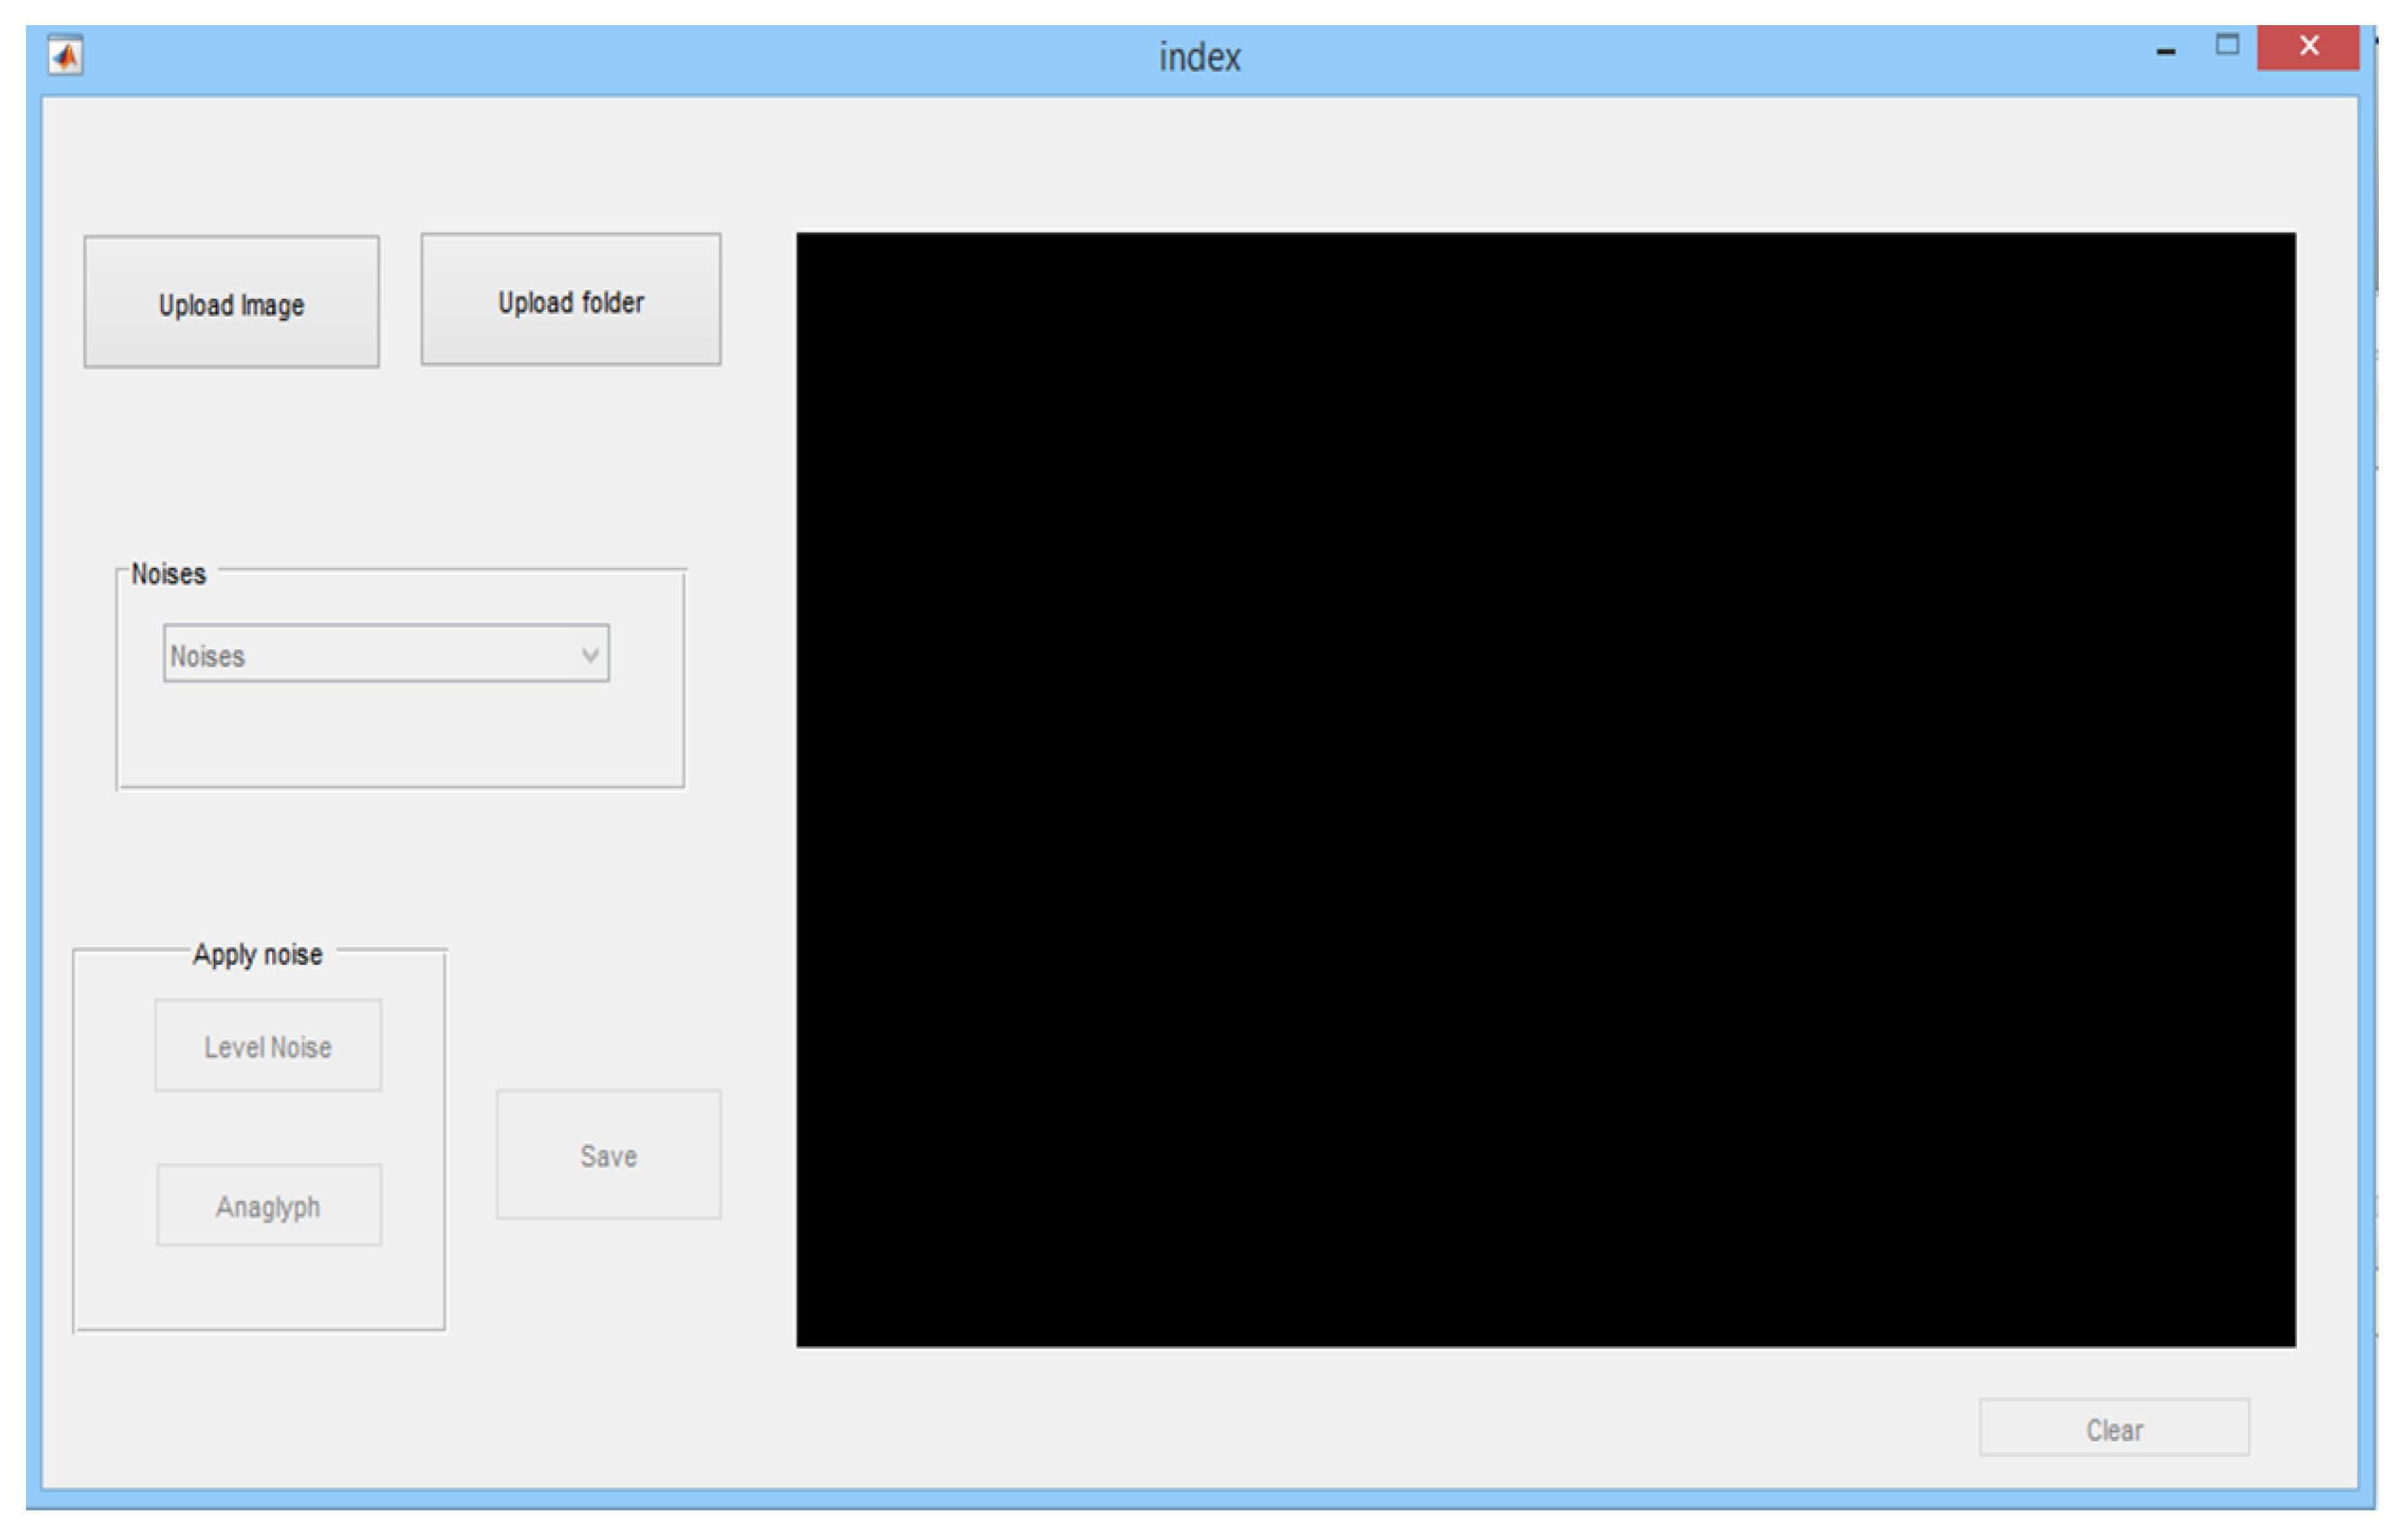
4.3. Representation Phase
- Amount of noises,
- Noise levels,
- Degradation of a specific image,
- Degradation an entire folder of images, and
- Naming for saving images and along with the store’s format.
5. Experimental Results
5.1. Experimental Methodology
5.2. Results and Analysis
- 19 people were women and the other 41 men;
- 38 people had 40 s of arc, 8 people with 30 s of arc, 5 people with 25 s of arc, and 9 people for 20 s of arc;
- 25 people used glasses while the other 35 did not use glasses;
- 33 people had a right dominant eye and the other 27 had a left dominant eye; and
- Only 10 out of the 60 people presented some discomfort, such as dizziness, nausea, or headache.
5.3. Comparison of 3D-Image Quality Assessments
6. Conclusions
Author Contributions
Funding
Data Availability Statement
Acknowledgments
Conflicts of Interest
References
- Vlad, R.; Nahorna, O.; Ladret, P.; Guérin, A. The influence of the visualization task on the simulator sickness symptoms—A comparative SSQ study on 3DTV and 3D immersive glasses. In Proceedings of the 2013 3DTV Vision Beyond Depth (3DTV-CON), Aberdeen, UK, 7–8 October 2013; pp. 1–4. [Google Scholar] [CrossRef] [Green Version]
- Andre, L.; Coutellier, R. Cybersickness and Evaluation of a Remediation System: A Pilot Study. In Proceedings of the 2019 International Conference on 3D Immersion (IC3D), Brussels, Belgium, 11 December 2019; pp. 1–6. [Google Scholar] [CrossRef]
- Moorthy, A.K.; Su, C.C.; Mittal, A.; Bovik, A.C. Subjective evaluation of stereoscopic image quality. Signal Process. Image Commun. 2012, 28, 870–883. [Google Scholar] [CrossRef]
- Goldmann, L.; De Simone, F.; Ebrahimi, T. Impact of Acquisition Distortion on the Quality of Stereoscopic Images. In Proceedings of the International Workshop on Video Processing and Quality Metrics for Consumer Electronics, 13–15 January 2010. [Google Scholar]
- Wang, X.; Yu, M.; Yang, Y.; Jiang, G. Research on subjective stereoscopic image quality assessment. Multimed. Content Access Algorithms Syst. III 2009, 7255, 63–72. [Google Scholar] [CrossRef]
- Mammou, K.; Kim, J.; Tourapis, A.M.; Podborski, D.; Flynn, D. Video and Subdivision based Mesh Coding. In Proceedings of the 2022 10th European Workshop on Visual Information Processing (EUVIP), Lisbon, Portugal, 11–14 September 2022; pp. 1–6. [Google Scholar] [CrossRef]
- Freitas, P.G.; Gonçalves, M.; Homonnai, J.; Diniz, R.; Farias, M.C. On the Performance of Temporal Pooling Methods for Quality Assessment of Dynamic Point Clouds. In Proceedings of the 2022 14th International Conference on Quality of Multimedia Experience (QoMEX), Lippstadt, Germany, 5–7 September 2022; pp. 1–6. [Google Scholar] [CrossRef]
- Subramanyam, S.; Viola, I.; Jansen, J.; Alexiou, E.; Hanjalic, A.; Cesar, P. Subjective QoE Evaluation of User-Centered Adaptive Streaming of Dynamic Point Clouds. In Proceedings of the 2022 14th International Conference on Quality of Multimedia Experience (QoMEX), Lippstadt, Germany, 5–7 September 2022; pp. 1–6. [Google Scholar] [CrossRef]
- Benoit, A.; Le Callet, P.; Campisi, P.; Cousseau, R. Quality Assessment of Stereoscopic Images. EURASIP J. Image Video Process. 2008, 2008, 659024. [Google Scholar] [CrossRef] [Green Version]
- ITU. Bt-500-11: Methodology for the Subjective Assessment of the Quality of Television Pictures; ITU: Istanbul, Turkey, 2002. [Google Scholar]
- Wang, Z.; Bovik, A.; Sheikh, H.; Simoncelli, E. Image quality assessment: From error visibility to structural similarity. IEEE Trans. Image Process. 2004, 13, 600–612. [Google Scholar] [CrossRef] [PubMed] [Green Version]
- Carnec, M.; Le Callet, P.; Barba, D. An image quality assessment method based on perception of structural information. In Proceedings of the International Conference on Image Processing (ICIP), Barcelona, Spain, 14–17 September 2003; Volume 3, p. 7978303. [Google Scholar] [CrossRef]
- Messai, O.; Chetouani, A. End-to-End Deep Multi-Score Model for No-Reference Stereoscopic Image Quality Assessment. In Proceedings of the 2022 IEEE International Conference on Image Processing (ICIP), Bordeaux, France, 16–19 October 2022; pp. 2721–2725. [Google Scholar] [CrossRef]
- Tang, Y.; Feng, Y.; Fan, Q.; Fang, C.; Zou, J.; Chen, J. A wideband complementary noise and distortion canceling LNA for high-frequency ultrasound imaging applications. In Proceedings of the 2018 Texas Symposium on Wireless and Microwave Circuits and Systems (WMCS), Waco, TX, USA, 5–6 April 2018; pp. 1–4. [Google Scholar] [CrossRef]
- Tang, Y.; Feng, Y.; Fan, Q.; Zhang, R.; Chen, J. A Current Reuse Wideband LNA with Complementary Noise and Distortion Cancellation for Ultrasound Imaging Applications. In Proceedings of the 2018 IEEE Asia Pacific Conference on Circuits and Systems (APCCAS), Chengdu, China, 26–30 October 2018; pp. 171–174. [Google Scholar] [CrossRef]
- Wang, Z.; Xu, W.; Zhu, Z.; Huang, C.; Zhang, Y.; Huang, Z. Blind Additive Gaussian White Noise Level Estimation using Chi-square Distribution. In Proceedings of the 2022 International Conference on Artificial Intelligence and Computer Information Technology (AICIT), Yichang, China, 16–18 September 2022; pp. 1–4. [Google Scholar] [CrossRef]
- Park, T.; Kim, M.; Gwak, M.; Cho, T.; Park, P. Active noise control algorithm robust to noisy inputs and measurement impulsive noises. In Proceedings of the 2020 20th International Conference on Control, Automation and Systems (ICCAS), Busan, South Korea, 13–16 October 2020; pp. 622–626. [Google Scholar] [CrossRef]
- Manek, S.S.; Tjandrasa, H. A soft weighted median filter for removing general purpose image noise. In Proceedings of the 2017 11th International Conference on Information & Communication Technology and System (ICTS), Surabaya, Indonesia, 31 October 2017; pp. 25–30. [Google Scholar] [CrossRef]
- Zhao, B.; Sveinsson, J.R.; Ulfarsson, M.O.; Chanussot, J. Local Spatial-Spectral Correlation Based Mixtures of Factor Analyzers for Hyperspectral Denoising. In Proceedings of the IGARSS 2020-2020 IEEE International Geoscience and Remote Sensing Symposium, Waikoloa, HI, USA, 26 September 2020–2 October 2020; pp. 1488–1491. [Google Scholar] [CrossRef]
- Kang, X.; Zhu, W.; Li, K.; Jiang, J. A Novel Adaptive Switching Median filter for laser image based on local salt and pepper noise density. In Proceedings of the 2011 IEEE Power Engineering and Automation Conference, Wuhan, China, 8–9 September 2011; Volume 3, pp. 38–41. [Google Scholar] [CrossRef]
- Yassine, T.; Ahmed, S.; Abdelkrim, N. Speckle noise reduction in digital speckle pattern interferometry using Riesz wavelets transform. In Proceedings of the 2017 International Conference on Advanced Technologies for Signal and Image Processing (ATSIP), Fez, Morocco, 22–24 May 2017; pp. 1–4. [Google Scholar] [CrossRef]
- Wang, G.; Wang, M.; Qian, Z. Detection method for colored noise submerged in Gaussian noise. In Proceedings of the 5th International Conference on Computer Sciences and Convergence Information Technology, Seoul, South Korea, 30 November 2010–2 December 2010; pp. 517–520. [Google Scholar] [CrossRef]
- HauLeow, C.; Braga, M.; Bush, N.L.; Stanziola, A.; Shah, A.; Hernández-Gil, J.; Nicholas Long, J.; Aboagye, E.O.; Bamber, J.C.; Tang, M.X. Contrast vs Non-Contrast Enhanced Microvascular Imaging Using Acoustic Sub-Aperture Processing (ASAP): In Vivo Demonstration. In Proceedings of the 2018 IEEE International Ultrasonics Symposium (IUS), Kobe, Japan, 22–25 October 2018; pp. 1–4. [Google Scholar] [CrossRef]
- Li, B.; Ng, T.T.; Li, X.; Tan, S.; Huang, J. Statistical Model of JPEG Noises and Its Application in Quantization Step Estimation. IEEE Trans. Image Process. 2015, 24, 1471–1484. [Google Scholar] [CrossRef] [PubMed]
- Liu, R.; Zhang, Y.; Zhou, Q. Research on Compression Performance Prediction of JPEG2000. In Proceedings of the 2021 2nd International Symposium on Computer Engineering and Intelligent Communications (ISCEIC), Nanjing, China, 6–8 August 2021; pp. 278–284. [Google Scholar] [CrossRef]
- Li, K.; Dai, Q.; Xu, W. High quality color calibration for multi-camera systems with an omnidirectional color checker. In Proceedings of the 2010 IEEE International Conference on Acoustics, Speech and Signal Processing, Dallas, TX, USA, 14–19 March 2010; pp. 1026–1029. [Google Scholar] [CrossRef]
- Jin, L.; Boev, A.; Gotchev, A.; Egiazarian, K. 3D-DCT based perceptual quality assessment of stereo video. In Proceedings of the 18th IEEE International Conference on Image Processing (ICIP), Brussels, Belgium, 11–14 September 2011; pp. 2521–2524. [Google Scholar] [CrossRef]
- Joveluro, P.; Malekmohamadi, H.; Fernando, W.A.C.; Kondoz, A. Perceptual Video Quality Metric for 3D video quality assessment. In Proceedings of the 3DTV-Conference: The True Vision - Capture, Transmission and Display of 3D Video (3DTV-CON), Tampere, Finland, 7–9 June 2010; pp. 1–4. [Google Scholar] [CrossRef]
- Shao, F.; Gu, S.; Jang, G.; Yu, M. A Novel No-Reference Stereoscopic Image Quality Assessment Method. In Proceedings of the Symposium on Photonics and Optoelectronics (SOPO), Shanghai, China, 21–23 May 2012; pp. 1–4. [Google Scholar] [CrossRef]
- Wang, Z.; Simoncelli, E.; Bovik, A. Multiscale structural similarity for image quality assessment. In Proceedings of the Conference Record of the Thirty-Seventh Asilomar Conference on Signals, Systems and Computers, Pacific Grove, CA, USA, 9–12 November 2003; Volume 2, pp. 1398–1402. [Google Scholar] [CrossRef] [Green Version]
- Padungsriborworn, W.; Thong-un, N.; Treenuson, W. A Study on Automatic Flaw Detection using MSSIM in Ultrasound Imaging of Steel Plate. In Proceedings of the 2019 First International Symposium on Instrumentation, Control, Artificial Intelligence, and Robotics (ICA-SYMP), Bangkok, Thailan, 16–18 January 2019; pp. 167–170. [Google Scholar] [CrossRef]
- Chandler, D.; Hemami, S. VSNR: A Wavelet-Based Visual Signal-to-Noise Ratio for Natural Images. IEEE Trans. Image Process. 2007, 16, 2284–2298. [Google Scholar] [CrossRef] [PubMed]
- Hanhart, P.; Ebrahimi, T. Quality Assessment of a Stereo Pair Formed From Two Synthesized Views Using Objective Metrics. In Proceedings of the Seventh International Workshop on Video Processing and Quality Metrics for Consumer Electronics-VPQM, Scottsdale, AZ, USA, 30 January–1 February 2013. [Google Scholar]
- Niveditta, T.; Swapna, D. A new Method for Color Image Quality Assessment. Int. J. Comput. Appl. 2011, 15, 10–17. [Google Scholar] [CrossRef]
- Sheikh, H.; Bovik, A. Image information and visual quality. IEEE Trans. Image Process. 2006, 15, 430–444. [Google Scholar] [CrossRef] [PubMed]
- Wang, Z.; Bovik, A. A universal image quality index. IEEE Signal Process. Lett. 2002, 9, 81–84. [Google Scholar] [CrossRef]
- Sheikh, H.; Bovik, A.; Cormack, L. No-reference quality assessment using natural scene statistics: JPEG2000. IEEE Trans. Image Process. 2005, 14, 1918–1927. [Google Scholar] [CrossRef] [PubMed]
- Seshadrinathan, K.; Bovik, A.C. Unifying analysis of full reference image quality assessment. In Proceedings of the 2008 15th IEEE International Conference on Image Processing, San Diego, CA, USA, 12–15 October 2008; pp. 1200–1203. [Google Scholar] [CrossRef] [Green Version]
- Damera-Venkata, N.; Kite, T.; Geisler, W.; Evans, B.; Bovik, A. Image Quality Assessment Based on a Degradation Model. IEEE Trans. Image Process. 2000, 9, 636–650. [Google Scholar] [CrossRef] [PubMed] [Green Version]
- Mitsa, T.; Varkur, K. Evaluation of contrast sensitivity functions for formulation of quality measures incorporated in halftoning algorithms. IEEE Int. Conf. Acustics, Speech Signal Process. 1993, 5, 301–304. [Google Scholar]
- Moorthy, A.; Bovik, A. A Two-Step Framework for Constructing Blind Image Quality Indices. IEEE Signal Process. Lett. 2010, 17, 513–516. [Google Scholar] [CrossRef]
- Mittal, A.; Moorthy, A.; Bovik, A. No-Reference Image Quality Assessment in the Spatial Domain. IEEE Trans. Image Process. 2012, 21, 4695–4708. [Google Scholar] [CrossRef] [PubMed]
- Mittal, A.; Soundararajan, R.; Bovik, A. Making a "Completely Blind " Image Quality Analyzer. IEEE Signal Process. Lett. 2013, 20, 209–212. [Google Scholar] [CrossRef]
- Zhang, L.; Zhang, D.; Mou, X.; Zhang, D. FSIM: A Feature Similarity Index for Image Quality Assessment. IEEE Trans. Image Process. 2011, 20, 2378–2386. [Google Scholar] [CrossRef] [PubMed]
- Zhang, L.; Zhang, D.; Mou, X. RFSIM: A feature based image quality assessment metric using Riesz transforms. In Proceedings of the 17th IEEE International Conference on Image Processing (ICIP), Hong Kong, China, 26–29 September 2010; pp. 321–324. [Google Scholar] [CrossRef]
- Egiazarian, K.; Astola, J.; Ponomarenko, N.; Lukin, V.; Battisti, F.; Carli, M. Two New Full-Reference Quality Metrics Based on Hvs. In Proceedings of the Second International Workshop on Video Processing and Quality Metrics for Consumer Electronics, Scottsdale, AZ, USA, 22–24 January 2006; p. 4. [Google Scholar]


| Name | Degradation Level | MOS | Name | Degradation Level | MOS |
|---|---|---|---|---|---|
| 01_01 | 1 | 2.00 | 11_01 | 1 | 1.70 |
| 01_02 | 2 | 2.67 | 11_02 | 2 | 2.60 |
| 01_03 | 3 | 3.47 | 11_03 | 3 | 3.27 |
| 01_04 | 4 | 3.97 | 11_04 | 4 | 3.53 |
| 01_05 | 5 | 4.33 | 11_05 | 5 | 4.07 |
| 02_01 | 1 | 2.97 | 12_01 | 1 | 1.40 |
| 02_02 | 2 | 2.50 | 12_02 | 2 | 1.37 |
| 02_03 | 3 | 3.23 | 12_03 | 3 | 2.17 |
| 02_04 | 4 | 3.40 | 12_04 | 4 | 2.50 |
| 02_05 | 5 | 4.23 | 12_05 | 5 | 3.33 |
| 03_01 | 1 | 1.07 | 13_01 | 1 | 1.83 |
| 03_02 | 2 | 1.47 | 13_02 | 2 | 2.40 |
| 03_03 | 3 | 2.27 | 13_03 | 3 | 3.33 |
| 03_04 | 4 | 3.30 | 13_04 | 4 | 4.13 |
| 03_05 | 5 | 3.37 | 13_05 | 5 | 4.27 |
| 04_01 | 1 | 1.30 | 14_01 | 1 | 1.73 |
| 04_02 | 2 | 1.80 | 14_02 | 2 | 2.07 |
| 04_03 | 3 | 2.90 | 14_03 | 3 | 2.87 |
| 04_04 | 4 | 3.20 | 14_04 | 4 | 3.43 |
| 04_05 | 5 | 3.77 | 14_05 | 5 | 4.33 |
| 05_01 | 1 | 1.33 | 15_01 | 1 | 1.60 |
| 05_02 | 2 | 1.37 | 15_02 | 2 | 2.27 |
| 05_03 | 3 | 2.33 | 15_03 | 3 | 3.77 |
| 05_04 | 4 | 2.67 | 15_04 | 4 | 3.53 |
| 05_05 | 5 | 3.07 | 15_05 | 5 | 3.87 |
| 06_01 | 1 | 2.83 | 16_01 | 1 | 4.57 |
| 06_02 | 2 | 1.60 | 16_02 | 2 | 4.40 |
| 06_03 | 3 | 2.80 | 16_03 | 3 | 4.87 |
| 06_04 | 4 | 3.70 | 16_04 | 4 | 4.80 |
| 06_05 | 5 | 3.70 | 16_05 | 5 | 4.83 |
| 07_01 | 1 | 2.47 | 17_01 | 1 | 2.30 |
| 07_02 | 2 | 3.43 | 17_02 | 2 | 2.93 |
| 07_03 | 3 | 3.53 | 17_03 | 3 | 3.53 |
| 07_04 | 4 | 3.90 | 17_04 | 4 | 4.37 |
| 07_05 | 5 | 4.60 | 17_05 | 5 | 4.03 |
| 08_01 | 1 | 1.30 | 18_01 | 1 | 3.30 |
| 08_02 | 2 | 2.13 | 18_02 | 2 | 3.70 |
| 08_03 | 3 | 3.97 | 18_03 | 3 | 3.73 |
| 08_04 | 4 | 3.57 | 18_04 | 4 | 4.40 |
| 08_05 | 5 | 4.47 | 18_05 | 5 | 4.47 |
| 09_01 | 1 | 1.47 | 19_01 | 1 | 2.07 |
| 09_02 | 2 | 2.03 | 19_02 | 2 | 3.40 |
| 09_03 | 3 | 3.13 | 19_03 | 3 | 4.27 |
| 09_04 | 4 | 3.77 | 19_04 | 4 | 4.50 |
| 09_05 | 5 | 4.33 | 19_05 | 5 | 4.70 |
| 10_01 | 1 | 1.70 | 20_01 | 1 | 3.47 |
| 10_02 | 2 | 2.83 | 20_02 | 2 | 4.00 |
| 10_03 | 3 | 3.63 | 20_03 | 3 | 4.43 |
| 10_04 | 4 | 4.47 | 20_04 | 4 | 4.57 |
| 10_05 | 5 | 4.73 | 20_05 | 5 | 4.83 |
| 3DIQA | LCC | SROCC | KROCC | RMSE |
|---|---|---|---|---|
| MSE | 0.5664 | 0.7697 | 0.5792 | 0.4235 |
| PSNR | −0.7584 | −0.7700 | −0.5796 | 0.3886 |
| SSIM | −0.4961 | −0.6080 | −0.4409 | 0.3722 |
| MSSIM | −0.5864 | −0.7657 | −0.5772 | 0.4075 |
| VSNR | −0.7549 | −0.7876 | −0.5983 | 0.3851 |
| VIF | −0.5809 | −0.6536 | −0.4681 | 0.4476 |
| VIFP | −0.5501 | −0.6041 | −0.4360 | 0.4200 |
| UQI | −0.1721 | −0.2778 | −0.1967 | 0.4161 |
| IFC | −0.4443 | −0.5223 | −0.3541 | 0.4349 |
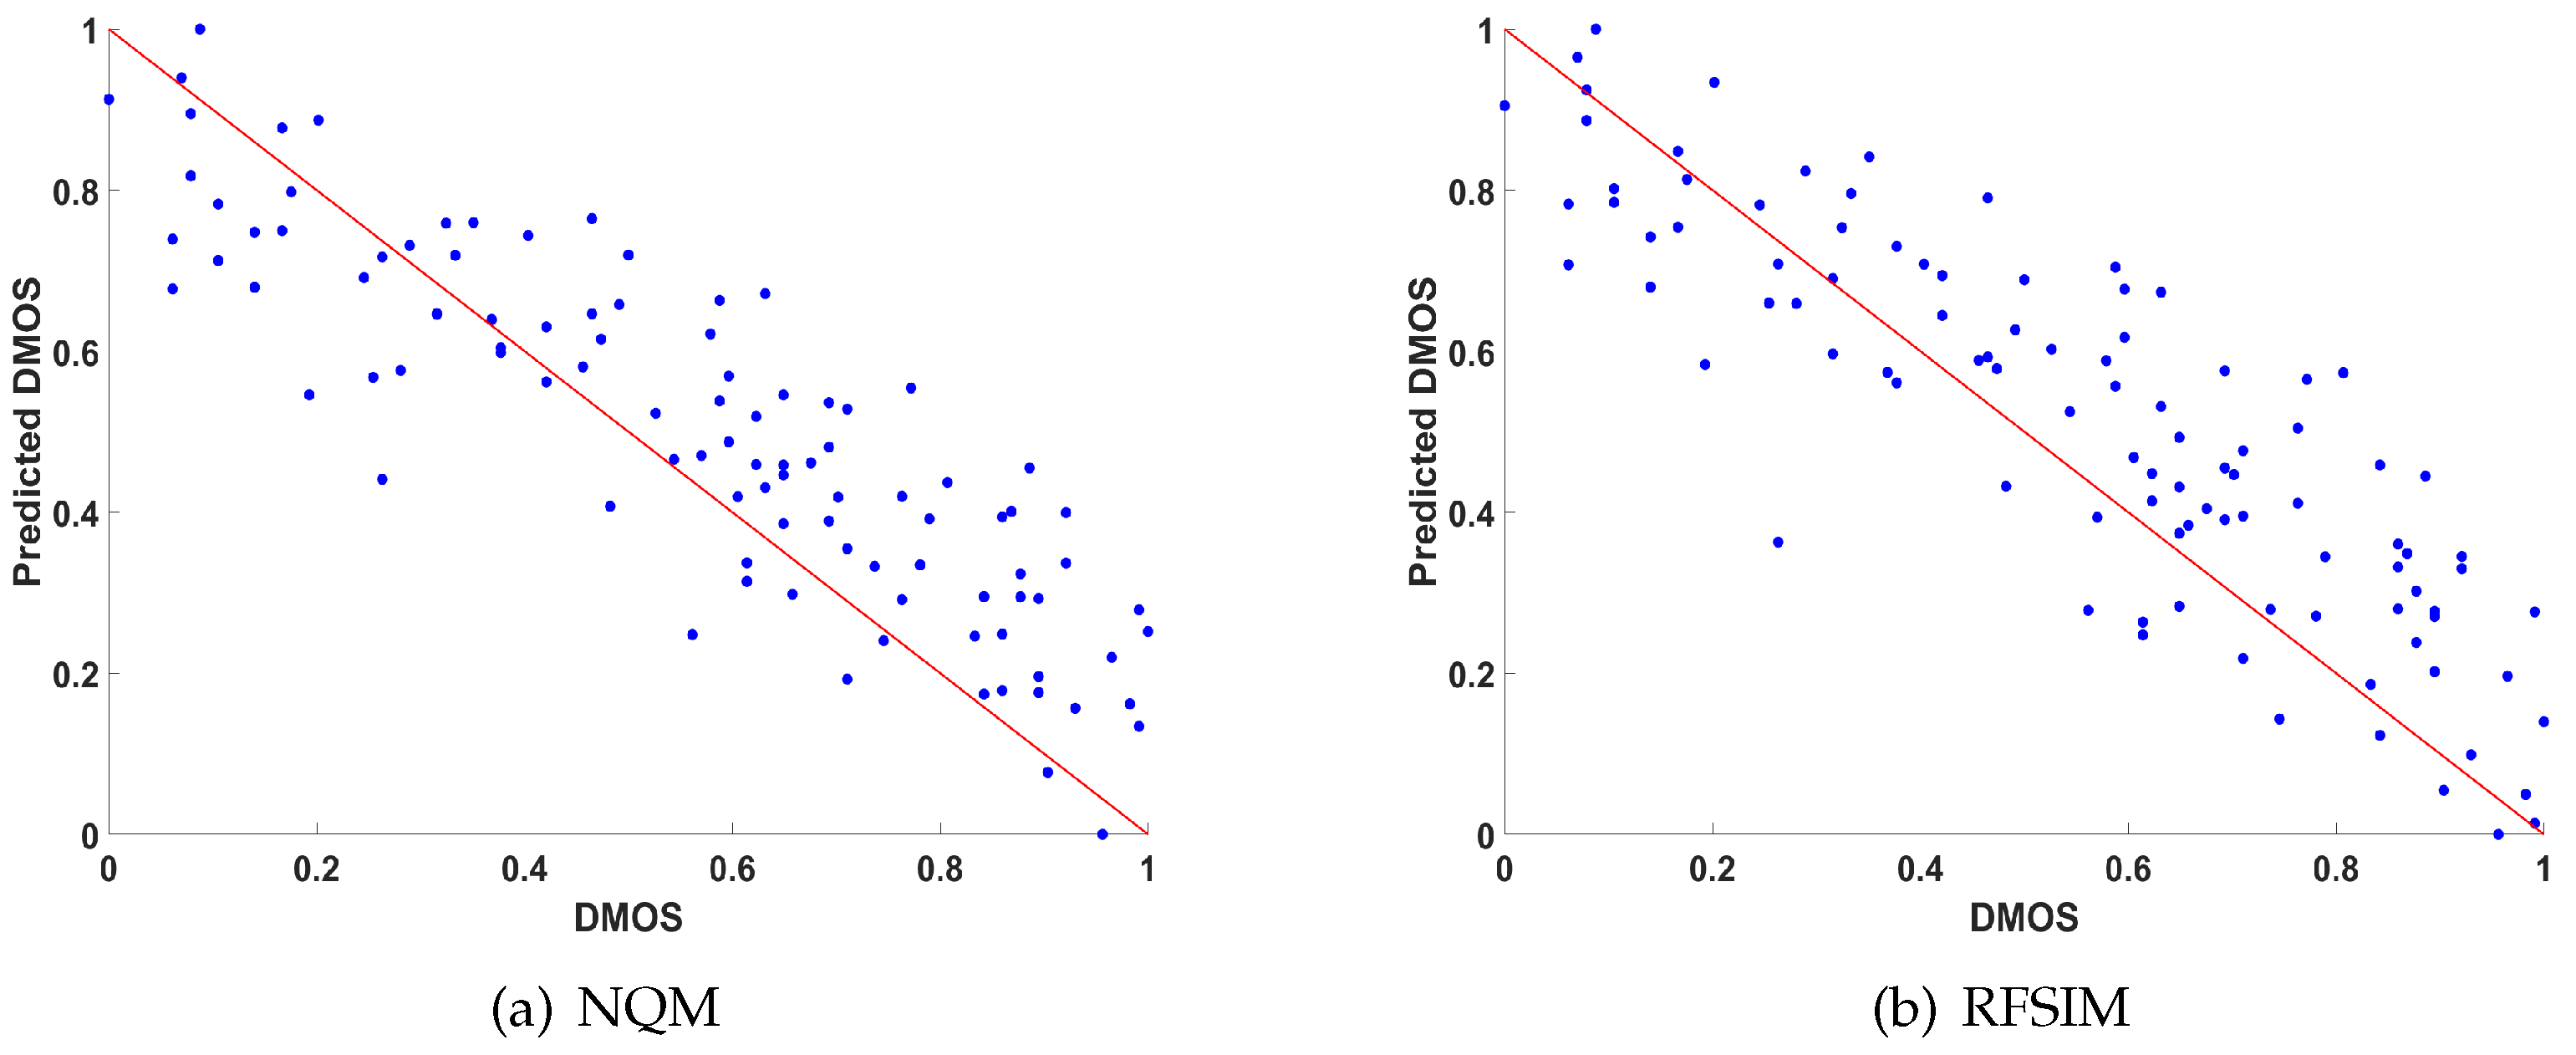
| NQM | −0.8710 | −0.8773 | −0.6863 | 0.4129 |
| WSNR | −0.7575 | −0.7677 | −0.5824 | 0.4169 |
| SNR | −0.6116 | −0.6648 | −0.4843 | 0.4043 |
| AD | −0.0641 | −0.1230 | −0.0973 | 0.2599 |
| MD | 0.5951 | 0.5931 | 0.4198 | 0.1811 |
| NAE | 0.5245 | 0.5725 | 0.4093 | 0.2210 |
| NCC | −0.6187 | −0.6217 | −0.4518 | 0.3929 |
| SC | 0.5960 | 0.5936 | 0.4303 | 0.3159 |
| BIQI | −0.3212 | −0.2415 | −0.1371 | 0.3616 |
| BRISQUE | −0.1516 | −0.1115 | −0.0556 | 0.3610 |
| NIQE | 0.5603 | 0.5726 | 0.3991 | 0.1968 |
| FSIMC | −0.6652 | −0.7458 | −0.5512 | 0.3524 |
| RFSIM | −0.8607 | −0.8659 | −0.6814 | 0.4262 |
| PSNRHVSM | −0.7885 | −0.7950 | −0.6125 | 0.4026 |
Disclaimer/Publisher’s Note: The statements, opinions and data contained in all publications are solely those of the individual author(s) and contributor(s) and not of MDPI and/or the editor(s). MDPI and/or the editor(s) disclaim responsibility for any injury to people or property resulting from any ideas, methods, instructions or products referred to in the content. |
© 2022 by the authors. Licensee MDPI, Basel, Switzerland. This article is an open access article distributed under the terms and conditions of the Creative Commons Attribution (CC BY) license (https://creativecommons.org/licenses/by/4.0/).
Share and Cite
Moreno Escobar, J.J.; Aguilar del Villar, E.Y.; Morales Matamoros, O.; Chanona Hernández, L. 3D22MX: Performance Subjective Evaluation of 3D/Stereoscopic Image Processing and Analysis. Mathematics 2023, 11, 171. https://0-doi-org.brum.beds.ac.uk/10.3390/math11010171
Moreno Escobar JJ, Aguilar del Villar EY, Morales Matamoros O, Chanona Hernández L. 3D22MX: Performance Subjective Evaluation of 3D/Stereoscopic Image Processing and Analysis. Mathematics. 2023; 11(1):171. https://0-doi-org.brum.beds.ac.uk/10.3390/math11010171
Chicago/Turabian StyleMoreno Escobar, Jesús Jaime, Erika Yolanda Aguilar del Villar, Oswaldo Morales Matamoros, and Liliana Chanona Hernández. 2023. "3D22MX: Performance Subjective Evaluation of 3D/Stereoscopic Image Processing and Analysis" Mathematics 11, no. 1: 171. https://0-doi-org.brum.beds.ac.uk/10.3390/math11010171