
Multi-Objective Gray Wolf Optimizer with Cost-Sensitive Feature Selection for Predicting Students’ Academic Performance in College English


Abstract
:1. Introduction
- Propose a new position update method of binary gray wolf optimizer (GWO) to balance exploration and exploitation.
- Propose an adaptive mutation of Pareto solutions to increase exploitation space and convergence.
- Propose a repairing strategy of duplicate solutions to improve the diversity of solutions and reduce feature cost.
- Propose a multi-objective cost-sensitive feature selection for predicting students’ academic performance in college English which may be adapted for real-world applications.
2. Related Works
2.1. The Prediction of Students’ Academic Performance Based on Multi-Objective Feature Selection
2.2. Multi-Objective Cost-Sensitive Feature Selection
2.3. Gray Wolf Optimizer
3. Multi-Objective Gray Wolf Optimizer for Cost-Sensitive Feature Selection
3.1. Problem Description
3.2. Binary Gray Wolf Optimizer
3.3. The Selection of , , and
- (1)
- The number of non-dominated solutions is greater than or equal to 3.
- (2)
- The number of non-dominated solutions is less than 3.
3.4. The Adaptive Mutation of Pareto Optimal Solutions
| Algorithm 1: Mutation |
 |
3.5. Repairing Duplicate Solutions
4. Experimental Results and Analysis
4.1. Benchmark Datasets
4.2. Experimental Analysis
- 1.
- Hypervolume (HV)
- 2.
- Inverted generational distance (IGD)
- 3.
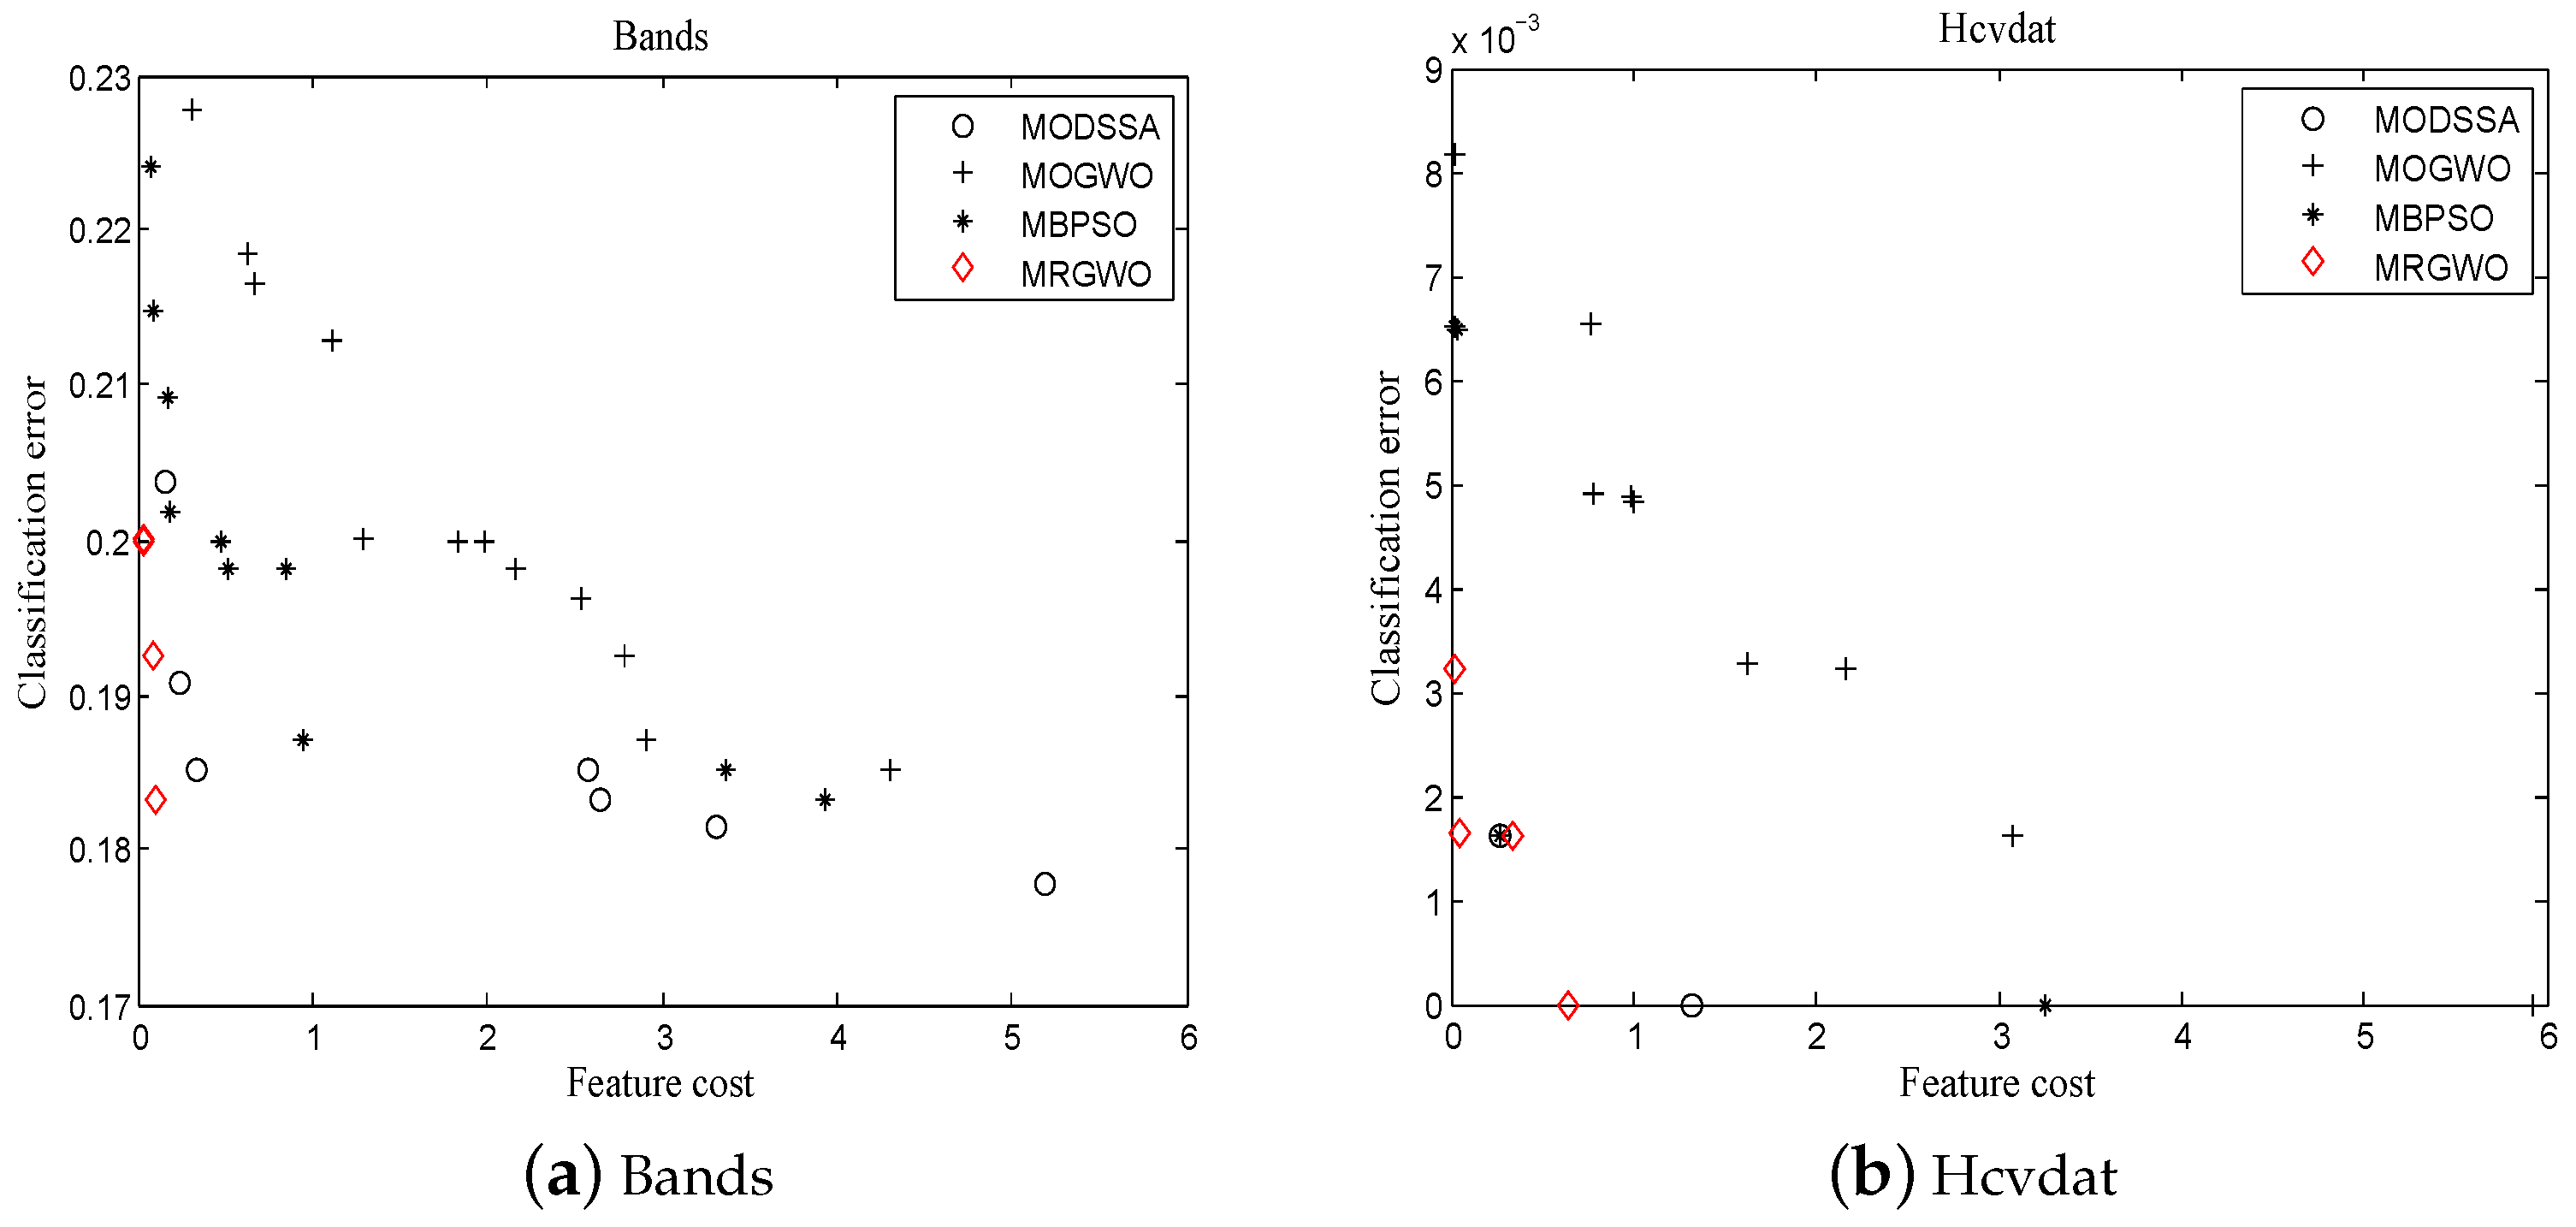
- Pareto solutions
5. The Prediction of Students’ Academic Performance in College English
5.1. Data Description
5.2. Cost-Sensitive Students’ Academic Performance in College English
5.3. Discussion
6. Conclusions
Author Contributions
Funding
Data Availability Statement
Conflicts of Interest
References
- Morales, M.; Salmerón, A.; Maldonado, A.D.; Masegosa, A.R.; Rumí, R. An Empirical Analysis of the Impact of Continuous Assessment on the Final Exam Mark. Mathematics 2022, 10, 3994. [Google Scholar] [CrossRef]
- Yağcı, M. Educational data mining: Prediction of students’ academic performance using machine learning algorithms. Smart Learn. Environ. 2022, 9, 11. [Google Scholar] [CrossRef]
- Thakur, N. A large-scale dataset of Twitter chatter about online learning during the current COVID-19 Omicron wave. Data 2022, 7, 109. [Google Scholar] [CrossRef]
- Cerquitelli, T.; Meo, M.; Curado, M.; Skorin-Kapov, L.; Tsiropoulou, E.E. Machine Learning Empowered Computer Networks. Comput. Networks 2023, 230, 109807. [Google Scholar] [CrossRef]
- Chicharro, F.I.; Giménez, E.; Sarría, Í. The enhancement of academic performance in online environments. Mathematics 2019, 7, 1219. [Google Scholar] [CrossRef] [Green Version]
- Segura, M.; Mello, J.; Hernández, A. Machine Learning Prediction of University Student Dropout: Does Preference Play a Key Role? Mathematics 2022, 10, 3359. [Google Scholar] [CrossRef]
- Liu, C.; Wang, H.; Yuan, Z. A Method for Predicting the Academic Performances of College Students Based on Education System Data. Mathematics 2022, 10, 3737. [Google Scholar] [CrossRef]
- Ali, M.A.; PP, F.R.; Abd Elminaam, D.S. An Efficient Heap Based Optimizer Algorithm for Feature Selection. Mathematics 2022, 10, 2396. [Google Scholar] [CrossRef]
- Pan, J.S.; Hu, P.; Snášel, V.; Chu, S.C. A survey on binary metaheuristic algorithms and their engineering applications. Artif. Intell. Rev. 2023, 56, 6101–6167. [Google Scholar] [CrossRef]
- Pan, J.S.; Zhang, L.G.; Wang, R.B.; Snášel, V.; Chu, S.C. Gannet optimization algorithm: A new metaheuristic algorithm for solving engineering optimization problems. Math. Comput. Simul. 2022, 202, 343–373. [Google Scholar] [CrossRef]
- Tanwar, A.; Alghamdi, W.; Alahmadi, M.D.; Singh, H.; Rana, P.S. A Fuzzy-Based Fast Feature Selection Using Divide and Conquer Technique in Huge Dimension Dataset. Mathematics 2023, 11, 920. [Google Scholar] [CrossRef]
- Lee, J.; Jang, H.; Ha, S.; Yoon, Y. Android malware detection using machine learning with feature selection based on the genetic algorithm. Mathematics 2021, 9, 2813. [Google Scholar] [CrossRef]
- Hu, P.; Pan, J.S.; Chu, S.C.; Sun, C. Multi-surrogate assisted binary particle swarm optimization algorithm and its application for feature selection. Appl. Soft Comput. 2022, 121, 108736. [Google Scholar] [CrossRef]
- Hu, P.; Pan, J.S.; Chu, S.C. Improved binary grey wolf optimizer and its application for feature selection. Knowl. Based Syst. 2020, 195, 105746. [Google Scholar] [CrossRef]
- Kostopoulos, G.; Fazakis, N.; Kotsiantis, S.; Sgarbas, K. Multi-objective Optimization of C4. 5 Decision Tree for Predicting Student Academic Performance. In Proceedings of the 2019 10th International Conference on Information, Intelligence, Systems and Applications (IISA), Patras, Greece, 15–17 July 2019; IEEE: Patras, Greece; pp. 1–4. [Google Scholar]
- González-Gallardo, S.; Ruiz, A.B.; Luque, M. Analysis of the well-being levels of students in spain and finland through interval multiobjective linear programming. Mathematics 2021, 9, 1628. [Google Scholar] [CrossRef]
- Marcenaro-Gutiérrez, O.D.; González-Gallardo, S.; Luque, M. Evaluating the potential trade-off between students’ satisfaction and school performance using evolutionary multiobjective optimization. Rairo-Oper. Res. 2021, 55, S1051–S1067. [Google Scholar] [CrossRef] [Green Version]
- Lee, J.; Kim, T.; Su, M. Reassessing school effectiveness: Multi-objective value-added measures (MOVAM) of academic and socioemotional learning. Stud. Educ. Eval. 2021, 68, 100972. [Google Scholar] [CrossRef]
- Acosta-Acosta, D.F.; El-Rayes, K. Optimal design of classroom spaces in naturally-ventilated buildings to maximize occupant satisfaction with human bioeffluents/body odor levels. Build. Environ. 2020, 169, 106543. [Google Scholar] [CrossRef]
- Hwang, R.L.; Liao, W.J.; Chen, W.A. Optimization of energy use and academic performance for educational environments in hot-humid climates. Build. Environ. 2022, 222, 109434. [Google Scholar] [CrossRef]
- Wang, Y.; Liu, Z.; Wang, G.G. Improved differential evolution using two-stage mutation strategy for multimodal multi-objective optimization. Swarm Evol. Comput. 2023, 78, 101232. [Google Scholar] [CrossRef]
- Zhang, H.; Wang, G.G. Improved NSGA-III using transfer learning and centroid distance for dynamic multi-objective optimization. Complex Intell. Syst. 2021, 9, 1143–1164. [Google Scholar] [CrossRef]
- Wang, G.G.; Gao, D.; Pedrycz, W. Solving multiobjective fuzzy job-shop scheduling problem by a hybrid adaptive differential evolution algorithm. IEEE Trans. Ind. Inform. 2022, 18, 8519–8528. [Google Scholar] [CrossRef]
- Zhang, Y.; Gong, D.W.; Cheng, J. Multi-objective particle swarm optimization approach for cost-based feature selection in classification. IEEE/ACM Trans. Comput. Biol. Bioinform. 2015, 14, 64–75. [Google Scholar] [CrossRef] [PubMed]
- Liao, S.; Zhu, Q.; Qian, Y.; Lin, G. Multi-granularity feature selection on cost-sensitive data with measurement errors and variable costs. Knowl. Based Syst. 2018, 158, 25–42. [Google Scholar] [CrossRef]
- An, C.; Zhou, Q. A cost-sensitive feature selection method for high-dimensional data. In Proceedings of the 2019 14th International Conference on Computer Science & Education (ICCSE), Toronto, ON, Canada, 19–21 August 2019; IEEE: Toronto, ON, Canada; pp. 1089–1094. [Google Scholar]
- Zhang, Y.; Cheng, S.; Shi, Y.; Gong, D.W.; Zhao, X. Cost-sensitive feature selection using two-archive multi-objective artificial bee colony algorithm. Expert Syst. Appl. 2019, 137, 46–58. [Google Scholar] [CrossRef]
- Hu, Y.; Zhang, Y.; Gong, D. Multiobjective particle swarm optimization for feature selection with fuzzy cost. IEEE Trans. Cybern. 2020, 51, 874–888. [Google Scholar] [CrossRef]
- Panwar, L.K.; Reddy, S.; Verma, A.; Panigrahi, B.K.; Kumar, R. Binary grey wolf optimizer for large scale unit commitment problem. Swarm Evol. Comput. 2018, 38, 251–266. [Google Scholar] [CrossRef]
- Aljarah, I.; Habib, M.; Faris, H.; Al-Madi, N.; Heidari, A.A.; Mafarja, M.; Abd Elaziz, M.; Mirjalili, S. A dynamic locality multi-objective salp swarm algorithm for feature selection. Comput. Ind. Eng. 2020, 147, 106628. [Google Scholar] [CrossRef]
- Al-Tashi, Q.; Abdulkadir, S.J.; Rais, H.M.; Mirjalili, S.; Alhussian, H.; Ragab, M.G.; Alqushaibi, A. Binary multi-objective grey wolf optimizer for feature selection in classification. IEEE Access 2020, 8, 106247–106263. [Google Scholar] [CrossRef]
- Lichman, M. UCI Machine Learning Repository; University of California, School of Information and Computer Science: Irvine, CA, USA, 2013; Available online: http://archive.ics.uci.edu/ml (accessed on 2 June 2023).


| Algorithm | Main Parameters |
|---|---|
| MODSSA | Vmax = 6; alpha = 50; beta = 0.2; |
| MOGWO | alpha = 0.1; nGrid = 10; beta = 4; gamma = 2; |
| MBPSO | wMax = 0.9; wMin = 0.4; c1 = 2; c2 = 0.5; Vmax = 6; |
| MRGWO | RP = min (dim, 20); |
| Dataset | Attributes | Instances |
|---|---|---|
| Bands | 15 | 540 |
| Hcvdat | 13 | 615 |
| Heart | 13 | 270 |
| Lung Cancer | 56 | 32 |
| Lymphography | 18 | 148 |
| Voting | 16 | 435 |
| Waveform | 40 | 5000 |
| Dataset | MODSSA | MOGWO | MBPSO | MRGWO | ||||
|---|---|---|---|---|---|---|---|---|
| AVG | STD | AVG | STD | AVG | STD | AVG | STD | |
| Bands | 0.1020 | 0.0676 | 0.0600 | 0.0434 | 0.1128 | 0.0533 | 0.1577 | 0.0333 |
| Hcvdat | 0.0885 | 0.1453 | 0.0835 | 0.1245 | 0.1913 | 0.2009 | 0.4173 | 0.1374 |
| Heart | 0.0858 | 0.0270 | 0.0434 | 0.0301 | 0.0908 | 0.0287 | 0.1208 | 0.0181 |
| Lung Cancer | 0.1254 | 0.1094 | 0.0714 | 0.0844 | 0.1205 | 0.1110 | 0.3175 | 0.0891 |
| Lymphography | 0.1044 | 0.0718 | 0.0509 | 0.0502 | 0.1389 | 0.0688 | 0.2321 | 0.0650 |
| Voting | 0.1017 | 0.0343 | 0.0598 | 0.0293 | 0.1143 | 0.0292 | 0.1542 | 0.0190 |
| Waveform | 0.0655 | 0.0252 | 0.0497 | 0.0268 | 0.0781 | 0.0319 | 0.1407 | 0.0132 |
| 0/0/7 | 0/0/7 | 0/0/7 | 7/0/0 | |||||
| Rank | 2.9 | 4 | 2.1 | 1 | ||||
| p-value | 1.72 × 10⁻⁴ | |||||||
| Dataset | MODSSA | MOGWO | MBPSO | MRGWO | ||||
|---|---|---|---|---|---|---|---|---|
| AVG | STD | AVG | STD | AVG | STD | AVG | STD | |
| Bands | 1.0530 | 1.2436 | 0.6526 | 0.2897 | 0.2698 | 0.2100 | 0.3031 | 0.3364 |
| Hcvdat | 2.5266 | 1.6958 | 0.8781 | 0.4530 | 0.4895 | 0.4965 | 0.3359 | 0.5274 |
| Heart | 0.8511 | 0.3996 | 0.9523 | 0.4437 | 0.4893 | 0.4517 | 0.4508 | 0.4002 |
| Lung Cancer | 7.4153 | 1.9070 | 8.7391 | 1.4167 | 6.1559 | 1.2256 | 1.7990 | 2.0285 |
| Lymphography | 1.8822 | 0.7387 | 1.5938 | 0.4896 | 0.5581 | 0.3172 | 0.5071 | 0.5143 |
| Voting | 1.2002 | 0.5172 | 1.2791 | 0.3578 | 0.5872 | 0.2626 | 0.8151 | 0.8897 |
| Waveform | 4.2080 | 0.6678 | 4.4594 | 1.0142 | 2.8389 | 0.7939 | 1.4246 | 1.8262 |
| 0/0/7 | 0/0/7 | 2/2/3 | 5/2/0 | |||||
| Rank | 3.4 | 3.6 | 1.7 | 1.3 | ||||
| p-value | 6.34 × 10⁻⁴ | |||||||
| Dataset | MODSSA | MOGWO | MBPSO | MRGWO |
|---|---|---|---|---|
| Bands | 173.2088 | 171.3202 | 166.3050 | 174.8124 |
| hcvdat | 114.0275 | 116.6707 | 112.5131 | 119.7135 |
| Heart | 141.6788 | 145.0789 | 140.8477 | 148.0447 |
| Lung Cancer | 97.2475 | 100.5291 | 96.6876 | 104.3847 |
| Lymphography | 106.4934 | 109.2627 | 105.3438 | 113.5067 |
| Voting | 109.5657 | 111.3338 | 106.8974 | 115.1446 |
| Waveform | 5715.6133 | 5802.4692 | 5703.0857 | 5718.6597 |
| Feature Category | Feature | Description | Data Type |
|---|---|---|---|
| Demographic features | Gender | Male and Female | Nominal |
| PlaceOrigin | The region of student source | Nominal | |
| Academic features | Major | Liberal Arts, science and engineering, arts, high fees, overseas classes | Nominal |
| CET4/6 | Whether passed CET4/6 | Nominal | |
| Score | Previous English course grades | Nominal | |
| Behavioral features | OnlineTime | The average online time through campus network or WiFi every day (minutes) | Numeric |
| Cost | Average daily cost (RMB) | Numeric | |
| Character | Whether like communication/learning | Nominal | |
| LearningHabits | Study or review | Nominal | |
| Absence | Number of absences | Numeric | |
| Classroom | Classroom performance | Nominal | |
| StudyTime | The average study time through library or classroom (minutes) | Numeric | |
| Family features | Income | Household income status | Nominal |
| Importance | Level of parental attention | Nominal | |
| Class | A & B & C & D & E | Students’ academic performance | Nominal |
Disclaimer/Publisher’s Note: The statements, opinions and data contained in all publications are solely those of the individual author(s) and contributor(s) and not of MDPI and/or the editor(s). MDPI and/or the editor(s) disclaim responsibility for any injury to people or property resulting from any ideas, methods, instructions or products referred to in the content. |
© 2023 by the authors. Licensee MDPI, Basel, Switzerland. This article is an open access article distributed under the terms and conditions of the Creative Commons Attribution (CC BY) license (https://creativecommons.org/licenses/by/4.0/).
Share and Cite
Yue, L.; Hu, P.; Chu, S.-C.; Pan, J.-S. Multi-Objective Gray Wolf Optimizer with Cost-Sensitive Feature Selection for Predicting Students’ Academic Performance in College English. Mathematics 2023, 11, 3396. https://0-doi-org.brum.beds.ac.uk/10.3390/math11153396
Yue L, Hu P, Chu S-C, Pan J-S. Multi-Objective Gray Wolf Optimizer with Cost-Sensitive Feature Selection for Predicting Students’ Academic Performance in College English. Mathematics. 2023; 11(15):3396. https://0-doi-org.brum.beds.ac.uk/10.3390/math11153396
Chicago/Turabian StyleYue, Liya, Pei Hu, Shu-Chuan Chu, and Jeng-Shyang Pan. 2023. "Multi-Objective Gray Wolf Optimizer with Cost-Sensitive Feature Selection for Predicting Students’ Academic Performance in College English" Mathematics 11, no. 15: 3396. https://0-doi-org.brum.beds.ac.uk/10.3390/math11153396