
The Financial Sustainability of Retail Food SMEs Based on Financial Equilibrium and Financial Performance

Faculty of Economics and Law, George Emil Palade University of Medicine, Pharmacy, Science and Technology of Targu Mures, 540142 Targu Mures, Romania
*
Author to whom correspondence should be addressed.
†
These authors contributed equally to this work.
Mathematics 2023, 11(15), 3410; https://0-doi-org.brum.beds.ac.uk/10.3390/math11153410
Submission received: 28 June 2023
/
Revised: 1 August 2023
/
Accepted: 2 August 2023
/
Published: 4 August 2023
(This article belongs to the Special Issue Statistical Methods of Analyzing Financial Equilibrium, Performance and Risk)
Abstract
:The aim of this study was to investigate the financial sustainability of retail food SMEs for the 2016–2021 period, in Romania, from the perspective of financial equilibrium and performance. A multivariate analysis was used, including a correlation analysis, a principal component analysis (PCA), and a cluster analysis. The empirical results show a positive link between the financial performance and financial equilibrium indicators. We employed the PCA in order to build a composite financial index using financial equilibrium indicators (ratios of liquidity, solvency, collection, and payment period) and financial performance indicators (Return on Assets and Return on Equity). The results show that financial equilibrium and performance are the two main dimensions which the financial sustainability index (FSI) was constructed on. Taking into account the dimensions of financial sustainability, the analyzed SMEs were clustered in four homogeneous clusters. The research findings clearly demonstrated that the retail food SMEs with a good/acceptable financial sustainability also have a good/acceptable financial balance and performance situation. Furthermore, a significant part of the analyzed SMEs faces difficulties regarding financial sustainability, being characterized by the lowest values of FSI, determined by both an uncertain situation in terms of liquidity, leading to a financial disequilibrium, and a negative financial performance. Therefore, this research emphasizes some specific measures that need to be taken to boost financial sustainability of these businesses in the retail food sector.
Keywords:
financial equilibrium; financial performance; financial sustainability; composite index; correlation analysis; principal component analysis; cluster analysis; retail food SMEsMSC:
62H20; 62H25; 62H301. Introduction
In such an unpredictable and ever-changing environment, as today’s economies are characterized [1], the flexibility in the economic and financial stability context and the access to the most relevant and effective financial information are essential elements for the survival and sustainability of businesses. The long-term sustainability of enterprises is the most important factor in the development of national economies. The survival, the development, and sustainability of enterprises depend, first of all, on their development potential, which, in turn, depends on the investment possibilities [2]. These are determined by the financial performance of enterprises, namely their level of profitability.
The ability of enterprises to generate profit (providing part of the sources for future investments) together with their ability to pay both their current debts and to engage in external sources to supplement their own sources of investment are the key factors of financial sustainability in the long term [3,4,5]. The financial sustainability of enterprises, based on financial performance, as well as on a stable financial situation (financial equilibrium), is the goal of all enterprises, regardless of their size and field of activity [6,7].
This study focuses on the analysis of the interplay between financial equilibrium and financial performance as necessary conditions for the financial sustainability of micro-, small-, and medium-sized enterprises with retail food activity in Romania, for the 2016-2021 period. The presence and expansion of super- and hypermarkets of various chain stores, present a continuous threat to smaller grocery stores [8]. Although hyper- and supermarkets hold a significant share of the retail food, the importance of SMEs in this sector (and not only) is not negligible, on the contrary quite necessary for a sustainable economic growth of national economies [1,9,10]. Prior studies [9,11] highlighted that small businesses in retail food sectors have faced financial and survival difficulties. Taking these aspects into account, we consider that more attention needs to be paid to improving the financial sustainability of retail food SMEs as a key precondition for a contribution to economic growth. For these reasons, there is a real need for methods and techniques that assess the financial sustainability of businesses. These can provide businesses with the technical and informational support in the development of financial plans and the implementation of appropriate measures to improve the situation and ensure financial sustainability.
SMEs have an important role for both local communities and the national economy [12,13]. The importance of SMEs in most economies, particularly in the developing countries, is based on their large number, the significant number of employees they employ, and their substantial contribution to the Gross Domestic Product (GDP) [14,15,16,17,18]. Analyzing the number of enterprises according to their size and the field of activity (in Romania), most enterprises are classified as micro-, small-, and medium-sized enterprises and are registered in the field of trade (Figure 1). According to European statistics for the year 2022, the number of small and medium enterprises (SMEs) in the EU (for the non-financial sector) was 23,190,714 enterprises [19], which account for 99.81% of the total of 23,233,582 enterprises [20]. In Romania, according to European Commission data, the SMEs account for 99.7% of all businesses, employing 2,718,572 people, which represents 65.8% of all employees, and achieve 58.0% of the total added value (by an amount of EUR 52.0 billion) created in national economy, in 2021 [4]. As a field of activity, trade is a key driver sector of the national economy in Romania, as national statistics show (Figure 1). Moreover, the most recent data (2022) show that over 18% of the GDP was created in the trade sector [21].
The link between financial equilibrium and financial performance has been the subject of empirical studies conducted by various researchers [6,23,24,25,26]. Studies such as those by Batrancea [6], Zygmunt [25], Nyabwanga et al. [27], and Horobet et al. [28] have emphasized this link, particularly in the context of enterprises operating in other sectors than the retail food industry. As for the food industry, prior studies [29,30,31,32] focused only on the financial performance of companies in relationship with different non-financial aspects (management systems, consumer satisfaction, social, environmental, and governance factors). Furthermore, researchers who analyzed the financial performance of companies in the field of food trade, focused more on large hyper- and supermarkets [11,33] or on companies listed on the stock exchange, which are usually large companies [34], and less on SMEs in this sector (at least in Romania). We were able to find only one empirical study [28] which analyzed retail food enterprises (having 4-digit NACE Code 4711—retail sale in non-specialized stores with food, beverages, or tobacco predominating, to companies that are headquartered in the European Union) from the 20 European Union countries (including Romania) in terms of financial equilibrium (expressed by liquidity and solvency indicators) in relation to the financial performance. Thus, there is a research gap regarding the financial analysis of the SMEs in Romania, which is mainly due to the inaccessibility of the complete financial information of these companies. Consequently, most of the studies conducted their financial analysis on large or listed companies, for which the complete financial statements are publicly available.
In the light of these considerations, the aim of this article is to assess the financial sustainability of retail food SMEs in Romania, for the 2016–2021 period, based on a financial sustainability index which takes into account both critical pillars of financial sustainability (financial equilibrium and financial performance), in order to identify some specific measures that need to be taken to boost financial sustainability of these businesses. The research objectives focused on (i) analyzing the interrelationship between the financial equilibrium and financial performance of retail food SMEs; (ii) constructing a financial sustainability index to evaluate the financial sustainability of retail food SMEs; (iii) identifying the common features and differences between retail food SMEs relative to the dimensions of financial sustainability; and (iv) emphasizing the specific measures that should be implemented by both retail food SMEs managers and governmental institutions to improve profitability and long-term financial sustainability.
The equilibrium and the financial performance of the enterprises were evaluated based on the most relevant financial indicators such as: current liquidity, quick liquidity, general financial solvency, ratio of collection and payment period, return on assets, and return on equity. Moreover, this research emphasizes some specific measures that need to be taken to boost the financial sustainability of the businesses.
While several empirical studies have explored the interplay between financial equilibrium and financial performance, there is a noticeable gap in taking an integrative and holistic approach to financial sustainability of SMEs. Our paper aims to fill this gap by measuring the financial sustainability of businesses through the construction of a composite index (financial sustainability index), in the case of SMEs in the retail food sector, using principal component analysis (PCA), based on multiple dimensions of financial equilibrium and performance. Moreover, the originality of the paper lies in the geographic context of the research, taking into account that, in Romania, there is no other study that explores the financial sustainability of SMEs in the retail food sector, based on a composite index. Therefore, the novelty of the paper resides in the fact that, to the best of our knowledge, this is the first empirical research which investigates the financial sustainability of retail food SMEs for the 2016–2021 period, in Romania, from the perspective of financial equilibrium and financial performance. Also, the novelty of our paper stems from the multivariate analysis (correlation analysis, PCA and cluster analysis) of the selected financial indicators in order to highlight that financial equilibrium and financial performance are key pillars of financial sustainability in the case of retail food SMEs.
Since financial sustainability is a major challenge for the SMEs in the retail food sector (and others), the results obtained in this study support a better understanding of its main dimensions and determinants, and thus prove to be a valuable contribution to the development of the financial literature and an important way to design more effective measures that can improve the business financial sustainability.
The next section draws on the theoretical framework as well as the research hypotheses. Section 3 outlines the sample, chosen variables and statistical methods used. The fourth section provides the results of the research and the discussions. The last section presents the conclusions and the main implications of the results as well as the limitations of the study and the further possible research.
2. Literature Review and Research Hypotheses
2.1. The Interrelationship between Financial Equilibrium and Financial Performance
The financial equilibrium is one of the most important aspects regarding the financial stability of an economic entity and its long-term financial sustainability. Financial stability eliminates or significantly reduces the risk of bankruptcy, and ensures healthy financing and efficient use of the company’s assets. Moreover, financial stability can ensure an exclusive advantage over those companies that have an unfavorable situation [35].
The financial position of economic entities reflects the correlations between the assets owned and used by the enterprise and the sources of financing (debts and equity). Depending on these correlations, the businesses can ensure sustainable existence and growth. The analysis of the financial position is aimed at assessing the degree to which the sources of financing are correlated and harmonized with the need for fixed and current assets (with the resources necessary to carry out the activity) [36].
The goal of businesses is to achieve a stable financial position, called financial equilibrium. Financial equilibrium can be analyzed with the help of specific indicators which are aimed at the relationship between the permanent and temporary needs compared to the permanent and temporary sources. Two types of indicators are used, i.e., indicators in absolute sizes such as working capital [37], working capital needs, net treasury, as well as indicators in relative sizes, such as liquidity and solvency ratios [38].
The permanent need (fixed assets) must be financed from permanent sources (equity and long-term liabilities). The temporary need (current assets) must be primarily financed from temporary sources (short-term liabilities), as well as from the surplus of permanent capital, remaining after the financing of fixed assets. Failure to comply with the above principle can lead to various risks (loss of financial autonomy) and financial instability (insolvency) [36].
Asset management, i.e., the efficiency of the use of current assets owned by the enterprise, is necessary and constitutes one of the most important factors regarding the improvement of financial balance and financial performance [23].
Starting from the definition of financial equilibrium, which, according to Anghel et al., “is the expression of solvency and liquidity” [36] (p. 101), or “the degree to which a company manages to covers its short-term and long-term liabilities from its assets” [23] (p. 2) the main indicators that can characterize financial equilibrium are the liquidity indicators (which reflect the ability to pay in short term) and the solvency indicators (reflecting the long-term ability to pay). These indicators allow the assessment of the creditworthiness of entities, which can reflect the financial risk to which investors are exposed.
The liquidity is a concept widely used and analyzed in the literature, and in most cases it is related to risk and financial performance [36]. Liquidity can characterize the ability of businesses to meet their current debts. Fenyves et al. [9] underlined that the financial condition of enterprises plays a crucial role in their sustainability. A company’s liquidity level can reflect its financial stability or liquidity problems which can lead to financial instability, even insolvency and bankruptcy. In the case of SMEs, liquidity and working capital level are the most important indicators that show the level of enterprise financial security [39]. Financial equilibrium is also analyzed by Batrancea [6] based on several liquidity indicators, such as general liquidity (Current Ratio), reduced liquidity (Quick Ratio) and financial leverage (Debt to Equity Ratio). According to Batrancea [40], the liquidity indicators can characterize the liquidity state of an enterprise and the financial leverage indicator evaluates the solvency of the enterprise. Moreover, the same author pointed out that there is a direct and positive link between the state of financial balance (determined by the aforementioned three indicators) and financial performance.
Financial performance is the main goal of companies, and it entails efficiency and profitability in order to create value for shareholders. The financial stability and health of a firm can be evaluated based on the financial performance indicators, which measure how well a firm uses its assets to generate revenues [41].
The efficiency of a company’s operations is characterized by the manner in which its assets are utilized, which, in turn, directly impacts its financial performance [34]. Financial performance is also influenced by the structure of assets and liabilities, as demonstrated by Batrancea [42], in the case of 45 banks from Europe, the United States of America, Canada, and Israel. There are several possibilities to evaluate financial performance, but the key metrics are Return on Assets (ROA) and Return on Equity (ROE) indicators [43].
Suchanek and Kralova [29] analyzed the financial performance of companies in the food industry in the Czech Republic based on ROA, ROE, and Asset Turnover indicators. Moreover, the authors pointed out that financial performance was directly influenced by customer expectations. In the case of the Polish food industry, financial performance of enterprises was analyzed by Kafel and Sikora [30] based on ROA, ROE, and return on sales (ROS) to evaluate the link between management maturity (assessed from the perspective of applied management systems) and financial performance. Sandberg et al., [31], analyzing 83 companies in the food industry in 18 European countries have identified that firms’ financial performance (ROE and ROA) was influenced by social, environmental, and governance factors.
The close connection between financial performance (assessed most often with the profitability indicators ROA, ROE, Economic Value Added—EVA) and financial balance (determined primarily with the help of liquidity and solvency indicators), appears and is analyzed in numerous studies, from different fields of activity. Financial equilibrium is closely related to financial performance, as shown by Batrancea [6], based on a study conducted on 34 companies listed on the New York Stock Exchange. The author defines the notion of financial equilibrium, as the possibility of companies to honor their debts (both in the short term and in the long term), which can be measured by liquidity and solvency indicators. Moreover, the author defines the notion of financial performance which characterizes the possibilities of companies to generate profit. The most frequently used indicators of financial performance, in relation to financial equilibrium, are ROE and/or ROA [44,45,46].
There are a lot of studies that focus on the influence of financial equilibrium on financial performance. For instance, Li et al. [24] showed a bidirectional link between the level of liquidity and financial performance, determined by the ROE indicator. Another study [38] considers that liquidity can be a decisive factor in financial crises, and thus, it needs to be taken into account in any analysis of financial performance and balance. Based on a study conducted of the financial statements of companies listed on the Polish stock exchange, in the IT sector, Zygmunt [25] concludes that there is a significant relationship between liquidity and profitability. Thus, in the case of the Polish listed IT companies where there is a higher level of the liquidity indicators (accounts payables conversion period, receivable conversion period, and inventory conversion period), the profitability is also higher and vice versa. A more profitable company might afford to have relatively high level of inventories and receivables. This conclusion is also reached by Madushanka and Gowthaman [26] who analyzed manufacturing companies listed on the Colombo Stock Exchange. Nyabwanga et al. [27], found a direct link between the level of liquidity and solvency and the level of the rate of return on assets (ROA), which is one of the most important indicators of financial performance. Furthermore, the positive impact of a firm’s liquidity on accounting expenditures and, consequently, on financial performance was identified by Airout et al. [47] for SMEs in Jordan. Zimon et al. [39], evaluating the financial security management of 68 Polish SMEs in renewable energy sector, highlighted that “liquidity directly impacts the company’s profit” (p. 1). In order to be able to avoid various financial risks, SMEs must have an acceptable level of liquidity, which allows them to pay current debts, while reinvesting part of the profit in their activity, and to increase their equity [39].
Analyzing the financial performance (with the ROA indicator) and the financial equilibrium (with the liquidity indicators: current liquidity, quick liquidity ratio and some others), Ugwu et al. [48] indicate that some liquidity management components improve firm performance if they are properly managed.
Batrancea [40] investigated the financial statements of companies listed on the New York Stock Exchange, which operate in the field of health, and highlighted the link between financial stability (measured by the liquidity and solvency indicators) and financial performance (assessed with ROA, profit margin, gross profit, depreciation indicators). Moreover, the study confirmed a positive relationship between (current and immediate) liquidity and ROA [40].
The financial performance of US airports was studied by Raghavan and Yu [49] with the help of liquidity and solvency indicators and performance indicators. As for performance indicators, the study used the ratio of operating expenses and operating income which assess the expenditure efficiency and the ratio of the net result and realized revenues for sales efficiency, in addition to the indicators specific to the field of activity.
Furthermore, Horváthová et al. [50], to evaluate the financial performance of energy companies in Slovakia, used in addition to profitability, liquidity, and solvency indicators, data related to the structure of financing sources, financial stability, which have an important role and influence financial performance.
To assess the risk of solvency, indebtedness, and other elements of the financial performance of retail food enterprises, Horobet et al. [28] use the solvency indicators (Financial leverage—debt to equity ratio) and liquidity (General liquidity—Current ratio and share of net working capital in turnover), parallel to financial performance indicators (ROA, ROE, EBIT margin, net profit margin). The study was carried out using the financial statements of 4596 enterprises with CAEN code 4711, from 20 countries of the European Union (including Romania). For Romanian companies, the solvency risk was between medium and high, based on the mean value of TD/SF (TD—Total Debt, SF—Shareholders Founds) ratio.
The link between the capital structure (which determines the financial health, the financial equilibrium) and the financial performance of the enterprise was also studied by Das and Swain [51]. The authors concluded that there is a significant relationship between capital structure and profitability, on the one side, and that capital structure has a significant impact on financial performance of sample companies, on the other side.
Given these aspects, we developed the first hypothesis:
Hypothesis 1 (H1):
There is a positive correlation between financial equilibrium indicators and financial performance indicators.
2.2. Financial Equilibrium and Financial Performance as Main Pillars of Financial Sustainability
Financial sustainability, as a concept in the literature, has appeared fairly recently [52], from the need to maximize the value of capital invested by shareholders under acceptable risk conditions. Financial sustainability, as a part of the general sustainability of companies, is treated in literature in connection with value maximization for shareholders, profitability, open innovation, financial equilibrium, firm growth, risks, etc. [7,32,53,54,55].
According to Zabolotnyy and Wasilewski [7], “the financial sustainability of a company derives from the principle of value maximization for shareholders at an acceptable level of risk” (p. 1). The authors evaluate the financial sustainability of food companies from Northern Europe with the help of financial indicators such as: liquidity, solvency, profitability, etc. Putra et al. [53] consider that financial sustainability means the situation in which companies can continue their activity without external government subsidies. The continuity of an enterprise depends on the efficiency of the activity, which is reflected in its profitability (financial performance), but it also depends on the existence of financial balance, evaluated by liquidity and solvency indicators [54].
The connection between the level of liquidity and financial sustainability was analyzed by Wu et al. [55] for a sample of 28 quoted non-financial establishments in Ghana. The results showed that liquidity was a significant and positive predictor of the firms’ financial sustainability, and played a key role in the improvement of the sustainability of enterprises. Jeong et al. [32], analyzing the link between open innovation and financial sustainability (measured by growth and profitability) in large Korean companies in the food industry, pointed out that financial sustainability is strengthened through open innovation only in the firms with sufficient absorptive capacity.
A good financial performance, which implies the efficient use of invested capital and owned assets, in the conditions of financing the activity without engaging in debts that lead to the risk of insolvency (so in conditions of financial balance, a healthy financial state), can ensure financial sustainability of the enterprises. A similar opinion is formulated by Zimon [56] who argues that the financial equilibrium (financial liquidity) and financial performance (profitability) are the most important pillars which determine the position of companies in the market.
Gleißner et al. [5] consider financial sustainability “as dealing solely with the company’s long-term financial security as an important part of the overall goal of sustainability” (p. 469). Financial sustainability was evaluated based on four cumulative conditions: firm growth, the company’s ability to survive, an attractive earnings risk profile, and an acceptable overall level of earnings risk exposure [5]. In the same vein, Gómez-Bezares et al. [57] approach financial sustainability as part of the overall sustainability of enterprises, evaluating financial sustainability from the perspective of financial performance (analyzed with the ROE indicator) and value created for shareholders. The results support the thesis that firms which incorporate sustainability issues into their business operations are better able to leverage their resources towards stronger financial performance and shareholder value creation than other companies. According to Gudz [58], financial balance is a necessary condition for the sustainable development of enterprises.
Taking into account the opinions and definitions in the literature, we believe that financial sustainability is based on two important pillars:
- Financial equilibrium both in the short term (assessed with the help of liquidity indicators) and in the long term (assessed with the help of solvency indicators), which can ensure financial stability;
- Financial performance, which ensures the continuity of the activity and the creation of value for shareholders.
The existence of the two basic elements can lead to financial sustainability, i.e., to the continuity of the activity (sustainability), in conditions of efficiency (creation of value for shareholders) and with an acceptable financial risk (low degree of insolvency, financial independence).
Based on the theoretical background and empirical evidence from the literature, we formulated the second research hypothesis:
Hypothesis 2 (H2):
Financial sustainability of companies requires both financial equilibrium and financial performance.
3. Materials and Methods
3.1. Data and Sample
The database includes all active enterprises, which submitted annual financial statements in the period 2016–2021 (for each year), based in Cluj county, Romania, whose main activity is related to NACE code 4711—retail sale in non-specialized stores with food, beverages, or tobacco predominating. The database does not include entities that opted for a different financial year from the calendar year, or legal entities in liquidation, respectively, NGOs (non-governmental organizations). Thus, according to the submitted financial statements, the (initial) database includes a total of 955 economic entities, which, according to the size criteria, fall into the category of micro-enterprises, respectively, small- and medium-sized enterprises. These financial statements were received from the Cluj-Napoca General Directorate of Public Finances. It is worthwhile to mention that the complete financial statements of Romanian enterprises are not publicly available, with only a few financial indicators being published, which are not sufficient in order to reach a complex financial analysis. Therefore, this study assesses financial sustainability only in Cluj County, which is an important driver to Romanian economy as it is ranked second among all Romanian counties in terms of contribution to GDP (5.23% of total GDP) [59] and of SMEs share in total SMEs (5.91%) [22].
Kloptchenko et al. [60] draw attention to the difficulty of extracting information from financial statements, namely the need to determine some indicators and methods that can best characterize the financial performance of companies: profitability rates, liquidity and solvency indicators, and efficiency rates.
From the original database, those enterprises that had no activity during this period (i.e., zero income and expenses) were removed, leaving 622 enterprises in the database. In the case of some enterprises, the financial indicators calculated have unrealistic values (e.g., negative values for liquidity, negative values for term of collection of receivables or payment of debts, etc.) and, therefore, the extreme values were removed from the database. Thus, 594 retail food enterprises have remained for analysis.
3.2. Financial Equilibrium and Financial Performance Variables
In order to assess the financial sustainability of retail food SMEs in Romania, which is the main goal of this study, we used the most popular and accepted financial indicators in the literature [28,29,40,61,62]. We used relative indicators (ratios) for the measurement and evaluation of financial equilibrium as well as financial performance.
To evaluate the financial equilibrium of a company we used four variables: current liquidity ratio (CLR), quick liquidity ratio (QLR), general financial solvency (GFS), and ratio of collection and payment period (RCP).
Current Liquidity Ratio (CLR) measures the company’s ability to pay their short-term debts [63]. The indicator compares the current assets (CA) with the current liabilities (CL) and is calculated by the following Equation (1):
According to the financial statements in Romania, current assets include inventories, accounts receivables, short-term investments and cash and cash equivalents, while current liabilities refers to short-term liabilities, such as accounts payable, short-term loans, taxes payable, and other occurred liabilities.
A current liquidity ratio value above 1 implies that current assets cover current liabilities and the net working capital is positive, reflecting the financial balance of the entity. If the value is sub-unit, it means that part of the current assets will be financed from the permanent capitals, a situation that can lead to financial disequilibrium [36]. Horobet [28] used liquidity indicators (Current Ratio) and the share of net working capital in net sales to assess the liquidity of retail food enterprises in the European Union. The enterprises that were in the higher solvency risk category recorded a median value of 1.039 for current liquidity, a value of 1.286 in the medium-risk category and 1.886 for a low level of solvency. The results of the study carried out by Zabolotnyy and Wasilewski [7] show that food companies from Northern Europe had a current liquidity ratio between 2.1 and 2.8.
Quick Liquidity Ratio (QLR) is calculated by eliminating inventories from the value of current assets. In addition to the current liquidity ratio, it is also important to evaluate the liquidity level of companies, without considering inventories (as an important part of current assets), since they are considered less liquid assets, because they are more difficult to convert into cash [63]. The QLR is calculated as follows:
A value of QLR between 0.8 and 1 is considered to indicate a normal situation in terms of the entity’s liquidity [36].
Solvency refers to the ability of entities to meet medium and long-term payment obligations [23]. To assess the solvency of entities, the empirical studies [61,64] most often use solvency indicators: general financial solvency (GFS) and financial leverage ratio (FLR). To measure the enterprise solvency level, we used General financial solvency (GFS) indicator, which reflects the extent to which the total assets (TA) cover the total liabilities (TL) of the entity. It is examined by the total assets divided to total liabilities ratio (3).
In the above formula, total assets include fixed assets and current assets, and total liabilities include short-term and long-term liabilities.
This indicator is very important especially in the case of the bankruptcy of an entity, in which situation, by capitalizing on the assets owned by the entity, payment obligations will be paid. Due to the fact that in case of bankruptcy, when the assets will be forcibly capitalized and in a relatively short time, they lose their value, it is considered that the value of the GFS indicator should be higher than 1.66 [36].
Studies [39,65] emphasized that the financial equilibrium of a company depends on the link between the average receivables collection period and the average debt payment period. Therefore, to analyze financial equilibrium we used Ratio of the collection and payment period (RCP) which is an indicator determined by the authors based on the two indicators, average receivables collection period and average debt payment period, according to according to Equation (4):
The average receivables collection period (ACP) is the ratio between the value of receivables (TC) and the net sales (NS) and expresses the average number of days of collection of receivables. Parallel to the analysis of the ACP, we determined the average current debt payment period (ADP) which reflects the average number of days in which a company has to pay its current debts. Ratio of the collection and payment period compares average collection period of invested capital with the average payment period of current debts [41].
Net sales refers to the sum of the total amount of sales calculated after sales returns, discounts, and allowances are deducted from gross sales.
Since the period of collection of receivables should be shorter than the period of payment of debts (so the company collects receivables faster than it pays debts), a healthy financial (financial equilibrium) situation is reached if the ratio of the collection and payment period has a value less than 1 or 100% [66].
Sabau-Popa et al. [61] use the average collection period and average debt payment period to build a composite index for evaluating the financial situation of companies listed on the Bucharest Stock Exchange, AERO market. Other authors [34] perform a comparative analysis of trading companies listed on the Johannesburg stock exchange based on the efficiency of the use of working capital (measured by average age of inventory, average collection period, and average debt payment period) and on financial performance (ROA and ROE). The authors conclude that there is a negative relationship between the average collection period and financial performance, i.e., it was found that the average debt payment period is negatively related to return on equity [34]. Another study [67] evaluates the influence of working capital management on the risks to which companies are exposed. To evaluate the efficiency of the use of capital, the variables that the authors use are indicators of financial balance such as: general liquidity, reduced liquidity, average collection period, average debt payment period, net working capital to turnover ratio, etc.
The financial performance was evaluated based on two financial indicators: Return on Assets (ROA) and Return on Equity (ROE). According to Lee et al. [62], profitability ratios, such as ROA and ROE, are “good indicators for measuring financial sustainability” (p. 5).
The return on assets (ROA) indicator expresses the efficiency of the use of owned assets, a fact that can directly influence the financial efficiency of the activity [68]. It is determined as the ratio between net income (net profit, remaining after taxes) and total assets (7):
Studies [69] and [70] compare the financial performance of enterprises grouped in clusters in the Czech Republic and Slovakia based on the following indicators: ROA, ROS, EVA (Economic Value Added) per employee, and EVA per sales.
The return on equity (ROE) is one of the most important indicators, especially for shareholders, which indicates the efficiency of the use of invested capital and especially the possibility of the company to create value for shareholders [71]. It is calculated as a ratio between net income and shareholders’ equity (8):
Equity, in the above formula, refers to the share capital made by all partners, capital funds, valuation differences, funds created from profit, accumulated profit or loss from previous years, and the current profit or loss.
Most studies (from different fields) mainly use the ROA and ROE as profitability indicators, to measure and compare financial performance: in the food sector [29,30,31], for listed companies [72,73,74], in the manufacturing industry [75,76], in agriculture [77,78], in the field of transport and storage [79,80], for enterprises with state capital—public companies [81], in the field of construction [82], in the banking sector [42,83], in the pharmaceutical field [84], and in the trade field [9,10,11,34]. In the field of the airline industry, Cocis et al. [23] use ROA and ROE indicators to evaluate the financial performance of enterprises. According to the analysis carried out by Bărbuță-Mișu et al. [44] on large (non-financial) companies from 28 European countries operating in different industrial sectors, the average level of ROE and ROA indicators was 13.9% and 7.4%.
3.3. Statistical Methods
The statistical analysis of databases and the editing of the graphs and diagrams were performed using Microsoft Excel spreadsheet and IBM SPSS Statistics 26.0 (IBM Corp., Armonk, NY, USA).
Descriptive statistics and correlation analysis were employed to test the first research hypothesis (H1). Pearson correlation coefficient (r) was used to investigate the intensity of the link between the financial equilibrium indicators and financial performance indicators and is calculated based on Formula (9) [85]
where S(x,y) = the sample covariance; Sx Sy = the product of sample standard deviations of X and Y; = the sample mean of X and Y.
A stronger negative or positive correlation is highlighted by a value of this coefficient which is closer to −1 or 1 means [85,86].
We used principal component analysis (PCA) and cluster analysis (CA) to test H2. Since none of the six financial indicators (CLR, QLR, GFS, RCP, ROA, and ROE) can solely serve as an adequate proxy for the financial sustainability of an enterprise, we consider that a composite index is much more relevant. To measure and evaluate financial sustainability at enterprise level, we construct a composite index using principal component analysis (PCA). From the variety of statistical methods used in empirical studies [87,88,89,90,91] to construct a composite index, we have chosen PCA due to the main advantage of this method, such as reducing of a large number of original variables into a few synthetic, uncorrelated factors (principal components). Each principal component represents linear combinations of the original variables and recovers much of the variance of these variables [92]. Therefore, we used PCA (with Varimax rotation and Kaiser normalization) to reduce the six indicators (variables) of financial equilibrium and performance of enterprises to a single composite index. Following the empirical studies which focused on the construction of a composite index at company level [66,93], as well as at macro-economic level [94,95], we calculated the weights of each principal component using the proportion of variance recovered by each component in total variance recovered by all principal components to construct the financial composite index.
In order to evaluate the financial performance of companies, Sabău-Popa et al. [66] build and use a composite index, using the principal components analysis. The authors use eight financial indicators, divided into two categories: traditional, accounting indicators (Earnings per Share, ROA, ROE, Solvency rate) and indicators aimed at the value newly created by the enterprise (Economic Value-Added, Market Value-Added, Cash Flow Return on Investment, and Cash Value-Added). The data come from the financial statements of 57 listed companies in Romania, of which 39 are manufacturing companies, 4 companies in the field of transport and also 4 in the field of storage, 4 with trade activity, 3 companies in the HoReCa field, 2 enterprises in the field of energy and construction, and 1 enterprise with scientific and technical activity. PCA was also used by Hapau [93], in order to build a composite index to evaluate the financial performance of 89 microfinance companies from 35 countries. To build this index, the authors use ROA, ROE, operational self-sustainability, profit margin, and portfolio yield indicators to assess the financial performance. This index was used in regression analysis to investigate the connection between the capital structure and the financial performance of analyzed entities [93].
Principal component and exploratory factor analyses are also used by Kasbar et al. [96] to analyze the link between corporate governance and a company’s financial performance.
A close link between liquidity and financial sustainability is demonstrated by Sabău-Popa et al. [61] in the case of companies listed on AERO (Alternative Exchange Romania). Moreover, the same authors constructed a composite financial index, applying the PCA and using a range of financial indicators, such as liquidity indicators (CLR and QLR), profitability indicators (ROA and ROE), and working capital management indicators (average duration of stock rotation, average duration of collection of receivables, average duration of payment of current debts to suppliers). Based on the composite financial index, the enterprises were classified into three groups: with low financial health, with good financial health, and with very good financial health. These categories were determined based on the index value (Z < 0—companies with poor financial health, 0 ≤ Z ≤ 0.5—companies with good financial health and Z > 0.5—companies with very good financial health) [61].
The advantages and disadvantages of the PCA were presented by Jolliffe and Cadima [97], emphasizing the fact that this method is one of the oldest and often used methods in the case of large databases. The method was originally developed for descriptive data, but now can be used in a wide variety of situations and data types (binary data, ordinal data, compositional data, discrete data, symbolic or specially structured data, etc.)
Based on the values of the two main dimensions (principal components) of financial sustainability index, we grouped the analyzed companies into homogeneous groups, using the clustering method [98]. The companies in the created groups are similar and different from the other groups [99]. Evaluating the financial sustainability of companies requires comparing very different companies in terms of size and performance based on the processing and analysis of the multi-annual reports of these companies [100].
Many studies use the clustering method to create and analyze homogeneous groups, in different fields. Thus, this method was used to assess the financial performance of companies [9,99] and the company’s organizational life cycle [101], to analyze the financial strategies of companies [102], to evaluate clients’ behavior [103] and more. According to Tang et al. [104], clustering is a beneficial tool in many industries, including computer science, biology, medicine, and the business industry.
4. Results and Discussion
Descriptive statistics (mean, minimum–maximum values, standard deviation, skewness, kurtosis, Jarque–Bera test) of the all financial indicators used for food retail SMEs are exhibited in Table 1.
The average current liquidity ratio (CLR) is 2.47 with a minimum of 0.01 and a maximum of 65.79 limits. The average value of 2.47 can be considered a very good one [105]. Compared to the results obtained by Horobet et al. [28], in the case of the companies which operate in the retail food industry (NACE code 4711) from the EU (20 countries), the values of the Romanian companies analyzed in this study exceed the average values of the EU, where the current liquidity values were below 2, with the mention that the highest current liquidity values have been registered in Finland, Romania, Portugal, and Spain. Obviously the minimum and maximum values reflect abnormal situations.
The quick liquidity ratio (QLR) varies between 0.00 and 65.53, with a mean value of 1.2447. Receivables and cash availability exceed the value of short-term debts (average value above 1), so we can consider this a very good situation, taking into account that Anghel et al. [36] also consider that a value between 0.8 and 1 indicates a normal situation.
The general financial solvency (GFS) values range from 0.01 to 65.10, with an average value of 2.3697. A value above 2 for GFS can be considered very good, because liabilities are covered twice by assets. The reference value according to Anghel et al. [36] is 1.66, a level exceeded by the retail food companies from Cluj county.
The ratio of collection and payment period (RCP) has an average value of 0.3723, which indicates a very good receivable collection period compared to the debt payment period; companies manage to collect their receivables in a much shorter period than the payment period of debts. If the ratio is below 1 (and in this case it is well below 1), it already means that the collection period is less than the payment period, so firms can meet payment obligations.
As for the financial performance indicators (ROA and ROE), the values cannot be considered good, nor acceptable. First of all, a negative average value of 1.07% indicates non-performance in the case of the ROA indicator, but also the positive average value of 4.15% in the case of ROE is much too low. It is worthwhile mentioning that for investors the ROE should be higher than the interest rate on government bonds plus a normal premium for the risk assumed by shareholders [36]. In the 2017–2021 period, in Romania, the reference rate for government bonds was approximately between 3% and 5% and the premium for the risk for investors had an approximate value of 3%. In these circumstances, the values of ROE are below expectations for these companies from Cluj county.
Values of standard deviation vary over a wide range, from 57.663 to 1.091, indicating large differences in terms of the analyzed financial indicators. Moreover, according to the skewness values, it is shown that the variables related to financial equilibrium (CLR, QLR, GFS, and RCP) were right-skewed, while the variables which measure the financial performance (ROA and ROE) were left-skewed. As for the kurtosis values, five out of six variables had a leptokurtic distribution (values higher than 3), reflecting that a lot of outliers may be found in the database. Also, we applied the Jarque–Bera test to investigate the distribution of financial variables. The results suggest that all six variables were not normally distributed at the 1% level (Table 1).
Comparing the results obtained by Horobet et al. [28] and Bircea et al. [11], the values of the ROA and ROE for the analyzed retail food SMEs are lower. Thus, according to Horobet et al. [28], the ROA and ROE values of Romanian companies are far below the EU level in retail food activity (the values of the median ROA and median ROE indicators were 9.68% and 25.02%). Also, Bircea et al. [11] analyzed the financial performance of the largest supermarkets in Romania, for the same activity, in 2011–2015 period, and obtained the values for ROA were between 0.4 and 8.4%, and for ROE were in most cases over 10%.
Based on these initial results, we can conclude that the analyzed retail food companies have a good situation in terms of financial equilibrium, but they face difficulties in terms of financial performance.
To investigate the potential bivariate relationship between the financial variables, Pearson’s correlation was employed (Table 2), as a prerequisite for the principal component analysis.
According to the results from Table 2, it can be noticed that:
- -
- Between the four indicators that reflect the financial equilibrium of the enterprises there were positive correlations, with a medium to strong intensity, being statistically significant at the 1% significance level. Thus, the strongest positive correlation was between CLR and QLR (r = 0.909), followed by GFS and QLR (r = 0.741).
- -
- Between ROE and ROA, as variables that reflect financial performance of the enterprises, there was a positive correlation, statistically significant, but with low intensity (r = 0.233).
- -
- Both ROE and ROA are positively correlated with all financial equilibrium indicators (except RCP), the correlations coefficients ranging from 0.098 to 0.132.
These results show that Hypothesis 1 was supported, and it is in line with other studies [24,26,40,44] and [105], which showed a significant positive link between the financial equilibrium and financial performance. Thus, Batrancea [40] demonstrated that financial indicators (CLR and QLR) significantly influenced a firm’s performance in the healthcare industry, the impact of CLR and QLR on ROA being positive. Based on the financial information on large non-financial companies from 28 European countries and from various sectors, Bărbuță-Mișu et al. [44] concluded that ROA and ROE as financial performance indicators are positively and significantly influenced by liquidity and solvency. Other studies [24,106] showed a bidirectional causality between liquidity and the firms’ profitability. In the case of the Polish listed IT companies, Zygmunt [25] comes to the conclusion that there is a statistically significant positive relationship both between liquidity and profitability of companies, and receivable conversion period and profitability. Using current and quick liquidity ratios, on the one hand, and ROA and ROE indicators, on the other hand, Madushanka and Gowthaman [26] proved that liquidity ratios are positively and significantly related to the firm profitability among the listed manufacturing companies in Sri Lanka.
In order to measure and evaluate financial sustainability at enterprise level in the retail food sector, we took into consideration the cumulative influence of all six financial variables, using principal component analysis (PCA). Taking into account the large difference between the range of values and the units of measurement of the financial indicators used in constructing the financial sustainability index, the data were standardized.
The overall Measure of Sampling Adequacy (MSA) was checked based on the Kaiser–Meyer–Olkin (KMO) indicator. The value of 0.776 of KMO exceeds 0.50, the minimum requirement [98], reflecting the adequacy of the sample of financial indicators used in the construction of a composite index. Additionally, the suitability of the financial variables set for the PCA was confirmed by Bartlett’s Test of Sphericity (Approx. Chi-Square = 1864.592, p-value = 0.000) (see Table 3).
Starting from the significant positive correlations identified between the analyzed variables and using PCA with Varimax with Kaiser Normalization rotation method, the information of all original variables was grouped into two main components (factors). The two components explain 71.641% of the total variance (Table 4).
The number of principal components was chosen based on multiple criteria such as eigenvalue greater than-one rule as well as Catell’s scree plot criterion and percentage of cumulative variance (see Figure 2 and Table 4), based on which only the components which capture a large percentage of the total variation of the original variables (between 70% and 90%) are retained [86,92].
The first principal component (PC1) accounts for 51.837% of total variance and includes all four variables related to financial equilibrium which have a significant positive contribution in the creation of PC1 (Table 5 and Figure 3). The correlation coefficients from rotated component matrix (Table 5) show that PC1 is strongly and positively correlated with QLR (0.944), CLR (0.918), GFS (0.854), and RCP (0.770). Thus, we can name the PC1 as “financial equilibrium component”. The second principal component (PC2) explains 19.804% of the total variance. It is positively correlated with ROE (0.791) and ROA (0.774), reflecting the level of financial performance. Therefore, the PC2 is named “financial performance component”.
The regression method was used to estimate factor score coefficients. In this method, the observed variables are first converted into z-scores (standardized), and then these z-scores are multiplied by the standardized factor loading matrix, along with the inverse of the variable correlation matrix. The generated scores have an average of 0 and a variance that equals the squared multiple correlation between the estimated factor scores and the true factor values [92,107].
Based on the data in Table 5, the score functions related to the two principal components are as follows:
CP1 (Financial equilibrium) = 0.303 × CLR + 0.315 × QLR + 0.274 × GFS + 0.257 × RCP − 0.040 × ROA − 0.061 × ROE
CP2 (Financial performance) = −0.022 × CLR − 0.048 × QLR + 0.025 × GFS − 0.043 × RCP + 0.631 × ROA − 0.650 × ROE
In the next stage, to determine the composite index, the financial sustainability index (FSI), the weights of each principal component (factors) in the total variance were used [66,93,94,95]. Hence, the financial sustainability index (FSI), for the retail food SMEs, was determined as follows:
The financial sustainability index has both positive and negative values, hence is more difficult to interpret. Consequently, the composite index has been transformed (using percentile rank) to take values between 0 (lowest financial sustainability) and 100 (highest financial sustainability). Hence, the financial sustainability index shows how an enterprise has evolved in the analyzed period (2016–2021) compared to another enterprises.
In the last stage, taking into account the values of the two main dimensions (PC1 and PC2) of the financial sustainability index, the 594 companies have been classified, using cluster analysis. To determine the number of clusters and their composition, hierarchical cluster analysis (Ward’s method and Euclidean distance) and K-means analysis were used [98]. As results from Figure 4 and Figure 5 and Table 6 show, the 594 companies were classified in four clusters. The formed clusters were statistically significant according to the results of the ANOVA analysis [for PC 1, F (3, 590) = 1385.716, p < 0.001; for PC 2, F (3, 590) = 180.233, p < 0.001; Table 6].
Cluster 1 includes 448 retail food companies, which represents 75.42% of the analyzed companies. The values of the financial equilibrium indicators obtained by these companies (CLR = 1.75, QLR = 0.62, GFS = 1.78, RCP = 0.21) are considered representative for this sector [28]. The current liquidity (CLR) indicator is at a very good level compared to the values between 1.2 and 2, recommended by Borowiec et al. [108]. Although the QLR is below the recommended level (of 0.8, according to [28,108]), when combined with the RCP of 0.21 (a value < 1 indicates that the receivables collection period is lower than the debt payment period, meaning receivables are collected faster than the obligations have to be paid), the companies can meet short-term payment obligations, being able to pay their current obligations. As for the long-term payment obligations, GFS is above 1, which means that the total assets are covering the total liabilities 1.78 times. Anghel et al. [36] considered that a value above 1 already means that the company’s assets cover the total liabilities, but the banking industry requires a value above 1.66.
In terms of financial performance indicators, ROA reaches a level of 9.86%, which is a good level, and ROE (17.60%) can be considered very good [28,44].
The average FSI value is “only” at a level of 54%, but this is calculated in comparison with the other clusters. Thus, in the case of companies included in this cluster, indicators of financial balance and performance are favorable, showing that there is no risk of insolvency as the companies demonstrate financial stability and ensure their continued operations.
The SMEs that form Cluster 2 are characterized by the variables forming PC 2 (financial performance component), but negatively, and are not defined by the variables included in PC 1. Consequently, most of the SMEs were placed in the third quadrant (Figure 5 and Table 6). This cluster is the worst performer cluster and included 103 retail food companies (17.34%), being characterized by the lowest level of financial sustainability (FSI = 9.66%). Moreover, the companies perform poorly on both dimensions of FSI. Both values of ROA and ROE are negative (−55.49% and −60.47%), reflecting substantially negative financial performance of companies included in this cluster. The solvency risk is higher too, values of liquidity and solvability indicators (CLR = 0.77, QLR = 0.23 or GFS = 0.52) indicate financial problems, both in the short-term and long-term.
Companies included in this cluster have the lowest ratio of collection and payment period (CRP = 0.1), which indicates that the receivable collection period is much shorter than the debt payment period and demonstrates an efficient management of receivables compared with the liabilities [39]; however, this fact alone is not sufficient to meet the liquidity needs of the companies.
The results above are in line with findings obtained by Airout et al. [47] which demonstrated that “SMEs are sensitive to liquidity challenges which significantly impact their short-term expenditure and consequently influence their financial performance” (p. 1).
The high risk of liquidity and solvency for companies in this cluster requires measures to increase access to finance. According to Aslam et al. [13], who analyzed a sample of 320 SMEs operating in Pakistan economy, the sustainability of SMEs mainly depends on access to finance and financial literacy which are, in turn, significantly influenced by government support. Therefore, to reduce the risk of liquidity and solvency, government support is needed to facilitate access to finance, offering incentives like loan guarantees and tax credits [18,109]. Moreover, prior studies [110,111,112] have emphasized that the national tax policy can influence the activity of SMEs and their profitability. Furthermore, Kafouros et al. [113] underlined that the profitability of SMEs is influenced by the efficiency of formal and informal institutions. Thus, SMEs gain, for example, from the protection of property rights and government regulations more than large enterprises do, while large enterprises benefit from trust in society more than SMEs. As for tax compliance costs, the European Commission Report [114] points out that although large enterprises incur a higher absolute cost of taxes, the relative burden of tax compliance is disproportionately higher for SMEs than for large enterprises. Additionally, solutions like a simplified tax regime or electronic filing can reduce administrative burden for SMEs [114].
Cluster 3 includes only six retail food companies (1.01% of all analyzed companies) with the highest level of all indicators specific to financial equilibrium (Figure 6), having the highest level of financial sustainability measured by the highest FSI (99.17%). This cluster was very strongly and positively correlated with PC 1 (8.508), and weakly and negatively correlated with PC 2 (−0.337, Table 6).
The extreme values of liquidity and solvency indicators (CLR of 44.44, QLR of 43.76, GFS of 35.37) show excess of liquidity as highlighted by other studies [7,55,63,115] which consider that a value higher than 2 indicates an excess of liquidity. This situation is not healthy in terms of efficiency as it means a low efficiency in the use of current assets, an accumulation far above the optimal level of inventories and cash availability. As can be seen in Figure 6, having the highest level of liquidity does not lead to the highest level of financial performance. Thus, companies in this cluster have approximately the same level of ROA and ROE as companies in Cluster 4, despite exhibiting significantly higher levels of liquidity and solvency. In the case of the collection and payment period ratio, the value of 7.23 indicates an inefficiency of the period of collection of receivables and payment of debts. All these results indicate the ineffective management of current assets of companies in Cluster 3. The performance indicators are 15.20% for ROA and 15.90% for ROE, values that can be considered good/normal for this sector [28].
Cluster 4 contains 6.22% of the analyzed retail food companies (37 companies) which are characterized by the financial variables included in PC 1 (financial equilibrium component), and are not defined by the variables that make up PC 2 (Figure 5 and Table 6). SMEs in this group have lower FSI (95.03%) relative to those in Cluster 3 (Figure 6), but they achieve a level of ROA and ROE almost similar to Cluster 3. Although the values of the financial balance indicators (CLR, QLR, GFS) are much lower than those of Cluster 3 (9.21 against 44.44; 4.70 against 43.76; 9.36 against 35.37), they still exceed the liquidity threshold. Thus, the companies in this cluster can be characterized by an excess of liquidity, albeit lower compared to the liquidity excess observed in Cluster 3.
As can be seen in Table 7 and Figure 6, the retail food SMEs with the highest FSI (above 95%) included in Clusters 3 and 4, have very high level of financial equilibrium indicators, reflecting liquidity excess (financial surplus), indicating a low efficiency in using current assets. Moreover, the companies in Cluster 1 exhibit a robust financial equilibrium and strong financial performance. In contrast, companies in Cluster 2 demonstrate significantly low values for the financial equilibrium indicators, coupled with negative financial performance resulting from their operations. Our results were supported by other studies [39], which highlighted that maintaining an adequate level of liquidity, along with generating profits, can ensure financial security for the company. Therefore, it is believed that financial security can contribute to financial sustainability.
These results show that Hypothesis 2 was supported, and it is in line with Gudz [58] who pointed out “the dependence of the enterprise’s sustainable development on the state of its financial equilibrium” (p. 56). Furthermore, our results are confirmed by other studies [7,52] which define financial sustainability as the ability of the company to create value for investors, which implies financial performance and financial balance.
Undoubtedly, the two pillars of financial sustainability are interdependent. We believe that maintaining an optimal level of liquidity is crucial for both ensuring the continuity of operations and achieving the desired financial performance sought by investors. However, an excess of liquidity can lead to low efficiency of current assets, thereby negatively impacting financial performance. In the short term, liquidity is more important to financial stability than financial performance, but in the long term, financial performance plays a pivotal role in ensuring the sustainability of enterprises.
5. Conclusions and Main Implications
The main goal of this research was to analyze the financial sustainability of retail food SMEs based on two necessary pillars, namely financial equilibrium and financial performance. In such an unpredictable economic and social environment, stability and sustainability are key elements that decisively influence the activity of companies. The financial dimension is one, or perhaps the most important component of the general sustainability of enterprises. The evaluation of the state of financial sustainability is a common interest both for decision-makers at the macro-economic level and for company managers.
The study was carried out based on the financial data of the retail food companies in Cluj County, which submitted financial statements in the period 2016–2021, a total of 955 companies. After eliminating some companies that had incomplete situations or had no activity during this period, 594 companies remained in the actual study. These companies are small- and medium-sized companies, essential for economic activity, so their sustainability is a current and major problem for any national economy. For the evaluation of financial equilibrium, we used four financial indicators, such as Current Liquidity Ratio, Quick Liquidity Ratio, General Financial Solvency, Ratio of Collection, and Payment Period, and for the evaluation financial performance, the ROA and ROE indicators are used.
The hypotheses in the research were successfully supported by empirical data. The results of the correlation analysis show that, in the case of analyzed SMEs in retail food sector, a positive link was identified between financial performance indicators and financial equilibrium indicators. Moreover, principal component analysis results show that financial equilibrium and financial performance are the two main dimensions based on which the financial sustainability index (FSI) was constructed. Taking into account the two dimensions of the composite index (FSI) obtained, the analyzed SMEs were grouped in four clusters. The findings of the study clearly showed that the companies with a good/acceptable financial sustainability also have a good/acceptable financial balance and performance situation (companies in Cluster 1). Thus, our findings confirmed that financial sustainability can only be achieved if financial balance and financial performance are reached, a fact which implies that companies can operate without liquidity problems, on the one hand, and efficiently, providing support for new investments and trust to shareholders, on the other hand.
Furthermore, our results show that a relatively large percentage of the analyzed SMEs in the retail food industry (companies in Cluster 2) have difficulties regarding financial sustainability, which requires measures to improve the situation. In this context, our research study has economic policy implications for managers of retail food SMEs. As has been shown, the bigger issues appear in the case of financial performance, so we consider that the first measures must be taken in this direction. Therefore, taking into account that the low level of the analyzed profitability rates (ROE and ROA) is primarily determined by the low (in most cases negative value) level of profit, the managers should take some measures to improve the profit margin. This can be achieved by purchasing superior quality products and/or choosing local suppliers (reducing the supply chain), a fact which can offer more agility and flexibility for SMEs [116]. For local producers, it would also be advantageous, to find new customers and new markets, the challenge they face especially after the appearance of the super- and hypermarket chains. Another possibility to improve the level of company profit in the retail food sectors would be a rigorous analysis of expenses, and, consequently, the reduction or elimination of unnecessary expenses. In this sense, a real solution can be the digitalization of all activities of enterprises as much as possible, adopting various digital technologies range from Enterprise Resource Planning, Customer Relationship Management, to cloud computing, Artificial Intelligence, Internet of Things, and so on.
As for the enterprises for which the equity has a negative value (due to the accumulation of losses from previous years), an injection of capital from the shareholders is necessary to support the activities. In addition to a very low financial performance, the companies with financial sustainability problems also face liquidity problems (Cluster 2). The results obtained in terms of Current Liquidity Ratio and Quick Liquidity Ratio highlight that the measures must be implemented in the inventory management to reduce the level of inventories and increase rotation speed, a fact which would improve the liquidity situation. Moreover, the sustainability of SMEs can be improved by government support, which should facilitate access to finance through specific financing programs tailored to the needs of SMEs, based on lower interest rates or/and subsidized interest rates, longer repayment terms, granting tax reductions or other measures that make it easier for SMEs to access finance [18,109,111,112].
The results also demonstrated that some of the analyzed retail food SMEs (Cluster 3 and 4) are characterized by an above-average level of liquidity (excess liquidity). In spite of this fact, these SMEs have not exhibited a significantly higher level of financial performance than the SMEs with an average level of liquidity (Cluster 1). Therefore, businesses try to protect themselves from solvency risk, but ineffective management that focuses too much on liquidity affects financial performance. Companies should avoid these situations (i.e., maintaining a surplus of liquidity) because it also entails a waste of resources and various costs (such as opportunity costs), which ultimately leads to lower performance. The surplus of liquidity should be directed towards viable investments.
As highlighted in the introduction section, the retail food SMEs have a significant contribution to the Romanian economy, however they face one of the main challenges, namely, the expansion of super- and hypermarkets of various chain stores which can make it difficult for smaller business to compete effectively. To address this challenge, our results underline the need to improve the financial sustainability of these SMEs to ensure their growth and contribution to the Romanian economy. Therefore, SMEs in the retail food sector should be open to innovation and differentiation, to e-commerce and online presence, while also leveraging the local and organic products for the benefit of consumers. Furthermore, the SMEs should implement an internal controlling system, be open to export–import activities and manage their export capabilities and diversification more efficiently [117,118]. All of these can lead to sustainability and the achievement of a more meaningful financial performance.
We can conclude that this research paper has multiple economic policy implications for both the management of retail food SMEs and policy-makers at national and local level. We believe that supporting and developing SMEs, especially in emerging countries, is an essential driver for economic growth. Thus, the SMEs can create more and better jobs, contribute more significantly to GDP and the increase in taxes collected at the national level, and, consequently, they can positively influence the well-being of the whole society. The study highlights the importance of trade activities, especially the retail food activities, in national economy. Therefore, the European Union, the national governments, and local authorities, should support the retail food SMEs, through different economic, financial, and social measurements, which would boost their financial sustainability.
Our research study contributes to the financial literature by providing an empirical approach, which demonstrates not only the positive link between financial equilibrium and financial performance of retail food SMEs but also confirms the assumption that these pillars of financial sustainability are inextricably intertwined. The findings of this research can be useful for managers, shareholders and also for local and national policy-makers in order to formulate policies and measures that support the improvement of financial sustainability of SMEs in retail food sectors (and not only).
Limitations and Future Research
Firstly, our analysis consists of six variables related to financial equilibrium and financial performance and some features of financial sustainability of businesses, such as financial risk assessment, expenditure efficiency and other aspects of working capital management, may not be covered. Therefore, further research should take into consideration more variables to investigate the financial sustainability not only in the case of SMEs, but also in the case of large companies. Secondly, our empirical analysis focused only on the companies with retail food activity which operate in one county, and, therefore, further research could be extended to other fields, as well as to other counties.
Author Contributions
Conceptualization, E.H. and K.-E.Z.; methodology, E.H. and K.-E.Z.; software, E.H. and K.-E.Z.; validation, E.H. and K.-E.Z.; formal analysis, E.H. and K.-E.Z.; investigation, E.H. and K.-E.Z.; writing—original draft, E.H. and K.-E.Z.; writing—review & editing, E.H. and K.-E.Z. All authors have read and agreed to the published version of the manuscript.
Funding
This research received no external funding.
Data Availability Statement
The data presented in this study are available on request.
Conflicts of Interest
The authors declare no conflict of interest.
References
- Arici, T.; Gok, M.S. Examining Environmental Turbulence Intensity: A Strategic Agility and Innovativeness Approach on Firm Performance in Environmental Turbulence Situations. Sustainability 2023, 15, 5364. [Google Scholar] [CrossRef]
- Lapinskaite, I.; Skvarciany, V.; Janulevicius, P. Impact of Investment Sources for Sustainability on a Country’s Sustainable Development: Evidence from the EU. Sustainability 2020, 12, 2421. [Google Scholar] [CrossRef] [Green Version]
- Mia, M.A.; Nasrin, S.; Cheng, Z. Quality, quantity and financial sustainability of microfinance: Does resource allocation matter? Qual. Quant. 2016, 50, 1285–1298. [Google Scholar] [CrossRef]
- Kakati, S.; Roy, A. Financial sustainability: An annotated bibliography. Econ. Bus. Rev. 2021, 7, 35–60. [Google Scholar] [CrossRef]
- Gleißner, W.; Günther, T.; Walkshäusl, C. Financial sustainability: Measurement and empirical evidence. J. Bus. Econ. 2022, 92, 467–516. [Google Scholar]
- Batrancea, L. The nexus between financial performance and equilibrium: Empirical evidence on publicly traded companies from the global financial crisis up to the COVID-19 pandemic. J. Risk Financ. Manag. 2021, 14, 218. [Google Scholar] [CrossRef]
- Zabolotnyy, S.; Wasilewski, M. The concept of financial sustainability measurement: A case of food companies from Northern Europe. Sustainability 2019, 11, 5139. [Google Scholar] [CrossRef] [Green Version]
- Grashuis, J.; Hakelius, K. Pricing strategies of corporations and consumer co-operatives in the food retail sector: Evidence from England, Sweden, and the Netherlands. J. Co-op. Organ. Manag. 2023, 11, 100204. [Google Scholar] [CrossRef]
- Fenyves, V.; Zsidó, K.E.; Bircea, I.; Tarnoczi, T. Financial performance of Hungarian and Romanian retail food small businesses. Br. Food J. 2020, 122, 3451–3471. [Google Scholar] [CrossRef]
- Dura, C.C.; Iordache, A.M.M.; Ionescu, A.; Isac, C.; Breaz, T.O. Analyzing performance in wholesale trade Romanian SMEs: Framing circular economy business scenarios. Sustainability 2022, 14, 5567. [Google Scholar] [CrossRef]
- Bircea, I.; Zsido, K.E. Performance, Trends and Innovations in the Current Trade Sector Context. In Proceedings of the International Conference on Business Excellence, Bucharest, Romania, 21–22 March 2019. [Google Scholar]
- Ortiz-Martínez, E.; Marín-Hernández, S. European SMEs and non-financial information on sustainability. Int. J. Sustain. Dev. World Ecol. 2021, 29, 112–124. [Google Scholar] [CrossRef]
- Aslam, R.; Rehman, S.; Nasir, A. Investigating the relationship between government support and SMEs’ sustainability through financial and green lenses. J. Bus. Ind. Mark. 2023. online ahead-of-print. [Google Scholar] [CrossRef]
- Batrancea, L.M. Determinants of Economic Growth across the European Union: A Panel Data Analysis on Small and Medium Enterprises. Sustainability 2022, 14, 4797. [Google Scholar] [CrossRef]
- Czarniewski, S. Small and medium-sized enterprises in the context of innovation and entrepreneurship in the economy. Pol. J. Manag. Stud. 2016, 13, 30–39. [Google Scholar]
- Vishnupriya, B.; Abirami, A.B. Navigating the waters of “the engine of development”—Small medium enterprises (SME’s) in India. Eur. J. Sustain. Dev. 2019, 8, 234. [Google Scholar]
- Batrancea, L.M.; Balcı, M.A.; Chermezan, L.; Akgüller, Ö.; Masca, E.S.; Gaban, L. Sources of SMEs Financing and Their Impact on Economic Growth across the European Union: Insights from a Panel Data Study Spanning Sixteen Years. Sustainability 2022, 14, 15318. [Google Scholar] [CrossRef]
- Gaganis, C.; Pasiouras, F.; Voulgari, F. Culture, business environment and SMEs’ profitability: Evidence from European Countries. Econ. Model. 2019, 78, 275–292. [Google Scholar]
- Statista, Number of Small and Medium-Sized Enterprises (SMEs) in the European Union (EU27) from 2008 to 2022, by Size. Available online: https://0-www-statista-com.brum.beds.ac.uk/statistics/878412/number-of-smes-in-europe-by-size/ (accessed on 14 March 2023).
- Statista, Number of Enterprises in the Non-Financial Business Economy of the European Union (EU27) from 2008 to 2022. Available online: https://0-www-statista-com.brum.beds.ac.uk/statistics/1248775/number-of-businesses-eu/ (accessed on 14 March 2023).
- National Institute of Statistics, Tempo Online, Statistical Data. Available online: https://insse.ro/cms/sites/default/files/com_presa/com_pdf/pib_tr4r2022_1.pdf (accessed on 20 June 2023).
- National Institute of Statistics, Tempo Online, Statistical Data. Active Enterprises, by Activities of the National Economy at the CAEN Rev.2 Section Level and by Size Class. Available online: http://statistici.insse.ro:8077/tempo-online/#/pages/tables/insse-table (accessed on 9 March 2023).
- Cocis, A.D.; Batrancea, L.; Tulai, H. The link between corporate reputation and financial performance and equilibrium within the airline industry. Mathematics 2021, 9, 2150. [Google Scholar]
- Li, K.; Musah, M.; Kong, Y.; Mensah, I.A.; Antwi, S.K.; Bawuah, J.; Donkor, M.; Coffie, C.P.K.; Osei, A.A. Liquidity and firms’ financial performance nexus: Panel evidence from non-financial firms listed on the Ghana Stock exchange. SAGE Open 2020, 10, 3. [Google Scholar] [CrossRef]
- Zygmunt, J. Does liquidity impact on profitability? A case of polish listed IT companies. In Proceedings of the 2nd International Conference of Informatics and Management Sciences (ICTIC 2013), Zilina, Slovakia, 25–29 March 2013. [Google Scholar]
- Madushanka, K.H.I.; Gowthaman, J. The impact of liquidity ratios on profitability (With special reference to listed manufacturing companies in Sri Lanka). Int. J. Adv. Eng. Res. Sci. 2018, 3, 157–161. [Google Scholar]
- Nyabwanga, R.N.; Ojera, P.; Otieno, S.; Nyakundi, F.N. An empirical analysis of the liquidity, solvency and financial health of small and medium sized enterprises in Kisii Municipality, Kenya. EJBM 2013, 5, 8. [Google Scholar]
- Horobet, A.; Curea, S.C.; Popoviciu, A.S.; Botoroga, C.A.; Belascu, L.; Dumitrescu, D.G. Solvency risk and corporate performance: A case study on European retailers. J. Risk Financ. Manag. 2021, 14, 536. [Google Scholar]
- Suchanek, P.; Kralova, M. Relationship between customer expectations and financial performance of food industry businesses in customer satisfaction Model. Econ. Bus. Rev. 2023, 25, 103–117. [Google Scholar] [CrossRef]
- Kafel, P.; Sikora, T. The level of management maturity in the Polish food sector and its relation to financial performance. Total. Qual. Manag. Bus. Excell. 2014, 25, 650–663. [Google Scholar] [CrossRef]
- Sandberg, H.; Alnoor, A.; Tiberius, V. Environmental, social, and governance ratings and financial performance: Evidence from the European food industry. Bus. Strat. Environ. 2023, 32, 2471–2489. [Google Scholar] [CrossRef]
- Jeong, H.; Shin, K.; Kim, E.; Kim, S. Does Open Innovation Enhance a Large Firm’s Financial Sustainability? A Case of the Korean Food Industry. J. Open Innov. Technol. Mark. Complex. 2020, 6, 101. [Google Scholar]
- Deloitte. Global Powers of Retailing 2016. Navigation the New Digital Divide. Available online: https://www2.deloitte.com/content/dam/Deloitte/global/Documents/Consumer-Business/gx-cb-global-powers-of-retailing-2016.pdf (accessed on 14 March 2023).
- Mandipa, G.; Sibindi, A.B. Financial performance and working capital management practices in the retail sector: Empirical evidence from South Africa. Risks 2022, 10, 63. [Google Scholar] [CrossRef]
- Drobyazko, S.; Barwinska-Malajowicz, A.; Slusarczyk, B.; Chubukova, O.; Bielialov, T. Risk Management in the system of financial stability of the service enterprise. J. Risk Financ. Manag. 2020, 13, 300. [Google Scholar] [CrossRef]
- Anghel, I.; Robu, V.; Lala-Popa, I.; Ștefea, P.; Mironiuc, M.; Achim, M.V.; Siminică, M. Tratat de Analiză Economico-Financiară, 1st ed.; Editura Academiei Române: Bucharest, Romania, 2022. [Google Scholar]
- Zimon, G. Working Capital. Encyclopedia 2021, 1, 764–772. [Google Scholar]
- Mazanec, J. The impact of working capital management on corporate performance in small–medium enterprises in the Visegrad Group. Mathematics 2022, 10, 951. [Google Scholar] [CrossRef]
- Zimon, G.; Tarighi, H.; Salehi, M.; Sadowski, A. Assessment of Financial Security of SMEs Operating in the Renewable Energy Industry during COVID-19 Pandemic. Energies 2022, 15, 9627. [Google Scholar] [CrossRef]
- Batrancea, L. The influence of liquidity and solvency on performance within the healthcare industry: Evidence from publicly listed companies. Mathematics 2021, 9, 2231. [Google Scholar] [CrossRef]
- Xue, W.; Li, H.; Ali, R.; Rehman, R.U. Knowledge Mapping of corporate financial performance research: A visual analysis using Cite Space and Ucinet. Sustainability 2020, 12, 3554. [Google Scholar] [CrossRef]
- Batrancea, M. An Econometric Approach on Performance, Assets, and Liabilities in a Sample of Banks from Europe, Israel, United States of America, and Canada. Mathematics 2021, 9, 3178. [Google Scholar] [CrossRef]
- Morara, K.; Sibindi, A.B. Determinants of financial performance of insurance. J. Risk Financ. Manag. 2021, 14, 566. [Google Scholar] [CrossRef]
- Bărbuță-Mișu, N.; Madaleno, M.; Ilie, V. Analysis of risk factors affecting firms’ financial performance—Support for managerial decision-making. Sustainability 2019, 11, 4838. [Google Scholar] [CrossRef] [Green Version]
- Dahiyat, A. Does liquidity and solvency affect banks profitability? Evidence from listed banks in Jordan. IJARAFMS 2016, 6, 35–40. [Google Scholar] [CrossRef] [PubMed]
- Fasone, V.; Maggiore, P.; Scuderi, R. Airport ownership and financial performance: Evidence from Italy. J. Air Transp. Manag. 2014, 40, 163–168. [Google Scholar] [CrossRef]
- Airout, R.M.; Alawaqleh, Q.A.; Almasria, N.A.; Alduais, F.; Alawaqleh, S.Q. The moderating role of liquidity in the relationship between the expenditures and financial performance of SMEs: Evidence from Jordan. Economies 2023, 11, 121. [Google Scholar] [CrossRef]
- Ugwu, I.V.; Ekwochi, E.A.; Ogbu, C.G. Logical consequence of liquidity management on firm profitability. IJAMSR 2021, 5, 265–279. [Google Scholar]
- Raghavan, S.; Yu, C. Evaluating financial performance of commercial service airports in the United States. J. Air Transp. Manag. 2021, 96, 102111. [Google Scholar] [CrossRef]
- Horváthová, J.; Mokrišová, M.; Suhányiová, A.; Suhányi, L. Selection of key performance indicators of chosen industry and their application in formation of creditworthy model. Procedia Econ. Financ. 2015, 34, 360–367. [Google Scholar] [CrossRef] [Green Version]
- Das, C.P.; Swain, R. Influence of capital structure on financial performance. Parikalpana KIIT J. Manag. 2018, 14, 161–170. [Google Scholar] [CrossRef]
- Lagoarde-Segot, T.; Paranque, B. Finance and sustainability: From ideology to utopia. Int. Rev. Financ. Anal. 2018, 55, 80–92. [Google Scholar] [CrossRef]
- Putra, I.G.C.; Wiagustini, N.L.P.; Ramantha, I.W.; Sedana, I.B.P. Sustainability based on resource based view theory and knowledge based view theory. Acad. Account. Financial Stud. J. 2021, 25, 2. [Google Scholar]
- Samiloglu, F.; Demirgunes, K. The effect of working capital management on firm profitability: Evidence from Turkey. Int. J. Appl. Econ. Financ. 2008, 2, 44–50. [Google Scholar] [CrossRef] [Green Version]
- Wu, N.; Zhao, J.; Musah, M.; Ma, Z.; Zhang, L.; Zhou, Y.; Su, Y.; Agyemang, J.K.; Asiamah, J.A.; Cao, S.; et al. Do Liquidity and Capital Structure Predict Firms’ Financial Sustainability? A Panel Data Analysis on Quoted Non-Financial Establishments in Ghana. Sustainability 2023, 15, 2240. [Google Scholar] [CrossRef]
- Zimon, G. An analysis of working capital management strategy in small enterprises operating within group purchasing organizations. In Eurasian Economic Perspectives: Proceedings of the 28th Eurasia Business and Economics Society Conference, Coventry, UK, 29–31 May 2019; Spinger: Berlin/Heidelberg, Germany, 2020; pp. 103–111. [Google Scholar]
- Gómez-Bezares, F.; Przychodzen, W.; Przychodzen, J. Bridging the gap: How sustainable development can help companies create shareholder value and improve financial performance. Bus. Ethics Environ. Responsib. 2017, 26, 1–17. [Google Scholar] [CrossRef]
- Gudz, T. Financial equilibrium as basis for enterprise’s sustainable development: Economic and mathematical foundation. Technol. Audit. Prod. Reserv. 2017, 5/4, 51–56. [Google Scholar] [CrossRef] [Green Version]
- Statista Database. Economy & Politics. Available online: https://0-www-statista-com.brum.beds.ac.uk/statistics/1226972/romania-gdp-value-of-biggest-counties/ (accessed on 15 June 2023).
- Kloptchenko, A.; Eklund, T.; Karlsson, J.; Back, B.; Vanharanta, H.; Visa, A. Combining data and text mining techniques for analysing financial reports. Intell. Syst. Account. Finance Manag. 2004, 12, 29–41. [Google Scholar] [CrossRef]
- Sabău-Popa, C.D.; Simut, R.; Droj, L.; Bențe, C.C. Analyzing financial health of the SMEs listed in the AERO market of Bucharest Stock Exchange using principal component analysis. Sustainability 2020, 12, 3726. [Google Scholar] [CrossRef]
- Lee, C.L.; Ahmad, R.; Lee, W.S.; Khalid, N.; Karim, Z.A. The Financial Sustainability of State-Owned Enterprises in an Emerging Economy. Economies 2022, 10, 233. [Google Scholar] [CrossRef]
- Wisniewski, J.W. Financial Liquidity and Debt Recovery Efficiency Forecasting in a Small Industrial Enterprise. Risks 2022, 10, 66. [Google Scholar] [CrossRef]
- Kanapickiene, R.; Kanapickas, T.; Neciunas, A. Bankruptcy Prediction for Micro and Small Enterprises Using Financial, Non-Financial, Business Sector and Macroeconomic Variables: The Case of the Lithuanian Construction Sector. Risks 2023, 11, 97. [Google Scholar] [CrossRef]
- Reyad, H.M.; Zariyawati, M.A.; Ong, T.S.; Muhamad, H. The Impact of Macroeconomic Risk Factors, the Adoption of Financial Derivatives on Working Capital Management, and Firm Performance. Sustainability 2022, 14, 14447. [Google Scholar] [CrossRef]
- Sabău Popa, D.C.; Popa, D.N.; Bogdan, V.; Simut, R. Composite financial performance index prediction—a neural networks approach. J. Bus. Econ. Manag. 2021, 22, 277–296. [Google Scholar] [CrossRef]
- Akbar, A.; Akbar, M.; Nazir, M.; Poulova, P.; Ray, S. Does Working capital management influence operating and market risk of firms? Risks 2021, 9, 201. [Google Scholar] [CrossRef]
- Kayakus, M.; Tutcu, B.; Terzioglu, M.; Talas, H.; Uyar, G.F.U. ROA and ROE Forecasting in Iron and Steel Industry Using Machine Learning Techniques for Sustainable Profitability. Sustainability 2023, 15, 7389. [Google Scholar] [CrossRef]
- Pelloneová, N. Are there differences in the financial performance of Czech and Slovak cluster organizations? J. Econ. 2021, 69, 907–927. [Google Scholar] [CrossRef]
- Pavelkova, D.; Zizka, M.; Homolka, L.; Knapkova, A. Do clustered firms outperform the non-clustered? Evidence of financial performance in traditional industries. Ekon. Istraz. 2021, 34, 3270–3292. [Google Scholar] [CrossRef]
- Xu, J.; Jin, Z. Exploring the Impact of the COVID-19 Pandemic on Firms’ Financial Performance and Cash Holding: New Evidence from China’s Agri-food Sector. Agronomy 2022, 12, 1951. [Google Scholar] [CrossRef]
- De Lima, C.R.M.; Barbosa, S.B.; de Castro Sobrosa Neto, R.; Bazil, D.G.; de Andrade Guerra, J.B.S.O. Corporate financial performance: A study based on the Carbon Efficient Index (ICO2) of Brazil stock exchange. Environ. Dev. Sustain. 2022, 24, 4323–4354. [Google Scholar] [CrossRef]
- Bayaraa, B. Financial performance determinants of organizations: The case of Mongolian companies. J. Competitiveness 2017, 9, 22–33. [Google Scholar] [CrossRef] [Green Version]
- Nguyen, P.H.; Hsu-Hao, L.; Pham, H.A.; Thi, H.L.; Do, Q.M.; Nguyen, D.H.; Nguyen, T.H. Material sourcing characteristics and firm performance: An empirical study in Vietnam. Mathematics 2022, 10, 1691. [Google Scholar] [CrossRef]
- Rokhmawati, A.; Sathye, M.; Sathye, S. The Effect of GHG Emission, Environmental Performance, and Social Performance on Financial Performance of Listed Manufacturing Firms in Indonesia. In Proceedings of the 2nd Global Conference on Business and Social Sciences (GCBSS) on Multidisciplinary Perspectives on Management and Society, Bali, Indonesia, 17–18 September 2015. [Google Scholar]
- Iwata, H.; Okada, K. How does environmental performance affect financial performance? Evidence from Japanese manufacturing firms. Ecol. Econ. 2011, 70, 1691–1700. [Google Scholar] [CrossRef] [Green Version]
- Góral, J.; Soliwoda, M. On the profitability of Polish large agricultural holdings. Acta Oecon. 2021, 71, 137–159. [Google Scholar]
- Hloušková, Z.; Lekešová, M. Farm outcomes based on cluster analysis of compound farm evaluation. Agric. Econ. 2020, 66, 435–443. [Google Scholar] [CrossRef]
- Do, D.T. A study on financial performance of transport & warehouses firms listed on the Hanoi Stock Exchange. Econ. Finance Lett. 2021, 8, 1. [Google Scholar]
- Jang, S.W.; Ahn, W.C. Financial analysis effect on management performance in the Korean logistics industry. Asian J. Shipp. Logist. 2021, 37, 245–252. [Google Scholar] [CrossRef]
- Santis, P.; Albuquerque, A.; Lizarelli, F. Do sustainable companies have a better financial performance? A study on Brazilian public companies. J. Clean. Prod. 2016, 133, 735–745. [Google Scholar] [CrossRef]
- Sang, M.; Zhang, Y.; Ye, K.; Jiang, W. Moderating effects of internationalization between corporate social responsibility and financial performance: The case of construction firms. Buildings 2022, 12, 185. [Google Scholar] [CrossRef]
- Zelalem, B.A.; Abebe, A.A. Does intangible assets affect the financial performance and policy of commercial banks’ in the emerging market? PLoS ONE 2022, 17, 8. [Google Scholar] [CrossRef]
- Yang, Y.; Yang, F.; Zhao, X. The impact of the quality of environmental information disclosure on financial performance: The moderating effect of internal and external stakeholders. Environ. Sci. Pollut. Res. 2022, 29, 68796–68814. [Google Scholar] [CrossRef]
- Herman, E. The interplay between digital entrepreneurship and sustainable development in the context of the EU digital economy: A Multivariate Analysis. Mathematics 2022, 10, 1682. [Google Scholar] [CrossRef]
- Landau, S.; Everitt, B. A Handbook of Statistical Analysis Using SPSS; Chapman & Hall/CRC Press LLC: Boca Raton, FL, USA, 2004. [Google Scholar]
- Joint Research Centre-European Commission. Handbook on Constructing Composite Indicators: Methodology and User Guide; OECD Publishing: Paris, France, 2008; Available online: https://www.oecd.org/sdd/42495745.pdf (accessed on 20 June 2023).
- Zeng, Q.; Beelaerts van Blokland, W.W.; Santema, S.C.; Lodewijks, G. Composite Indicators of Company Performance: A Literature Survey. Perform. Improv. Q. 2021, 33, 385–418. [Google Scholar] [CrossRef]
- Greco, S.; Ishizaka, A.; Tasiou, M.; Torrisi, G. On the methodological framework of composite indices: A review of the issues of weighting, aggregation, and robustness. Soc. Indic. Res. 2019, 141, 61–94. [Google Scholar] [CrossRef] [Green Version]
- Chen, R.; Ji, Y.; Jiang, G.; Xiao, H.; Xie, R.; Zhu, P. Composite index construction with expert opinion. J. Bus. Econ. Stat. 2022, 41, 67–79. [Google Scholar] [CrossRef]
- Zahedi, J.; Salehi, M.; Moradi, M. Identifying and classifying the financial resilience measurement indices using intuitive fuzzy DEMATEL. Benchmark. Int. J. 2023, 30, 1300–1321. [Google Scholar] [CrossRef]
- Jolliffe, I. Principal Component Analysis, 2nd ed.; Springer: New York, NY, USA, 2002. [Google Scholar]
- Hapau, R.G. The influence of capital structure on financial performance of microfinance institutions. Rev. Financ. Stud. 2018, 3, 100–116. [Google Scholar]
- Apostu, S.A.; Vasile, V.; Panait, M.; Sava, V. Exploring the ecological efficiency as the path to resilience. Econ. Res. 2023, 36, 2108476. [Google Scholar] [CrossRef]
- Davidescu, A.A.; Vass Paul, A.M.; Gogonea, R.M.; Zaharia, M. Evaluating Romanian eco-innovation performances in European context. Sustainability 2015, 7, 12723–12757. [Google Scholar] [CrossRef] [Green Version]
- Kasbar, M.; Tsitsianis, N.; Triantafylli, A.; Haslam, C. An empirical evaluation of the impact of agency conflicts on the association between corporate governance and firm financial performance. J. Appl. Account. Res. 2023, 24, 235–259. [Google Scholar] [CrossRef]
- Jolliffe, I.T.; Cadima, J. Principal component analysis: A review and recent developments. Philos. Trans. R. Soc. A-Math. Phys. Eng. Sci. 2016, 374, 2065. [Google Scholar] [CrossRef] [PubMed] [Green Version]
- Everitt, B.; Landau, S.; Leese, M.; Stahl, D. Cluster Analysis, 5th ed.; Willey: London, UK, 2011. [Google Scholar]
- Lukáč, J.; Teplická, K.; Čulková, K.; Hrehová, D. Evaluation of the financial performance of the municipalities in Slovakia in the context of multidimensional statistics. J. Risk Financ. Manag. 2021, 14, 570. [Google Scholar] [CrossRef]
- Herman, E.; Zsido, K.E.; Fenyves, V. Cluster analysis with k-mean versus k-medoid in financial performance evaluation. Appl. Sci. 2022, 12, 7985. [Google Scholar] [CrossRef]
- Mousavi, A.; Mohammadzadeh, M.; Zare, H. A Clustering approach to identify the organizational life cycle. J. Open Innov. Technol. Mark. Complex 2022, 8, 108. [Google Scholar] [CrossRef]
- Dzuba, S.; Krylov, D. Cluster analysis of financial strategies of companies. Mathematics 2021, 9, 3192. [Google Scholar] [CrossRef]
- Thompson, J.R.J.; Feng, L.; Reesor, R.M.; Grace, C. Know Your clients’ behaviours: A cluster analysis of financial transactions. J. Risk Financ. Manag. 2021, 14, 50. [Google Scholar] [CrossRef]
- Tang, G.; Tian, R.; Wu, B. An Overview of Clustering Methods in The Financial. In Proceedings of the 2022 7th International Conference on Financial Innovation and Economic Development (ICFIED 2022), Harbin, China, 21–23 January 2022. [Google Scholar]
- Vukovic, B.; Peštovic, K.; Mirovic, V.; Jakšic, D.; Milutinovi, S. The Analysis of Company Growth Determinants Based on Financial Statements of the European Companies. Sustainability 2022, 14, 770. [Google Scholar] [CrossRef]
- Anowar, Z. Capital structure and profitability of Bangladeshi firms: A causal investigation. Univers. J. Account. Finance 2016, 4, 130–135. [Google Scholar]
- DiStefano, C.; Zhu, M.; Mindrila, D. Understanding and using factor scores: Considerations for the applied researcher. Pract. Assess. Res. Eval. 2009, 14, 20. [Google Scholar]
- Borowiec, L.; Kacprzak, M.; Krol, A. Information Value of Individual and Consolidated Financial Statements for Indicative Liquidity Assessment of Polish Energy Groups in 2018–2021. Energies 2023, 16, 3670. [Google Scholar]
- Yao, Z.; Liu, Y. How COVID-19 impacts the financing in SMEs: Evidence from private firms. Econ. Anal. Policy 2023, in press. [Google Scholar] [CrossRef]
- Batrancea, L.; Rus, M.I.; Masca, E.S.; Morar, I.D. Fiscal Pressure as a Trigger of Financial Performance for the Energy Industry: An Empirical Investigation across a 16-Year Period. Energies 2021, 14, 3769. [Google Scholar] [CrossRef]
- Sánchez-Ballesta, H.P.; Yagüe, J. Tax avoidance and the cost of debt for SMEs: Evidence from Spain. J. Contemp. Account. Econ. 2023, 19, 100362. [Google Scholar] [CrossRef]
- Batrancea, L. An econometric approach regarding the impact of fiscal pressure on equilibrium: Evidence from electricity, gas and oil companies listed on the New York Stock Exchange. Mathematics 2021, 9, 630. [Google Scholar]
- Kafouros, M.; Chandrashekar, S.P.; Aliyev, M.; Au, A.K.M. How do formal and informal institutions influence firm profitability in emerging countries? J. Int. Manag. 2022, 28, 100890. [Google Scholar] [CrossRef]
- European Commission. Tax Compliance Costs for SMEs: An Update and a Complement. Final Report. 2022. Available online: https://taxation-customs.ec.europa.eu/system/files/2022-12/221208%20DG%20GROW%20report%20-%202022%20Tax%20Compliance%20Costs%20SMEs.pdf (accessed on 20 June 2023).
- Zimon, G.; Nakonieczny, J.; Chudy-Laskowska, K.; Wójcik-Jurkiewicz, M.; Kochanski, K. An Analysis of the Financial Liquidity Management Strategy in Construction Companies Operating in the Podkarpackie Province. Risks 2022, 10, 5. [Google Scholar]
- Alshahrani, M.A.; Salam, M.A. The Role of Supply Chain Resilience on SMEs’ Performance: The Case of an Emerging Economy. Logistics 2022, 6, 47. [Google Scholar] [CrossRef]
- Vu, Q.; Nga, N.T.T. Does the implementation of internal controls promote firm profitability? Evidence from private Vietnamese small- and medium-sized enterprises (SMEs). Finance Res. Lett. 2022, 45, 102178. [Google Scholar] [CrossRef]
- Miocevic, D. Dynamic exporting capabilities and SME’s profitability: Conditional effects of market and product diversification. J. Bus. Res. 2021, 136, 21–32. [Google Scholar] [CrossRef]
Figure 1.
Number and share of enterprises with trade (G) and retail food activity (4711), in Romania, in 2021. Source: Made by the authors, based on [22].
Figure 1.
Number and share of enterprises with trade (G) and retail food activity (4711), in Romania, in 2021. Source: Made by the authors, based on [22].

Figure 2.
Scree plot.

Figure 3.
Component plot in rotated space.

Figure 4.
Dendrogram using Ward Linkage method for 594 retail food SMEs. Source: authors’ own editing, based on own calculations.
Figure 4.
Dendrogram using Ward Linkage method for 594 retail food SMEs. Source: authors’ own editing, based on own calculations.

Figure 5.
Results of cluster analysis.

Figure 6.
Financial equilibrium and financial performance indicators (mean values per cluster) for retail food SMEs. Source: Based on own calculations.
Figure 6.
Financial equilibrium and financial performance indicators (mean values per cluster) for retail food SMEs. Source: Based on own calculations.


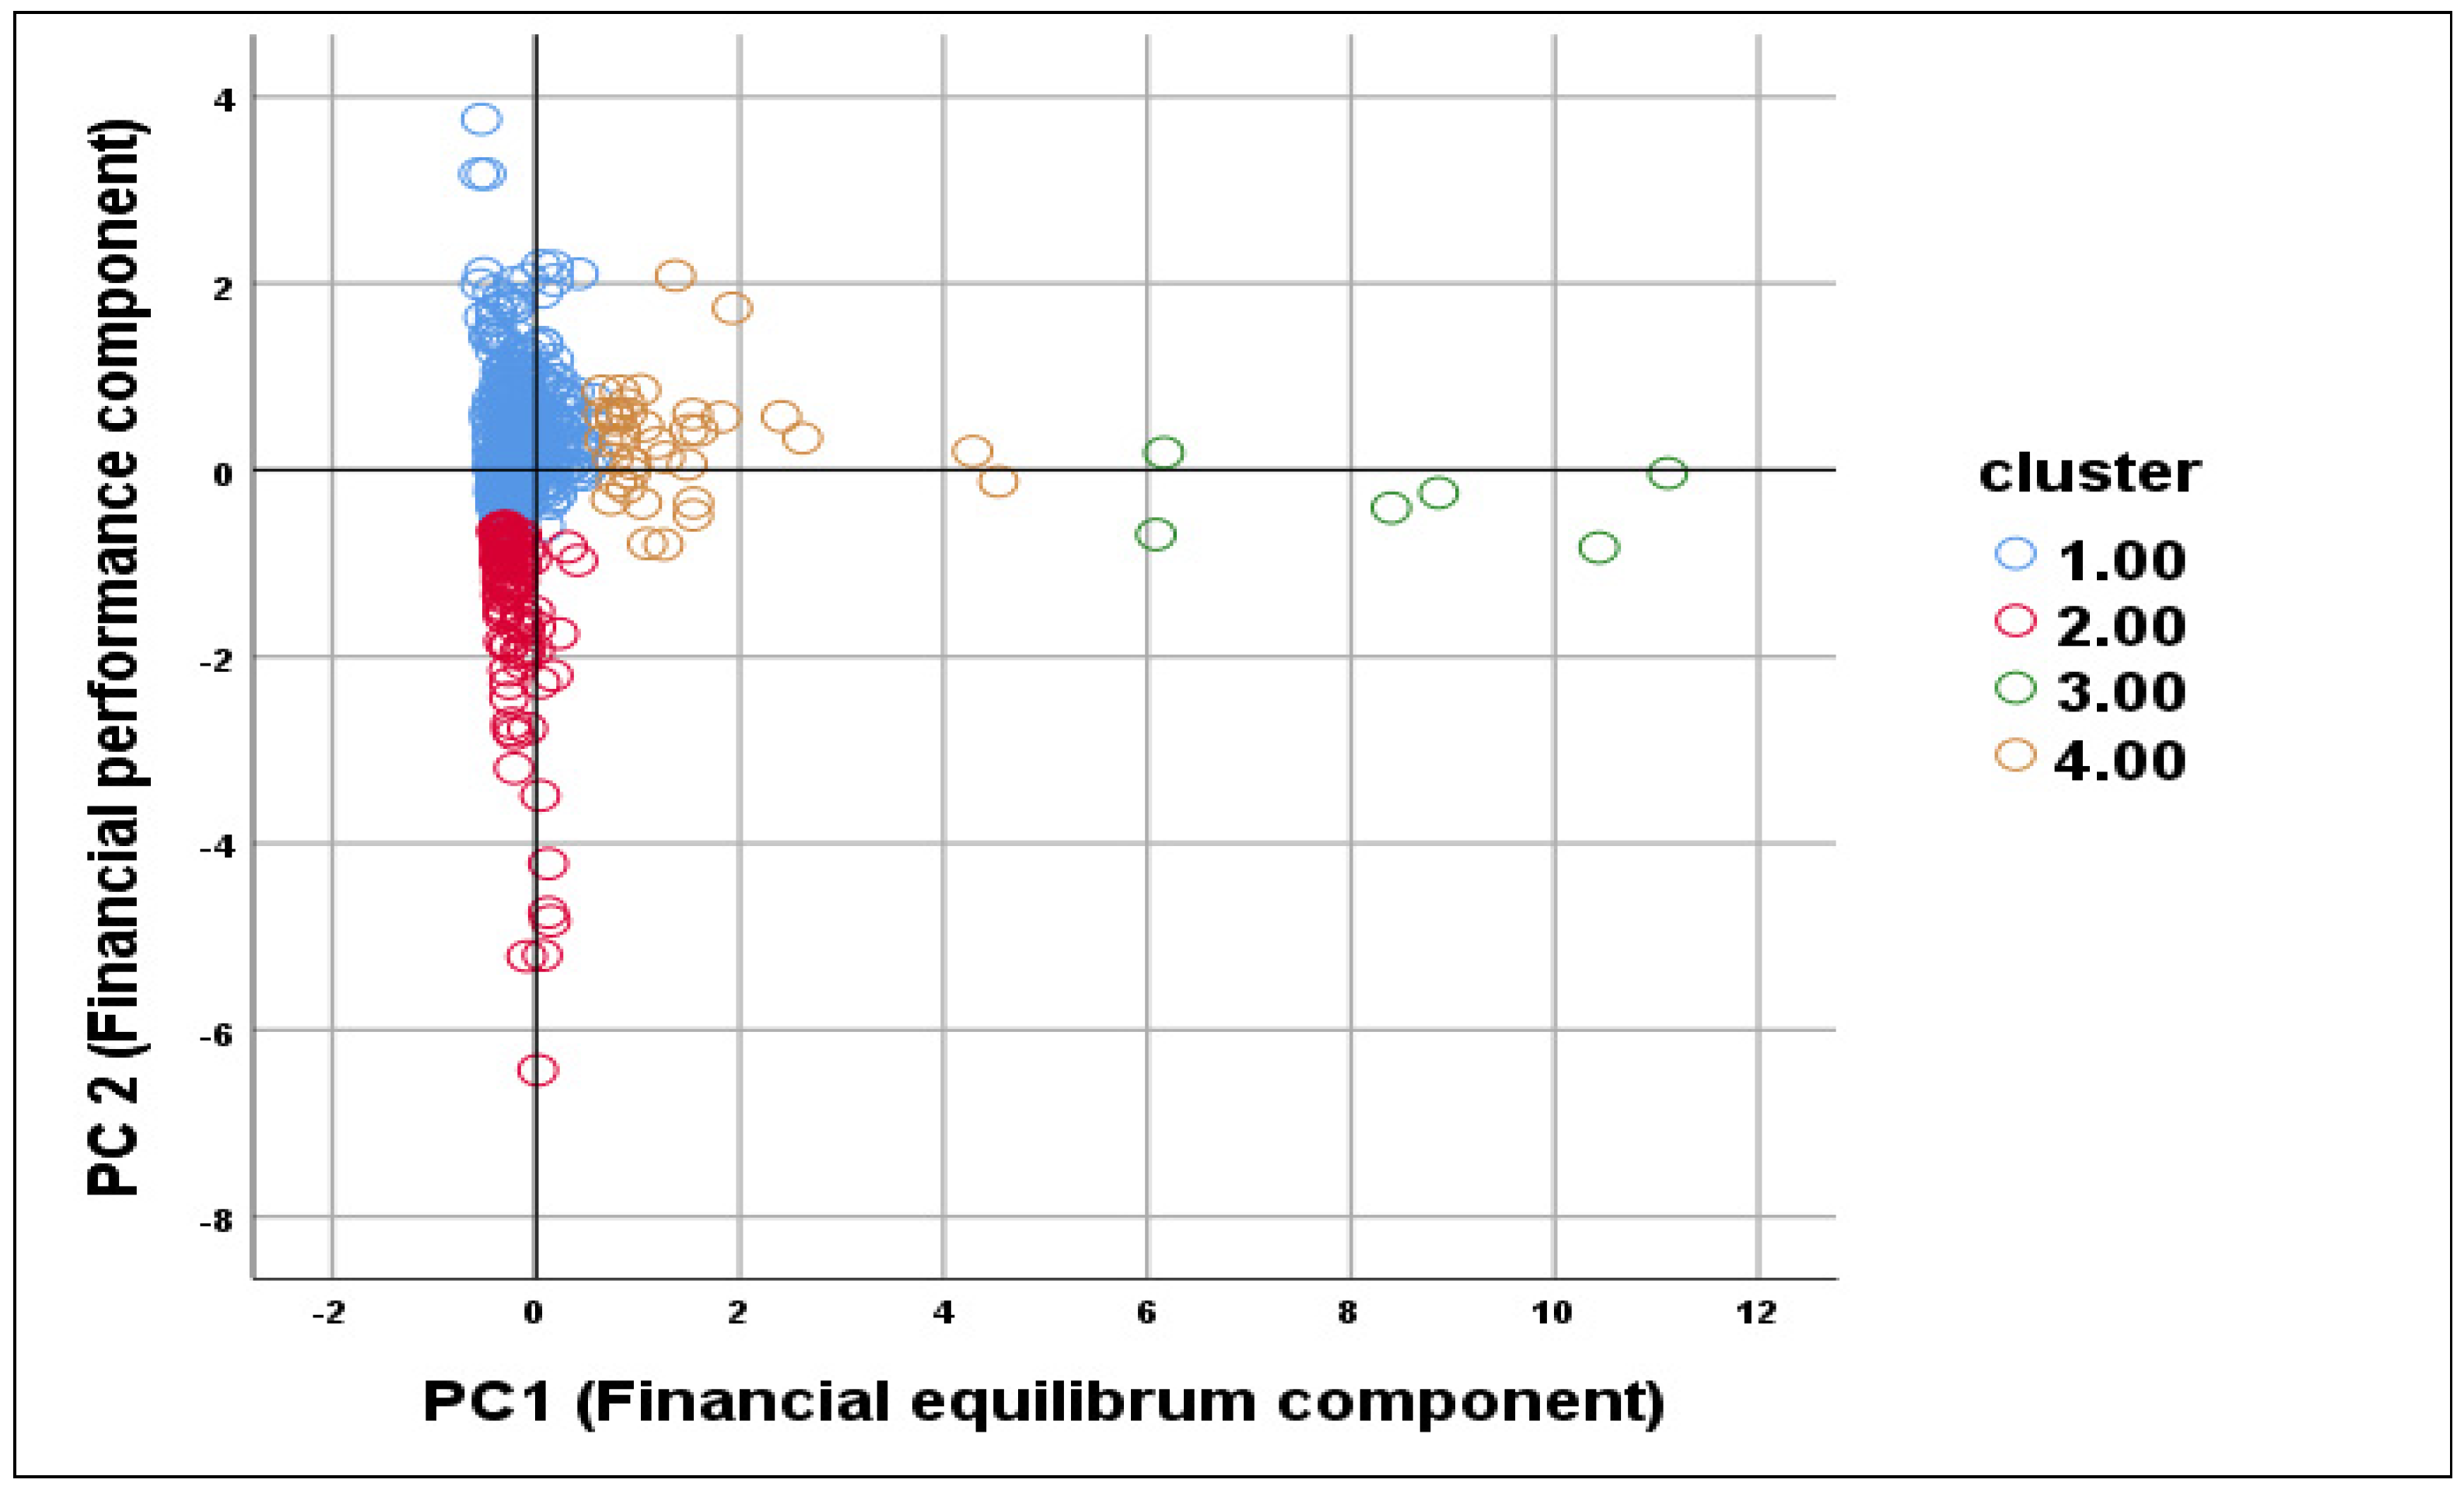
Table 1.
Descriptive statistics results (n = 594).
| Variables | Minimum | Maximum | Mean | Std. Deviation | Skewness | Kurtosis | Jarque-Bera Test |
|---|---|---|---|---|---|---|---|
| 1. Current liquidity ratio (CLR) | 0.01 | 65.79 | 2.4712 | 5.33086 | 7.470 | 70.369 | 128,081.2 * |
| 2. Quick liquidity ratio (QLR) | 0.00 | 65.53 | 1.2447 | 4.82649 | 10.008 | 112.704 | 324,295.1 * |
| 3. General financial solvency (GFS) | 0.01 | 65.10 | 2.3697 | 5.15131 | 7.640 | 74.828 | 144,359.5 * |
| 4. Ratio of collection and payment period (RCP) | 0.00 | 12.01 | 0.3723 | 1.09109 | 7.154 | 62.427 | 101,520.8 * |
| 5. Return on Assets (ROA) | −410.75 | 140.96 | −1.0710 | 43.32408 | −4.053 | 29.629 | 23,353.73 * |
| 6. Return on Equity (ROE) | −439.44 | 300.94 | 4.1547 | 57.66303 | −2.142 | 20.001 | 10,355.22 * |
Note: * Jarque–Bera test is significant at the 0.01 level. Source: own calculations.
Table 2.
Correlation matrix.
| Pearson Correlation (r) | CLR | QLR | GFS | RCP | ROA | ROE |
|---|---|---|---|---|---|---|
| CLR | 1 | 0.909 ** | 0.695 ** | 0.581 ** | 0.132 ** | 0.099 * |
| QLR | 1 | 0.741 ** | 0.620 ** | 0.108 ** | 0.081 * | |
| GFS | 1 | 0.544 ** | 0.160 ** | 0.110 ** | ||
| RCP | 1 | 0.098 * | 0.066 | |||
| ROA | 1 | 0.233 ** | ||||
| ROE | 1 |
Note: CLR—Current liquidity ratio; QLR—Quick liquidity ratio; GFS—General financial solvency; RCP—Ratio of collection and payment period; ROA—Return on Assets; ROE—Return on Equity. * Correlation is significant at the 0.05 level (2-tailed). Source: own calculations. ** Correlation is significant at the 0.01 level (2-tailed).
Table 3.
KMO and Bartlett’s Test.
| Kaiser–Meyer–Olkin | Measure of Sampling Adequacy | 0.776 |
| Bartlett’s Test of Sphericity | Approx. Chi-Square | 1864.592 |
| df | 15 | |
| Sig. | 0.000 |
Table 4.
Total variance and eigenvalues explained.
| Component | Initial Eigenvalues | Extraction Sums of Squared Loadings | Rotation Sums of Squared Loadings | ||||||
|---|---|---|---|---|---|---|---|---|---|
| Total | % of Variance | Cumulative % | Total | % of Variance | Cumulative % | Total | % of Variance | Cumulative % | |
| 1 | 3.110 | 51.837 | 51.837 | 3.110 | 51.837 | 51.837 | 3.050 | 50.836 | 50.836 |
| 2 | 1.188 | 19.804 | 71.641 | 1.188 | 19.804 | 71.641 | 1.248 | 20.805 | 71.641 |
| 3 | 0.766 | 12.765 | 84.407 | ||||||
| 4 | 0.507 | 8.444 | 92.850 | ||||||
| 5 | 0.343 | 5.709 | 98.560 | ||||||
| 6 | 0.086 | 1.440 | 100.000 | ||||||
Note: extraction method: principal component analysis; rotation converged in 3 iterations.
Table 5.
Results of the PCA.
| Rotated Component Matrix | Component Score Coefficient Matrix | |||
|---|---|---|---|---|
| Initial Variables | PC1 | PC2 | PC1 | PC2 |
| Zscore (CLR) | 0.918 | 0.075 | 0.303 | −0.022 |
| Zscore (QLR) | 0.944 | 0.045 | 0.315 | −0.048 |
| Zscore (GFS) | 0.845 | 0.123 | 0.274 | 0.025 |
| Zscore (RCP) | 0.770 | 0.032 | 0.257 | −0.043 |
| Zscore (ROA) | 0.089 | 0.774 | −0.040 | 0.631 |
| Zscore (ROE) | 0.033 | 0.791 | −0.061 | 0.650 |
Note: extraction method: PCA; rotation method: Varimax with Kaiser normalization rotation converged in 3 iterations.
Table 6.
The results of the cluster analysis: Final cluster centers and ANOVA.
| Final Cluster Centers | ANOVA | |||||||||
|---|---|---|---|---|---|---|---|---|---|---|
| Cluster 1 | Cluster 2 | Cluster 3 | Cluster 4 | Cluster | Error | F | Sig. | |||
| Mean Square | df | Mean Square | df | |||||||
| PC 1 | −0.177 | −0.208 | 8.508 | 1.341 | 173.100 | 3 | 0.125 | 590 | 1385.716 | 0.000 |
| PC 2 | 0.323 | −1.502 | −0.337 | 0.318 | 94.524 | 3 | 0.524 | 590 | 180.233 | 0.000 |
Table 7.
The 594 retail food SMEs clustered based on dimensions of financial sustainability index (FSI).
Table 7.
The 594 retail food SMEs clustered based on dimensions of financial sustainability index (FSI).
| Clusters | Average FSI | Number of Companies in Cluster |
|---|---|---|
| Cluster 1 | 54.24 | 448 |
| Cluster 2 | 9.66 | 103 |
| Cluster 3 | 99.17 | 6 |
| Cluster 4 | 95.03 | 37 |
Source: Author’s design.
Disclaimer/Publisher’s Note: The statements, opinions and data contained in all publications are solely those of the individual author(s) and contributor(s) and not of MDPI and/or the editor(s). MDPI and/or the editor(s) disclaim responsibility for any injury to people or property resulting from any ideas, methods, instructions or products referred to in the content. |
© 2023 by the authors. Licensee MDPI, Basel, Switzerland. This article is an open access article distributed under the terms and conditions of the Creative Commons Attribution (CC BY) license (https://creativecommons.org/licenses/by/4.0/).
Share and Cite
MDPI and ACS Style
Herman, E.; Zsido, K.-E. The Financial Sustainability of Retail Food SMEs Based on Financial Equilibrium and Financial Performance. Mathematics 2023, 11, 3410. https://0-doi-org.brum.beds.ac.uk/10.3390/math11153410
AMA Style
Herman E, Zsido K-E. The Financial Sustainability of Retail Food SMEs Based on Financial Equilibrium and Financial Performance. Mathematics. 2023; 11(15):3410. https://0-doi-org.brum.beds.ac.uk/10.3390/math11153410
Chicago/Turabian StyleHerman, Emilia, and Kinga-Emese Zsido. 2023. "The Financial Sustainability of Retail Food SMEs Based on Financial Equilibrium and Financial Performance" Mathematics 11, no. 15: 3410. https://0-doi-org.brum.beds.ac.uk/10.3390/math11153410
Note that from the first issue of 2016, this journal uses article numbers instead of page numbers. See further details here.