
Simulating the Effects of Gate Machines on Crowd Traffic Based on the Modified Social Force Model

1
College of Automation and Electronic Engineering, Qingdao University of Science and Technology, Qingdao 260061, China
2
School of Artificial Intelligence, Hebei Univeristy of Technology, Tianjin 300401, China
*
Author to whom correspondence should be addressed.
Mathematics 2023, 11(3), 780; https://0-doi-org.brum.beds.ac.uk/10.3390/math11030780
Submission received: 30 December 2022
/
Revised: 28 January 2023
/
Accepted: 1 February 2023
/
Published: 3 February 2023
(This article belongs to the Section Mathematics and Computer Science)
Abstract
:Gate machines, such as ticket gates in stations and secure gates in office buildings, are very common in people’s daily lives. On the one hand, the passage between the gates is not wide enough for pedestrians to pass through, which may affect the traffic efficiency of the crowd; on the other hand, the gates make pedestrians move more orderly and smooth and may speed up evacuation. Whether the gates benefit or hinder the movement and evacuation of a crowd is not clear for now. This paper studies the effects of gate machines on crowd traffic based on simulations using the modified social force model. Three simulation scenarios are considered, including the absence of any gate machines, the presence of gate machines without invisible walls, and the presence of gate machines with invisible walls. Normal and evacuation situations are distinguished by whether or not a pedestrian pauses for a while in front of the gates. The influences of factors such as the number of passages, exit width, and the number of pedestrians on crowd traffic are analyzed. Simulation results show that for different exit widths, there is a corresponding optimal number of passages to make the evacuation efficiency of the crowd the highest. The conclusions of this paper can provide some suggestions for the setting of the gate machines and the development of evacuation strategies.
1. Introduction
With the development of society and the acceleration of urbanization, some modern facilities are becoming more and more common in people’s lives and gate machines are one example. Gate machines or turnstiles are often used to allow one person to pass at a time. They can also be used to enforce the one-way traffic of pedestrians, and restrict passage only to people who swipe a card, insert a ticket, or similar. Therefore, gate machines are constructed at places that require payment or authorized access, such as stations, lobbies of office buildings, and halls of student dormitory buildings.
Since the passages between gate machines are narrow, the dynamics of pedestrians passing through gate machines are different from those of normal passages such as corridors. For this, Fuji and Sano carried out experiments to identify the characteristics of a crowd flow passing through ticket gates of a railway station in Japan [1]. They elucidated the flow rate through gate machines and derived numerical values to calculate the time for evacuation planning. Li et al. performed a series of single-file movement experiments under controlled laboratory conditions to analyze the motion characteristics of pedestrians in narrow channels [2]. Kim et al. calculated the outflow coefficients at turnstiles, which are essential in egress evaluation, at the three most crowed subway stations in Korea [3]. Rebecca et al. investigated the impact of ticket machines on evacuation procedures [4]. Kretz et al. conducted experiments to find the dependence of total times, fluxes, specific fluxes, and time gaps on the width of a narrow gate [5]. A linear decline of the specific flux with increasing width as long as only one pedestrian at a time can pass was found. Differences between small and wide gates were also found in the distribution of time gaps. Gayathri et al. analyzed the characteristics of stop-and-go waves in one-dimensional interrupted pedestrian flow through narrow channels using trajectory data [6].
The narrow passages not only affect people’s normal movement, but also may cause accidents in the case of congestion and pose difficulties for evacuation [1]. Several studies have pointed out that ticket gate machines are the bottleneck of evacuation during emergencies in subway stations [7,8,9]. It is easy to form long queues and cause serious congestion around the ticket gate machines. Therefore, evacuee velocity would be reduced and the evacuation time would be increased. To improve the evacuation efficiency, Hu et al. thought it was necessary to use two-way mode ticket gate machines in subway stations [10]. Wang et al. used queuing theory to establish a matching model between the number of ticket gates and passenger flow, and estimated the optimal number of ticket gates [11]. They only consider the normal use of the gates, not the emergency evacuation situation in which the gates may be opened and let pedestrians go through directly.
Bottlenecks are of fundamental importance in the estimation of evacuation times [5]. In recent years, not only the gate bottleneck, but also the pedestrian flow in other more general bottleneck areas has attracted increasing interest [12,13,14,15,16,17,18]. The research contents mainly focus on how bottlenecks affect crowd movement and evacuation, such as the relationship between pedestrian flow and bottleneck width, clogging transition of crowd flowing through bottlenecks, etc.
However, some scholars have also discovered that the ticket gate machines have little influence on pedestrian evacuation and may not be the bottleneck in subway stations [19]. One possible reason is that the ticket gate machines play a role in dispersion and make the evacuation more orderly and smooth. This is similar to the fact that placing an obstacle in front of a gate has a beneficial effect in evacuation [20,21,22,23]. The presence of the obstacle can improve the crowd flow rate due to the prevention of clogging by ‘‘absorbing’’ pressure [24].
Previous studies have shown that the width of exits or narrow passages, the layout of multi-exit paths, and the configuration of the exits have a great impact on evacuation [19,25,26]. The gate machines can also be regarded as special exits, but there are few studies on their impact on crowd evacuation, and there is no consensus conclusion. This paper aims to study the effects of gate machines on crowd movement and evacuation based on simulations using the social force model [27,28,29]. After calibration, the research results of this paper can provide guidance and suggestions for escape drills, gate machine design, and evacuation strategy formulation. The rest of the paper is organized into the following sections. Section 2 introduces some modifications to the original social force model to describe the behaviors of pedestrians passing through gate machines. In Section 3, simulation experiments are carried out to study the effects of gate machines on the evacuation of crowd. The conclusions and future work are given in Section 4.
2. Models and Methods
2.1. Basic Model of Pedestrian Movement: The Original Social Force Model
Generally speaking, there are numerous pedestrian simulation models proposed by scholars, such as cellular automata model, fluid dynamic model, social force model, and so on [30,31,32,33,34,35]. However, here we use the classical social force model proposed by Dirk Helbing et al. [27,28] to describe the movement of pedestrians. This model is built based on the classic Newtonian laws of mechanics. Specifically, the resultant force each pedestrian receives consists of its own driving force, the force between pedestrians, and the repulsive force between pedestrians and obstacles. The acceleration of pedestrian i is given by the following equation:
where the mass of each pedestrian i is ; the velocity is determined by position change ; and are the desired speed and desired walking direction of pedestrian i, respectively. These two in combination with the difference between the actual velocity of the pedestrian and over a fixed time interval τi can obtain the acceleration of the pedestrian at time t so as to know the driving force of the pedestrian. The last two term of the above equation separately refer to the interaction force between pedestrians and the repulsive force between pedestrian i and surrounding obstacles.
The interaction force between pedestrians is expressed as
where , and are constant parameters; indicates the sum of the radii between pedestrian i and pedestrian j, and means the distance between these two pedestrians; represents the unit vector pointing from pedestrian j to pedestrian i; is the direction perpendicular to , and denotes the tangential velocity difference.
The first term of Equation (2) is the psychological force and indicates the tendency of pedestrian i to stay away from others. The second term means that pedestrian i and j will squeeze each other when they are in physical contact [36,37], and the third term is the friction generated by their physical contacting. Obviously, when is smaller than , there is no touching between pedestrians and the corresponding value of function g is 0; when is bigger than , extrusion force and friction force between pedestrians will be generated, and the value of is assumed to be equal to the argument x. The force between pedestrians and obstacles is modeled analogously as
where and the meaning of each part of this formula is similar to that in Equation (2). For more details about this model, we refer to the references [27,28].
2.2. Modification of the Social Force Model
In view of the problem of simulating crowd behaviors at gate machines, the original social force model cannot meet the simulation conditions. According to the actual situation, we revise the social force model from the following aspects.
(1) Desired walking direction
(A) Tactical level
Generally, pedestrians will choose a path that they consider as comfortable as possible to move toward their destination, which is usually a trajectory without detours [27]. Some scholars believe that pedestrians walk along the shortest path [38], while others conclude that pedestrians move along the fastest path [39]. Based on the above, we consider two cases here, as shown in Figure 1.
In case I, pedestrians thought they could get out faster if they could get closer to the gate machines. They will eventually form an arch in front of the gates. In case II, pedestrians choose to move along the most direct (shortest) path to the gate machine. Relatively speaking, this is a more orderly and polite way of walking. For example, in the first case, pedestrian 1 will cut in from the side to compete with pedestrian 2 for going out. In the latter case, we assume that pedestrians only move in area A, just like there is an invisible wall between area A and area B, and between area A and area C, respectively. Therefore, we added the force of the invisible wall to the model to reflect this setting. The expression of this force is similar to that of the obstacle force in Equation (3). In practice, some places force pedestrians to walk in area A through measures such as setting up a fence.
Remark 1.
We also added an invisible wall in case I to indicate that pedestrians will wait in front of the gate machines instead of the sides of edge gate machines.
(B) Operational level
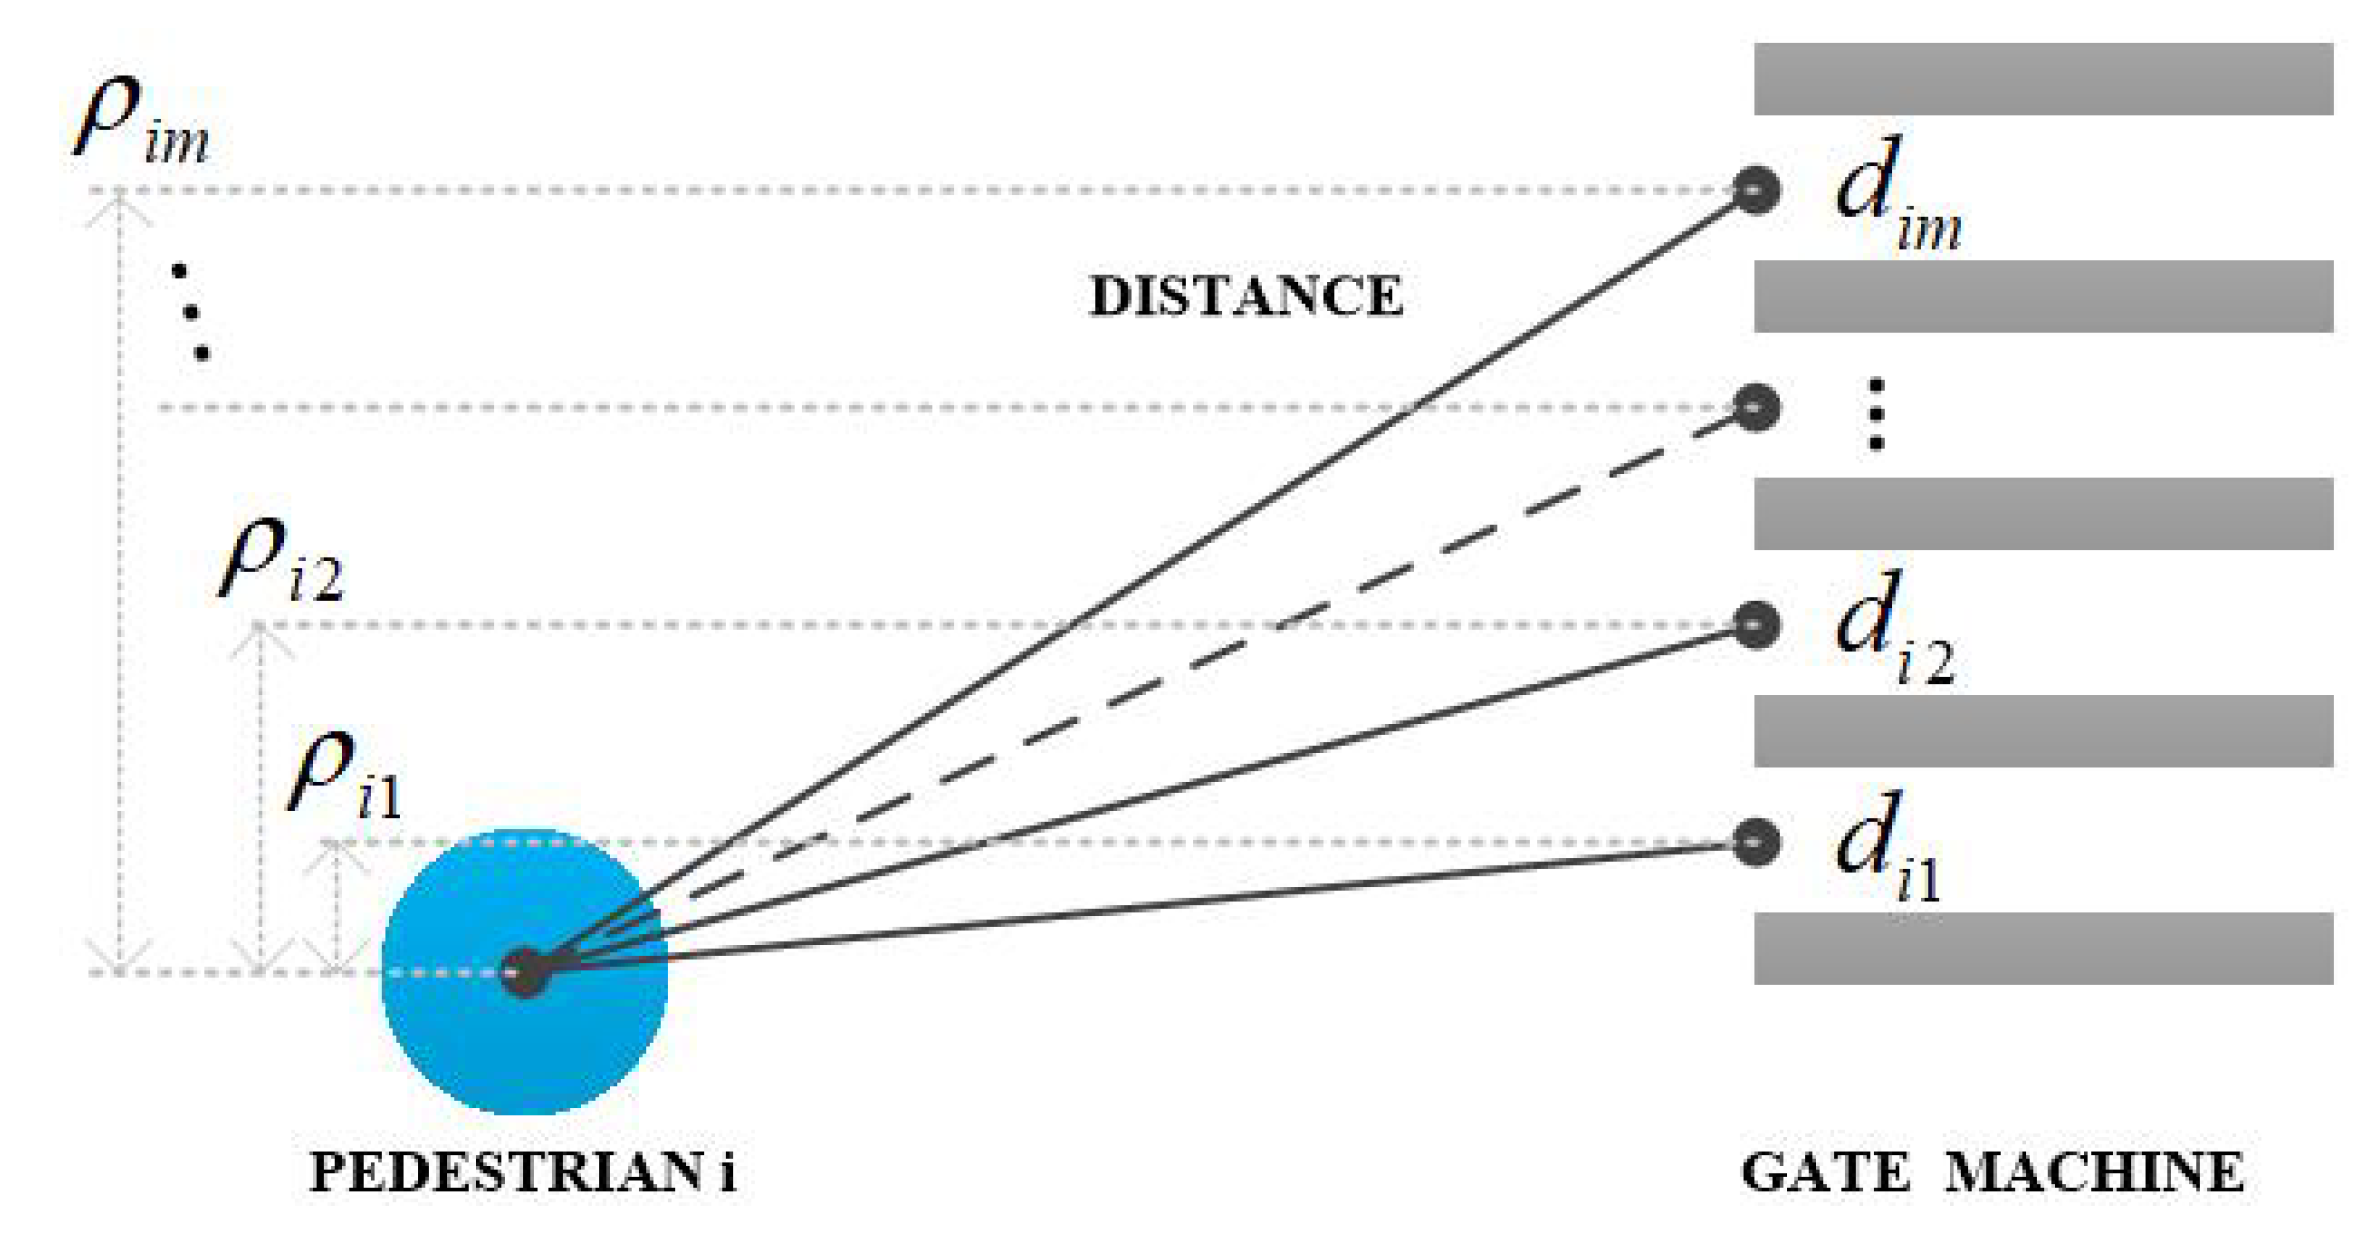
We assumed that a pedestrian chooses which passage to pass through based on their distance to the passage, as shown in Figure 2. Specifically, the closer the pedestrian is to a passage, the greater the probability that the passage will be used for traffic. For pedestrian i, the probability of choosing passage j is
where and is the vertical component of . We also assume that pedestrians choose the passage from the beginning and once it is decided, it will not change.
(2) Pause before the gate machine
Since gate machines usually restrict passage only to people who swipe a card, or insert a coin, a ticket, or similar, we set a pause for pedestrians in front of the gate machines. The pause time is assumed to be a random variable.
(3) The movement between two gate machines
We assume that the pedestrian is no longer affected by social forces between two gate machines (in the passage), but instead moves forward at a constant speed , which is the desired speed of a pedestrian. That is
The modification of the model has been described above with the example of pedestrians going out through the gate machines. The situation of pedestrians coming in through the gate machines is similar and will not be explained here in detail.
3. Simulation Results and Discussion
3.1. Simulation Scenario
3.1.1. Scenario Setup
We consider the following simulation scenarios. Suppose that the pedestrians’ movement area is a rectangle with a length of 26 m and a width of 15 m, as shown in Figure 3. The whole area is divided into three parts: part 1 is the indoor area with length m, part 2 is the middle area between the gate machines and the exit, and part 3 is the outdoor area. Two situations will be considered, one is that the crowd walks from the indoor area to the outdoor area, and the other is the opposite. In both situations, the crowd has to go through the exit and the gates. The gate machines are in the middle of wall 1 and the length and width of a gate machine are 1.4 m and 0.1 m, respectively. The width of the passage between two gate machines D is 0.6 m. The number of passages varies from 3 to 8. The exit is in the middle of wall 2, and is 2 m wide. The dotted lines in Figure 3 are the invisible walls mentioned in Section 2.2.
3.1.2. Simulation Parameters
The parameters of the social force model are shown in Table 1. Other unmentioned parameters will be given in the simulation results below.
3.2. Results and Discussion
3.2.1. The Effect of Passage Numbers
In this section, the effects of passage numbers on the evacuation time of a crowd going from the indoor area to outdoor area will be discussed. We compared the evacuation time in three cases, that is, without any gate machines, with gate machines with invisible walls, and with gate machines without invisible walls. At the beginning of the simulations, pedestrians appeared randomly from the far left of the area, and a passage was selected to pass though and move to the right according to the method determined in Section 2.2. We assume that the pedestrians can go through the gate machines directly without pausing. Ten simulations were performed in each case. The results of each time and the average value of each case are shown in Figure 4. Passage number 0 corresponds to the case when there is no gate machines.
From Figure 4 we obtain the following conclusions. (1) If the number of passages is small, such as three under the simulation conditions above, the evacuation time of the crowd will be increased. (2) As the number of passages increases, the evacuation time decreases, but this does not necessarily mean that the more the number of passages, the better. (3) Evacuation times are shorter with invisible walls than without invisible walls.
The gates are the bottleneck area during the evacuation of a crowd. When the number of passages is small, the crowd will form a fan or arch congestion in front of the gates, as shown in Figure 5, thereby reducing the evacuation efficiency. On the other hand, the existence of gates also helps to generate order, that is, pedestrians will line up after passing through the gates, so the evacuation time can be reduced when the number of passages is appropriate. When the number of passages is too large, such as eight, due to limited exit capacity, crowds will form chaos after a short queue and congestion at the exit as shown in Figure 6, and the evacuation time will increase slightly. As mentioned above, the invisible wall helps prevent pedestrians scramble for gates and therefore reduces evacuation time.
We also compared the forces on the pedestrians with and without the gates. The values in the y-axis are the sums of the pedestrian forces acting on each pedestrian at every iteration step. For the situation with gates, we chose the scenario where there are five passages without invisible walls. The comparison results are shown in Figure 7. From Figure 7, we can see that the gates can also reduce the force between pedestrians, so we assume that the existence of gates makes crowd movement safer and helps prevent overcrowding and trampling to a certain extent.
3.2.2. The Effect of Exit Width
In the previous section we pointed out that there is an optimal value for the number of passages. In this section, we study the effect of the width of the exit on this optimal value. We consider the case without invisible walls and without pause. In the simulations, let the exit width be 2 m, 2.25 m, 2.5 m, and 3 m. The change of crowd evacuation time with the number of passages under different conditions is shown in Figure 8. It can be seen from the figure that different exit widths correspond to different optimal numbers of passages. For example, when the exit width is set to 2 m, the evacuation time of the five passages is the shortest. When the exit width increased to 2.25 m and 2.5 m, the evacuation time was the smallest when the number of passages was 6 and 7, respectively. When the exit width increases, the crowd at the exit is more orderly or less congested (see Figure 9 and compare with Figure 6), so the evacuation time decreases. Moreover, when the exit width is large enough, such as 3 m, the more passages the better (at least up to eight passages). Under the current conditions, we find the following relationship
where is the optimal number of passages and W is the width of the exit. This is at least true for W = 2, 2.25, and 2.5 m. Whether this is true or approximately true for other widths of the exit will be discussed in the future work.
3.2.3. The Effect of Pedestrian Number
In this section, we change the number of pedestrians from 100 to 500 and compare the evacuation times under conditions without gate machines, with gate machines without invisible walls, and with gate machines with invisible walls. We simulated five times in each case and calculated the average evacuation time. The results are shown in Figure 10. We found that in each case, the evacuation time increased approximately linearly with the number of pedestrians. However, the growth rate was different under different circumstances. It can also be seen from the figure that setting gates helps improve the evacuation efficiency, and the evacuation time is the shortest when there are invisible walls. When the number of pedestrians is small, such as 100, the evacuation time is almost the same in all three cases. With the increase in the number of pedestrians, the difference of evacuation time between the three cases grew larger and larger. In other words, the greater the number of pedestrians, the more obvious the effect of the gates to improve evacuation efficiency.
3.2.4. The Effect of Pause
Under normal circumstances pedestrians need permission to pass through the gate, such as swiping a card. As stated in the modeling section, we used a short pause to represent the process of pedestrians waiting for permission. In an emergency, it is assumed that the gate can be opened to allow pedestrians to pass through directly. In this part, we compare the evacuation time of the crowd in both cases. During the simulation process, we let pedestrians pause randomly between 30 and 40 simulation steps after passing through the passages 0.2 m and consider the scenario with invisible walls. See Figure 11 for the results.
Pauses increase the evacuation time of the crowd. However, with the increase of the number of passages, the difference between the evacuation time under pause and non-stop situations becomes gradually smaller. Under current conditions, for the situation that requires a pause, the greater the number of passages, the shorter the evacuation time. Setting a pause is equivalent to controlling the flow of pedestrians passing through the gates. Even if the number of passages is large, it is not easy to form congestion at the exit, so the evacuation time will be reduced. This suggests that we need to open more gates in normal situations, but sometimes we need to close some gates in emergency situations to improve evacuation efficiency.
3.2.5. Comparison of in and out
In this section, we study the effect of gates on crowds entering the indoor area. Initially, the crowd is randomly distributed in the outdoor area. As in the case of exiting the indoor area, each pedestrian will pause for a while before the gate to obtain permission to enter. The time taken by the crowd to enter under different numbers of passages is shown in Figure 12. We can see that the changing trend of transit time with the number of passages is similar to that when going out. Generally speaking, the greater the number of passages, the better it is for crowds to enter. However, due to the limitation of the entrance width, when the number of passages reaches a certain level, its increase will not have a significant effect on reducing time. It can also be seen from the figure that when the number of passages is 3, 4, and 5, the time taken by the crowd to enter is significantly less than the time taken to exit. The difference between the two cases is that when you enter, you must pass through the entrance and then through the gate, and when you exit, the order is reversed. When the number of passages is small, crowds will form congestion in front of the gates. For the case of entry, the entrance has a certain effect on restricting the flow of people entering, so there are fewer pedestrians in front of the gates. We guess this is the reason why it took less time to enter. This means that avoiding congestion in front of the gates can help improve traffic efficiency.
4. Conclusions
This paper has studied the effects of gate machines on crowd movement and evacuation based on simulations. During the simulations, we considered three situations for the evacuation area, that is, there are no gate machines, there are gate machines but there are no invisible walls on both sides, and there are gate machines with invisible walls. In addition, we also considered the normal situation where pedestrians need to pause before the gates, as well as the evacuation situation where pedestrian can go through directly, and the situations of entering and exiting through the gates. The following main conclusions can be drawn: (1) In the case of evacuation, the efficiency is highest when there are gate machines with invisible walls and the lowest when there are no gate machines. In each case, the evacuation time increased roughly linearly with the number of pedestrians. (2) In the case of evacuation, there is an optimal value for the number of passages, and the corresponding evacuation time is the shortest, i.e., not the more the number of passages, the better. This optimal number is related to the width of the exit. (3) Under normal circumstances, whether it is in or out, in general, the greater the number of passages, the better. However, when the number of passages reaches a certain level, a further increase will have little effect on improving traffic efficiency.
These simulation results show us that in the case of evacuation, we sometimes need to close some gate machines to improve the evacuation efficiency. In addition, setting up some railings on both sides of the gates to prevent congestion in front of the gates will also benefit the evacuation. Of course, conclusions may vary under different conditions. We suggest that places with gate machines should organize some evacuation drills frequently to further confirm the impact of gate machines on crowd movement.
On the basis of this paper, we can continue to do more in-depth simulation research or carry out controllable real-life experiments in the future, such as studying the situation of people entering and exiting at the gate machines at the same time, investigating the optimal number of gate machines corresponding to different numbers of pedestrians, and analyze the dynamic characteristics of different groups of people passing through the gate machines under normal and emergency situations.
Author Contributions
Conceptualization, X.L. and Q.W.; methodology, X.L. and Q.W.; software, L.C.; validation, S.Z.; writing—original draft preparation, X.L.; writing—review and editing, Q.W.; funding acquisition, Q.W. All authors have read and agreed to the published version of the manuscript.
Funding
This work is supported by the National Natural Science Foundation of China under Grants 62003127 and 62203246, the Natural Science Foundation of Hebei Province under Grant A2020202034, and the Youth Foundation of Hebei Education Department under No. QN2020195.
Institutional Review Board Statement
Not applicable.
Informed Consent Statement
Not applicable.
Data Availability Statement
The data is available from the corresponding author of this paper. Data sharing not applicable.
Conflicts of Interest
The authors declare no conflict of interest.
References
- Fujii, K.; Sano, T. Experimental study on crowd flow passing through ticket gates in railway stations. Transp. Res. Procedia 2014, 2, 630–635. [Google Scholar] [CrossRef]
- Li, T.; Shi, D.; Chen, J.; Li, H.; Ma, J. Experimental study of movement characteristics for different walking postures in a narrow channel. Phys. A Stat. Mech. Appl. 2022, 608, 128319. [Google Scholar] [CrossRef]
- Kim, M.H.; Kim, E.S.; Cho, J.H. The study of crowd movement in stair and turnstile of subway station. J. Korean Soc. Saf. 2009, 24, 88–95. [Google Scholar]
- Rebecca, P.; Anastasios, K.; Despina, P.; Maria, M. Computer modeling analysis of METRO ticket gates impact to evacuation procedures. In Proceedings of the IOP Conference Series: Earth and Environmental Science, Virtual, 3–4 February 2021; IOP Publishing: Bristol, UK, 2021; Volume 703, p. 012038. [Google Scholar]
- Kretz, T.; Grünebohm, A.; Schreckenberg, M. Experimental study of pedestrian flow through a bottleneck. J. Stat. Mech. Theory Exp. 2006, 2006, 10014. [Google Scholar] [CrossRef]
- Gayathri, H.; Gulhare, S.; Verma, A. Characteristics of stop and go wave in one dimensional interrupted pedestrian flow through narrow channel. Collect. Dyn. 2019, 3, 1–14. [Google Scholar] [CrossRef]
- Gulanur, A.; Tian, C.; Xie, Q.; Shawkat, H.M.; Liu, D. Simulation of emergency evacuation in a metro-rail transit station. IOP Conf. Ser. Earth Environ. Sci. 2019, 304, 032016. [Google Scholar] [CrossRef]
- Yang, X.; Zhang, R.; Pan, F.; Yang, Y.; Li, Y.; Yang, X. Stochastic user equilibrium path planning for crowd evacuation at subway station based on social force model. Phys. A Stat. Mech. Appl. 2022, 594, 127033. [Google Scholar] [CrossRef]
- Yu, K.; Qu, N.; Lu, J.; Zhou, L. Determining subway emergency evacuation efficiency using hybrid system dynamics and multiple agents. Mathematics 2022, 10, 3693. [Google Scholar] [CrossRef]
- Hu, J.; Zhan, C.; Cheng, Z.; Wang, B. A research of pedestrian evacuation simulation for BRT station based on fine grid method. Procedia Eng. 2013, 52, 137–144. [Google Scholar]
- Wang, Y.; Cui, Y.; Ling, X. Research on number optimization of ticket checking gates in station based on queuing theory. Railw. Transp. Econ. 2012, 34, 34–38. [Google Scholar]
- Ezaki, T.; Yanagisawa, D.; Nishinari, K. Pedestrian flow through multiple bottlenecks. Phys. Rev. E 2012, 86, 026118. [Google Scholar] [CrossRef] [PubMed]
- Zuriguel, I.; Parisi, D.R.; Hidalgo, R.C.; Lozano, C.; Janda, A.; Gago, P.A.; Peralta, J.P.; Ferrer, L.M.; Pugnaloni, L.A.; Clément, E.; et al. Clogging transition of many-particle systems flowing through bottlenecks. Sci. Rep. 2014, 4, 7324. [Google Scholar] [CrossRef] [PubMed]
- Li, Y.; Wang, D.Z.W.; Chen, Y.; Song, C.; Jia, H.; Lin, Y. Pedestrian choice behavior analysis and simulation of ticket gate machine in rail transit station. Int. J. Mod. Phys. C 2019, 30, 1950027. [Google Scholar] [CrossRef]
- Fu, L.; Shi, Q.; Qin, H.; Zhang, Y.; Shi, Y. Analysis of movement behavior of pedestrian social groups through a bottleneck. Phys. A Stat. Mech. Appl. 2022, 608, 128257. [Google Scholar] [CrossRef]
- Rzezonka, J.; Chraibi, M.; Seyfried, A.; Hein, B.; Schadschneider, A. An attempt to distinguish physical and socio-psychological influences on pedestrian bottleneck. R. Soc. Open Sci. 2022, 9, 211822. [Google Scholar] [CrossRef]
- Geoerg, P.; Schumann, J.; Boltes, M.; Kinateder, M. How people with disabilities influence crowd dynamics of pedestrian movement through bottlenecks. Sci. Rep. 2022, 12, 1–16. [Google Scholar]
- Xu, H.; Ren, X.; Song, W.; Zhang, J.; Saidahmed, R. Spatial and temporal analysis of the bottleneck flow under different walking states with a moving obstacle. J. Stat. Mech. Theory Exp. 2023, 2023, 013401. [Google Scholar] [CrossRef]
- Lei, W.; Li, A.; Gao, R.; Hao, X.; Deng, B. Simulation of pedestrian crowds’ evacuation in a huge transit terminal subway station. Phys. A Stat. Mech. Appl. 2012, 391, 5355–5365. [Google Scholar] [CrossRef]
- Lin, P.; Ma, J.; Liu, T.; Ran, T.; Si, Y.; Wu, F.; Wang, G. An experimental study of the impact of an obstacle on the escape efficiency by using mice under high competition. Phys. A Stat. Mech. Appl. 2017, 482, 228–242. [Google Scholar] [CrossRef]
- Shiwakoti, N.; Shi, X.; Ye, Z. A review on the performance of an obstacle near an exit on pedestrian crowd evacuation. Saf. Sci. 2019, 113, 54–67. [Google Scholar] [CrossRef]
- Zhao, Y.; Lu, T.; Fu, L.; Wu, P.; Li, M. Experimental verification of escape efficiency enhancement by the presence of obstacles. Saf. Sci. 2020, 122, 104517. [Google Scholar] [CrossRef]
- Xu, H.; Zhang, J.; Song, W.; Hu, Y.; Li, X.; Ren, X.; Yang, L.; Yu, H.; Jiang, K. The effect of moving obstacle on regulation of pedestrian flow in a single exit room. J. Stat. Mech. Theory Exp. 2022, 2022, 023407. [Google Scholar] [CrossRef]
- Zuriguel, I.; Olivares, J.; Pastor, J.M.; Martín-Gómez, C.; Ferrer, L.M.; Ramos, J.J.; Garcimartín, A. Effect of obstacle position in the flow of sheep through a narrow door. Phys. Rev. E 2016, 94, 032302. [Google Scholar] [CrossRef] [PubMed]
- Liao, W.; Zheng, X.; Cheng, L.; Zhao, Y.; Cheng, Y.; Wang, Y. Layout effects of multi-exit ticket-inspectors on pedestrian evacuation. Saf. Sci. 2014, 70, 1–8. [Google Scholar] [CrossRef]
- Li, Z.; Xu, W. Pedestrian evacuation within limited-space buildings based on different exit design schemes. Saf. Sci. 2020, 124, 104575. [Google Scholar] [CrossRef]
- Helbing, D.; Molnar, P. Social force model for pedestrian dynamics. Phys. Rev. E 1995, 51, 4282. [Google Scholar] [CrossRef] [PubMed]
- Helbing, D.; Farkas, I.; Vicsek, T. Simulating dynamical features of escape panic. Nature 2000, 407, 487–490. [Google Scholar] [CrossRef]
- Qin, J.; Ma, S.; Zhang, L.; Wang, Q.; Feng, G. Modeling and Simulation for Non-Motorized Vehicle Flow on Road Based on Modified Social Force Model. Mathematics 2023, 11, 170. [Google Scholar] [CrossRef]
- Kubera, P.; Felcman, J. On the verification of the pedestrian evacuation model. Mathematics 2021, 9, 1525. [Google Scholar] [CrossRef]
- Taherifar, N.; Hamedmoghadam, H.; Sree, S.; Saberi, M. A macroscopic approach for calibration and validation of a modified social force model for bidirectional pedestrian streams. Transp. A-Transp. Sci. 2019, 15, 1637–1661. [Google Scholar] [CrossRef]
- Xie, C.; Tang, T.; Hu, P.; Chen, L. Observation and cellular-automaton based modeling of pedestrian behavior on an escalator. Phys. A-Statustucal Mech. Appl. 2022, 605, 128032. [Google Scholar] [CrossRef]
- Wu, W.; Chen, M.; Li, J.; Liu, B.; Zheng, X. An extended social force model via pedestrian heterogeneity affecting the self-driven force. IEEE Trans. Intell. Transp. Syst. 2022, 23, 7974–7986. [Google Scholar] [CrossRef]
- Muhammed, D.A.; Rashid, T.A.; Alsadoon, A.; Bacanin, N.; Fattah, P.; Mohammadi, M.; Banerjee, I. An improved simulation model for pedestrian crowd evacuation. Mathematics 2021, 8, 2171. [Google Scholar] [CrossRef]
- Hosseini, Z.S.; Abidi, A.; Mohammadi, S.; Mehryan, S.A.M.; Hulme, C. A fully resolved computational fluid dynamics study of the boundary layer flow of an aqueous nanoliquid comprising gyrotactic microorganisms over a stretching sheet: The validity of conventional similarity models. Mathematics 2021, 9, 2655. [Google Scholar] [CrossRef]
- Risto, G.H.; Herrmann, H.J. Density patterns in two-dimensional hoppers. Phys. Rev. E 1994, 50, R5. [Google Scholar] [CrossRef]
- Wolf, D.E.; Grassberger, P. Friction, arching, contact dynamics. In Friction, Arching, Contact Dynamics; World Scientific: Singapore, 1997; pp. 1–366. [Google Scholar]
- Moussaïd, M.; Helbing, D.; Theraulaz, G. How simple rules determine pedestrian behavior and crowd disasters. Proc. Natl. Acad. Sci. USA 2011, 108, 6884–6888. [Google Scholar] [CrossRef]
- Ganem, J. A behavioral demonstration of Fermat’s principle. Phys. Teach. 1998, 36, 76–78. [Google Scholar] [CrossRef]
Figure 1.
Two cases of pedestrian movement.

Figure 2.
A pedestrian chooses which passage to pass through based on his distance to the passage.

Figure 3.
The simulation scenario. L = 0.2 m. (Left): The situation where pedestrians exit the gates. (Right): The situation where pedestrians come in from the gates.
Figure 3.
The simulation scenario. L = 0.2 m. (Left): The situation where pedestrians exit the gates. (Right): The situation where pedestrians come in from the gates.

Figure 4.
Change of evacuation time with the number of passages in different situations.

Figure 5.
The snapshots of the evacuation process with the passage number being 3. The circles in the figure represent the pedestrians. (Left): With invisible walls. (Right): Without invisible walls.
Figure 5.
The snapshots of the evacuation process with the passage number being 3. The circles in the figure represent the pedestrians. (Left): With invisible walls. (Right): Without invisible walls.

Figure 6.
The snapshot of the evacuation process with the passage number being 8. Congestion forms at the exit.
Figure 6.
The snapshot of the evacuation process with the passage number being 8. Congestion forms at the exit.

Figure 7.
Changes in the resultant force of pedestrians between pedestrians in different situations over time.
Figure 7.
Changes in the resultant force of pedestrians between pedestrians in different situations over time.

Figure 8.
Changes in crowd evacuation time with the number of passages under different exit width conditions.
Figure 8.
Changes in crowd evacuation time with the number of passages under different exit width conditions.

Figure 9.
Snapshots of the evacuation process when the exit width is 3 m. (Left): The passage number is 5. (Right): The passage number is 8.
Figure 9.
Snapshots of the evacuation process when the exit width is 3 m. (Left): The passage number is 5. (Right): The passage number is 8.

Figure 10.
Comparison of evacuation time under different pedestrian numbers.

Figure 11.
Comparison of evacuation time with and without pause.

Figure 12.
Comparison of crowd entry and exit times with different numbers of passages.


Table 1.
Parameters in the simulation.
| Symbol | Meaning | Value |
|---|---|---|
| r | The radius of a pedestrian | 0.25 m |
| m | The mass of a pedestrian | 80 kg |
| A | Strength of social repulsive force | 200 N |
| B | Characteristic distance of social repulsive force | 0.2 m |
| k | Coefficient of body compression | 12,000 kgs−2 |
| Coefficient of sliding friction | 24,000 kgm−1s−1 | |
| Pedestrian reaction time | 0.5 s | |
| N | The number of pedestrians | 100 |
| Desired velocity | 1.5 ms−1 |
Disclaimer/Publisher’s Note: The statements, opinions and data contained in all publications are solely those of the individual author(s) and contributor(s) and not of MDPI and/or the editor(s). MDPI and/or the editor(s) disclaim responsibility for any injury to people or property resulting from any ideas, methods, instructions or products referred to in the content. |
© 2023 by the authors. Licensee MDPI, Basel, Switzerland. This article is an open access article distributed under the terms and conditions of the Creative Commons Attribution (CC BY) license (https://creativecommons.org/licenses/by/4.0/).
Share and Cite
MDPI and ACS Style
Lin, X.; Cheng, L.; Zhang, S.; Wang, Q. Simulating the Effects of Gate Machines on Crowd Traffic Based on the Modified Social Force Model. Mathematics 2023, 11, 780. https://0-doi-org.brum.beds.ac.uk/10.3390/math11030780
AMA Style
Lin X, Cheng L, Zhang S, Wang Q. Simulating the Effects of Gate Machines on Crowd Traffic Based on the Modified Social Force Model. Mathematics. 2023; 11(3):780. https://0-doi-org.brum.beds.ac.uk/10.3390/math11030780
Chicago/Turabian StyleLin, Xue, Long Cheng, Shuo Zhang, and Qianling Wang. 2023. "Simulating the Effects of Gate Machines on Crowd Traffic Based on the Modified Social Force Model" Mathematics 11, no. 3: 780. https://0-doi-org.brum.beds.ac.uk/10.3390/math11030780
Note that from the first issue of 2016, this journal uses article numbers instead of page numbers. See further details here.