Article

Interactive Fuzzy Multi Criteria Decision Making Approach for Supplier Selection and Order Allocation in a Resilient Supply Chain

by
Sonia Irshad Mari
1,
Muhammad Saad Memon
1,*,
Muhammad Babar Ramzan
2,*,
Sheheryar Mohsin Qureshi
3 and
Muhammad Waqas Iqbal
4
1
Department of Industrial Engineering and Management, Mehran University of Engineering and Technology, Jamshoro, Sindh 76062, Pakistan
2
Department of Garment Manufacturing, National Textile University, Faisalabad 37610, Pakistan
3
Department of Industrial and Manufacturing Engineering, NED University of Engineering and Technology, Karachi 75270, Pakistan
4
Department of Industrial Engineering, Hongik University, Seoul 04066, Korea
*
Authors to whom correspondence should be addressed.
Submission received: 24 December 2018 / Revised: 21 January 2019 / Accepted: 25 January 2019 / Published: 1 February 2019

Abstract

:
Modern supply chains are vulnerable to high impact, low probability disruption risks. A supply chain usually operates in such a network of entities where the resilience of one supplier is critical to overall supply chain resilience. Therefore, resilient planning is a key strategic requirement in supplier selection decisions for a competitive supply chain. The aim of this research is to develop quantitative resilient criteria for supplier selection and order allocation in a fuzzy environment. To serve the purpose, a possibilistic fuzzy multi-objective approach was proposed and an interactive fuzzy optimization solution methodology was developed. Using the proposed approach, organizations can tradeoff between cost and resilience in supply networks. The approach is illustrated using a supply chain case from a garments manufacturing company.

Graphical Abstract

1. Introduction

Outsourcing is a competitive strategy in the global supply chain. Evaluating and selecting the best set of suppliers is a challenging decision in outsourcing and it plays a significant role in supply chain performance [1,2]. Traditionally the supplier selection and order allocation decision is made based on cost and quality criteria. However, modern supply chains are more prone to unexpected High Impact Low Probability (HILP) and Low Impact High Probability (LIHP) disruption events [3]. HILP disruption events are commonly known as random disruptions risks such as man-made and natural disasters, whereas LIHP disruptions are targeted disruptions such as day-to-day operational risks. Tang and Tomlin [4] proposed six disruption sources in the supply chain and among them, supplier performance is most frequent. The role of the supplier selection decision in these supply chain risk has only been partially explored in the literature [5]. Multi-sourcing strategies and are now common to many supply chains in order to minimize the supplier’s disruption risks [6]. For example, during a fire in a plant of Philips Electronics in 2010 disrupt two of its major customers: Ericsson and Nokia. Ericsson lost about a month of production and suffered $200 million while Nokia recovered due to its multi-sourcing ability [7]. Toyota Motor Corp. lost billions of dollars in 2010 during product recall due to its part sourcing from one supplier for many car models. These examples show that multi-sourcing strategies work well. On the contrary, multi-sourcing strategies failed during some HILP disruption events. For example, Japan earthquake disrupted many semiconductor supply chains. Chinese Firm ZTE Corp. faced shortages of batteries and LCD screens due to all of its suppliers in the affected region. Ford Motor Co. and General Motor Co. faced shortages of auto parts and stop production due to the shutdown of two Hitachi Ltd.’s plants. These historical events suggest that the supplier selection criteria should be extended to new resilience capabilities [8]. Thus it crucial to provide a reliable level of resilience to the supply side to protect such shortages especially during HILP events [9].
Several studies have been conducted to consider resilience in the supply chain [8,10,11]. The concept of resilience in specific to the supplier selection problem has also been discussed by several authors [12,13,14,15,16,17,18,19,20,21,22,23,24,25]. Most of these studies focused on multiple sourcing and operational performance of suppliers. However, to the best of authors knowledge, this is the first study which focuses on supply network by considers supply density, resilience score of supplier’s locations, and transit time in addition to other operational criteria. This paper aims to develop a supplier selection and order allocation model to build a resilient supply chain in response to HILP disruptions. To do so, a possibilistic multi-objective fuzzy optimization-based model with a new resilience objective is proposed which consists of supply density, resilience score, and transit time. Furthermore, the proposed model is solved using Tiwari, et al. [26] weighted additive approach and Werners [27] fuzzy and operator methods. Fuzzy based multi-objective approaches are widely used in supplier selection problem to deal with uncertain information [28,29]. This research answers the following questions: (i) Which supplier is selected based on the importance given to each objective? (ii) How much to purchase from each selected supplier?
The remainder of the paper is organized as follows. Section 2 provides related literature. Section 3 includes problem description and mathematical model for supplier selection and order allocation with a new resilience objective. Section 4 comprises of the proposed possibilistic fuzzy based solution methodology. Section 5 presents a numerical example to show the application of proposed supplier selection and order allocation model. Section 6 and Section 7 discussed the results of the proposed mathematical model and solution methodology. Finally, Section 8 presents some conclusions and future directions drawn from the study.

2. Literature Review

The word resilience first coined by Holling [30] in the context of ecology. According to Holling [30], the resilience is the ability of a system to absorb changes in state variables, driving variable and parameters, and still persist. Due to the increase in complexity and uncertainty in the business environment, several studies shown interest in the concept of resilience in a managerial perspective. Hamel and Valikangas [31] defined resilience as a capacity for continuous reconstruction. Sheffi [32] defined resilience in terms of enterprise resilience as the ability of an organization to successfully confront the unforeseen. Sutcliffe and Vogus [33] stated that resilience is the (1) ability to absorb strain and improve the functionality of organization despite the presence of difficulty or (2) ability to bounce back after disturbances. More recently, Woods [34] defined resilience in simple terms as system’s ability to bounce back after disruptions and to bounce forward through learning from those disruption events and increase the system’s adaptive capacity for handling uncertain events.
The concept of supply chain resilience gained prominent importance during recent years in supply chain risk management research [35]. Supply chain resilience is a relatively new concept to mitigate risks that can be defined as the ability to reduce the probability of a disruption, to reduce the impact of disruption, and to reduce the recovery time to normal performance [36]. Supply chain resilience has been defined by several authors in simpler and broader terms. Most of these studies described supply chain resilience as the ability to withstand disruptions and converge to the original state or to a new desirable state. Despite the increasing number of publication in supply chain resilience area, most of the researches provided qualitative insights and there is a limited number of quantitative modelling techniques available [37]. These qualitative models used different performance measures for designing resilient supply chains. Priya Datta, et al. [38] developed the framework to improve operational resilience. Falasca, Zobel and Cook [36] proposed three determinants (density, complexity, and node criticality) of supply chain resilience for supply chain design. Azevedo, et al. [39] proposed GResilient index to assess supply chain resilience using the Delphi technique. Miller-Hooks, et al. [40] proposed a transportation network resilience model using stochastic programming. They presented the expected fraction of demand fulfilment after disruption as resilience metric.
Supply chain usually functions in the system of parties where the resilience of one party (e.g. a supplier) is critical for overall supply chain resilience. As discuss earlier, many major disruptions break down supply networks and it takes a long time to recover. Whereas, the probability of disruption may be reduced by developing a resilient network and it takes considerably less recovery time [41]. Suppliers constitute the most important role in the performance of the supply chain, therefore, the resilience of the supply network is expected to contribute and increase overall supply chain resilience [42]. Despite its importance, there is very limited research conducted which consider resilience of supply network. The literature on resilient supplier selection is summarized in Table 1. Haldar, Ray, Banerjee and Ghosh [20] developed a resilient supplier selection model using AHP-QFD method to rate the suppliers. They used five resilience criteria (density, complexity, node criticality, responsiveness and re-engineering) for the supplier selection process. More recently, Haldar, Ray, Banerjee and Ghosh [21] proposed a fuzzy group decision-making approach for resilient supplier selection using triangular and trapezoidal fuzzy numbers. They considered investment, responsiveness, and capacity of holding inventory as resilient criteria. Sawik [22] proposed resilience strategies for supplier selection and order allocation problem under disruption risks. Recently, Sawik [23] proposed a stochastic mixed integer model for supplier selection and customer order scheduling using disruption risks for single and dual sourcing. Yilmaz-Börekçi, İşeri Say and Rofcanin [24] proposed a scale for measuring supplier resilience within supply networks. Mari, et al. [43] proposed a resilient and sustainable supply chain network model. They used expected disruption cost as a resilient metric. Torabi, Baghersad and Mansouri [9] developed a bi-objective stochastic model to trade-off the resilience level of the supply network and system cost. Memon, Lee and Mari [28] proposed supplier selection model using grey and uncertainty theories. Rajesh and Ravi [25] proposed a resilient supplier selection method using grey relational analysis. They consider supplier’s performance, responsiveness, risk reduction, technical capabilities and sustainability as selection criteria. Sahu, Datta and Mahapatra [14] proposed fuzzy-VIKOR based supplier selection framework by combining the general selection strategy and resilience strategy. They considered investment capacity, responsiveness, and inventory capacity as resilience criteria. Hosseini and Al Khaled [13] developed a resilience score of suppliers based on eight criteria namely backup supplier contracting, surplus inventory, location separation, robustness, reliability, reorganization, rerouting, and restoration. They proposed a hybrid ensemble and AHP approach to select a suitable supplier. Pramanik, et al. [44] developed a resilient supplier selection model using AHP-TOPSIS and Sen, et al. [45] proposed g-resilient supplier selection model using dominance-based fuzzy decision making. Wang, Zhang, Chong and Wang [18] developed a resilient supplier selection model for construction supply chain by integrating building information modelling and geographical information system. Parkouhi and Ghadikolaei [12] proposed FANP and grey-VIKOR based resilient supplier selection model. They considered benefits, opportunities, costs, and risks as resilience criteria. López and Ishizaka [15] proposed a coupled method of FCM and AHP for supplier selection for a resilient supply chain. Recently, Jabbarzadeh, Fahimnia and Sabouhi [17] proposed stochastic bi-objective optimization model considering fuzzy c-means to developed sustainable supply chain network that performs resiliently. Sabouhi, Pishvaee and Jabalameli [16] presented integrated stochastic and fuzzy DEA based model for supplier selection considering resilience. They considered multi-sourcing, supplier fortification, and emergency inventory as resilience criteria. More recently, Parkouhi, et al. [46] proposed a resilient supplier selection framework using grey-DEMATEL approach.
Most of the above studies considered operational risks for resilient supplier selection problem. This is the first time that a possibilistic fuzzy multi-objective model is proposed for resilient supplier selection and order allocation problem. Furthermore, for the first time in the literature supply density, resilience index score, and transit time are considered as supply selection criteria for resilient supply network.
Falasca, Zobel and Cook [36] proposed three characteristics (node criticality, supply chain complexity, and supply chain density) for building a resilient supply chain. Among them, supply chain density is the most important resilient criteria when designing supply networks under HILP disruptions. This is due to fact that denser supply networks are vulnerable to HILP disruption risks [36]. For example, 1999s Taiwan earthquake ended up having a significant effect on the entire global PC supply chain, because of the high concentration of computer component manufacturers in Hsinchu, Taiwan [47]. This example shows that the selection of a large number of suppliers from each region is a vulnerable multi-sourcing strategy, hence, this paper proposed supply density-based approach to tackle this problem. Furthermore, every country or territory has different resilient capabilities FMGlobal [48] and it affects the performance of the supply chain. Therefore, this study also proposed resilience index score-based criteria to supplier selection. The resilience index score is proposed by FMGlobal [48] is a data-driven tool to rank the countries to supply chain disruption risks. Nine key drivers of supply chain risks are considered and grouped into three categories namely: economic, risk quality, and supply chain factors. These nine drivers include local supplier quality, quality of fire risk management, GDP per capita, oil intensity, quality of hazard risk management, exposure to natural hazards, corruption control, infrastructure, and political risks [49]. Transit time is the last resilient criteria for supplier selection considered in this study. Transit time is an important indicator of supply chain flexibility [50]. Transit time reduction is one of the wildly used criteria to mitigate supply risks [51].

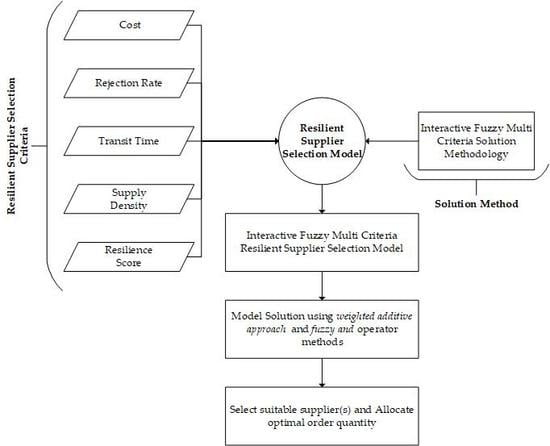
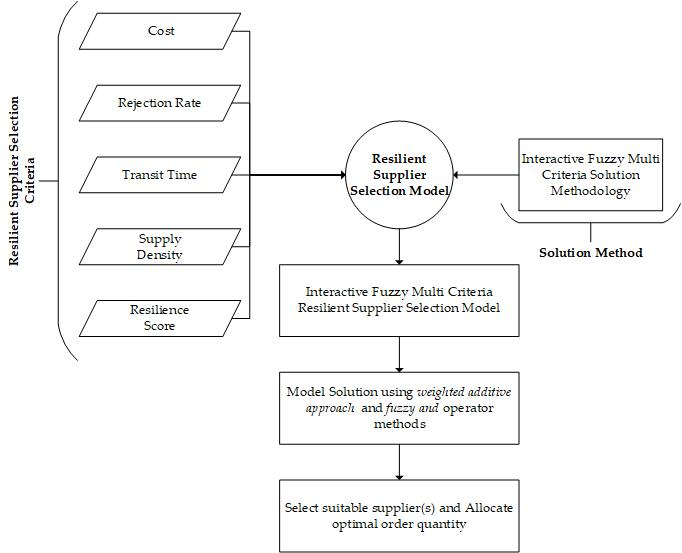
3. Problem Formulation

In this study, a garment manufacturer is assumed which want to select a suitable set of suppliers for the required material. All the model parameters are considered as fuzzy parameters. Five objectives considered in this study, namely: a cost which includes purchase and transportation costs, the rejection rate of suppliers, transit time from suppliers, supply density, and supplier resilience score based on their locations.

3.1. Mathematical Model Notations

• Indices
sexisting supplierss = 1, 2, … S
lnumber of objective functionsl = 1, 2, … L
• Parameters
d ˜ Total demand of required material
u ˜ s Purchase cost of required material from supplier s
c ˜ s Transportation cost of material from supplier s
ρ ˜ s Percentage of the rejected material delivered by the supplier s
ν ˜ s Capacity of supplier s
k ˜ s Minimum acceptable purchase quantity from supplier s
mxsMaximum number of suppliers selected for required material
t ˜ s Transit time from supplier s
dsabDistance between selected supplier as and selected supplier bs (a ≠ b)
rssResilience index score of supplier s
• Decision Variables
q s Purchase quantity from supplier s
Φ s = { 1 0 1, If supplier s is selected, otherwise 0.
ω a b ω a b = { 1 ,   If   supplier   a   and   supplier   b   are   selected . 0 , otherwise ( a , b ) s   and   a b

3.2. Model Objectives

The Equation (1) represents the objective function for the cost. It is the sum of procurement cost and transportation cost from selected suppliers. The objective function of the total rate of rejection is estimated in Equation (2). The objective function for transit time from all selected supplier is calculated as shown in Equation (3). The Equation (4) shows the supply density for all selected suppliers. Total resilience index score objective is estimated in Equation (5). Where rss represents the resilience index score of supplier location obtained from FMGlobal [48].
Minimize   f c o s t = s ( u ˜ s + c ˜ s   ) q s
Minimizes   f r e j = s ρ ˜ s q s
Minimizes   f time = s t ˜ s Φ s
Maximize   f den = 1 d ˜ ( a s b s a b d s a b Φ s )
Maximize   f res = s r s s q s d ˜

3.3. Model Constraints

Constraint (6) ensures that total procured material should satisfy its demand.
s q s = d ˜
Constraint (7) is capacity restrictions on the supplier. Also, it controls the flow between the supplier and the buyer through a binary variable. Constraint (8) ensures that purchase quantity from the selected supplier will be more than its acceptable order quantity limit. Constraint (9) restricts the maximum allowable supplier to be selected for the required material.
q s ν ˜ s Φ s
q s k ˜ s Φ s
s Φ s m x s
Constraints (10) and (11) determine the intra-stage flow between suppliers and buyer. If buyer received material from both supplier a and supplier b then ω a b = Φ a ϵ s = Φ b ϵ s = 1 and ω a b = 0 . On the contrary, if buyer not received material from both supplier a and supplier b then ω a b = 1 , ωab = 0 and Φ a ϵ s Φ b ϵ s .
2 ω a b + ω a b = Φ a s + Φ b s ( a , b ) s ,   and   a b
ω a b + ω a b 1 ( a , b ) s ,   and   a b

4. Fuzzy Based Solution Methodology
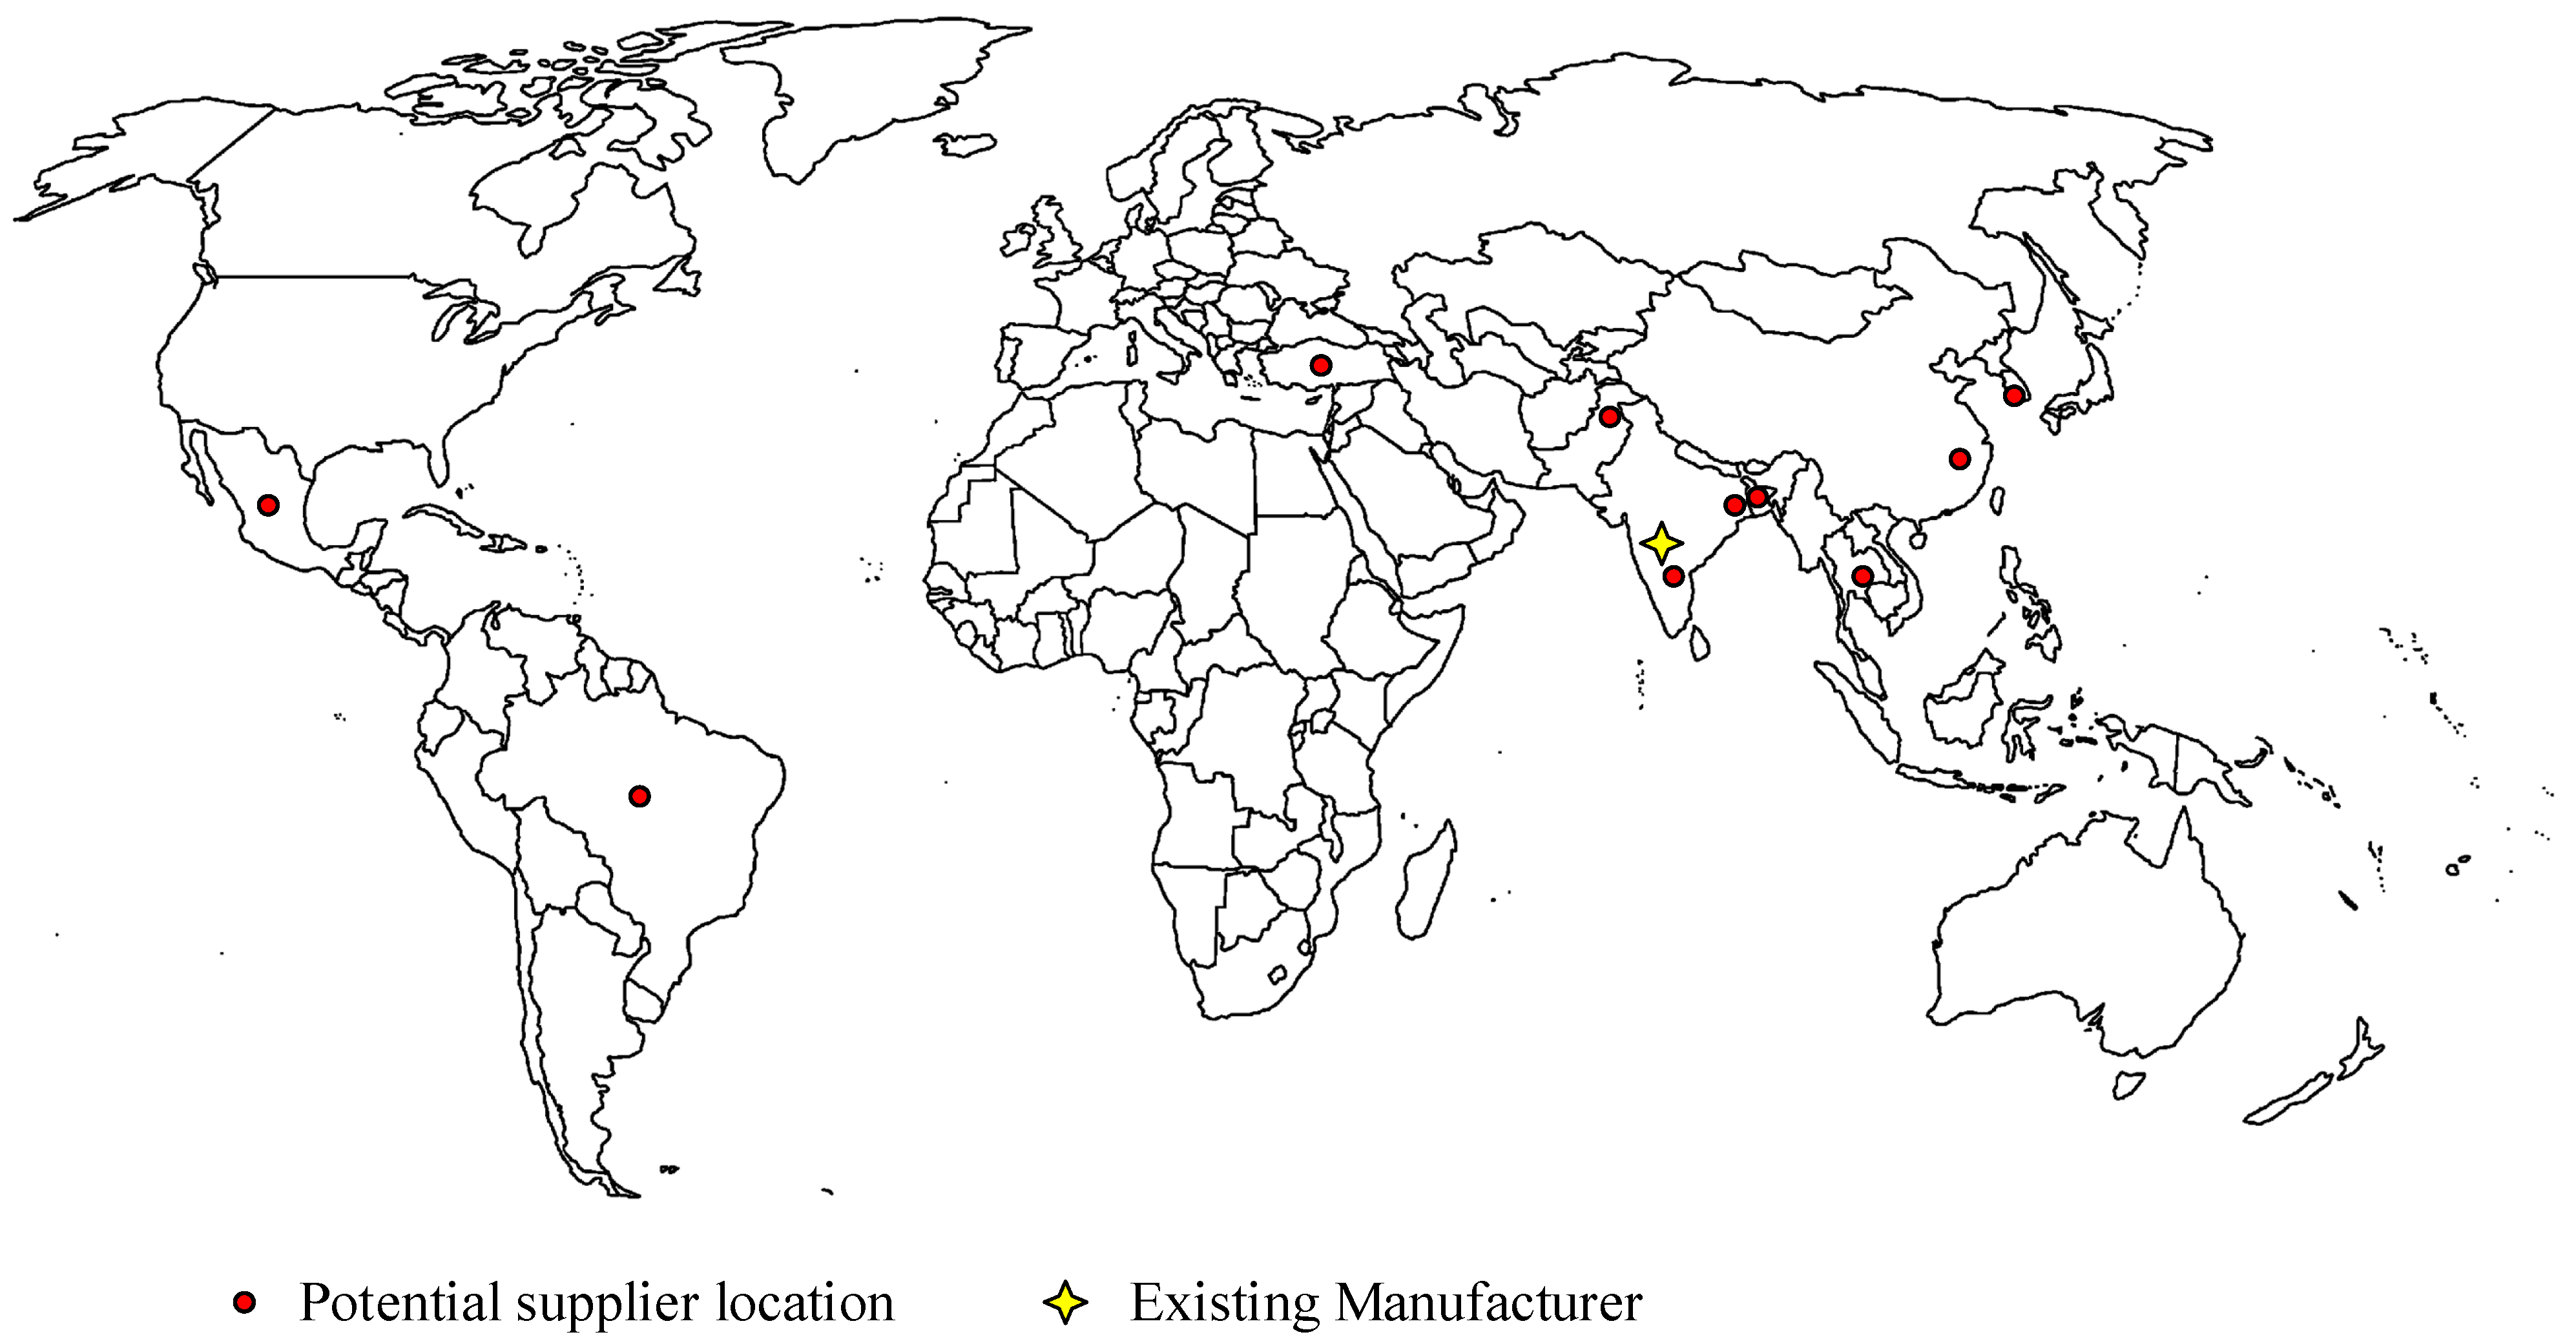
Fuzzy based programming methods are highly used for multi-objective optimization because of their capability in measuring and adjusting the decision maker’s satisfaction level of each objective function explicitly. In addition, the fuzzy theory is helpful to tackle the uncertain parameters related to supply chain optimization problem [52]. The main advantage of interactive fuzzy based approaches is that decision maker can efficiently achieve his/her preferences by controlling the search direction. The proposed solution methodology consists of the following steps.
Step 1: Convert uncertain mathematical model to equivalent auxiliary crisp
The proposed mathematical model is converted to an equivalent auxiliary crisp model. In this study, Jiménez, Arenas, Bilbao and Rodrı [51] approach is used which is based on an expected interval (EI) and expected value (EV) of fuzzy numbers. According to Jiménez, Arenas, Bilbao and Rodrı [51], the EI and EV of triangular fuzzy number (TFN) can be defined as in equation (12) and (13) respectively. Where ϑpes is the pessimistic value, ϑmos is the most likely value, and ϑopt is the optimimum value of triangular fuzzy number (ϑ). This research considered TFN because it is frequently used for a practical purpose [53].
E I ( ϑ ˜ ) = [ E 1 ϑ , E 2 ϑ ] = [ 0 1 f ϑ 1 ( x ) d x , 0 1 g ϑ 1 ( x ) d x , ] = [ 1 2 ( ϑ p e s + ϑ m o s ) , 1 2 ( ϑ m o s + ϑ o p t ) ]
E V ( ϑ ˜ ) = E 1 ϑ + E 1 ϑ 2 = ϑ p e s + 2 ϑ m o s + ϑ o p t 4
Using the above Equations (12) and (13), the equivalent auxiliary crisp model can be formulated as follows.
Minimize   f cost = s ( u s p e s + 2 u s m o s + u s o p t + c s p e s + 2 c s m o s + c s o p t 4 ) q s
Minimizes   f rej = s ( ρ s p e s + 2 ρ s m o s + ρ s o p t 4 ) q s
Minimizes   f time = s ( t s p e s + 2 t s m o s + t s o p t 4 ) Φ s
Maximize   f den = 1 d p e s + 2 d m o s + d o p t 4 ( a s b s a b d s a b Φ s )
Maximize   f res = s r s s q s d p e s + 2 d m o s + d o p t 4
Subject to
s q s [ α 2 ( d m o s + d o p t 2 ) + ( 1 α 2 ) ( d p e s + d m o s 2 ) ]
s q s [ α 2 ( d p e s + d m o s 2 ) + ( 1 α 2 ) ( d m o s + d o p t 2 ) ]
q s Φ s [ α ( ν s p e s + ν s m o s 2 ) + ( 1 α ) ( ν s m o s + ν s o p t 2 ) ]
q s Φ s [ α ( k m o s + k o p t 2 ) + ( 1 α ) ( k p e s + k m o s 2 ) ]
s Φ s m x s
2 ω a b + ω a b = Φ a s + Φ b s
ω a b + ω a b 1
Step 2: Determine α- extreme solutions
To estimate the upper (α-UB) and lower (α-LB) bounds to each objective, the crisp model developed in Step 1 is solved for each objective along with its constraint.
Step 3: Determine fuzzy membership function
Develop the fuzzy membership function for each objective using lower (α-LB) and upper (α-UB) bound values. The linear memberships for fuzzy goals are given as follows. It is assumed that membership functions are linear based on preferences and satisfaction level.
μ cost ( x ) = { 1 , f cost ( x ) f cost α L B f cost α U B f cost ( x ) f cost α U B f cost α L B , f cost α L B <   f cost ( x ) f cost α U B   0 , f cost ( x ) f cost α U B
μ rej ( x ) = { 1 , f r e j ( x ) f r e j α L B f r e j α U B f r e j ( x ) f r e j α U B f r e j α L B , f r e j α L B   f r e j ( x ) f r e j α U B   0 , f r e j ( x ) f r e j α U B
μ t i m e ( x ) = { 1 , f t i m e ( x ) f t i m e α L B f t i m e α U B f t i m e ( x ) f t i m e α U B f t i m e α L B , f t i m e α L B f t i m e ( x ) f t i m e α U B   0 , f t i m e ( x ) f t i m e α U B
μ d e n ( x ) = { 1 , f d e n ( x ) f d e n α U B f d e n ( x ) f d e n α L B f d e n α U B f d e n α L B , f d e n α U B f d e n ( x ) f d e n α L B 0 , f d e n ( x ) f d e n α L B
μ r e s ( x ) = { 1 , f r e s ( x ) f r e s α U B f r e s ( x ) f r e s α L B f r e s α U B f r e s α L B , f r e s α U B   f r e s ( x ) f r e s α L B   0 , f r e s ( x ) f r e s α L B
where f l α L B is a minimum value of f l ( x ) and f l α U B is a maximum value of f l ( x ) with predefined α. These values the lth objective depends on its nature. f l α L B are set as the aspiration level of cost, rejection rate, and transit time objective. Whereas f l α U B are set as the aspiration level of supply density and resilience index.
Step 4: Convert the multi-objective model into a single objective
The proposed model is converted into the single objective in this stage. In this paper, two most popular fuzzy based approaches i.e., Tiwari, Dharmar and Rao [26] weighted additive approach and Werners [27] fuzzy and operator are implemented.
The weighted additive approach allows the buyer to assign different weights to objectives in the simple additive fuzzy achievement function. Mathematical formulation of the weighted additive method is as follows.
maximize l w l μ z l ( x ) subject   to μ z l ( x ) [ 0 , 1 ] , l x 0 }
where wl represents the weight of ith objective. Selection of weights are subjected choice of decision makers and some good techniques can be used to determine the weights such as FAHP and structural equation modelling.
Werners’ fuzzy and operator method are widely used interactive method. The advantage of this method is that it is positively related to the compensation rate due to its strong monotonicity. Additionally, it is easy to handle and has generated reasonable consistent results in applications [54]. By adopting the Werner’s’ method following a single objective model can be formed.
maximize γ ζ 0 + ( 1 γ ) l ζ 1 subject   to μ 1 ( x ) ζ 0 + ζ 1 , l ζ 0 , ζ 1 , γ [ 0 , 1 ] }
where, ζ1 is the difference between satisfaction level of objectives their minimum satisfaction level ζ0, That is, ζ1 = μ1 − ζ0. γ denotes the coefficient of compensation.
Step 5: Determine the solution method parameter
Determine the values of the relative importance of objectives (wl) and coefficient of compensation (γ) to solve the mathematical model using both weighted additive approach and Werners’ fuzzy and operator methods.
Step 6: Solve the model
In the last step, solve the model by using parameters of the mathematical model and solution methods. This process continues by varying the solution method parameters (i.e., γ and wl) until decision makers are satisfied with the final solution. If decision makers want to modify the value of α, then restart the process from step 2.

5. An Illustration

The effectiveness of the proposed resilient supplier selection model and solution methodology is demonstrated in this section. The data relates to a realistic situation of a garment manufacturing sector as shown in Figure 1. The adopted situation can easily be extended to any other industry. Initially, the data are estimated as most likely values, these most likely values of the fuzzy parameter (fzmos) are estimated using available information or hypothetically set based on realistic assumption. The pessimistic and optimistic values are estimated using f z p e s = ( 1 η 1 ) f z m o s and, where two random numbers η1 and η2 are assumed between 0.2 and 0.8 to estimate. Table 2 shows the data set of unit purchase cost, transportation cost, rejection rate, capacity, and resilience index score of potential suppliers. The unit purchase costs from each supplier are hypothetical set based on labour cost, land value, resource availability at supplier locations. Transportation cost and transit time (see Table 3) from each supplier to manufacturer are estimated from sea rates (https://www.searates.com/). The resilience index score of each supplier is estimated from FM, Global resilience index data-driven tool (https://www.fmglobal.com/) based on the location of suppliers. The distance (as the crow flies) between suppliers (see Table 4) are calculated using the Google maps (https://www.google.com/maps). The demand for raw materials is assumed as most likely 8000 units, minimum acceptable order quantity is assumed as 1000 units, and maximum three suppliers can be selected for required material.

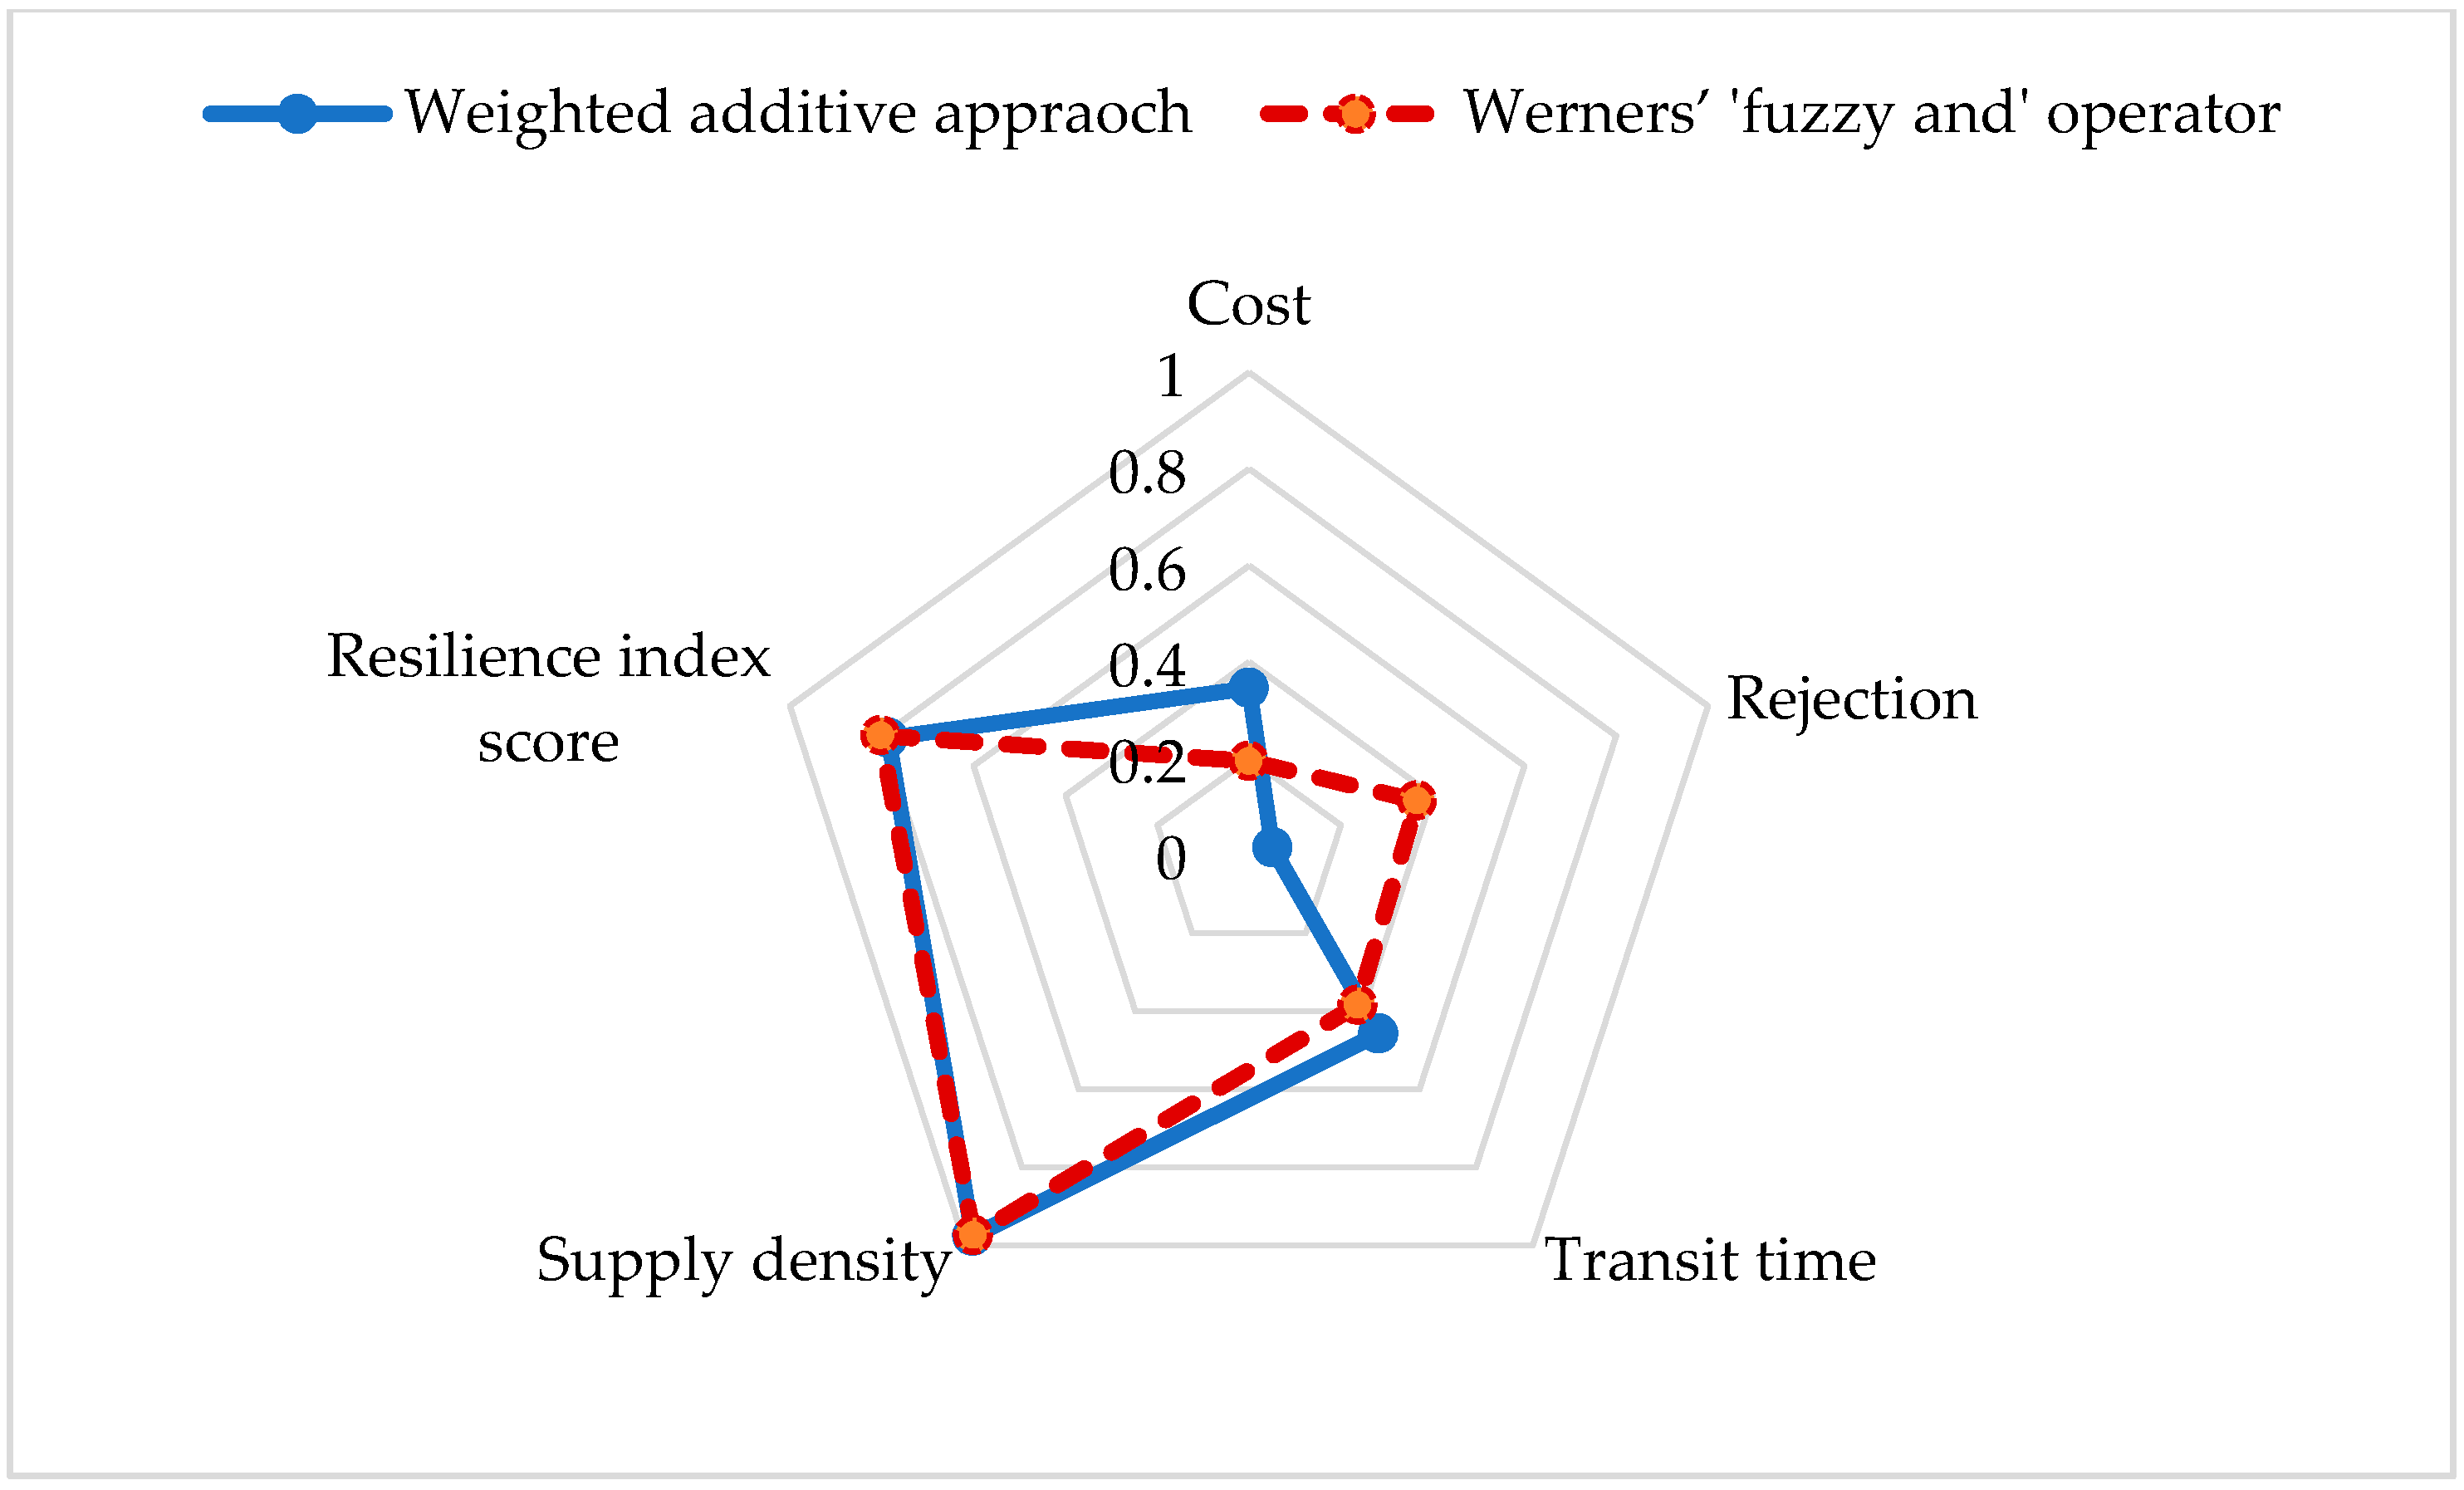
6. Model Solution and Result Analysis

The proposed fuzzy multi-objective model is solved in Lingo 14.0. Lingo optimization software has been widely used in supply chain optimization problems [55,56]. According to the steps of the proposed methodology, the payoff values are estimated by solving the single objective model. Table 5 shows payoff values estimated from the single objective model. The aspiration level of cost, rejection, transit time, supply density, and resilience score are estimated as $22,514.93, 0.025, 3.17 days, 0.286, and 47.89 respectively. Once the payoff values are estimated, the fuzzy membership functions of objectives are estimated as shown below.
μ cost ( q s ) = { 1 , f cost ( q s ) 22514.93 75796.12 f cost ( q s ) 75796.12 22514.93 , 22514.93 <   f cost ( q s ) 75796.12   0 , f cost ( q s ) 75796.12
μ rej ( q s ) = { 1 , f r e j ( q s ) 0.025 0.10 f r e j ( q s ) 0.10 0.025 , 0.025   f r e j ( q s ) 0.10   0 , f r e j ( q s ) 0.10
μ t i m e ( q s ) = { 1 , f t i m e ( q s ) 3.17 61.11 f t i m e ( q s ) 61.11 3.17 , 3.17 f t i m e ( q s ) 61.11 0 , f t i m e ( q s ) 61.11
μ d e n ( q s ) = { 1 , f d e n ( q s ) 0.28 f d e n ( q s ) 0.017 0.28 0.017 , 0.017   f d e n ( q s ) 0.28 0 , f d e n ( q s ) 0.017
μ r e s ( q s ) = { 1 , f r e s ( q s ) 47.89 f r e s ( q s ) 29.79 47.89 29.79 , 29.79 f r e s ( q s ) 47.89 0 , f r e s ( q s ) 29.79
The proposed mathematical model is solved using both methods, that is, a weighted additive approach and Werners’ 'fuzzy and' operator methods. A solution of illustrated case example using both methods is shown in Table 6. The result shows that both methods produce a comprehensive optimal solution. However, the weighted additive approach considers the importance of objectives based on the weight given to each objective. For example, when more importance is given to resilience score (i.e., w5 = 0.3), it results in 78.6% achievement of aspiration level. On the other hand, when all objectives and equal importance (Werners’ method) than resilience score is given, the objective results in 34% achievement of aspiration level. Comparative analysis of both methods is shown in Figure 2.

7. Sensitivity Analysis

Sensitivity analysis of both methods is carried out by varying methodology parameters (i.e., α, γ and wl) as discussed in the final step of the proposed solution methodology. Table 7 and Table 8 show the analysis result of the weighted additive approach and Werners’ ‘fuzzy and’ operator method, respectively. Two cases are solved with the weighted additive approach: (1) more importance is given to resilience objective and (2) more importance given to cost objective.
The result shows that there is a tradeoff in economic objective and resilience objective. Hence, it can be said that the increase is supply chain resilience will tend to increase the total cost of the supply network. This is possible because economic supply networks are more dense networks in order to minimize transportation cost, hence any HILP disruption event such as earthquake or tsunami may disrupt more than one supplier. Therefore, it is suggested that companies should avoid denser supply networks to minimize risks from high impact low probability disruption event. Analysis result shows that 92% achievement of cost aspiration level will bring achievement of about only 6.1% supply density and 49.8% resilience index score aspiration levels respectively. On the other hand, 18.4% achievement of cost aspiration level will bring achievement of about 97% supply density and 88.1% resilience index score respectively.
Assume that decision makers required balance results and choose the best outcome at α = 0.9, and γ = 1.0 (highlighted row in Table 8). Hence, the final decision of the illustrated example is shown in Figure 3. The optimal quantity of material purchase from suppliers are q (Korea) = 3751 units, q (Bangladesh) = 3655 units, and q (Turkey) = 1258 units.

8. Conclusion and Future Suggestions

This paper introduced a novel possibilistic fuzzy environment for resilient supplier selection and order allocation considering new resilience criteria (supply density, transit time and resilience index score) for the selection of suppliers. For this purpose, an interactive fuzzy multi-objective programming approach is introduced to reduce uncertainties inherent in the supplier selection decision. A six-step solution methodology is designed to solve the proposed uncertain multi-objective model and a numerical case example is provided to show the applicability of the proposed model in a real situation.
This study significantly helps the practitioners who are trying to consider resilience in their supply network. The research results show the importance of supplier’s location in order to minimize disruption risks. Furthermore, the proposed model will help the managers to effectively evaluate and select a suitable set of suppliers while considering cost and resilience simultaneously. Moreover, the proposed possibilistic fuzzy based solution methodology will be helpful for practitioners and academicians to tackle cognitive and stochastic uncertainties related to supplier evaluation and selection problem. This study also helps the academicians to analyze the importance of resilient supply networks under disruption risks. Additionally, the proposed multi-objective possibilistic fuzzy-based approach can be useful in another area of supply chain optimization.
Although this research gained important insights from the implementation of proposed resilience criteria and solution methodology, there are some limitations which may be considered in future research. This paper assumed triangular fuzzy numbers for model parameters, it will be interesting to compare the research results with other fuzzy numbers such as trapezoidal in future studies. Furthermore, this research only considered a disruption of the location where suppliers are located. However, it will be important to consider the disruption of transport links between suppliers and buyers. Another interesting possible direction for future research is to extend the proposed model to multi-commodity and multi-period planning horizon. Lastly, the analysis result indicates that economic networks are denser network and they may be vulnerable to disruption risks, it will be valuable to further investigate the relationship between the economic network (denser network) and disruption risks.

Author Contributions

Conceptualization, S.I.M.; Methodology, M.S.M.; Software, M.B.R.; Supervision, S.M.Q.; Validation, S.M.Q.; Writing—original draft, S.I.M.; Writing—review & editing, M.W.I.

Acknowledgments

This research was supported by the Higher Education Commission of Pakistan through the Startup Research Grant Program (SRPG#1299 and SRGP#1335).

Conflicts of Interest

The authors declare no conflict of interest.

References

  1. Schoenherr, T.; Modi, S.B.; Benton, W.C.; Carter, C.R.; Choi, T.Y.; Larson, P.D.; Leenders, M.R.; Mabert, V.A.; Narasimhan, R.; Wagner, S.M. Research Opportunities in Purchasing and Supply Management. Int. J. Prod. Res. 2012, 50, 4556–4579. [Google Scholar] [CrossRef]
  2. Kim, J.S.; Jeon, E.; Noh, J.; Park, J.H. A Model and an Algorithm for a Large-Scale Sustainable Supplier Selection and Order Allocation Problem. Mathematics 2018, 6, 325. [Google Scholar] [CrossRef]
  3. Mari, I.S.; Lee, Y.H.; Memon, M.S.; Park, Y.S.; Kim, M. Adaptivity of Complex Network Topologies for Designing Resilient Supply Chain Networks. Int. J. Ind. Eng. 2015, 22, 102–116. [Google Scholar]
  4. Tang, C.; Tomlin, B. The Power of Flexibility for Mitigating Supply Chain Risks. Int. J. Prod. Econ. 2008, 116, 12–27. [Google Scholar] [CrossRef]
  5. Wang, C.-N.; Nguyen, V.T.; Thai, H.T.N.; Tran, N.N.; Tran, T.L.A. Sustainable Supplier Selection Process in Edible Oil Production by a Hybrid Fuzzy Analytical Hierarchy Process and Green Data Envelopment Analysis for the Smes Food Processing Industry. Mathematics 2018, 6, 302. [Google Scholar] [CrossRef]
  6. Wang, X.; Herty, M.; Zhao, L. Contingent Rerouting for Enhancing Supply Chain Resilience from Supplier Behavior Perspective. Int. Trans. Oper. Res. 2016, 23, 775–796. [Google Scholar] [CrossRef]
  7. Chopra, S.; Sodhi, M. Reducing the Risk of Supply Chain Disruptions. Mit Sloan Manag. Rev. 2014, 55, 72–80. [Google Scholar]
  8. Barroso, A.P.; Machado, V.H.; Barros, A.R.; Machado, V.C. Toward a Resilient Supply Chain with Supply Disturbances. Presented at the 2010 IEEE International Conference on Industrial Engineering and Engineering Management (IEEM), Macao, China, 7–10 December 2010. [Google Scholar]
  9. Torabi, S.A.; Baghersad, M.; Mansouri, S.A. Resilient Supplier Selection and Order Allocation under Operational and Disruption Risks. Transp. Res. Part E: Logist. Transp. Rev. 2015, 79, 22–48. [Google Scholar] [CrossRef]
  10. Carvalho, H.; Azevedo, S.G.; Cruz-Machado, V. Agile and Resilient Approaches to Supply Chain Management: Influence on Performance and Competitiveness. Logist. Res. 2012, 4, 49–62. [Google Scholar] [CrossRef]
  11. Ribeiro, P.J.; Barbosa-Povoa, A. Supply Chain Resilience: Definitions and Quantitative Modelling Approaches–a Literature Review. Comput. Ind. Eng. 2018, 115, 109–122. [Google Scholar] [CrossRef]
  12. Parkouhi, V.S.; Ghadikolaei, A.S. A Resilience Approach for Supplier Selection: Using Fuzzy Analytic Network Process and Grey Vikor Techniques. J. Clean. Prod. 2017, 161, 431–451. [Google Scholar] [CrossRef]
  13. Hosseini, S.; Al Khaled, A. A Hybrid Ensemble and Ahp Approach for Resilient Supplier Selection. J. Intell. Manuf. 2016, 1–22. [Google Scholar] [CrossRef]
  14. Sahu, A.K.; Datta, S.; Mahapatra, S.S. Evaluation and Selection of Resilient Suppliers in Fuzzy Environment: Exploration of Fuzzy-Vikor. Benchmarking Int. J. 2016, 23, 651–673. [Google Scholar] [CrossRef]
  15. López, C.; Ishizaka, A. A Hybrid Fcm-Ahp Approach to Predict Impacts of Offshore Outsourcing Location Decisions on Supply Chain Resilience. J. Bus. Res. 2017. [Google Scholar] [CrossRef]
  16. Sabouhi, F.; Pishvaee, M.S.; Jabalameli, M.S. Resilient Supply Chain Design under Operational and Disruption Risks Considering Quantity Discount: A Case Study of Pharmaceutical Supply Chain. Comput. Ind. Eng. 2018, 126, 657–672. [Google Scholar] [CrossRef]
  17. Jabbarzadeh, A.; Fahimnia, B.; Sabouhi, F. Resilient and Sustainable Supply Chain Design: Sustainability Analysis under Disruption Risks. Int. J. Prod. Res. 2018, 1–24. [Google Scholar] [CrossRef]
  18. Wang, T.-K.; Zhang, Q.; Chong, H.; Wang, X. Integrated Supplier Selection Framework in a Resilient Construction Supply Chain: An Approach Via Analytic Hierarchy Process (Ahp) and Grey Relational Analysis (Gra). Sustainability 2017, 9, 289. [Google Scholar] [CrossRef]
  19. Hosseini, S.; Barker, K. A Bayesian Network Model for Resilience-Based Supplier Selection. Int. J. Prod. Econ. 2016, 180, 68–87. [Google Scholar] [CrossRef]
  20. Haldar, A.; Ray, A.; Banerjee, D.; Ghosh, S. A Hybrid Mcdm Model for Resilient Supplier Selection. Int. J. Manag. Sci. Eng. Manag. 2012, 7, 284–292. [Google Scholar] [CrossRef]
  21. Haldar, A.; Ray, A.; Banerjee, D.; Ghosh, S. Resilient Supplier Selection under a Fuzzy Environment. Int. J. Manag. Sci. Eng. Manag. 2014, 9, 147–156. [Google Scholar] [CrossRef]
  22. Sawik, T. Selection of Resilient Supply Portfolio under Disruption Risks. Omega 2013, 41, 259–269. [Google Scholar] [CrossRef]
  23. Sawik, T. Joint Supplier Selection and Scheduling of Customer Orders under Disruption Risks: Single vs. Dual Sourcing. Omega 2014, 43, 83–95. [Google Scholar] [CrossRef]
  24. Yilmaz-Börekçi, D.; Say, A.İ.; Rofcanin, Y. Measuring Supplier Resilience in Supply Networks. J. Chang. Manag. 2015, 15, 64–82. [Google Scholar] [CrossRef]
  25. Rajesh, R.; Ravi, V. Supplier Selection in Resilient Supply Chains: A Grey Relational Analysis Approach. J. Clean. Prod. 2015, 86, 343–359. [Google Scholar] [CrossRef]
  26. Tiwari, R.N.; Dharmar, S.; Rao, J.R. Fuzzy Goal Programming—An Additive Model. Fuzzy Sets Syst. 1987, 24, 27–34. [Google Scholar] [CrossRef]
  27. Werners, B.M. Aggregation Models in Mathematical Programming. In Mathematical Models for Decision Support; Springer: Berlin/Heidelberg, Germany, 1988; pp. 295–305. [Google Scholar]
  28. Memon, M.S.; Lee, Y.H.; Mari, S.I. Group Multi-Criteria Supplier Selection Using Combined Grey Systems Theory and Uncertainty Theory. Expert Syst. Appl. 2015, 42, 7951–7959. [Google Scholar] [CrossRef]
  29. Memon, M.S.; Mari, S.I.; Shaikh, F.; Shaikh, S.A. A Grey-Fuzzy Multiobjective Model for Supplier Selection and Production-Distribution Planning Considering Consumer Safety. Math. Probl Eng. 2018, 2018, 5259876. [Google Scholar] [CrossRef]
  30. Holling, C.S. Resilience and Stability of Ecological Systems. Annu. Rev. Ecol. Syst. 1973, 4, 1–23. [Google Scholar] [CrossRef] [Green Version]
  31. Hamel, G.; Valikangas, L. The Quest for Resilience. Revista Icade Revista de las Facultades de Derecho y Ciencias Económicas y Empresariales 2004, 62, 355–358. [Google Scholar]
  32. Sheffi, Y. The Resilient Enterprise: Overcoming Vulnerability for Competitive Advantage; MIT Press: Cambridge, MA, USA, 2005. [Google Scholar]
  33. Sutcliffe, M.K.; Vogus, T.J. Organizing for Resilience. Posit. Organ. Scholarsh. Found. New Discip. 2003, 94, 110. [Google Scholar]
  34. Woods, D.D. Four Concepts for Resilience and the Implications for the Future of Resilience Engineering. Reliab. Eng. Syst. Saf. 2015, 141, 5–9. [Google Scholar] [CrossRef]
  35. Zhalechian, M.; Torabi, S.A.; Mohammadi, M. Hub-and-Spoke Network Design under Operational and Disruption Risks. Transp. Res. Part E Logist. Transp. Rev. 2018, 109, 20–43. [Google Scholar] [CrossRef]
  36. Falasca, M.; Zobel, C.W.; Cook, D. A Decision Support Framework to Assess Supply Chain Resilience. Presented at the 5th International ISCRAM Conference, Washington, DC, USA, 4–7 May 2008. [Google Scholar]
  37. Mari, S.I.; Lee, Y.H.; Memon, M.S. Complex Network Theory-Based Approach for Designing Resilient Supply Chain Networks. Int. J. Logist. Syst. Manag. 2015, 21, 365–384. [Google Scholar] [CrossRef]
  38. Priya Datta, P.; Christopher, M.; Allen, P. Agent-Based Modelling of Complex Production/Distribution Systems to Improve Resilience. Int. J. Logist. Res. Appl. 2007, 10, 187–203. [Google Scholar] [CrossRef]
  39. Azevedo, S.G.; Govindan, K.; Carvalho, H.; Cruz-Machado, V. Gresilient Index to Assess the Greenness and Resilience of the Automotive Supply Chain. Discuss. Pap. Bus. Econ. 2011, 8. [Google Scholar] [CrossRef]
  40. Miller-Hooks, E.; Zhang, X.; Faturechi, R. Measuring and Maximizing Resilience of Freight Transportation Networks. Comput. Oper. Res. 2012, 39, 1633–1643. [Google Scholar] [CrossRef]
  41. Tang, C.S. Robust Strategies for Mitigating Supply Chain Disruptions. Int. J. Logist. Res. Appl. 2006, 9, 33–45. [Google Scholar] [CrossRef]
  42. Sheffi, Y.; Rice, J.B., Jr. A Supply Chain View of the Resilient Enterprise. Mit Sloan Manag. Rev. 2005, 47, 41. [Google Scholar]
  43. Mari, S.I.; Lee, Y.H.; Memon, M.S. Sustainable and Resilient Supply Chain Network Design under Disruption Risks. Sustainability 2014, 6, 6666–6686. [Google Scholar] [CrossRef] [Green Version]
  44. Pramanik, D.; Haldar, A.; Mondal, S.C.; Naskar, S.K.; Ray, A. Resilient Supplier Selection Using Ahp-Topsis-Qfd under a Fuzzy Environment. Int. J. Manag. Sci. Eng. Manag. 2017, 12, 45–54. [Google Scholar] [CrossRef]
  45. Sen, D.K.; Datta, S.; Mahapatra, S.S. Dominance Based Fuzzy Decision Support Framework for G-Resilient (Ecosilient) Supplier Selection: An Empirical Modelling. Int. J. Sustain. Eng. 2017, 10, 338–357. [Google Scholar] [CrossRef]
  46. Parkouhi, S.V.; Ghadikolaei, A.S.; Lajimi, H.F. Resilient Supplier Selection and Segmentation in Grey Environment. J. Clean. Prod. 2019, 207, 1123–1137. [Google Scholar] [CrossRef]
  47. Papadakis, I.S. Financial Performance of Supply Chains after Disruptions: An Event Study. Supply Chain Manag. Int. J. 2006, 11, 25–33. [Google Scholar] [CrossRef]
  48. FMGlobal. The 2015 FM Global Resilience Index Annual Report. Available online: https://www.fmglobal.com/assets/pdf/Resilience_Methodology.pdf (accessed on 3 July 2018).
  49. Mari, S.I.; Lee, Y.H.; Memon, M.S. Sustainable and Resilient Garment Supply Chain Network Design with Fuzzy Multi-Objectives under Uncertainty. Sustainability 2016, 8, 1038. [Google Scholar] [CrossRef]
  50. Min, H.; Zhou, G. Supply Chain Modeling: Past, Present and Future. Comput. Ind. Eng. 2002, 43, 231–249. [Google Scholar] [CrossRef]
  51. Jiménez, M.; Arenas, M.; Bilbao, A.; Rodrı, M.V. Linear Programming with Fuzzy Parameters: An Interactive Method Resolution. Eur. J. Oper. Res. 2007, 177, 1599–1609. [Google Scholar] [CrossRef]
  52. Tayyab, M.; Sarkar, B.; Yahya, B. Imperfect Multi-Stage Lean Manufacturing System with Rework under Fuzzy Demand. Mathematics 2019, 7, 13. [Google Scholar] [CrossRef]
  53. Li, X.; Chien, C.F.; Yang, L.; Gao, Z. The Train Fueling Cost Minimization Problem with Fuzzy Fuel Prices. Flex. Serv. Manuf. J. 2014, 26, 249–267. [Google Scholar] [CrossRef]
  54. Selim, H.; Ozkarahan, I. A Supply Chain Distribution Network Design Model: An Interactive Fuzzy Goal Programming-Based Solution Approach. Int. J. Adv. Manuf. Technol. 2008, 36, 401–418. [Google Scholar] [CrossRef]
  55. Babar Ramzan, M.; Qureshi, S.M.; Mari, S.I.; Memon, M.S.; Mittal, M.; Imran, M.; Iqbal, M.W. Effect of Time-Varying Factors on Optimal Combination of Quality Inspectors for Offline Inspection Station. Mathematics 2019, 7, 51. [Google Scholar] [CrossRef]
  56. Sarkar, B.; Tayyab, M.; Choi, S.K. Product Channeling in an O2O Supply Chain Management as Power Transmission in Electric Power Distribution Systems. Mathematics 2019, 7, 4. [Google Scholar] [CrossRef]
Figure 1. Supply network of the problem under consideration.
Mathematics 07 00137 g001
Figure 2. Achievement levels of objectives.
Mathematics 07 00137 g002
Figure 3. Final decision based on decision makers preferences.
Mathematics 07 00137 g003
Table 1. The classification of literature in resilient supplier selection.
AuthorsResilience CriteriaTypes of RisksSolution Methodology
Network
Risks
Operational
Risks
Possibilistic
Programming
Stochastic
Programming
Fuzzy
Programming
Grey
Programming
Other
Wang, Herty and Zhao [6]Multi-supplier, production capacity, product quality, production cost-----Fluid-dynamic models
Torabi, Baghersad and Mansouri [9]Multiple sourcing, fortifying supplier, pre-positioned inventories, backup supplier, and supplier’s business continuity----
Parkouhi and Ghadikolaei [12]Benefits, Opportunities, costs, and risks----
Hosseini and Al Khaled [13]Absorptive capacity, adaptive capacity, and restorative capacity----Predictive analytics models
Sahu, Datta and Mahapatra [14]Investment capacity, Responsiveness, and Inventory capacity-----
López and Ishizaka [15]Flexibility, Visibility, Anticipation, Recovery, Security, Adaptability, Financial strength, Market position, and Collaboration-----
Sabouhi, Pishvaee and Jabalameli [16]multi-sourcing, supplier fortification, and emergency inventory----
Jabbarzadeh, Fahimnia and Sabouhi [17]Extra production capacities, Multiple sourcing, and Backup suppliers----
Hosseini and Barker [19]Absorptive capacity, adaptive capacity, and restorative capacity----Bayesian network
Haldar, Ray, Banerjee and Ghosh [21]Investment capacity, Responsiveness, and Emergency inventory holding capacity-----
Rajesh and Ravi [25]Responsiveness, risk reduction, and Technical support-----
Parkouhi, Ghadikolaei and Lajimi [46]Safety, Visibility, Environmental Controls, Trust, Flexibility, Support Services, Future Manufacturing Capabilities, and others-----
This paperSupply density, Transit time, Resilience score of supplier’s locations---
Table 2. Model input data.
Potential Supplier LocationPurchase Cost of Material ($/unit)Transportation Cost of Material ($/unit)Percentage of the Rejected MaterialCapacity of Suppliers (1000 units)Resilience Score
Korea(6,8,10)(0.08,0.13,0.21)(0.01,0.01,0.02)(3.08,5,8.08)42.1
China(1,2,4)(0.11,0.19,0.30)(0.04,0.06,0.10)(3.7,6,9.7)45.3
Thailand(4,6,8)(0.05,0.09,0.14)(0.02,0.03,0.05)(3.08,5,8.08)39
Bangladesh(1,3,5)(0.11,0.17,0.28)(0.02,0.03,0.05)(3.7,6,9.7)29
India-(Calcutta)(3,5,7)(0.10,0.16,0.26)(0.01,0.02,0.03)(2.46,4,6.46)27.1
India-(Hyderabad)(3,4,5)(0.01,0.02,0.03)(0.01,0.02,0.03)(4.62,7.5,12.12)27.1
Pakistan(3,5,7)(0.06,0.10,0.16)(0.01,0.02,0.03)(3.08,5,8.08)22.2
Turkey(8,10,12)(0.08,0.12,0.20)(0.01,0.01,0.02)(3.08,5,8.08)38.4
Brazil(6,8,10)(0.09,0.14,0.22)(0.02,0.04,0.06)(3.7,6,9.7)47.8
Mexico(7,9,11)(0.11,0.17,0.28)(0.02,0.03,0.05)(4.31,7,11.31)44.8
Table 3. Transit time from suppliers.
Supplier LocationTransit Time (days)
Korea(7.39,12,19.39)
China(9.24,15,24.24)
Thailand(1.23,2,3.23)
Bangladesh(1.85,3,4.85)
India-(Calcutta)(1.23,2,3.23)
India-(Hyderabad)(0.62,1,1.62)
Pakistan(3.08,5,8.08)
Turkey(8.01,13,21.01)
Brazil(14.78,24,38.78)
Mexico(19.71,32,51.71)
Table 4. The distance between suppliers (kilometers).
Suppliers’ location.KoreaChinaThailandBangladeshIndia (Calcutta)India
(Hyderabad)
PakistanTurkeyBrazilMexico
KoreaN/A1028.163723.833783.614037.395212.7 5768.787641.1216,739.92 12,029.52
China1028.16N/A2743.18 3059.41 3304.684478.25273.647587.05 17,589.4313,051.91
Thailand3723.832743.18 N/A1526.771616.162388.263709.846926.22 17,348.59 15,721.92
Bangladesh3783.613059.41 1526.77N/A250.061432.182374.245408.5516,067.8915,092.77
India (Calcutta)4037.393304.681616.16250.06N/A1180.872186.915327.7615,902.0215,299.76
India (Hyderabad)5212.7 4478.22388.261432.181180.87N/A1461.884788.23 14,979.2215,878.77
Pakistan5768.785273.643709.842374.242186.911461.88N/A3334.5713,710.0414,838.79
Turkey7641.127587.05 6926.22 5408.555327.764788.23 3334.57N/A10,723.3811,983.21
Brazil16,739.92 17,589.4317,348.59 16,067.8915,902.0214,979.2213,710.0410,723.38N/A5692.39
Mexico12,029.5213,051.9115,721.9215,092.7715,299.76 15878.7714,838.7911,983.215692.39 N/A
Table 5. Payoff values.
ObjectiveCost ($)Rejection
(%)
Transit Time
(days)
Supply DensityResilience Score
Minimize Cost22,514.930.09719.040.02238.2
Minimize Rejection75,796.120.02526.450.05639.22
Minimize Transit time38,143.470.0523.170.01729.79
Maximize Supply density70,159.310.161.110.28643.41
Maximize Resilience score50,560.140.1410.1247.89
Table 6. Solution of a case example.
Model ObjectivesWeighted Additive Approach aWerners’ 'Fuzzy and' Operator b
μl (x)fl (x)μl (x)fl (x)
Cost0.34678,238.030.19565,374.99
Rejection0.0510.120.3660.072
Transit time0.45742.00.38338.89
Supply density0.9750.270.9720.272
Resilience score0.78675.50.80344.33
α = 0.9, a w1 = 0.2, w2 = 0.1, w3 = 0.2, w4 = 0.2, w5 = 0.3, b γ = 0.7.
Table 7. Sensitivity analysis of the weighted additive approach.
AlphaObjective Weightsμcostμrejμtimeμdenμresfcostfrejftimefdenfres
0.9w1 = 0.2, w2 = 0.1, w3 = 0.2, w4 = 0.2, w5 = 0.30.1840.2000.3650.970.88165,941.280.08539.90.2745.7
w1 = 0.3, w2 = 0.2, w3 = 0.2, w4 = 0.1, w5 = 0.2 0.9200.2000.7620.0610.49826,730.900.08516.90.0338.8
0.6w1 = 0.2, w2 = 0.1, w3 = 0.2, w4 = 0.2, w5 = 0.30.1110.1000.5660.9100.93566,577.340.09228.30.2547.4
w1 = 0.3, w2 = 0.2, w3 = 0.2, w4 = 0.1, w5 = 0.20.8510.2000.7620.0610.63427,727.650.08516.90.0342.6
Table 8. Sensitivity analysis of Werners’ ‘fuzzy and’ operator.
αγμcostμrejμtimeμdenμresfcostfrejftimefdenfres
0.60.0–0.80.1070.3660.3830.9720.79366,774.8502.07238.80.2746.4
0.90.3660.3660.3830.9720.45153,167.880.07238.890.2738.3
1.00.4070.5660.5430.4070.40651,054.510.05729.620.1237.3
0.90.0–0.80.1950.3660.3830.9720.80365,374.990.07238.890.2744.33
0.90.3660.3660.3830.9720.54156,259.060.07238.890.2739.59
1.00.3920.5660.5430.4070.39254,899.340.05729.60.1236.88

