Extraction of Blood Vessels in Fundus Images of Retina through Hybrid Segmentation Approach


1
Computer Vision & Soft Computing Laboratory, School of Computing, SASTRA Deemed University, Thanjavur 613 401, India
2
Health, Safety & Environment Group, Indira Gandhi Centre for Atomic Research, Kalpakkam 603 102, India
*
Author to whom correspondence should be addressed.
Mathematics 2019, 7(2), 169; https://0-doi-org.brum.beds.ac.uk/10.3390/math7020169
Submission received: 8 December 2018
/
Revised: 17 January 2019
/
Accepted: 7 February 2019
/
Published: 13 February 2019
(This article belongs to the Special Issue Applications of Mathematics to Engineering and Information Sciences)
Abstract
:A hybrid segmentation algorithm is proposed is this paper to extract the blood vessels from the fundus image of retina. Fundus camera captures the posterior surface of the eye and the captured images are used to diagnose diseases, like Diabetic Retinopathy, Retinoblastoma, Retinal haemorrhage, etc. Segmentation or extraction of blood vessels is highly required, since the analysis of vessels is crucial for diagnosis, treatment planning, and execution of clinical outcomes in the field of ophthalmology. It is derived from the literature review that no unique segmentation algorithm is suitable for images of different eye-related diseases and the degradation of the vessels differ from patient to patient. If the blood vessels are extracted from the fundus images, it will make the diagnosis process easier. Hence, this paper aims to frame a hybrid segmentation algorithm exclusively for the extraction of blood vessels from the fundus image. The proposed algorithm is hybridized with morphological operations, bottom hat transform, multi-scale vessel enhancement (MSVE) algorithm, and image fusion. After execution of the proposed segmentation algorithm, the area-based morphological operator is applied to highlight the blood vessels. To validate the proposed algorithm, the results are compared with the ground truth of the High-Resolution Fundus (HRF) images dataset. Upon comparison, it is inferred that the proposed algorithm segments the blood vessels with more accuracy than the existing algorithms.
1. Introduction
Cataract, uncorrected refractive error, Glaucoma, Age-related macular degeneration, Diabetic Retinopathy, corneal opacity, trachoma, and others are responsible for vision impairment. Among the listed medical conditions, uncorrected refractive error, cataract, and glaucoma are the major cause of blindness. Statistics from the World Health Organization (WHO) states that 81% of the people who are blind are above 50 years of age. It is estimated that the number of people who are blind will increase from 38.5 million in 2020 to 115 million in 2050 [1]. Diabetic retinopathy is a major cause evolving for blindness. WHO report on diabetes states that diabetes will be the seventh major cause of death in 2030. 2.6% of blindness reported is attributed to diabetic retinopathy. The percentage reported may be minuscule, but a report from WHO states that the number of people with diabetes has increased by a factor of 3.5 times i.e., from 118 million in 1980 to 424 million in 2014 [2]. These statistics show that diabetic retinopathy cases will drastically increase in the near future. Because the availability of expert ophthalmologists with specialization in Retinal disorders is not on par with the forecast of the disease, an automated system is required. The availability of sophisticated imaging and computing systems helps in developing a Computer Aided Diagnosis (CAD) system for the faster diagnosis of Diabetic retinopathy. The CAD system assists the experts in diagnosing diabetic retinopathy by extracting different parts of the eye.
Fundus of the eye refers to the posterior surface of the eye, which consists of optic disc, retina, macula, fovea, and posterior pole. The Fundus Camera is used to capture the posterior surface of the eye. It uses monocular indirect ophthalmoscopy principle for acquiring the fundus images. Most pathological changes in the eye happen in the blood vessels, both in the arteries and veins. Many retinal diseases are characterized by the changes in blood vessels. Automatic detection of the optic disc, blood vessel, fovea, and macula are required for diagnosing diabetic retinopathy. Retinal maps are automatically generated through temporal and multimodal image registration. Temporal image registration helps in identifying the spread of the disease. Multimodal image registration aids in the better identification of some lesions. The structure of blood vessels is unique for individuals and it can be used for biometric-based authentication. Manual segmentation of blood vessels is a time-consuming process that involves extensive training and skill sets. The initial step in a CAD system for ophthalmic disorders involves the automatic segmentation of blood vessels and the identification of optic disk. Many algorithms have been proposed by researchers for segmenting the blood vessels, which are discussed in the forthcoming section. This paper proposes a hybrid segmentation approach to extract the blood vessels from the fundus image. Workflow of the proposed methodology is given in Figure 1. The proposed methodology has three phases and these phases are depicted in Figure 2, Figure 3, and Figure 4.
1.1. Related Works
The segmentation and analysis of blood vessels through image processing is required in the diversified fields of medicine. Many researchers have contributed efficient algorithms for extraction and analysis. Some significant contributions in the field of Ophthalmology are given in this section.
Segmentation of blood vessels can be done by two different methods:
- Pixel-based methods and tracing/tracking-based methods. In pixel-based methods, every pixel is processed to reveal whether it is a vessel or background pixel. Pixel-based methods use thresholding, morphological operations, and kernels for filtering and pattern recognition.
- Pattern recognition-based methods use classifiers and clustering algorithms for segmenting blood vessels from the fundus image.
Soares et al. have proposed a supervised classification using two-dimensional (2D) Gabor wavelet [3]. Ricci et al. have used line operators and Support Vector Machine (SVM) for segmenting blood vessels [4]. Moment invariants-based feature and 7D feature based on gray-level were used to train the neural network by Marin et al. [5]. Tolias et al. have proposed a method based on Fuzzy C-means clustering for segmenting the blood vessels [6]. Niemeijer et al. proposed a k-Nearest Neighborhood (kNN) based classifier for segmenting blood vessels [7]. Salem et al. have used a novel algorithm (RACAL), which is a partially supervised algorithm for segmenting the blood vessels [8].
Kernels are filters that are used in images for identifying the pixels of interest. The most common kernels are the edge filters that are used for finding the edges in the images. Prominent kernels used for edge detection are Robert, Sobel, Prewitt and Canny. Apart from this, kernels of specific type can be customized for an application to identify the edges. Chaudhuri et al. have proposed a kernel based matched filtering mechanism for blood vessel segmentation [9]. It uses 12 different templates that were generated by rotating the actual template by 15 degrees. Al-Rawi et al. proposed an improved matched filtering mechanism based on Chaudhuri et al’s matched filtering mechanism [10]. Cinsdikici et al. have proposed an algorithm that uses matched filtering with ant colony optimization [11]. Zhang et al. proposed a modified matched filter, called Matched Filter-First order Derivative of Gaussian (MF-FDOG) [12]. Odstrcilik et al. proposed a novel matched filtering kernel for segmenting blood vessel in fundus image [13].
Thresholding of fundus image is another method that is used for segmenting blood vessels. Thresholding can be global, local, or adaptive. Adaptive thresholding is mostly used for segmentation and it gives better results. Hoover et al. proposed a piecewise threshold probing of the matched filter response for segmenting the blood vessels [14]. Jiang et al. proposed an adaptive thresholding based on multi-threshold probing scheme [15]. Reza et al. proposed automatic tracing algorithm for detecting optic disc and exudates using fixed and variable thresholds [16]. They have also proposed a quadtree based blood vessel detection algorithm using RGB (Red-Blue-Green) color components of fundus images [17].
Morphological operators are quite handy in segmenting the object of interest using mathematical operations. There are many morphological operators that are defined for image processing. The most commonly used morphological operations are dilation, erosion, closing, and opening [18]. These operators are applied mainly to binary images. However, they can also be applied for grayscale images. Zana et al. employed a morphology-based method with cross curvature evaluation for segmenting vasculature from the medical image [19]. Heneghan et al. combined morphological operations with the second order derivative operator to locate both the primary and secondary vessels [20]. Yang et al. employed a combination of fuzzy clustering algorithm and morphological operator [21]. Mehrotra et al. employed a morphological operator for highlighting the blood vessels and then later applied the Kohonen Clustering Network to segment the blood vessels [22]. Miri et al. used Forward Discrete Cosine Transform (FDCT) for image contrast enhancement followed by morphological operations for extracting the blood vessels [23]. Bharkad used top hat, a morphological operator with three different structuring elements [24]. Yavuz et al. enhanced the retinal image using Gabor, Frangi, and Gaussian filters, followed by the use of top hat transform and clustering mechanism for segmenting the blood vessels [25].
Employing the tracking or tracing based method, retinal vasculature can be segmented. Most tracking algorithms need a seed point to trace the vasculature. The success of the algorithm depends on the seed point. Gao et al. modelled the gray level distribution using the Gaussian function [26]. Using this, the vessels are tracked to segment the blood vessels. Liu et al. employed an adaptive tracking algorithm in a three-stage recursive procedure [27]. Delibasis et al. proposed a tracking algorithm that uses the geometric model and automatically seeks vessel bifurcation without user intervention [28]. Vlachos et al. employed a procedure that starts with a small group of pixels that are based on the brightness rule and stops when the cross-sectional profile becomes invalid [29]. Sheng et al. have proposed the Minimum Spanning Superpixel Tree (MSST) detector for segmenting retinal blood vessels [30]. MSST uses geometrical structures, texture, and space information in superpixel graph.
Deformable models are also used for segmenting vasculature. Espona et al. have used an active contour that incorporates blood vessel topological properties [31]. Al-Diri et al. proposed a contour-based model that uses two pairs of active contour model for segmenting blood vessels [32]. In this method, the generalized morphological order operator is used to identify approximate center lines of the vessel. Palomera-Pérez et al. proposed a parallel implementation based on multiscale feature extraction and the region growing algorithm [33]. Zhao et al. proposed a segmentation process based on level set and region growing method [34]. Initially, adaptive histogram equalization and Gabor wavelet transform are used for enhancing the blood vessels. After preprocessing, the level set and region growing methods are applied independently and post-processing is done to obtain the final result. Instead of active contour, the graph cut technique with Markov Random field was used by Salazar et al. for segmenting blood vessels and optic disk [35]. Zhao et al. have proposed an infinite active contour model that uses the Lebesgue measure of the γ-neighbourhood for infinite perimeter regularization [36]. This method also adopts the advantage of region information, such as the combination of intensity information and local phase-based enhancement map. Gao et al. proposed an automated segmentation approach for extracting the retinal vessels using U-shaped fully convolutional neural network, called the U-net. The authors have used Gaussian matched filter for preprocessing the retinal fundus images [37]. Li et al. framed a supervised vascular segmentation approach for retinal fundus images using multi-scale convolutional neural networks. They have also used the label processing approach to achieve better segmentation accuracy [38]. Dasgupta et al. formulated the retinal vessels segmentation task as a multi-label inference task, which includes the convolutional neural network and structured prediction [39].
From the literature survey, it is found that pattern- and morphology-based methods are predominantly used for segmenting blood vessels. Pattern-based methods consume more time for classifying the blood vessels. Morphology-based methods are easier to compute, but they require other filters to achieve high accuracy while segmenting blood vessels. These filters are dependent on the type of morphological operator used. Hence, an attempt is made to develop a hybrid segmentation approach using morphological operators, MSVE, and image fusion.
1.2. Datasets
There are different databases that are available for the fundus image of the eye. The most commonly used datasets are DRIVE and STARE. These two datasets have low-resolution images with no proper tagging for diabetic retinopathy, glaucoma, and healthy eye image. High-Resolution Fundus image (HRF) dataset gives a good collection of images in all of these categories [13]. High-resolution image in the HRF dataset enables a better understanding of the image for the segmentation process. The dataset has a total of 45 images with a resolution of 3504x2336. Ground truth for the 45 images is also available in the dataset. This dataset is chosen because of the quality of the image and proper categorization. The DRIVE [40] and CHASE [41] datasets are used to check the effectiveness of the proposed algorithm.
2. Materials and Methods
The proposed approach for blood vessel segmentation is framed using image enhancement techniques, morphological operations, adaptive thresholding, color code transformation, and image fusion. It also includes an algorithm proposed by Frangi et al., which enhances the image and helps in identifying the tubular structure of the blood vessels [42]. These algorithms are explained in this section.
2.1. Image Enhancement
2.1.1. Contrast Stretching
Contrast stretching is one of the image enhancement techniques, where the quality of the images improved by the even distribution of intensity values [43]. Original fundus image of RGB (Red-Green-Blue) code is given as input. In contrast stretching process, intensities of the pixels are scaled to global maximum and global minimum such that contrast of the image is distributed uniformly. Contrast stretching is achieved through Equation (1).
where a = 0, b = 255, and c and d are non-zero minimum and maximum intensity values of the input image. Initially, the stretching process is implemented for single band (R/G/B) image with size m x n. Subsequently, the procedure is repeated for rest of the two bands and final image is generated with the enhanced individual bands of the original image.
Normalized_pixel = (input_pixel − c)((b − a)/(d − c)) + a
2.1.2. Multi-Scale Vessel Enhancement (MSVE)
The geometric structure in the image can be captured using the Hessian matrix. To interpret the Hessian matrix, properties can be extracted from it. Determinant is one such property of the matrix that can be used to understand the matrix. It is found that the determinant of the Hessian matrix cannot help in inferring the geometric structure that is inherently held in the Hessian matrix. Additional information is required to extract the inherent geometric information. Similar to the determinant, the Eigen values of a matrix also help in inferring the hidden information in the matrix. Hence, the Eigen values of the Hessian matrix are found, which helps in inferring the geometric information that is held inherently in the Hessian matrix. Based on the following conditions, the geometric information inherently present in the Hessian matrix can be understood.
- If , then the surface is concave down
- If or if , then the concavity of the surface is inconsistent
- If , then the surface is concave up
- If , then no conclusion can be drawn
This is used to define a parameter called vesselness, which can be used to identify the blood vessels in the image. Vesselness is calculated using Equation (2). Once the vessels are identified, it can be enhanced, which aids in proper segmentation of blood vessels. Frangi et al. proposed this method of Vessel enhancement [42].
where , which controls the sensitivity of the line filter, s is scale value within certain range, depends on the grayscale range, is the blobness measure in two-dimensions (2D) and accounts for the eccentricity of the second order ellipse. are the Eigen values of the Hessian matrix given in Equation (3):
In this research work, this algorithm is used for enhancing the blood vessels of the fundus image of the eye.
2.2. Morphological Image Processing
2.2.1. Bottom Hat Transform
The bottom-hat transform is defined as the difference between the closing of the original image and the original image. The closing of an image is the collection of background parts of an image that fit a particular structuring element.
| Procedure: Bottom hat transform |
| Input: Original image (A) of size m × n, structuring element (S) of size s × s |
| Output: Transformed image |
| Step 1: Read the input image A of size m × n |
| Step 2: Initialize the structuring element S which is a square matrix with all zeros or ones |
| Step 3: Morphological closing is applied to the original image with the structuring element created in step 2 |
| closingImage := A . S; |
| where (.) operation is the combination of dilation and erosion i.e., , |
| denotes dilation and denoted erosion. |
| Step 4: Apply bottom hat filter by subtracting the original image from the closingImage |
| bottomHat := closingImage – A; |
| Step 5: Transformed image is displayed |
2.2.2. Area Based Filtering
In this process [44], the area of all non-zero pixels in an image is estimated by accumulating the areas of each pixel in the image. Area of each pixel is found by examining the two-by-two neighbourhood. Based on the following six different patterns, each area is represented:
- if the pattern is with NO non-zero pixels, then area = 0;
- if the pattern is with ONE non-zero pixel, then area = 1/4;
- if the pattern is with TWO adjacent non-zero pixels, then area = 1/2;
- if the pattern is with TWO diagonal non-zero pixels, then area = 3/4;
- if the pattern is with THREE non-zero pixels, then area = 7/8; and,
- if the pattern is with all FOUR non-zero pixels, then area = 1.
The fundus image of the eye is given as input for this process and based on the rules discussed, the area of each region is estimated. The regions of the image above the threshold 60 are selected for further process. The threshold value is fixed experimentally.
2.3. Binarization Using Adaptive Thresholding
Thresholding is the process to separate the foreground and background pixels by using a threshold value [43]. All of the pixel intensities above the threshold are set to 1 and pixel intensities below the threshold are set to 0. Conventionally, threshold value is fixed globally for all the intensities. Adaptive thresholding is a process that accepts a grayscale or color image as input and then outputs a binary image. Unlike conventional thresholding, the threshold value is calculated for each pixel. Pixel intensity value is set to 0 or 1 based on the calculated threshold.
In adaptive thresholding, the local threshold value is calculated by examining the intensity values of local neighborhood of each pixel, as shown in the Figure 5.
The mean value of the neighbourhood pixels is taken as the local threshold of the pixel x(i,j). Instead of mean statistic, the median value can also be used as local threshold. However, when using median as a local threshold, the computation will be slow. Hence, in this research work, the mean statistic is used as local threshold to binarize the image.
2.4. Fusion
It is possible to generate a single image, which holds the details of both the image, when two images with different details are available. This can be done through fusion process. In this work, fusion is achieved by overlaying an image on the other image. This ensures that the details of both the images are preserved and exhibited by the new image achieved through fusion.
3. Proposed Methodology
This section presents the proposed hybrid segmentation approach for extracting blood vessels from the fundus image of the eye. This method is hybridised using the methods that are discussed in Section 2, such that it can segment the blood vessels from the fundus image of retina. The existing vessel enhancement algorithm [42] is hybridized with pre-processing and post-processing approaches to achieve the better segmentation of blood vessels. As a significant contribution, mask generation is proposed in this hybrid segmentation approach that helps in achieving the accurate segmentation of vessel like structures. The work flow of the proposed methodology is given in Figure 1.
Hybrid Segmentation Approach
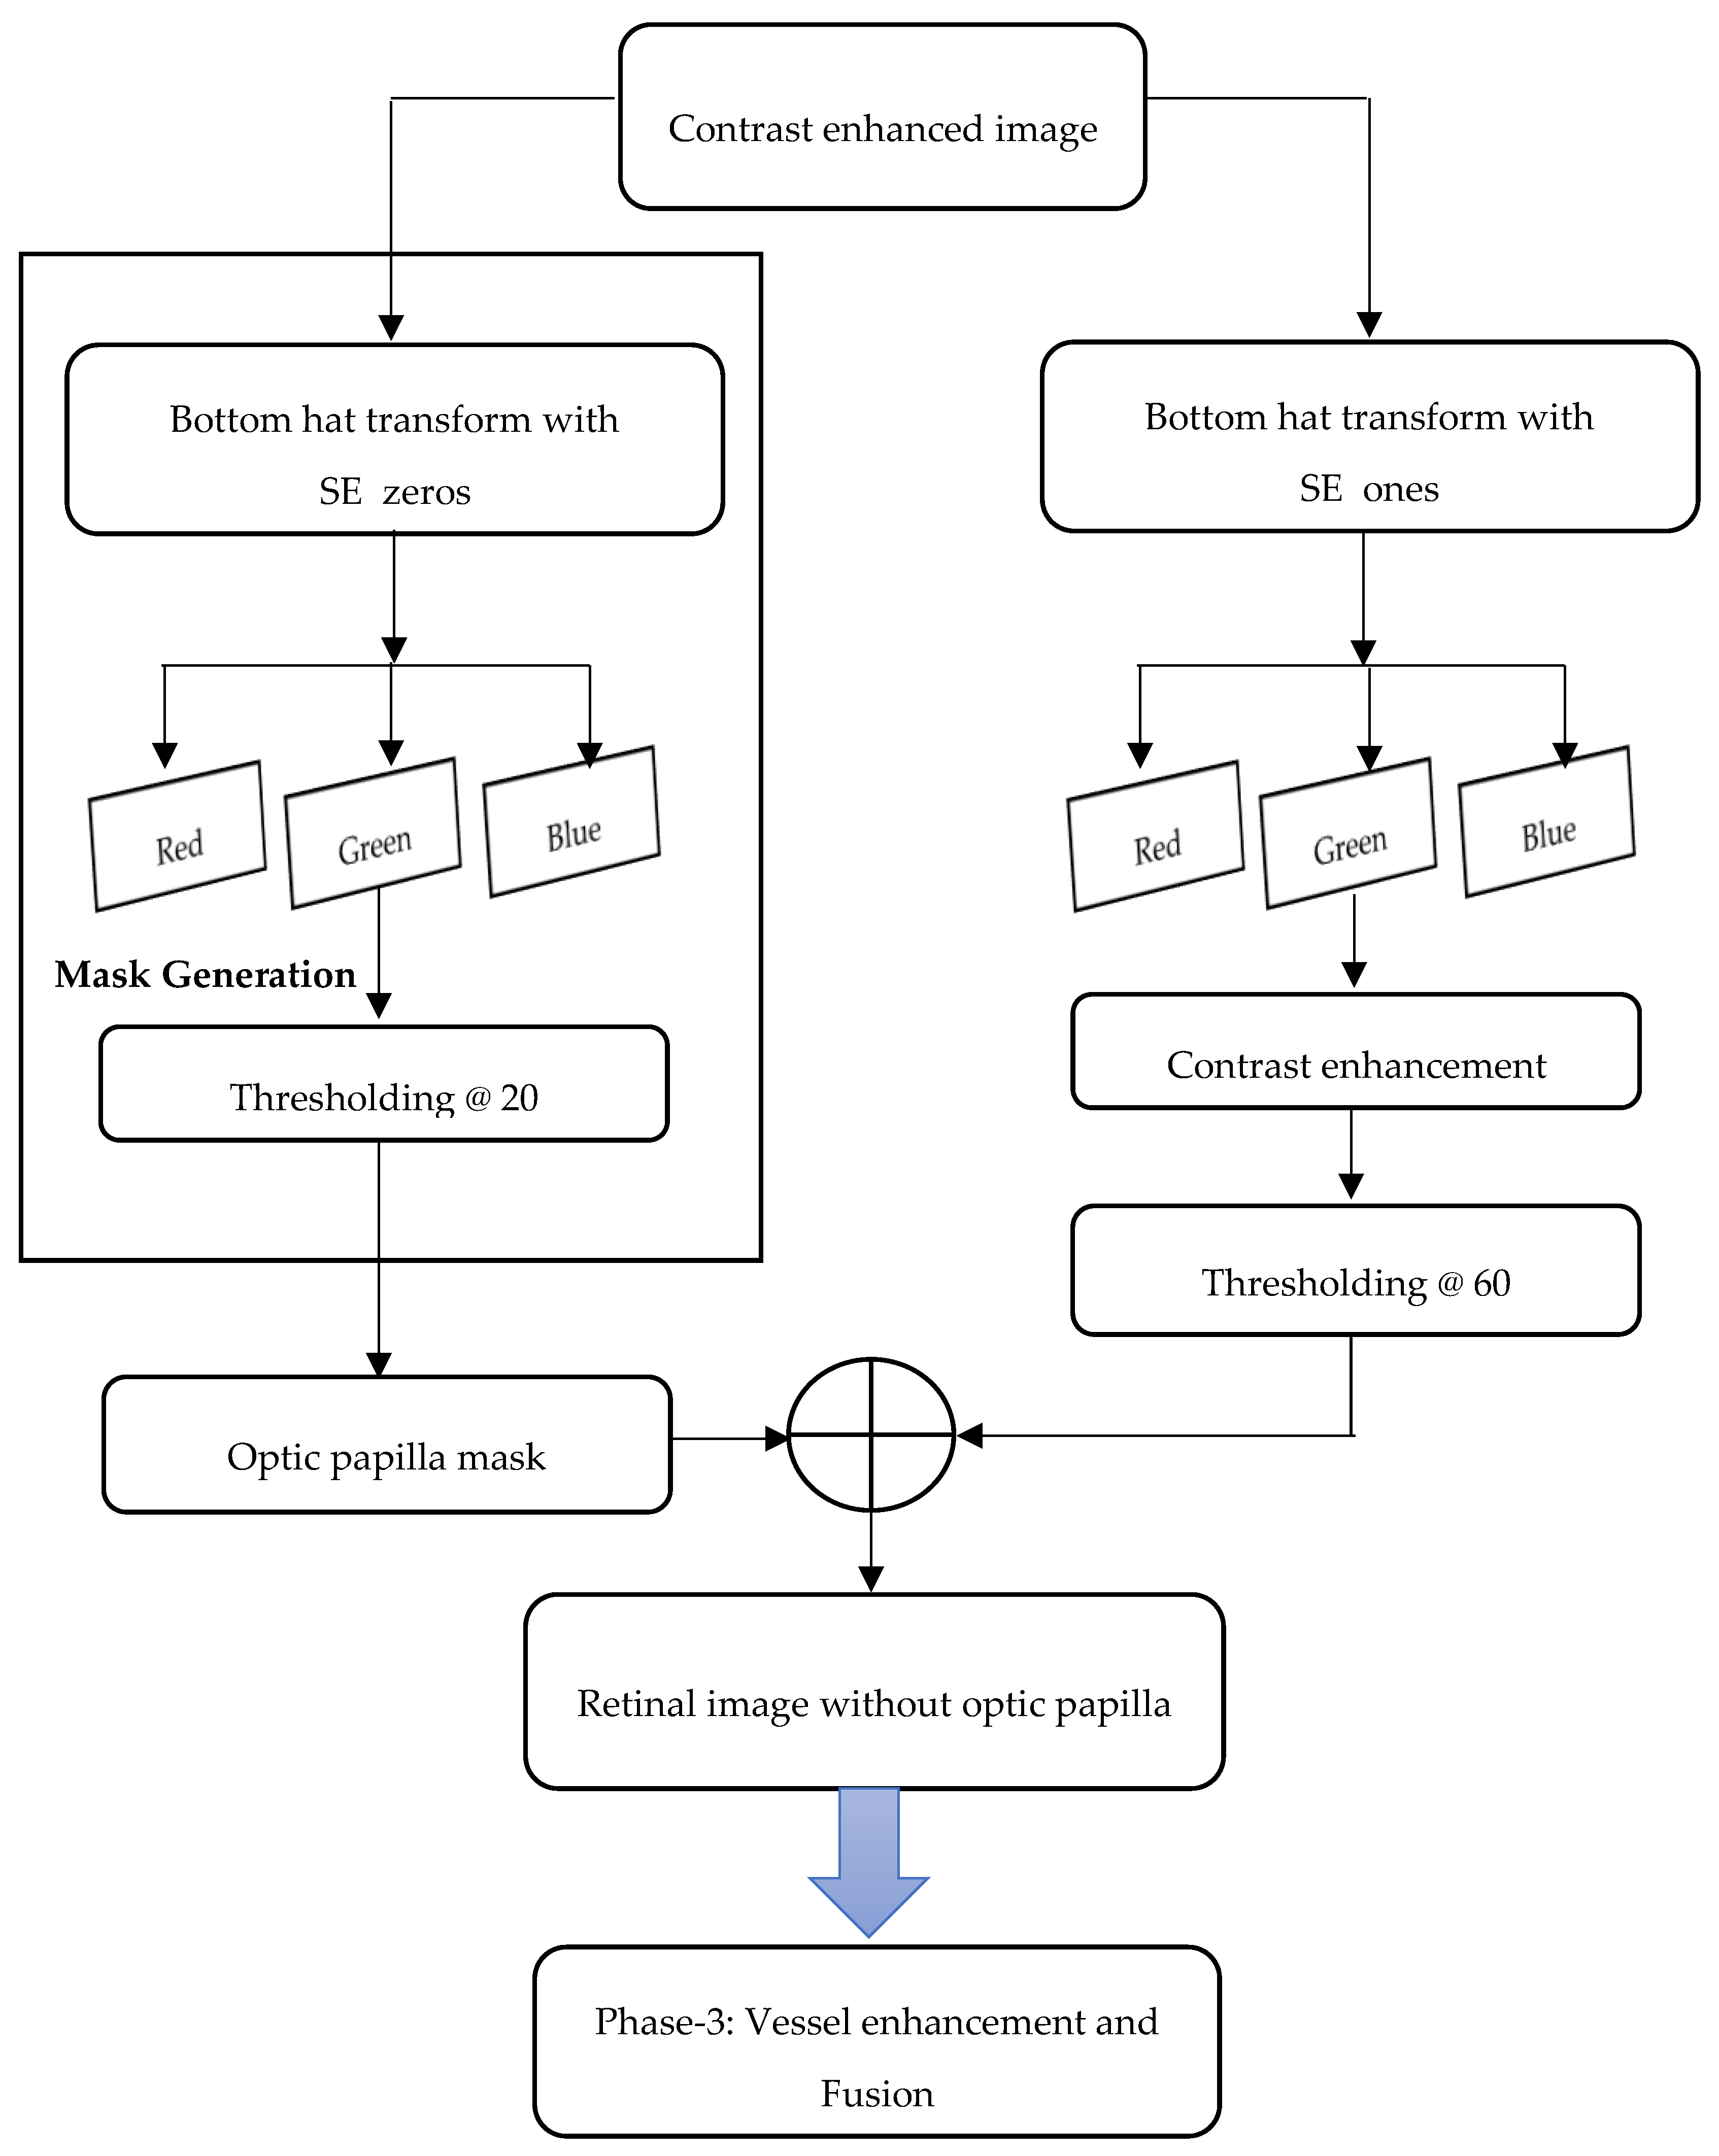
The proposed hybrid segmentation approach has three phases, (1) image acquisition and preprocessing, (2) Mask generation for optic papilla removal, and (3) vessel enhancement and fusion. Figure 2, Figure 3, and Figure 4 depict the flow of these three phases. Following is the proposed blood vessels segmentation procedure:
| Procedure: Proposed blood vessel segmentation |
| Input: RGB fundus image (I) of size m × n |
| Output: Segmented image with blood vessels (segmentedImage) |
| Phase 1: IMAGE ACQUISITION & PREPROCESSING |
| Step 1: Read input image I of size m × n |
| Step 2: Enhance the contrast of the input image I |
| Phase 2: MASK GENERATION FOR OPTIC PAPILLA REMOVAL |
| Step 3: Generate structuring element s1_Zeros of size (25 × 25) with all zeros |
| Step 4: Apply Bottom Hat transform to I with s1_Zeros as structuring element |
| Step 5: Assign the red and blue channel of bottomHatZeros to zero |
| Step 6: Threshold the green channel (greenBottomHatZeros) with the value of 20 to generate the mask (Threshold values used in this procedure are selected by maximizing the average sensitivity and specificity of the segmentation results of different datasets. As there is wide difference between the number of true positive and false positive pixels, accuracy constraint is not considered for parameter optimization. Hence, the focus is on sensitivity and specificity.) |
| Step 7: Generate another structuring element s2_Ones of size (25 × 25) with all ones |
| Step 8: Apply Bottom Hat transform to I with s2_Ones as structuring element |
| Step 9: Assign the red and blue channel of bottomHatOnes to zero |
| Step 10: Enhance the contrast of green channel of bottomHatOnes |
| Step 11: Remove the pixels below intensity value of 60 in greenBottomHatOnes |
| Step 12: Initialize a new matrix (newGreenImage) with zeros of size of the image (m × n) |
| Step 13: Apply the mask greenBottomHatZeros to greenBottomHatOnes and the resultant image is stored in newGreenImage |
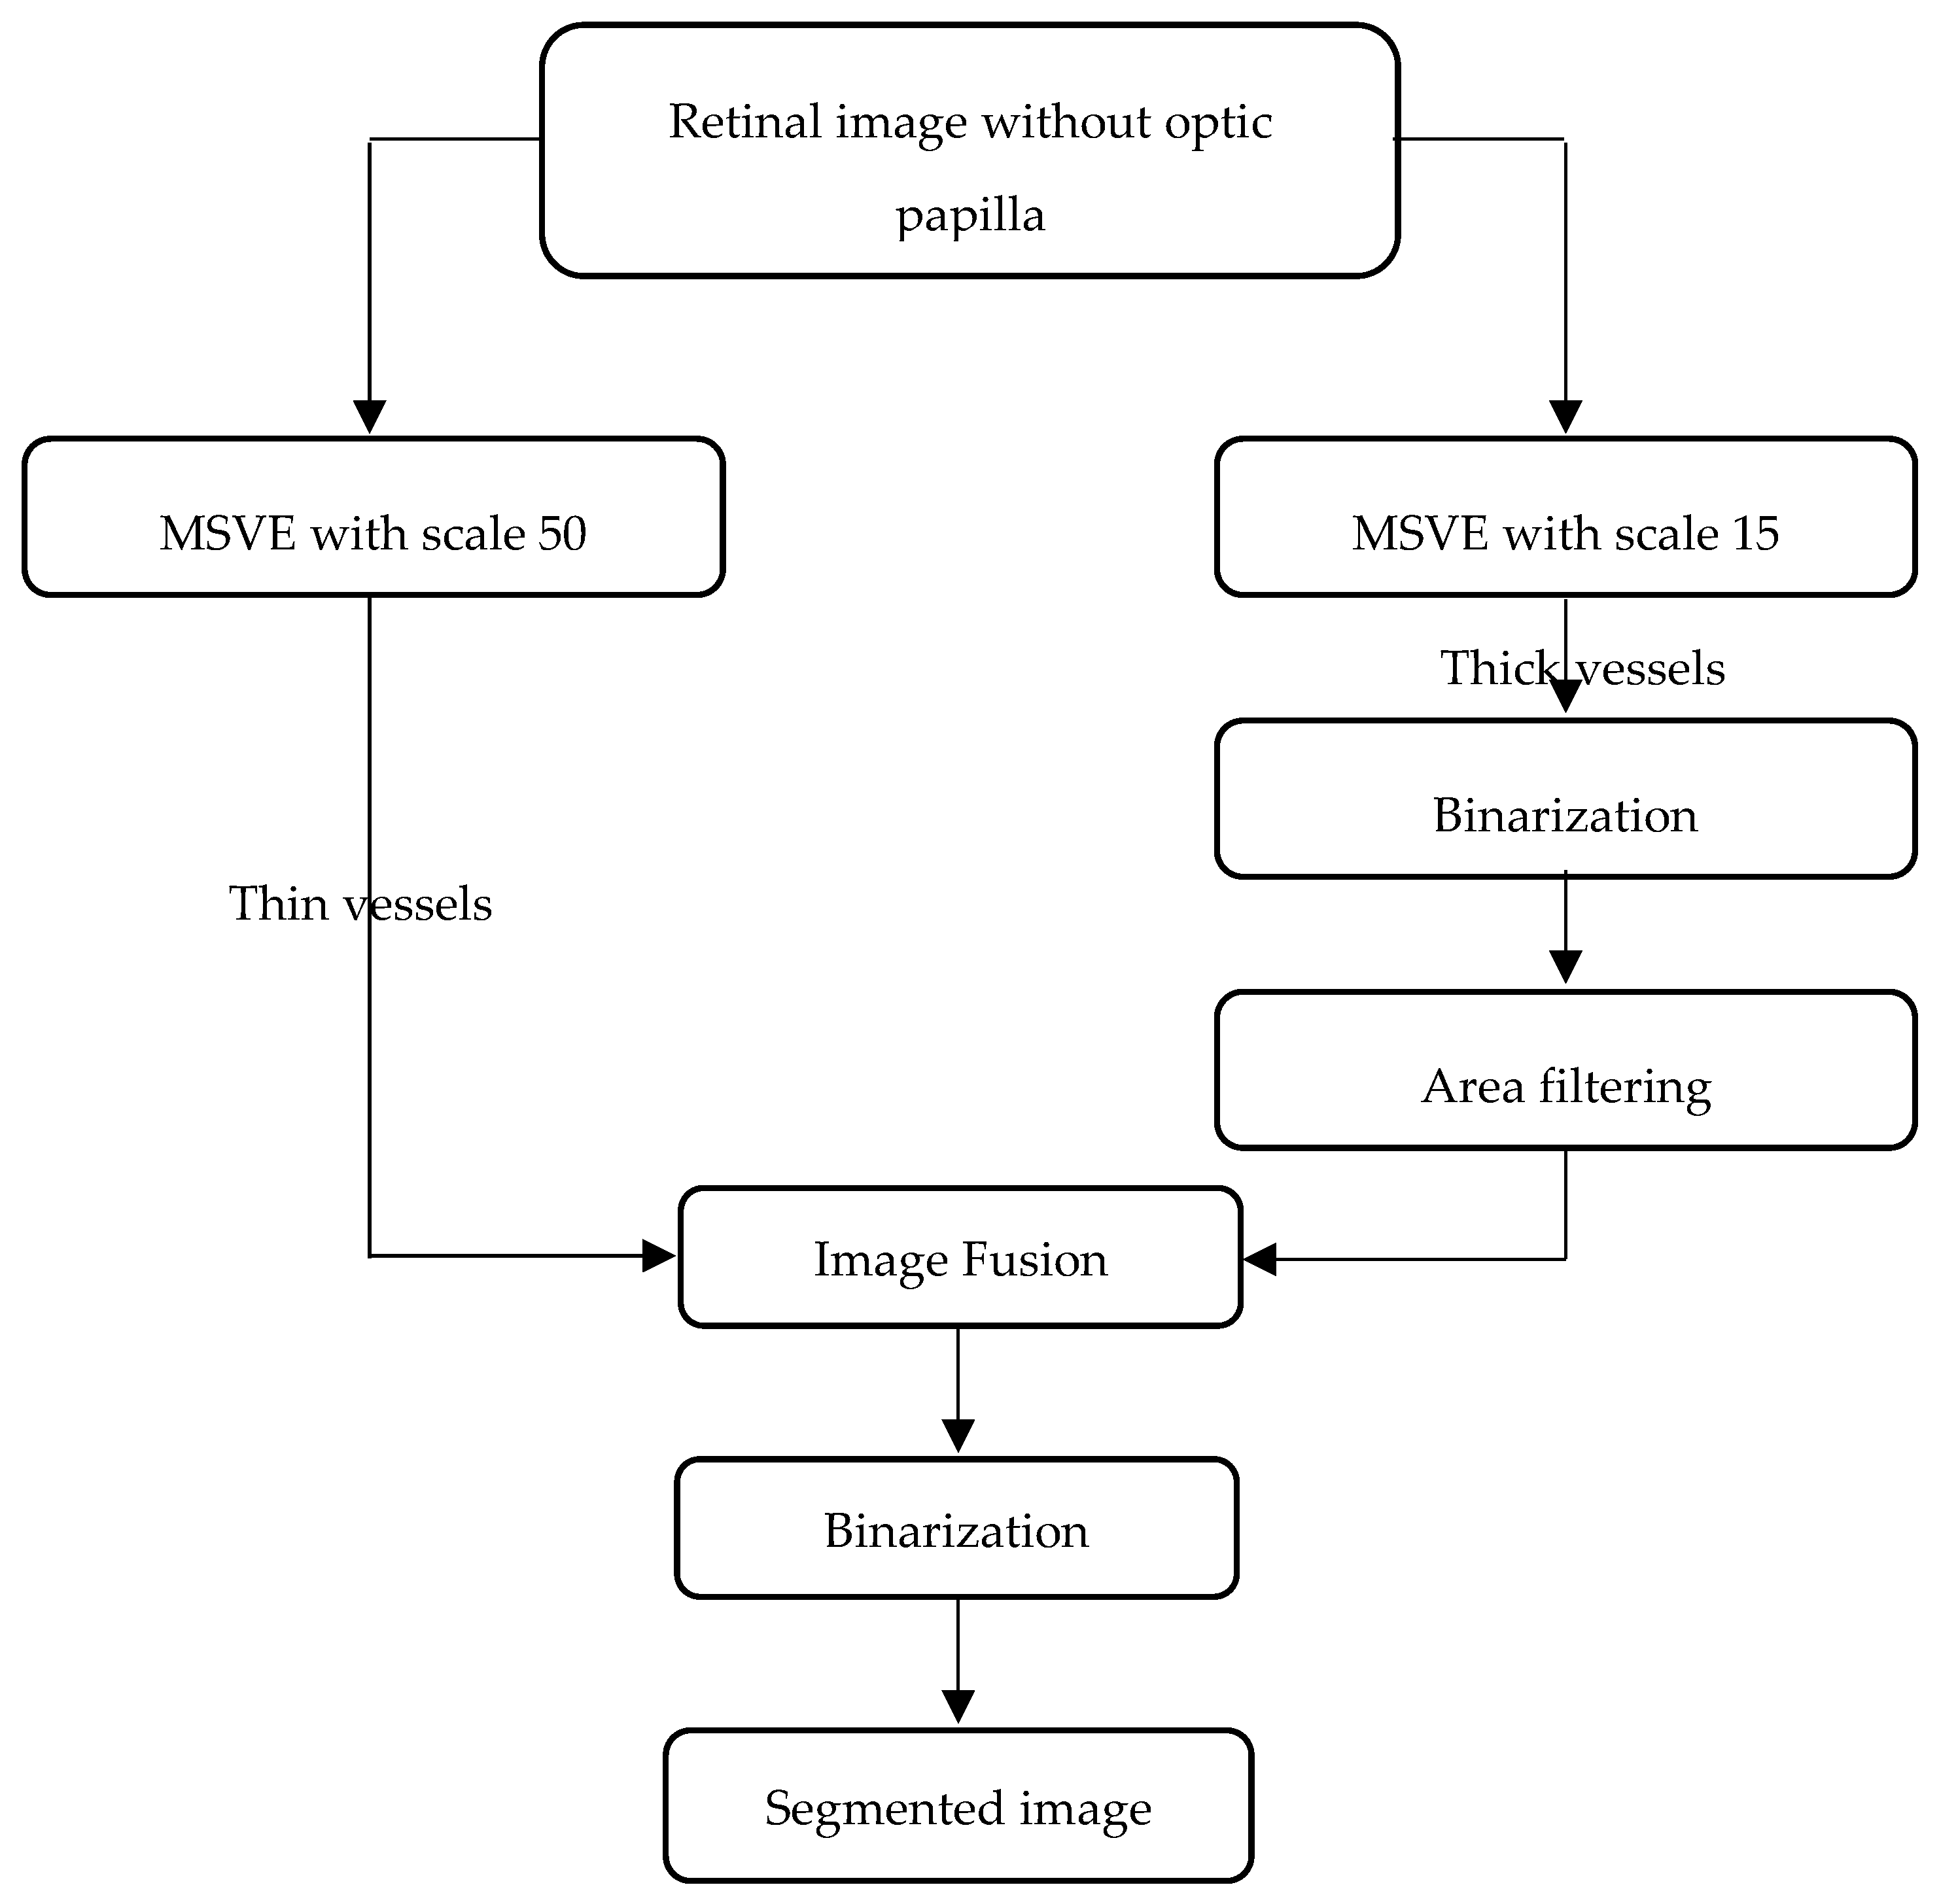
| Phase 3: VESSEL ENHANCEMENT & FUSION |
| Step 14: Apply multi-scale vessel enhancement algorithm to newGreenImage with scale values of 50 (enhancedVessel1) and 15(enhancedVessel2) |
| Step 15: Binarize the enhancedVessel2 image using adaptive thresholding |
| Step 16: Filter the closed area of the binarized EnhancedVessel2 using morphological operations |
| Step 17: Fuse the enhancedVessel1 and area filtered, binarized EnhancedVessel2 |
| Step 18: Convert the fused image into binary image and display the resultant segmented image |
- (1)
- (2)
- When a smaller scale value is used to extract the blood vessels, it also segments vessel-like structures. To avoid this, area filtering can be applied at threshold of 65, which is fixed experimentally. Area filtering is a morphological operation that can be used only in bi-level images. Accordingly, the binarization process is done before area filtering is applied on the image with thinner vessels obtained after MSVE with smaller scale.
- (3)
- Fusion of MSVE images
- When MSVE is applied with a scale value of 15, only the boundary of the thick vessels are found. The pixels inside the major vessels are also part of the thick vessels, so they also should be white in color. To ensure that the inner pixels of the thick vessels are white in color, we can use filling algorithms. However, there is a possibility that, due to a discontinuity in boundary, it cannot be filled properly. Hence, the fusion of MSVE applied images with different scale values can avoid the tracing of the vessel path to fill the gaps in the boundary.
- Accordingly, the MSVE algorithm is used with a larger scale value, which ensures that the inner regions have white color, but it misses the thinner vessels. To overcome this problem, MSVE is applied with scales of 50 and 15, which, when fused, provides an accurate result.
Pseudocode for the proposed hybrid segmentation approach is given as follows:
| /* Phase 1: Image acquisition and Preprocessing */ |
| I := readImage(); |
| globalMin := 0; |
| globalMax := 255; // it is the maximum gray level of the image |
| localMin := minimum(I(x,y)); // minimum non-zero intensity value of the taken image |
| localMax := maximum(I(x,y)); // maximum intensity value of the taken image |
| for x := 0 to m |
| for y := 0 to n |
| I(x,y) := ((I(x,y)-localMin)* ((globalMax-globalMin))/((localMax-localMin))) + globalMin; |
| y := y + 1; |
| end |
| x := x + 1; |
| end |
| /* Phase 2: Mask Generation and Optic papilla removal */ |
| s1_Zeros := zeros(25,25); |
| bottomHatZeros := (I . s1_Zeros) – I; |
| bottomHatZeros(:,:,1) := 0; // red channel |
| bottomHatZeros(:,:,3) := 0; // blue channel |
| greenBottomHatZeros := bottomHatZeros(:,:,2); // green channel |
| for i := 0 : m |
| for j := 0 : n |
| if (greenBottomHatZeros(i,j) < 20) then |
| greenBottomHatZeros (i,j) := 0; |
| else |
| greenBottomHatZeros (i,j) := 255; |
| end if |
| j := j + 1; |
| end |
| i := i + 1; |
| end |
| s2_Ones := ones(25,25); |
| bottomHatOnes := (I . s2_Ones) – I; |
| bottomHatOnes(:,:,1) := 0; // red channel |
| bottomHatOnes(:,:,3) := 0; // blue channel |
| greenBottomHatOnes := bottomHatOnes(:,:,2); // green channel |
| for i := 0 : m |
| for j := 0 : n |
| if (greenBottomHatOnes(i,j) < 60) |
| greenBottomHatOnes(i,j) := 0; |
| end if |
| j := j + 1; |
| end |
| i := i + 1; |
| end |
| greenBottomHatOnes := contrastEnhance(greenBottomHatOnes); |
| newGreenImage := zeros (m, n); |
| for i := 0 : m |
| for j := 0 : n |
| if (greenBottomHatZeros(i,j) == 255) |
| newGreenImage (i,j) := greenBottomHatOnes(i,j); |
| end if |
| j := j + 1; |
| end |
| i := i + 1; |
| end |
| /* Phase 3: Vessel Enhancement & Fusion */ |
| enhancedVessel1 := MSVE (newGreenImage, 50); |
| enhancedVessel2 := MSVE (newGreenImage, 15); |
| binaryEnhancedVessel2 := binarize(enhancedVessel2); |
| areaOfbinaryEnhancedVessel2 := areaFiltering(binaryEnhancedVessel2,65); |
| fusedImg := imgFuse(enhancedVessel1,areaOfbinaryEnhancedVessel2); |
| segmentedImage := binarize(fusedImg); |
| display (segmentedImage); |
The proposed segmentation algorithm is implemented and tested with the HRF dataset [13], DRIVE [40], and ChaseDB [41]. The results of the implementation are shown in Figure 7, Figure 8 and Figure 9.
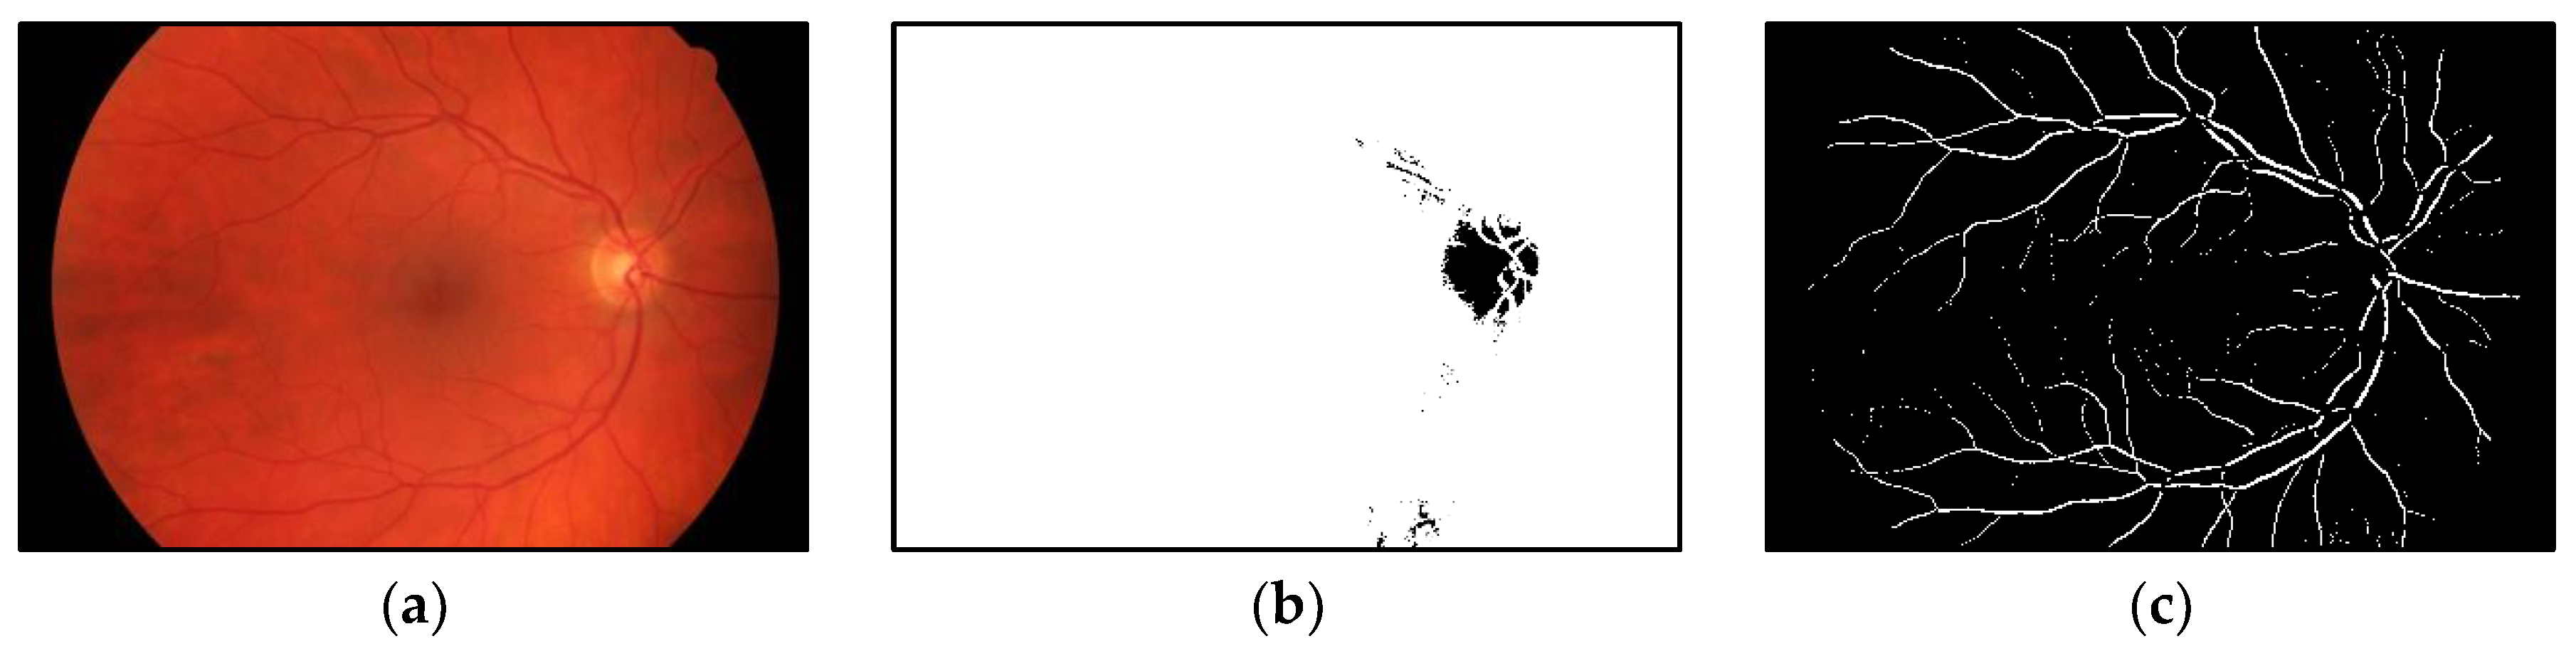
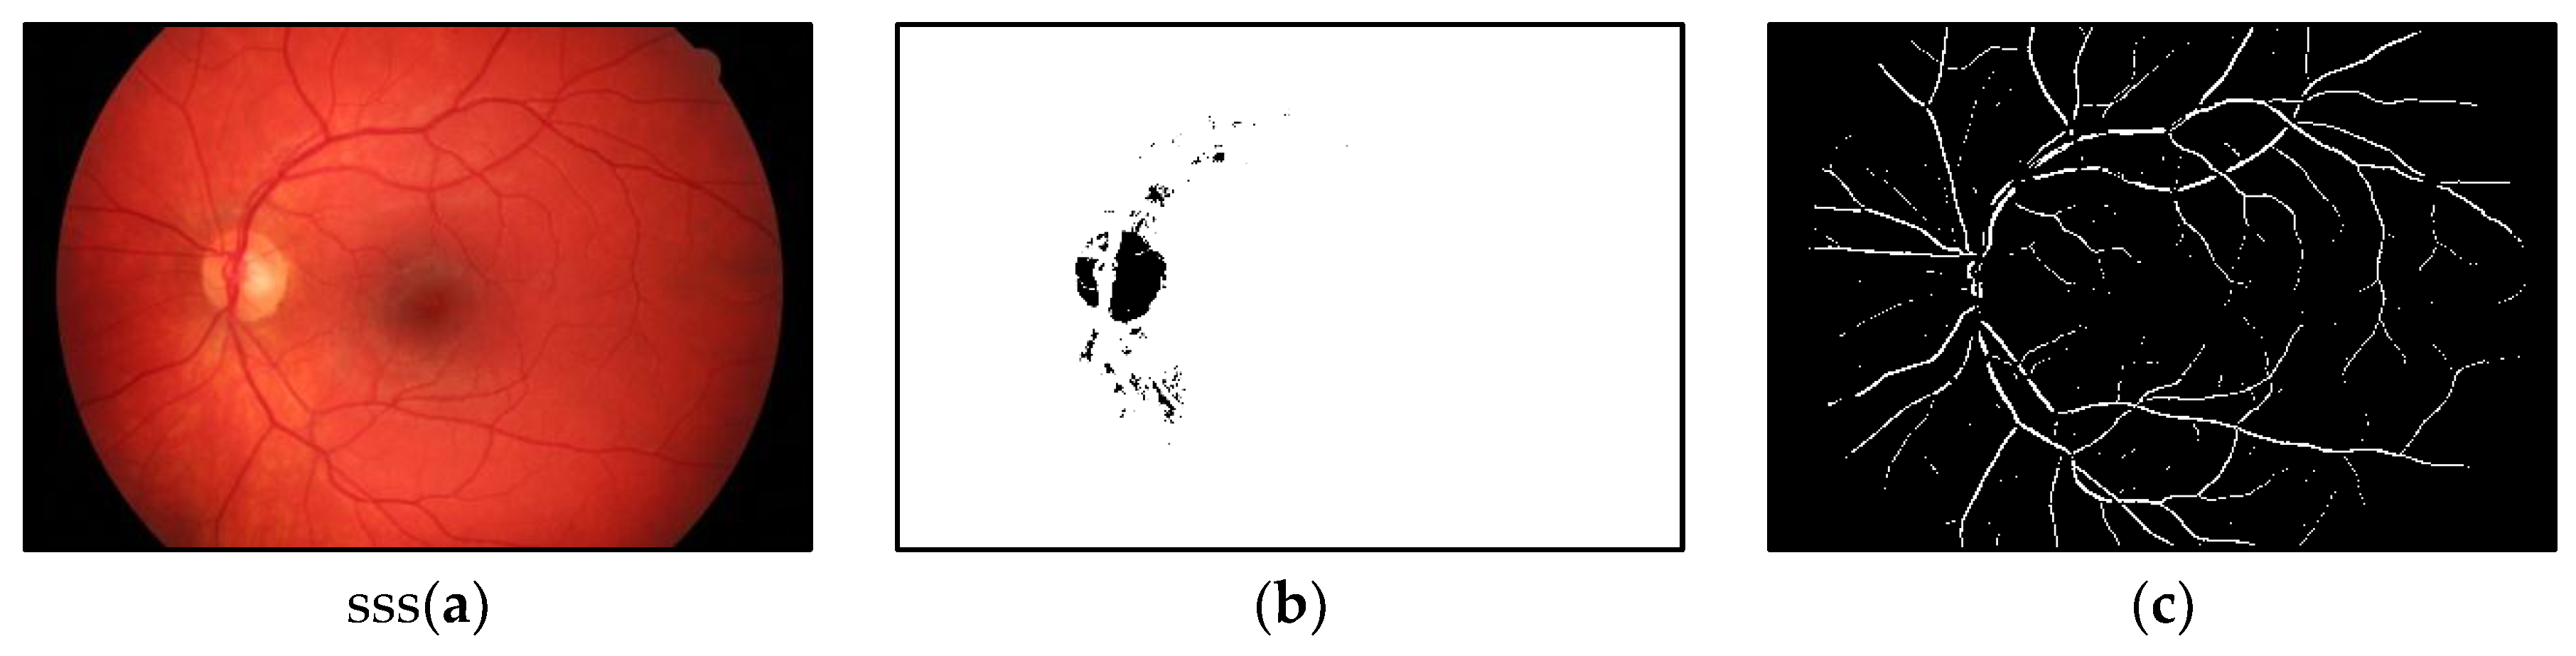
Figure 7a, Figure 8a, and Figure 9a are the fundus images of glaucoma, diabetic retinopathy, and healthy eye, respectively. Figure 7b, Figure 8b, and Figure 9b are the mask generated by the above said procedure for accurate segmentation. Figure 7c, Figure 8c, and Figure 9c are the images of segmented blood vessels that were obtained using the proposed method. The proposed algorithm is evaluated using the metrics: Sensitivity, Specificity, and Accuracy, with respect to the gold standard.
4. Results and Discussion
The proposed method has been tested on HRF, DRIVE, and CHASE databases, which provide ground truth data. The effectiveness of the proposed segmentation algorithm is measured using the parameters Sensitivity (SE), Specificity (SP), and Accuracy (ACC), derived from the contingency table (Table 1).
Sensitivity (SE) measures the proportions of positives, both True Positives (TP) and False Negatives (FN), which are correctly identified. Specificity (SP) measures the proportions of negatives, both True Negatives (TN) and False Positives (FP). Accuracy (ACC) is the proportion of true results, both True Positives (TP) and True Negatives (TN), among the total number of examined pixels. These measures are calculated using Equations (4) to (6).
Segmentation process may result in under segmentation, over segmentation, or accurate segmentation.
- When sensitivity is low and specificity is high, the vessels are under segmented i.e., the vessels are not properly identified.
- When sensitivity is high, and specificity is low, the vessels are over segmented i.e., Non-vessel regions are also identified as vessels
- When both the sensitivity and specificity are high, the vessels are segmented properly
Theoretically, the values of sensitivity and specificity are preferred to be 100%. If the sensitivity and specificity of the segmentation process is close to 100%, it is a better algorithm. Sensitivity and specificity quantify the ability of the method to detect blood vessels (foreground) and background, respectively. Accuracy gives the overall measure of the segmentation done by the proposed method against the ground truth data. The average of SE, SP, and ACC are compared with the results of Odstrcilik et al. [13]. The results are tabulated in Table 2.
To check the effectiveness of the proposed algorithm, it is tested with the DRIVE and CHASE datasets. The results are tabulated in Table 3.
- For the HRF image dataset, the proposed segmentation approach outperforms the state-of-the-art technique and it is tabulated in Table 2.
- ○
- Diabetic retinopathy images normally have more artefacts. Accordingly, it becomes difficult to identify the blood vessel from fundus image.
- ○
- There is a marginal increase in the sensitivity for Diabetic retinopathy images and glaucoma images.
- ○
- Change in the Healthy image is high.
- For images in DRIVE dataset, the proposed approach underperforms, because:
- ○
- the resolution of the image is very less when compared to the images in HRF dataset;
- ○
- varying aspect ratio of the image; and,
- ○
- the dataset has two manually segmented ground truth data for each image and the average values are presented in Table 3. For both the manually segmented ground truth data, fixed threshold values are used.
- For the CHASE dataset, the proposed segmentation algorithm underperforms in terms of sensitivity; consistent in the terms of specificity; and, outperforms in terms of accuracy.
- In the research work of Zhang et al., the authors have used different threshold values for different datasets [42]. The proposed segmentation approach uses fixed threshold value for different datasets.
When the proposed algorithm is implemented, the varying aspect ratio and low-resolution are the limitations found in the images of DRIVE dataset. Additionally, these limitations affect the precise segmentation in the case of DRIVE dataset. Sensitivity value of diabetic retinopathy images of the HRF dataset is highly affected by the artefacts (i.e.,) high red component. The removal of the red component can remove the artefacts, but unfortunately some pixels in the blood vessels are also lost in this process. To improve the performance for diabetic retinopathy images, it is imperative to remove the artefacts without losing the pixels in the blood vessels. The generation of the mask must be enhanced, which can be used for removing the artefacts without compromising on the pixels of blood vessels.
5. Conclusions
A hybrid segmentation approach with a novel mask generation scheme is proposed to extract the retinal vasculature from the fundus images of eye. The proposed method is evaluated on HRF, CHASE, and DRIVE datasets, and the results are compared with the existing results of the same database and with existing state of the art methods. The proposed approach outperforms the existing methods for the high-resolution fundus images of retina (HRF dataset); achieves better accuracy for images in the CHASE dataset; and, underperforms for the images in the DRIVE dataset. A huge drop in sensitivity is recorded when the proposed algorithm is tested with the DRIVE database. It is because of the low-resolution images and varying aspect ratio when compared to the HRF dataset. The existing vessel enhancement algorithm is hybridized with pre-processing and post-processing approaches to achieve precise and fully automated segmentation. In the proposed segmentation approach, a mask is generated to remove the artefacts in the fundus image of retina. A global threshold value is fixed on an experimental basis, such that the algorithm can be used to segment the vessel structures from the fundus image of any dataset. Additionally, the proposed segmentation approach is tested with the real time data acquired from Sankara Nethralaya, Chennai and the results are found to be promising. Efficacy of the proposed algorithm found to be better in terms of the classification parameters. Further, the algorithm can be enhanced or added with artefacts removal approaches that lead to better segmentation of retinal structures.
Author Contributions
R.S., R.K.S., and P.J. conceived and designed experiments. R.S., and P.J. conducted experiments. R.K.S., and V.B. evaluated and validated the algorithms. The manuscript was prepared by R.S., R.K.S., P.J., and V.B.
Funding
We, the authors would like to thank the Department of Science and Technology, India for their financial support through Fund for Improvement of S&T Infrastructure (FIST) programme (SR/FST/ETI-349/2013).
Acknowledgments
We sincerely thank the SASTRA Deemed-to-be University for providing an excellent infrastructure to carry out the research work.
Conflicts of Interest
The authors declare no conflict of interest.
References
- Blindness and Vision Impairment. Available online: http://www.who.int/mediacentre/factsheets/fs282/en/ (accessed on 18 October 2018).
- Diabetes. Available online: http://www.who.int/mediacentre/factsheets/fs312/en/ (accessed on 15 November 2018).
- Soares, J.V.; Leandro, J.J.; Cesar, R.M.; Jelinek, H.F.; Cree, M.J. Retinal vessel segmentation using the 2-D Gabor wavelet and, supervised classification. IEEE Trans. Med. Imaging 2002, 25, 1214–1222. [Google Scholar] [CrossRef]
- Ricci, E.; Perfetti, R. Retinal blood vessel segmentation using line operators and support vector classification. IEEE Trans. Med. Imaging 2007, 26, 357–1365. [Google Scholar] [CrossRef] [PubMed]
- Marín, D.; Aquino, A.; Gegúndez-Arias, M.E.; Bravo, J.M. A new supervised method for blood vessel segmentation in retinal images by using gray-level and moment invariants-based features. IEEE Trans. Med. Imaging 2011, 30, 146–158. [Google Scholar] [CrossRef] [PubMed]
- Tolias, Y.A.; Panas, S.M. A fuzzy vessel tracking algorithm for retinal images based on fuzzy clustering. IEEE Trans. Med. Imaging 1998, 17, 263–273. [Google Scholar] [CrossRef] [PubMed]
- Niemeijer, M.; Staal, J.; van Ginneken, B.; Loog, M.; Abramoff, M.D. Comparative study of retinal vessel segmentation methods on a new publicly available database. JMI 2004, 5370, 648–656. [Google Scholar]
- Salem, S.A.; Salem, N.M.; Nandi, A.K. Segmentation of retinal blood vessels using a novel clustering algorithm (RACAL) with a partial supervision strategy. Med. Biol. Eng. 2007, 45, 261–273. [Google Scholar] [CrossRef] [PubMed]
- Chaudhuri, S.; Chatterjee, S.; Katz, N.; Nelson, M.; Goldbaum, M. Detection of blood vessels in retinal images using two-dimensional matched filters. IEEE Trans. Med. Imaging 1989, 8, 263–269. [Google Scholar] [CrossRef] [PubMed]
- Al-Rawi, M.; Qutaishat, M.; Arrar, M. An improved matched filter for blood vessel detection of digital retinal images. Comput. Biol. Med. 2007, 37, 262–267. [Google Scholar] [CrossRef] [PubMed]
- Cinsdikici, M.G.; Aydin, D. Detection of blood vessels in ophthalmoscope images using MF/ant (matched filter/ant colony) algorithm. Comput. Methods Programs Biomed. 2009, 96, 85–95. [Google Scholar] [CrossRef] [PubMed]
- Zhang, B.; Zhang, L.; Zhang, L.; Karray, F. Retinal vessel extraction by matched filter with first-order derivative of Gaussian. Comput. Biol. Med. 2010, 40, 438–445. [Google Scholar] [CrossRef]
- Odstrcilik, J.; Kolar, R.; Budai, A.; Hornegger, J.; Jan, J.; Gazarek, J.; Kubena, T.; Cernosek, P.; Svoboda, O.; Angelopoulou, E. Retinal vessel segmentation by improved matched filtering: Evaluation on a new high-resolution fundus image database. IET Image Process. 2013, 7, 373–383. [Google Scholar] [CrossRef]
- Hoover, A.D.; Kouznetsova, V.; Goldbaum, M. Locating blood vessels in retinal images by piecewise threshold probing of a matched filter response. IEEE Trans. Med. Imaging 2000, 19, 203–210. [Google Scholar] [CrossRef] [PubMed]
- Jiang, X.; Mojon, D. Adaptive local thresholding by verification-based multithreshold probing with application to vessel detection in retinal images. IEEE Trans. Pattern Anal. Mach. Intell. 2003, 25, 131–137. [Google Scholar] [CrossRef]
- Reza, A.W.; Eswaran, C.; Hati, S. Automatic Tracing of Optic Disc and Exudates from Color Fundus Images Using Fixed and Variable Thresholds. J. Med. Syst. 2009, 33, 73. [Google Scholar] [CrossRef] [PubMed]
- Reza, A.W.; Eswaran, C.; Hati, S. Diabetic retinopathy: A quadtree based blood vessel detection algorithm using RGB components in fundus images. J. Med. Syst. 2008, 32, 147–155. [Google Scholar] [CrossRef] [PubMed]
- Serra, J. Image Analysis and Mathematical Morphology, v. 1; Academic Press: Cambridge, MA, USA, 1982. [Google Scholar]
- Zana, F.; Klein, J.C. Segmentation of vessel-like patterns using mathematical morphology and curvature evaluation. IEEE Trans. Image Process. 2001, 10, 1010–1019. [Google Scholar] [CrossRef] [PubMed]
- Heneghan, C.; Flynn, J.; O’Keefe, M.; Cahill, M. Characterization of changes in blood vessel width and tortuosity in retinopathy of prematurity using image analysis. Med. Image Anal. 2002, 6, 407–429. [Google Scholar] [CrossRef]
- Yang, Y.; Huang, S.; Rao, N. An automatic hybrid method for retinal blood vessel extraction. Int. J. Appl. Math. Comput. Sci. 2008, 18, 399–407. [Google Scholar] [CrossRef]
- Mehrotra, A.; Tripathi, S.; Singh, K.K.; Khandelwal, P. Blood Vessel Extraction for retinal images using morphological operator and KCN clustering. In Proceedings of the 2014 IEEE International Advance Computing Conference (IACC), Gurgaon, India, 21–22 February 2014; pp. 1142–1146. [Google Scholar] [CrossRef]
- Miri, M.S.; Mahloojifar, A. Retinal image analysis using curvelet transform and multistructure elements morphology by reconstruction. IEEE Trans. Bio-Med. Eng. 2011, 58, 1183–1192. [Google Scholar] [CrossRef] [PubMed]
- Bharkad, S. Automatic segmentation of blood vessels in retinal image using morphological filters. ICSCA 2017, 132–136. [Google Scholar] [CrossRef]
- Yavuz, Z.; Köse, C. Blood Vessel Extraction in Color Retinal Fundus Images with Enhancement Filtering and Unsupervised Classification. J. Healthc. Eng. 2017. [Google Scholar] [CrossRef] [PubMed]
- Gao, X.; Bharath, A.; Stanton, A.; Hughes, A.; Chapman, N.; Thom, S. A method of vessel tracking for vessel diameter measurement on retinal images. In Proceedings of the 2001 International Conference on Image Processing (Cat. No.01CH37205), Thessaloniki, Greece, 7–10 October 2001; Volume 2, pp. 881–884. [Google Scholar]
- Liu, I.; Sun, Y. Recursive tracking of vascular networks in angiograms based on the detection-deletion scheme. IEEE Trans. Med. Imaging 1993, 12, 334–341. [Google Scholar] [CrossRef]
- Delibasis, K.K.; Kechriniotis, A.I.; Tsonos, C.; Assimakis, N. Automatic model-based tracing algorithm for vessel segmentation and diameter estimation. Comput. Methods Programs Biomed. 2010, 100, 108–122. [Google Scholar] [CrossRef] [PubMed]
- Vlachos, M.; Dermatas, E. Multi-scale retinal vessel segmentation using line tracking. Comput. Med. Imaging Graph. 2010, 34, 213–227. [Google Scholar] [CrossRef] [PubMed]
- Sheng, B.; Li, P.; Mo, S.; Li, H.; Hou, X.; Wu, Q.; Qin, J.; Fang, R.; Feng, D.D. Retinal Vessel Segmentation Using Minimum Spanning Superpixel Tree Detector. IEEE Trans. Cybern. 2018, 1–13. [Google Scholar] [CrossRef] [PubMed]
- Espona, L.; Carreira, M.J.; Penedo, M.G.; Ortega, M. Retinal vessel tree segmentation using a deformable contour model. In Proceedings of the 2008 19th International Conference on Pattern Recognition, Tampa, FL, USA, 8–11 December 2008; pp. 1–4. [Google Scholar]
- Al-Diri, B.; Hunter, A.; Steel, D. An active contour model for segmenting and measuring retinal vessels. IEEE Trans. Med. Imaging 2009, 28, 1488–1497. [Google Scholar] [CrossRef] [PubMed]
- Palomera-Pérez, M.A.; Martinez-Perez, M.E.; Benítez-Pérez, H.; Ortega-Arjona, J.L. Parallel multiscale feature extraction and region growing: Application in retinal blood vessel detection. IEEE Trans. Inf. Technol. Biomed. 2010, 14, 500–506. [Google Scholar] [CrossRef] [PubMed]
- Zhao, Y.Q.; Wang, X.H.; Wang, X.F.; Shih, F.Y. Retinal vessels segmentation based on level set and region growing. Pattern Recogn. 2014, 47, 2437–2446. [Google Scholar] [CrossRef]
- Salazar-Gonzalez, A.; Kaba, D.; Li, Y.; Liu, X. Segmentation of the blood vessels and optic disk in retinal images. IEEE J. Biomed. Health Inform. 2014, 18, 1874–1886. [Google Scholar] [CrossRef] [PubMed]
- Zhao, Y.; Rada, L.; Chen, K.; Harding, S.P.; Zheng, Y. Automated Vessel Segmentation Using Infinite Perimeter Active Contour Model with Hybrid Region Information with Application to Retinal Images. IEEE Trans. Med. Imaging 2015, 34, 1797–1807. [Google Scholar] [CrossRef] [PubMed]
- Gao, X.; Cai, Y.; Qiu, C.; Cui, Y. Retinal blood vessel segmentation based on the Gaussian matched filter and U-net. In Proceedings of the 2017 10th International Congress on Image and Signal Processing, BioMedical Engineering and Informatics (CISP-BMEI), Shanghai, China, 14–16 October 2017; pp. 1–5. [Google Scholar]
- Li, M.; Yin, Q.; Lu, M. Retinal Blood Vessel Segmentation Based on Multi-Scale Deep Learning. In Proceedings of the 2017 10th International Congress on Image and Signal Processing, BioMedical Engineering and Informatics (CISP-BMEI), Shanghai, China, 14–16 October 2017. [Google Scholar]
- Dasgupta, A.; Singh, S. A fully convolutional neural network based structured prediction approach towards the retinal vessel segmentation. In Proceedings of the 2017 IEEE 14th International Symposium on Biomedical Imaging (ISBI 2017), Melbourne, VIC, Australia, 18–21 April 2017; pp. 248–251. [Google Scholar]
- Staal, J.; Abràmoff, M.D.; Niemeijer, M.; Viergever, M.A.; Van Ginneken, B. Ridge-based vessel segmentation in color images of the retina. IEEE Trans. Med. Imaging 2004, 23, 501–509. [Google Scholar] [CrossRef] [PubMed]
- Owen, C.G.; Rudnicka, A.R.; Mullen, R.; Barman, S.A.; Monekosso, D.; Whincup, P.H.; Ng, J.; Paterson, C. Measuring retinal vessel tortuosity in 10-year-old children: Validation of the computer-assisted image analysis of the retina (CAIAR) program. IOVS 2009, 50, 2004–2010. [Google Scholar] [CrossRef] [PubMed]
- Frangi, A.F.; Niessen, W.J.; Vincken, K.L.; Viergever, M.A. Multiscale vessel enhancement filtering. In Medical Image Computing and Computer-Assisted Intervention; Springer: Berlin/Heidelberg, Germany, 1998; pp. 130–137. [Google Scholar]
- Gonzalez, R.; Woods, R. Digital Image Processing; Addison-Wesley Publishing Company: Boston, MA, USA, 1992. [Google Scholar]
- Pratt, W.K. Digital Image Processing: PIKS Inside; John Wiley & Sons, Inc.: New York, NY, USA, 2001. [Google Scholar]
- Roychowdhury, S.; Koozekanani, D.D.; Parhi, K.K. Iterative vessel segmentation of fundus images. IEEE Trans. Biomed. Eng. 2015, 62, 1738–1749. [Google Scholar] [CrossRef] [PubMed]
- Azzopardi, G.; Strisciuglio, N.; Vento, M.; Petkov, N. Trainable COSFIRE filters for vessel delineation with application to retinal images. Med. Image Anal. 2015, 19, 46–57. [Google Scholar] [CrossRef] [PubMed]
- Zhang, J.; Dashtbozorg, B.; Bekkers, E.; Pluim, J.P.; Duits, R.; ter Haar Romeny, B.M. Robust retinal vessel segmentation via locally adaptive derivative frames in orientation scores. IEEE Trans. Med. Imaging 2016, 35, 2631–2644. [Google Scholar] [CrossRef] [PubMed]
- Orlando, J.I.; Prokofyeva, E.; Blaschko, M.B. A discriminatively trained fully connected conditional random field model for blood vessel segmentation in fundus images. IEEE Trans. Biomed. Eng. 2017, 64, 16–27. [Google Scholar] [CrossRef] [PubMed]
Figure 1.
Work flow of proposed methodology.

Figure 2.
Phase 1: Image acquisition and preprocessing.

Figure 3.
Phase 2: Mask generation for Optic papilla removal.

Figure 4.
Phase 3: Vessel Enhancement and Fusion.

Figure 5.
Neighbourhood of a pixel x(i,j).

Figure 6.
Histogram of greenBottomHatOnes.

Figure 7.
Input & Output of the algorithm-Glaucoma: (a) Fundus image with Glaucoma; (b) Generated Mask; and, (c) Segmented blood vessels.
Figure 7.
Input & Output of the algorithm-Glaucoma: (a) Fundus image with Glaucoma; (b) Generated Mask; and, (c) Segmented blood vessels.

Figure 8.
Input & Output of the algorithm-Diabetic Retinopathy: (a) Fundus image with Diabetic Retinopathy; (b) Generated Mask; and, (c) Segmented blood vessels.
Figure 8.
Input & Output of the algorithm-Diabetic Retinopathy: (a) Fundus image with Diabetic Retinopathy; (b) Generated Mask; and, (c) Segmented blood vessels.

Figure 9.
Input & Output of the algorithm–Healthy: (a) Fundus image of Healthy eye, (b) Generated Mask, and (c) Segmented blood vessels.
Figure 9.
Input & Output of the algorithm–Healthy: (a) Fundus image of Healthy eye, (b) Generated Mask, and (c) Segmented blood vessels.


Table 1.
Contingency table.
| Algorithm Output | Gold Standard | |
|---|---|---|
| Vessel | Non-Vessel | |
| Vessel | True Positives (TP) | False Positives (FP) |
| Non-Vessel | False Negatives (FN) | True Negatives (TN) |
Table 2.
Results of Proposed Segmentation approach for High-Resolution Fundus image (HRF) dataset.
| Image Category | Sensitivity | Specificity | Accuracy | |||
|---|---|---|---|---|---|---|
| Odstrcilik et al. [13] | Proposed Method | Odstrcilik et al. [13] | Proposed Method | Odstrcilik et al. [13] | Proposed Method | |
| Healthy | 78.61% ± 3.92% | 94.11% ± 1.72% | 97.5% ± 0.65% | 95.34% ± 0.71% | 95.39% ± 0.61% | 95.28% ± 0.62% |
| Glaucoma | 79% ± 3.18% | 84.19% ± 0.33% | 96.38% ± 0.69% | 97.18% ± 0.33% | 94.97% ± 0.61% | 96.46% ± 0.033% |
| Diabetic Retinopathy | 74.63% ± 5.66% | 78.32% ± 4.5% | 96.19% ± 0.77% | 96.79% ± 0.6% | 94.45% ± 0.84% | 95.82% ± 0.43% |
Table 3.
Results of Segmentation approach for CHASE and DRIVE datasets.
| Methods | DRIVE | CHASE | ||||
|---|---|---|---|---|---|---|
| Sensitivity | Specificity | Accuracy | Sensitivity | Specificity | Accuracy | |
| Al-Diri et al. [32] | 0.7282 | 0.9551 | - | - | - | - |
| Zhang et al. [12] | 0.7120 | 0.9724 | 0.9382 | - | - | - |
| Niemeijer et al. [7] | - | - | 0.9416 | - | - | - |
| Staal et al. [40] | - | - | 0.9441 | - | - | - |
| Soares et al. [3] | 0.7332 | 0.9782 | 0.9466 | - | - | - |
| Ricci et al. [4] | - | - | 0.9595 | - | - | - |
| Marin et al. [5] | 0.7067 | 0.9801 | 0.9452 | - | - | - |
| Roychowdhury et al. [45] | 0.7395 | 0.9782 | 0.9494 | 0.7615 | 0.9575 | 0.9467 |
| Azzopardi et al. [46] | 0.7655 | 0.9704 | 0.9442 | 0.7585 | 0.9587 | 0.9387 |
| Zhang et al. [47] | 0.7473 | 0.9764 | 0.9474 | 0.7562 | 0.9675 | 0.9457 |
| 0.7743 | 0.9725 | 0.9476 | 0.7626 | 0.9661 | 0.9452 | |
| Orlando et al. [48] | 0.7897 | 0.9684 | - | 0.7277 | 0.9712 | - |
| Proposed method | 0.69 ± 0.09 | 0.94 ± 0.01 | 0.93 ± 0.01 | 0.71 ± 0.05 | 0.96 ± 0.01 | 0.95 ± 0.01 |
© 2019 by the authors. Licensee MDPI, Basel, Switzerland. This article is an open access article distributed under the terms and conditions of the Creative Commons Attribution (CC BY) license (http://creativecommons.org/licenses/by/4.0/).
Share and Cite
MDPI and ACS Style
Sundaram, R.; KS, R.; Jayaraman, P.; B, V. Extraction of Blood Vessels in Fundus Images of Retina through Hybrid Segmentation Approach. Mathematics 2019, 7, 169. https://0-doi-org.brum.beds.ac.uk/10.3390/math7020169
AMA Style
Sundaram R, KS R, Jayaraman P, B V. Extraction of Blood Vessels in Fundus Images of Retina through Hybrid Segmentation Approach. Mathematics. 2019; 7(2):169. https://0-doi-org.brum.beds.ac.uk/10.3390/math7020169
Chicago/Turabian StyleSundaram, Ramakrishnan, Ravichandran KS, Premaladha Jayaraman, and Venkatraman B. 2019. "Extraction of Blood Vessels in Fundus Images of Retina through Hybrid Segmentation Approach" Mathematics 7, no. 2: 169. https://0-doi-org.brum.beds.ac.uk/10.3390/math7020169
Note that from the first issue of 2016, this journal uses article numbers instead of page numbers. See further details here.