Low-Cost Online Handwritten Symbol Recognition System in Virtual Reality Environment of Head-Mounted Display


1
Department of Education Industry and Digital Media, National Taitung University, Taitung 95092, Taiwan
2
Department of Computer Science and Information Engineering, National Taichung University of Science and Technology, Taichung 40444, Taiwan
3
Department of Computer Science and Engineering, Yuan Ze University, Taoyuan 32003, Taiwan
*
Author to whom correspondence should be addressed.
Mathematics 2020, 8(11), 1967; https://0-doi-org.brum.beds.ac.uk/10.3390/math8111967
Submission received: 5 September 2020
/
Revised: 18 October 2020
/
Accepted: 26 October 2020
/
Published: 5 November 2020
(This article belongs to the Special Issue Artificial Intelligence and Big Data Computing)
Abstract
:Virtual reality is an important technology in the digital media industry, providing a whole new experience for most people. However, its manipulation method is more difficult than the traditional keyboard and mouse. In this research, we proposed a new low-cost online handwriting symbol recognition system to accurately identify symbols by user actions. The purpose was low cost processing without requiring a server. Experimental results showed that the average success rate of recognition was 99.8%. The execution time averaged a significantly low 0.03395 s. The proposed system is, respectively, highly reliable and at a low cost. This implies that the proposed system is suitable for applications in real-time environments.
1. Introduction
Development in virtual reality (VR) has made computer-generated imagery in the 3D environment an amazing experience. Users are able to interact intuitively and immerse and submit themselves into a virtual world [1]. As the head mounted display (HMD) framework released by Valve becomes more mature, manufacturers are attracted to invest in the manufacture of high-quality graphics effective devices, such as HTC Vive, Oculus Rift, and Valve Index. The spatial positioning function of the devices, namely, the position and rotation of the headset and controllers, are in real-time. The controllers are dynamically tracked and wireless so that users can get a better operating feel in the virtual world [2]. Improvements in the hardware equipment has made VR popular. VR can be seen in entertainment, education, shopping, libraries, gaming, sports, and social activities. Therefore, much research has been done on these related fields [3,4,5,6].
There is much improvement to be made for VR. For example, use input methods are buttons on the controllers or collisions by the position of the controllers and the objects in the virtual word to achieve the selection effect (menu driven approach). These are less user-friendly in comparison to the traditional input method. Therefore, this paper proposed an online handwriting tracking input method for VR application. Trajectories of the controllers are tracked and regarded as “handwriting” symbols drawn by a user.
The core technology of the recognition of symbols comes from image analysis and recognition systems. The main work includes image segmentation, image understanding, and graphics recognition [7,8,9]. Amongst them, the handwritten character and symbol recognition technologies are based on image processing and pattern recognition [10,11]. Although the recognition success rate cannot be 100%, the results are very close to the results by human vision. The recognition results of humans and computers are based on characters and symbols. Handwritten recognition can be divided into two types according to the content processed, namely, offline and online. Offline is an image-based method for recognition. The handwritten document is converted into an image through devices such as scanners or cameras, and image recognition is subsequently performed. Online is based on the stroke trajectory for recognition. The trajectory can be obtained in real-time during the writing process, and the recognition process can be performed after writing. Generally speaking, offline is more difficult than online because online can obtain dynamic information. such as stroke order and track point coordinates. Therefore, the success rate of online is much higher than offline. In the VR environment, it is very suitable to use online handwritten recognition as an input method [12,13].
In this paper, we proposed a low cost online handwritten symbol recognition system. The symbols are generated in a fully immersive virtual reality environment and treated as input commands to speedup inputs in the VR environment. The purpose of this paper is to provide users with an efficient input method, such as the up, down, left arrow, and right arrow of the keyboard, so that users can quickly operate and complete the required functions. When the input symbols are too complicated and not so easy to use in the VR environment, the purpose is to set a simpler symbol.
In addition, the proposed system requires very little calculation and it does not require additional calculation servers, unlike other recognition systems. Therefore, equipment cost is effectively reduced. Since our system does not use complicated techniques, such as neural networks, that require pre-training, the proposed system can be used directly in various environments and on various application levels. The research on virtual reality is quite diverse [14,15,16,17,18], and the main focus of this paper is on handwritten symbol recognition.
2. Proposed Method
Much attention on VR has been devoted on the development of applications for interaction media. In this paper, the focus of the proposed input method was to improve user experience. Traditionally, input is given by click-tapping a mouse or keyboard. Interaction in VR would be via the use of controllers or sensors for interaction in the 3D environment to track movements for recognition.
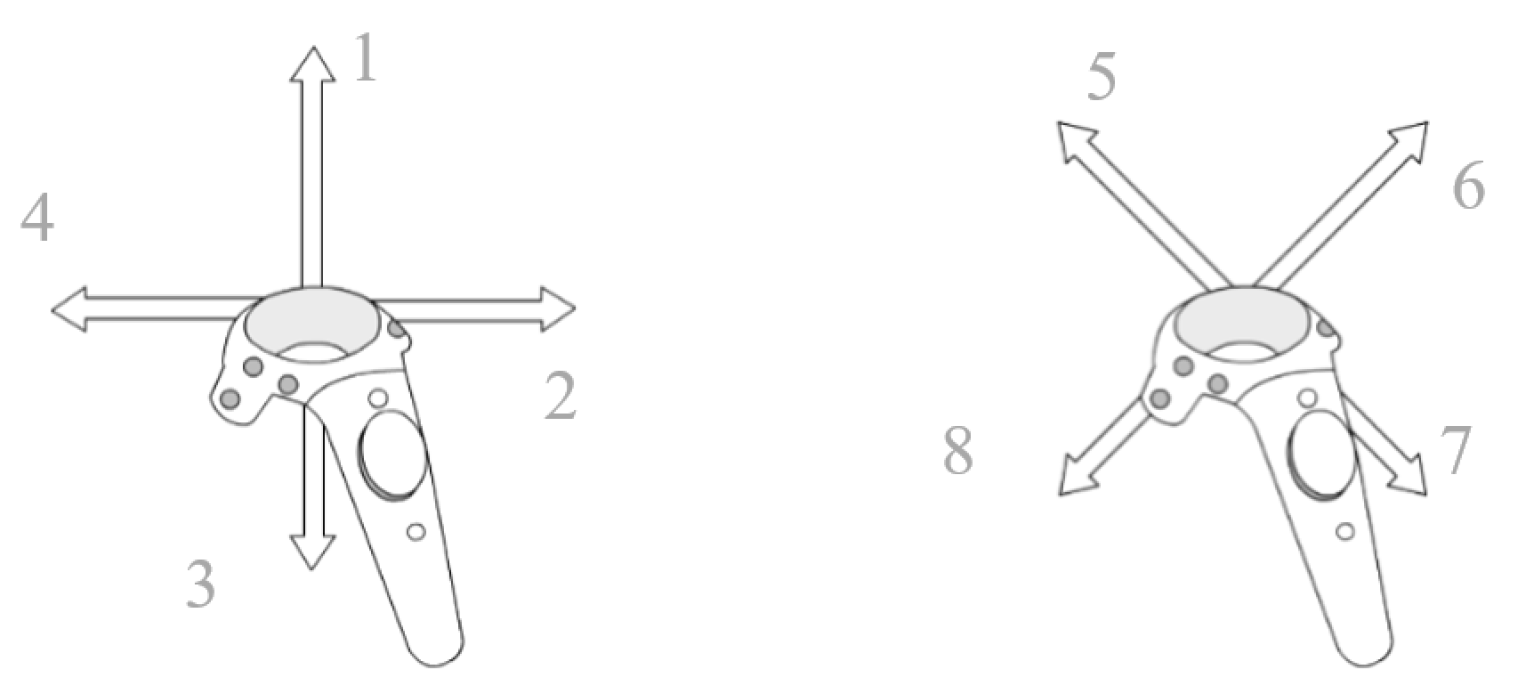
Figure 1 shows the simple handwriting symbol that was identified as signs used as a base for the proposed handwriting recognition system (HWR). When a sign was identified, it was converted to a manipulating command. The aim was to make user experience easier and to increase confidence with VR. Altogether, there were eight signs identified for the base of the handwriting symbol, which were intermixed to create more symbol commands. The aim was to increase usability and availability on any applications.
In this paper, there were five processes for the HWR system, namely, (1) sampling, (2) 2D remapping, (3) normalization, (4) resample, and (5) eigenvalue detection. These processes were used to identify the handwriting symbol. Detailed description is presented in the following subsection.
2.1. Sampling
The runtime locations of the user controller in the VR world were recorded at the launching of the HWR system, and the original track was recorded in an array. First, we set the maximum number of samples . Based on experience and trial tests, was found to be suitable and executional-effective. Sampling was empirically ascertained from test trials and a larger was determined not to be positively beneficial. In fact, we found that excessive sampling might even produce negative results. In addition, a single original track data type was a vector, which was the 3-axes information. can also be represented by the following formulas: , , and .
In the sampling session, we set a fixed sampling period t. As long as the time elapsed after , we saved the 3-axes information into the record table, , where . At the start of each round, array was reset to prevent contamination from leftover data of previous rounds. Sessions were stopped once the user stopped, which also stopped data sampling. In fact, if the amount of sampling data exceeded the sampling amount n in the array , the system was determined to be an invalid sampling then cleared the sampling data in the array . The sampling time could be set to any value based on individual requirement. From our experience, s second was suitable for the sampling procedure.
2.2. D Mapping
The handwriting procedure was performed with a controller by a user in the 2D mode. However, the direction in which the user was standing had to be considered when obtaining the original track. After sampling, we only needed to remove the rotation and position of the helmet to map the original data to the 2D state, as shown in Equation (1).
where Rotate (object, rotation, position) includes the target object, the axes of rotation, and the center of rotation, respectively, and object refers to the target object to be rotated, which is the in the actual execution process. We set all the of the on an empty object. Rotation refers to an axial of the helmet, the axis of the helmet. is the position of the helmet. All data in will remove to be the center point for position and rotate by the axis . Then, the result is .
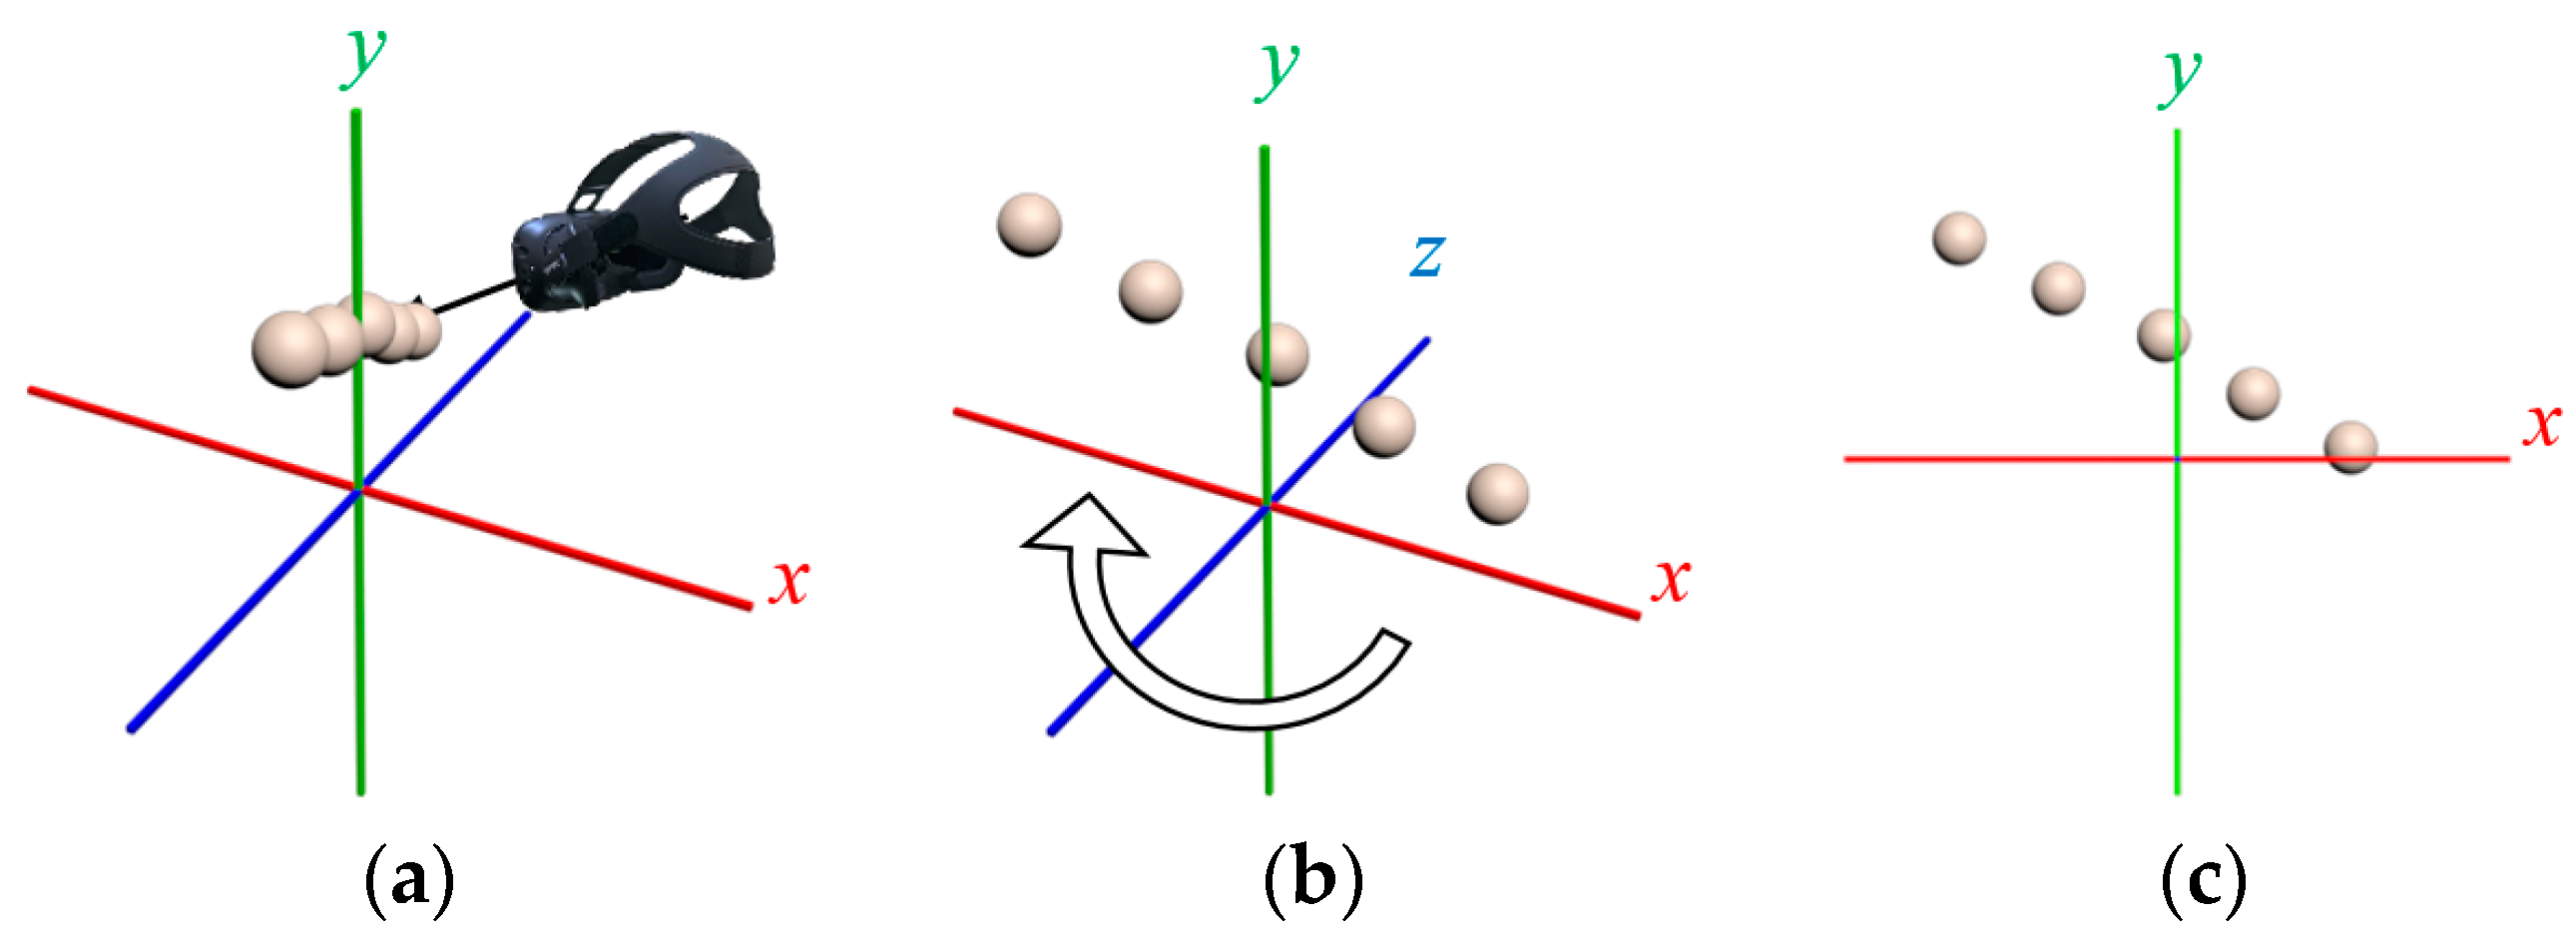
In physics, it is the process of removing the z-axis information in every sampling data and keeping the information of the x-axis and y-axis that completes the conversion of the coordinate system. The original data in Figure 2a was captured from the sampling when the user was standing at the x-axis and facing the y-axis. The captured data was arranged by the direction of the z-axis. Figure 2b shows the result removing the axes information of the user at this coordinate. Finally, the z-axis information was removed to get the result on the 2D coordinate system, as seen in Figure 2c.
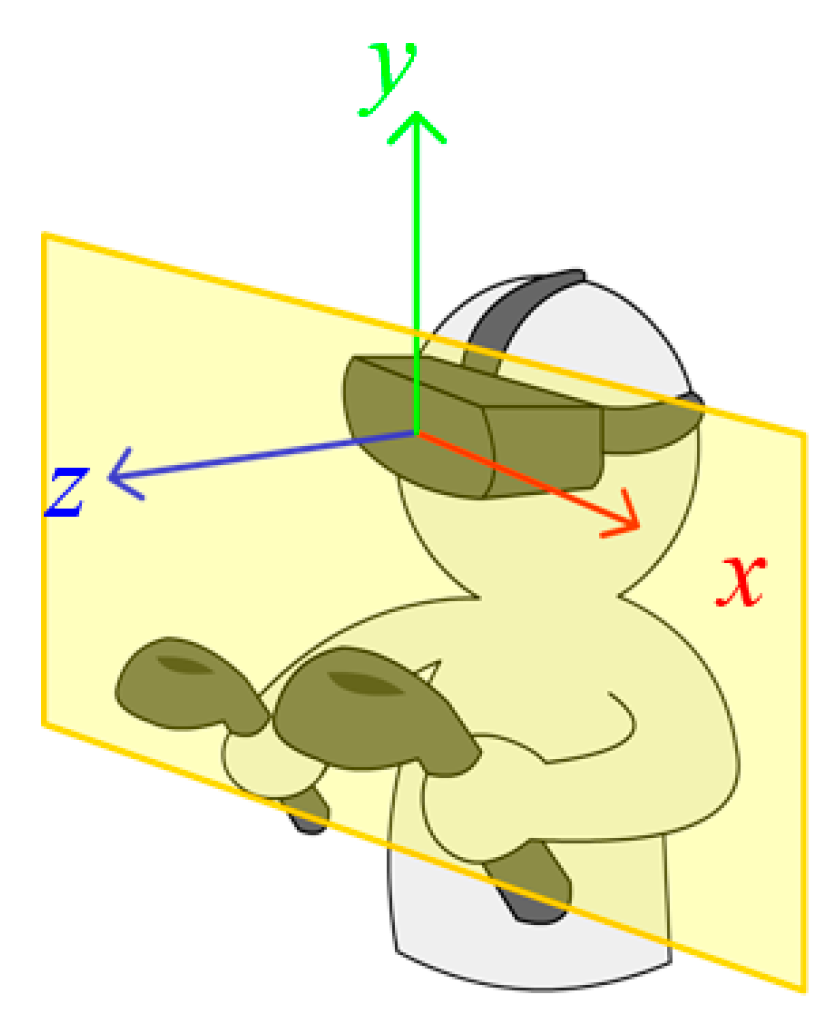
During 2D mapping, the axes and coordinates were removed when the user put on the helmet. The original data was converted into the xy plane with the z-axis flattened. The flattening resulted in over squeezing. However, our recognition target was designed based on the x-axis and y-axis; the function of the z-axis was insignificant. In addition, the transformation to the xy plane conformed to the normal computer operation of the virtual screen (see Figure 3). In this mode, the need for z-axis space was naturally decreased.
2.3. Normalization
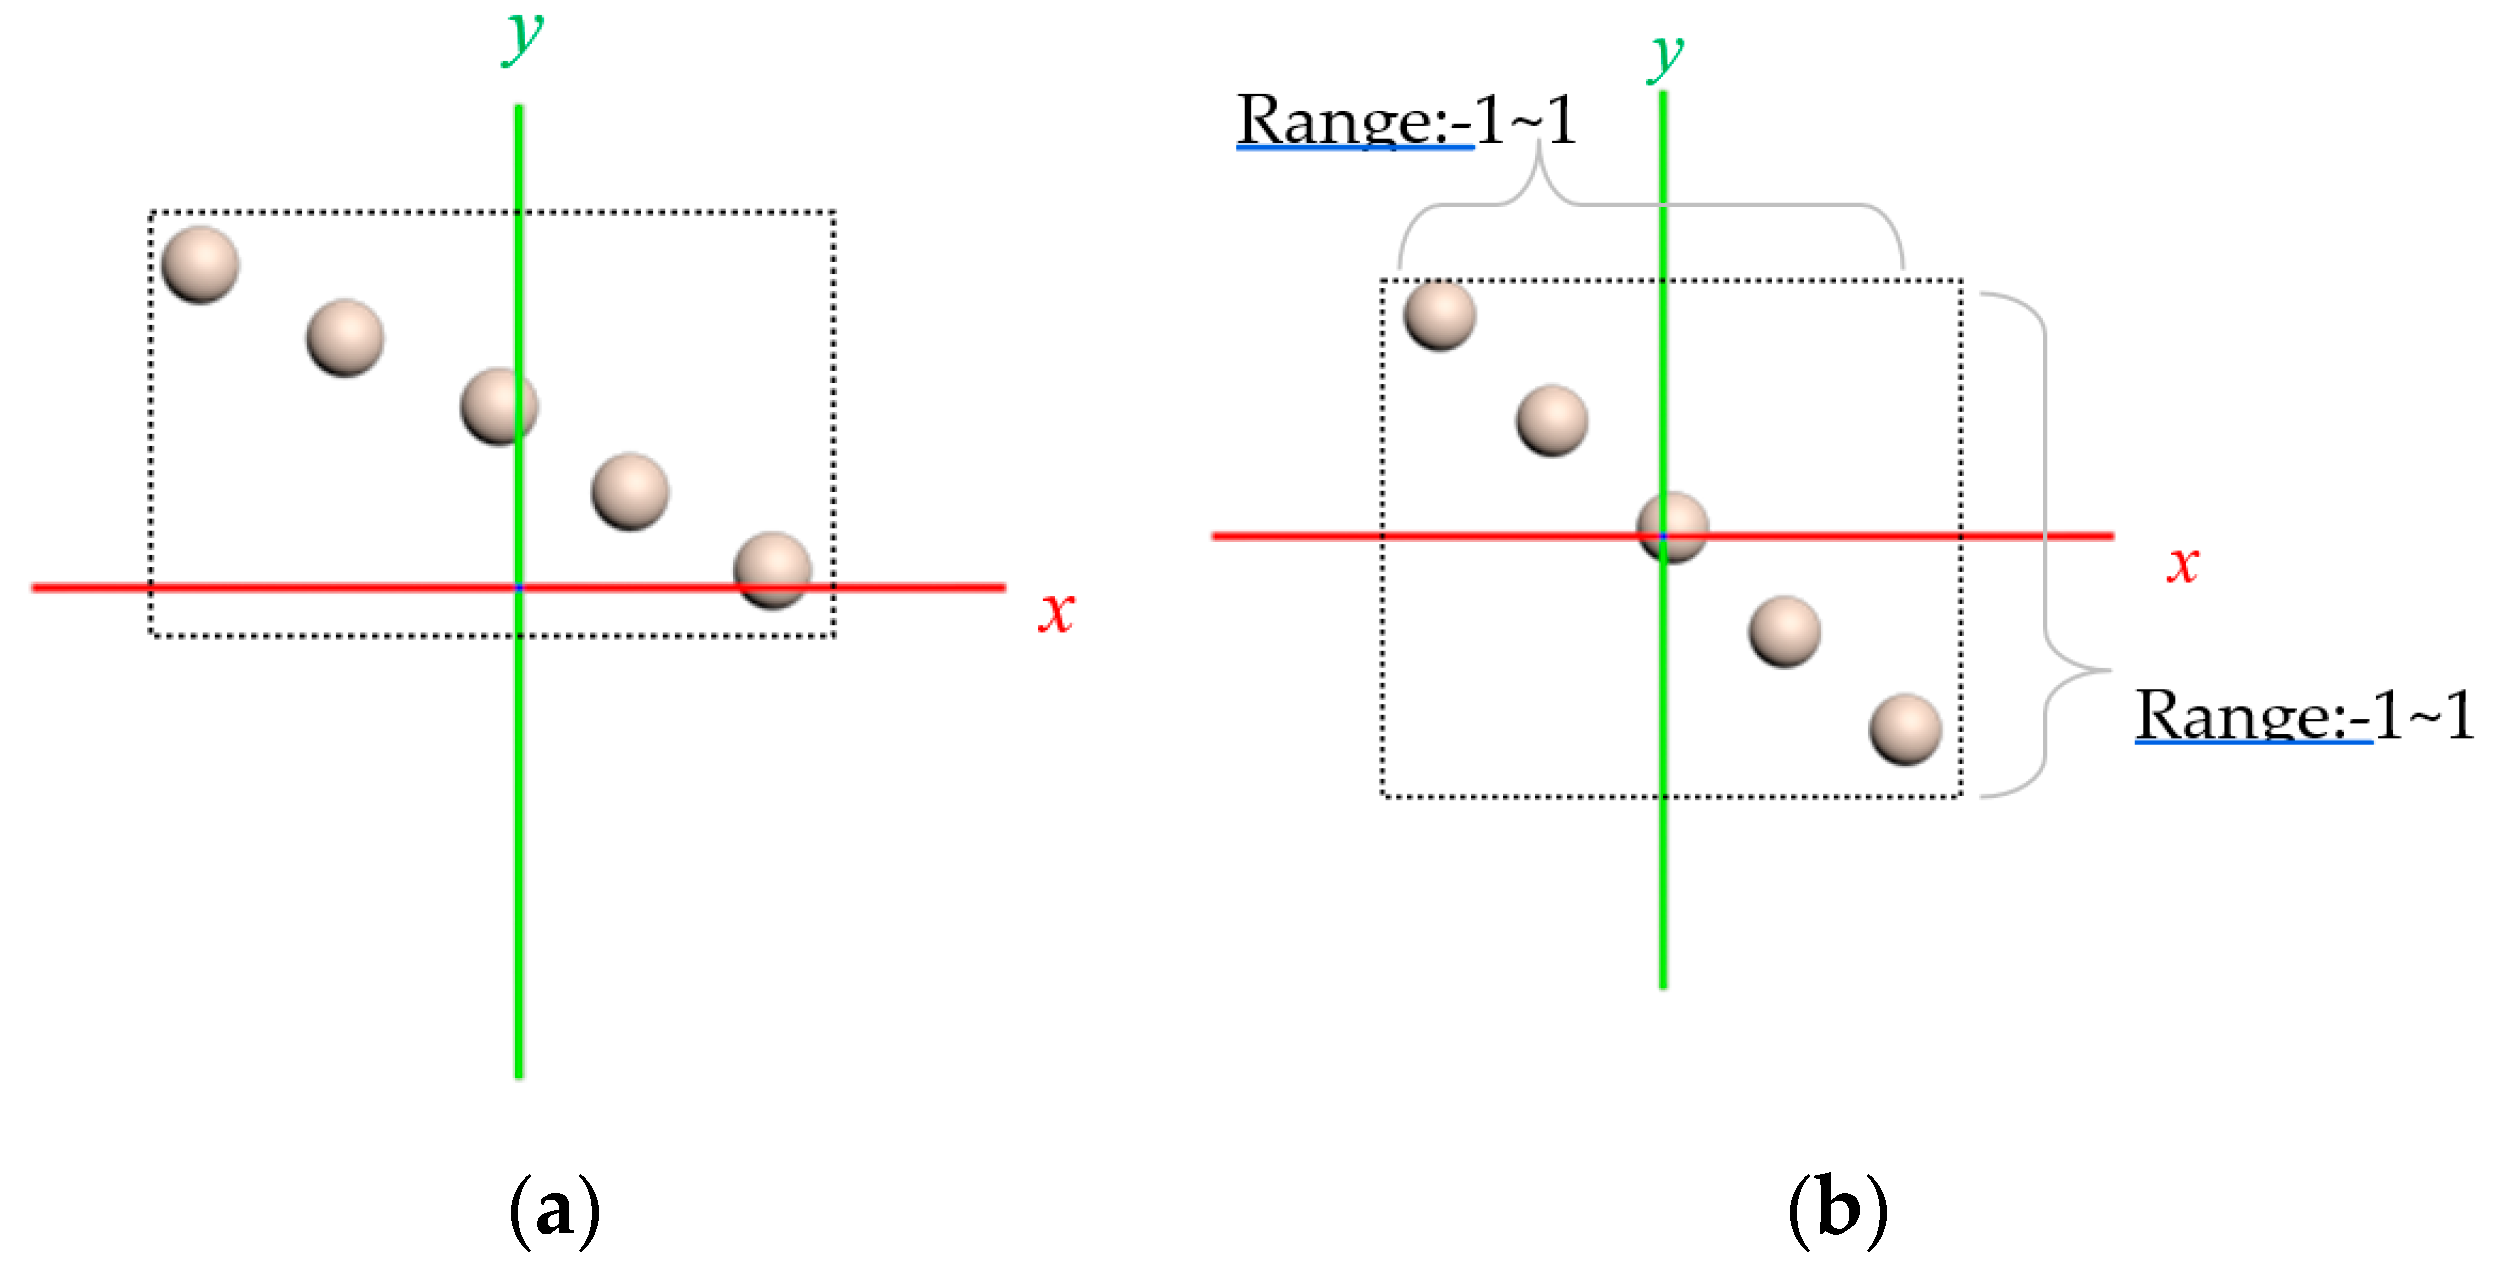
In the sampling and 2D mapping procedure, the height of the user, the state of VR environment, and the relation parameters made a difference in the sampling result. To reduce the computational complexity, linear interpolation was used to normalize the x-axis and y-axis in to be between −1 and 1. The final result after interpolation was . This normalization process also aligned the data diagonally to a square architecture. Figure 4a shows the original rectangle architecture of the data before normalization, and Figure 4b shows the square type after normalization.
2.4. Resampling
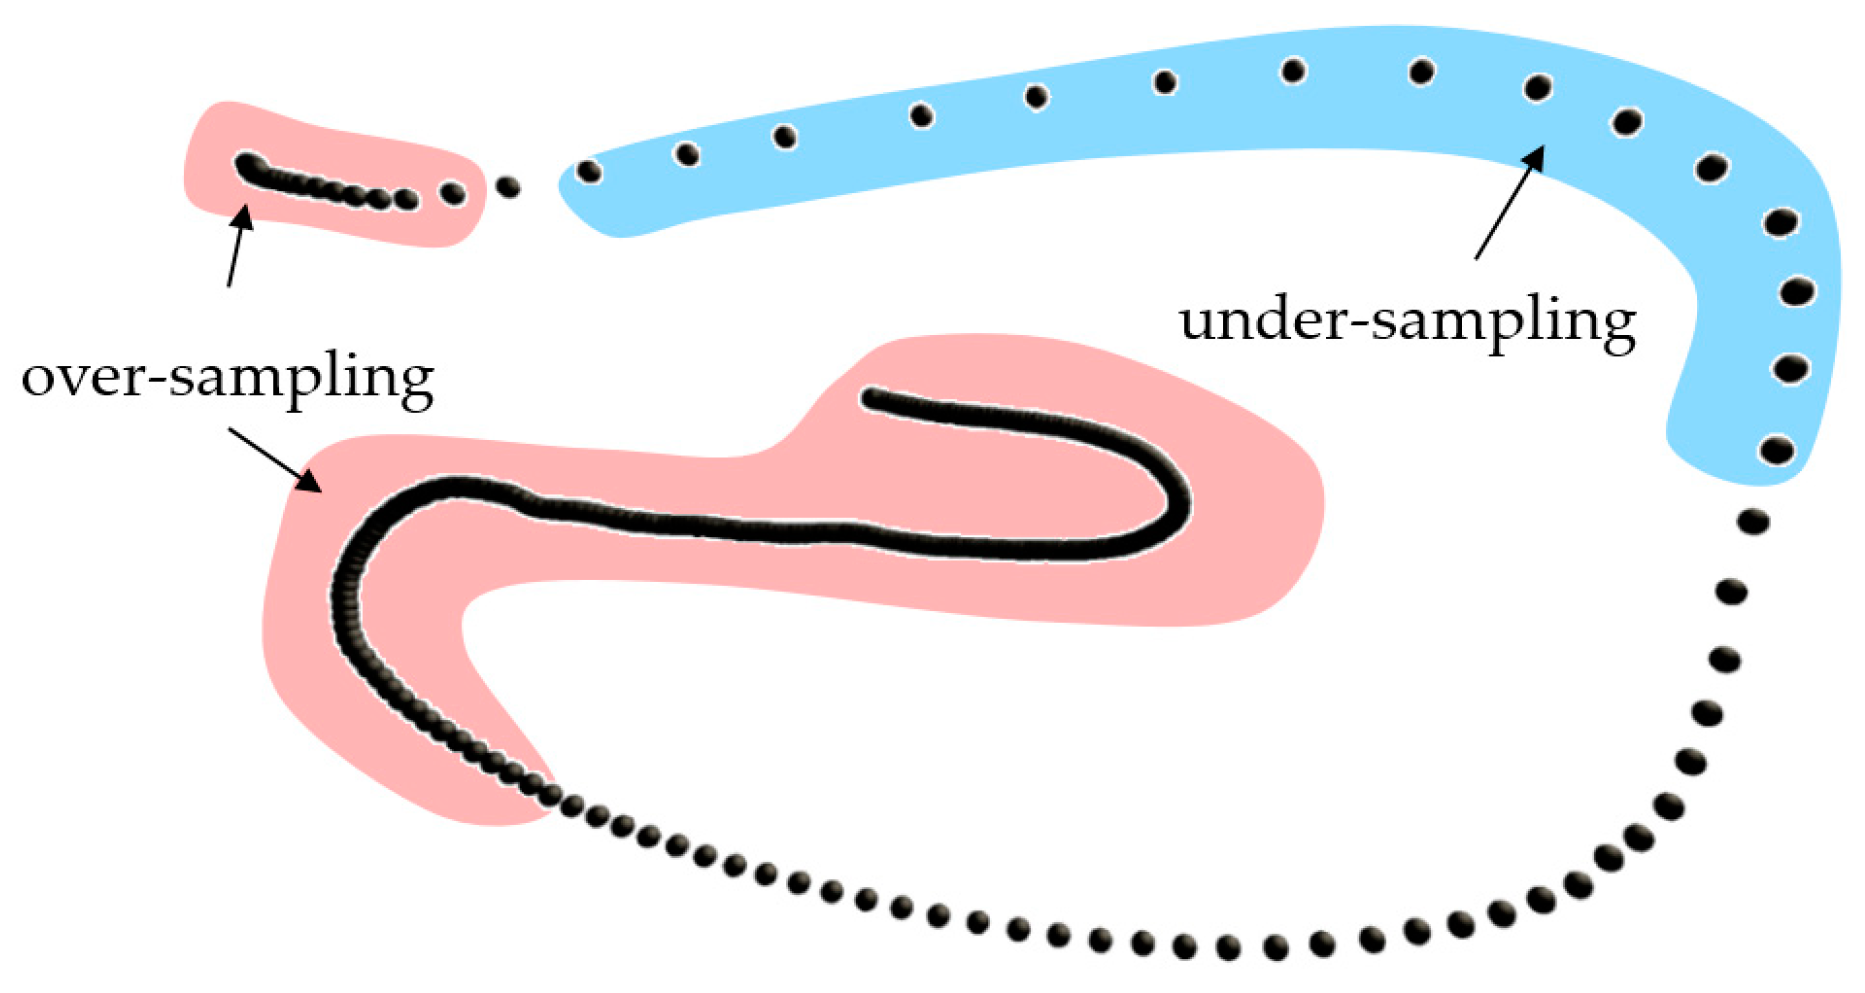
There were different possibilities during the sampling process. While the frequency of the movement in sampling was variable, the density of sampling was unstable. When the user moved slowly, a large amount of data could be captured in the allotted time, causing oversampling, as shown in Figure 5. On the other hand, when the user moved quickly in a certain location, the data showed less under-sampling, as shown in Figure 5.
These situations resulted in recognition error and required resampling on the data. As long as the coordinate distance of each sample could be fixed, the recognition error problem could be solved. We visited all the sampling points in . When the distance of visit exceeded the threshold , a sampling point was added, and when the distance of the visit was less than , the old sampling points could be removed. The path of the movement went through by until completing all positions.
In this session, any distance d between and less than threshold implied that these two positions were too close and the data in needed to be cleared. On the other hand, if distance d was equal or bigger than threshold ,we added the new sample data between and , and the distance between every two position equaled the value of . After completing the full path, the whole resampling data was captured, which meant the eigenvalue was , where is the number of eigenvalues. Generally, was much smaller than . Detailed steps are as shown in Figure 5.
- Step 1.
- Let i be the visiting order of , where is initialized to 1 and . Set to record the current feature value order. is initialized to 1, then set to .
- Step 2.
- Use Equation (2) to calculate distance d.
- Step 3.
- If , then perform Step 4 and Step 5.
- Step 4.
- When represents over-sampling, move to the next position and set , and perform Step 6.
- Step 5.
- When represents under-sampling, a new sampling point needs to be added, so take as the starting point and move toward , and the moving distance is . Then set the moved coordinates to and finally update the order of the feature value and perform Step 6.
- Step 6.
- Repeat Steps 2–5 until all visits are completed.
- Step 7.
- After all the visits are completed, the final number of resampling is , and the final resampling result is .
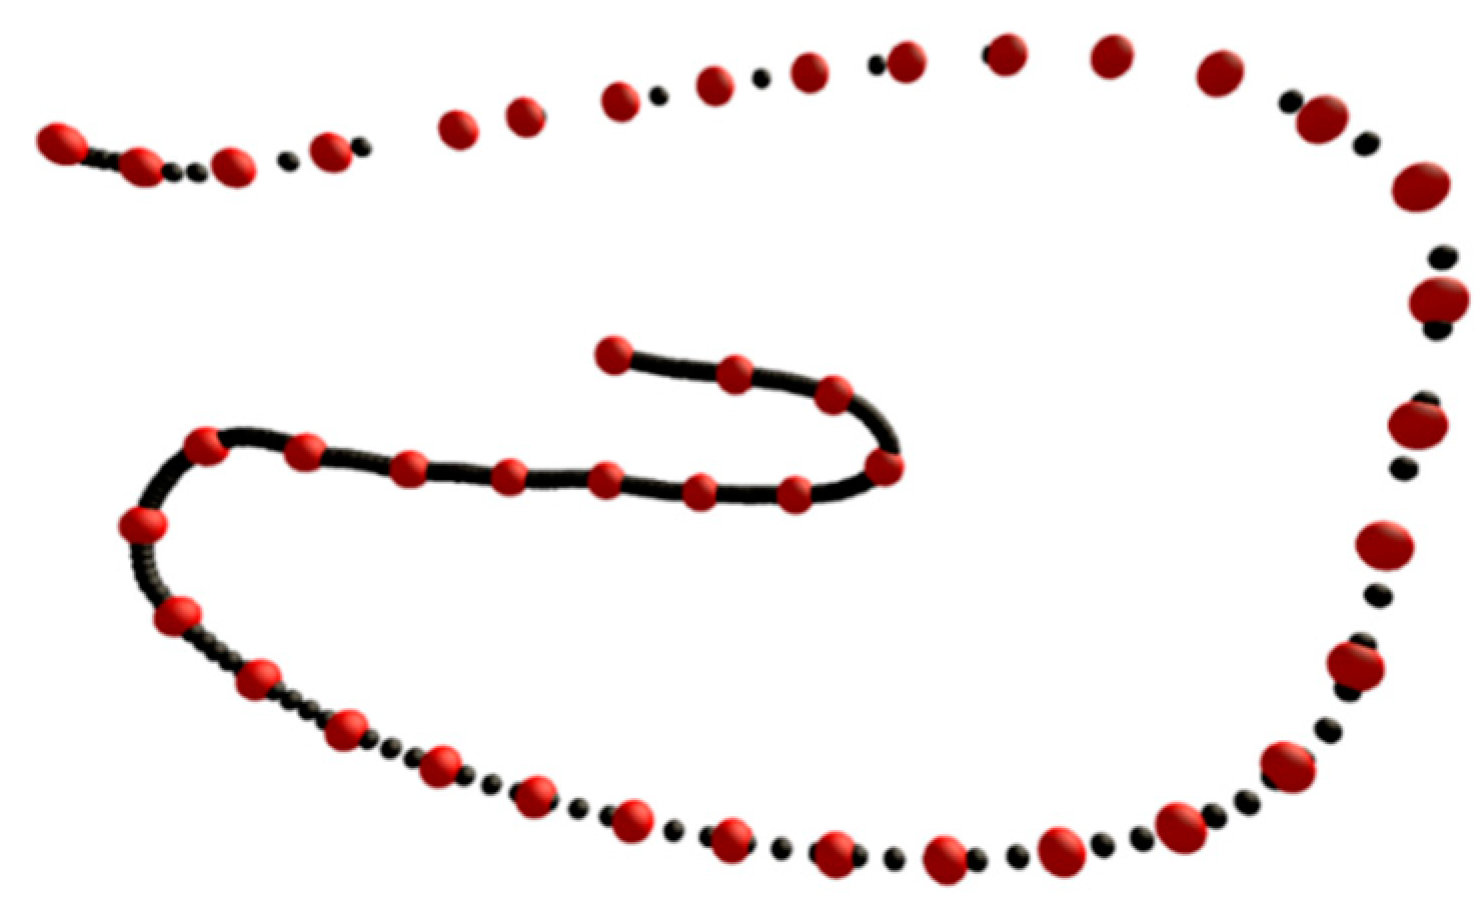
In Figure 6, the smaller black dots are the original data. Some showed oversampling (dense distribution), and the faster movement showed under sampling (sparse distribution). The bigger red dots represent the resampled data, which maintained fixed distance between any two points. The processed results could therefore be effectively identified.
2.5. Eigenvalue Detection
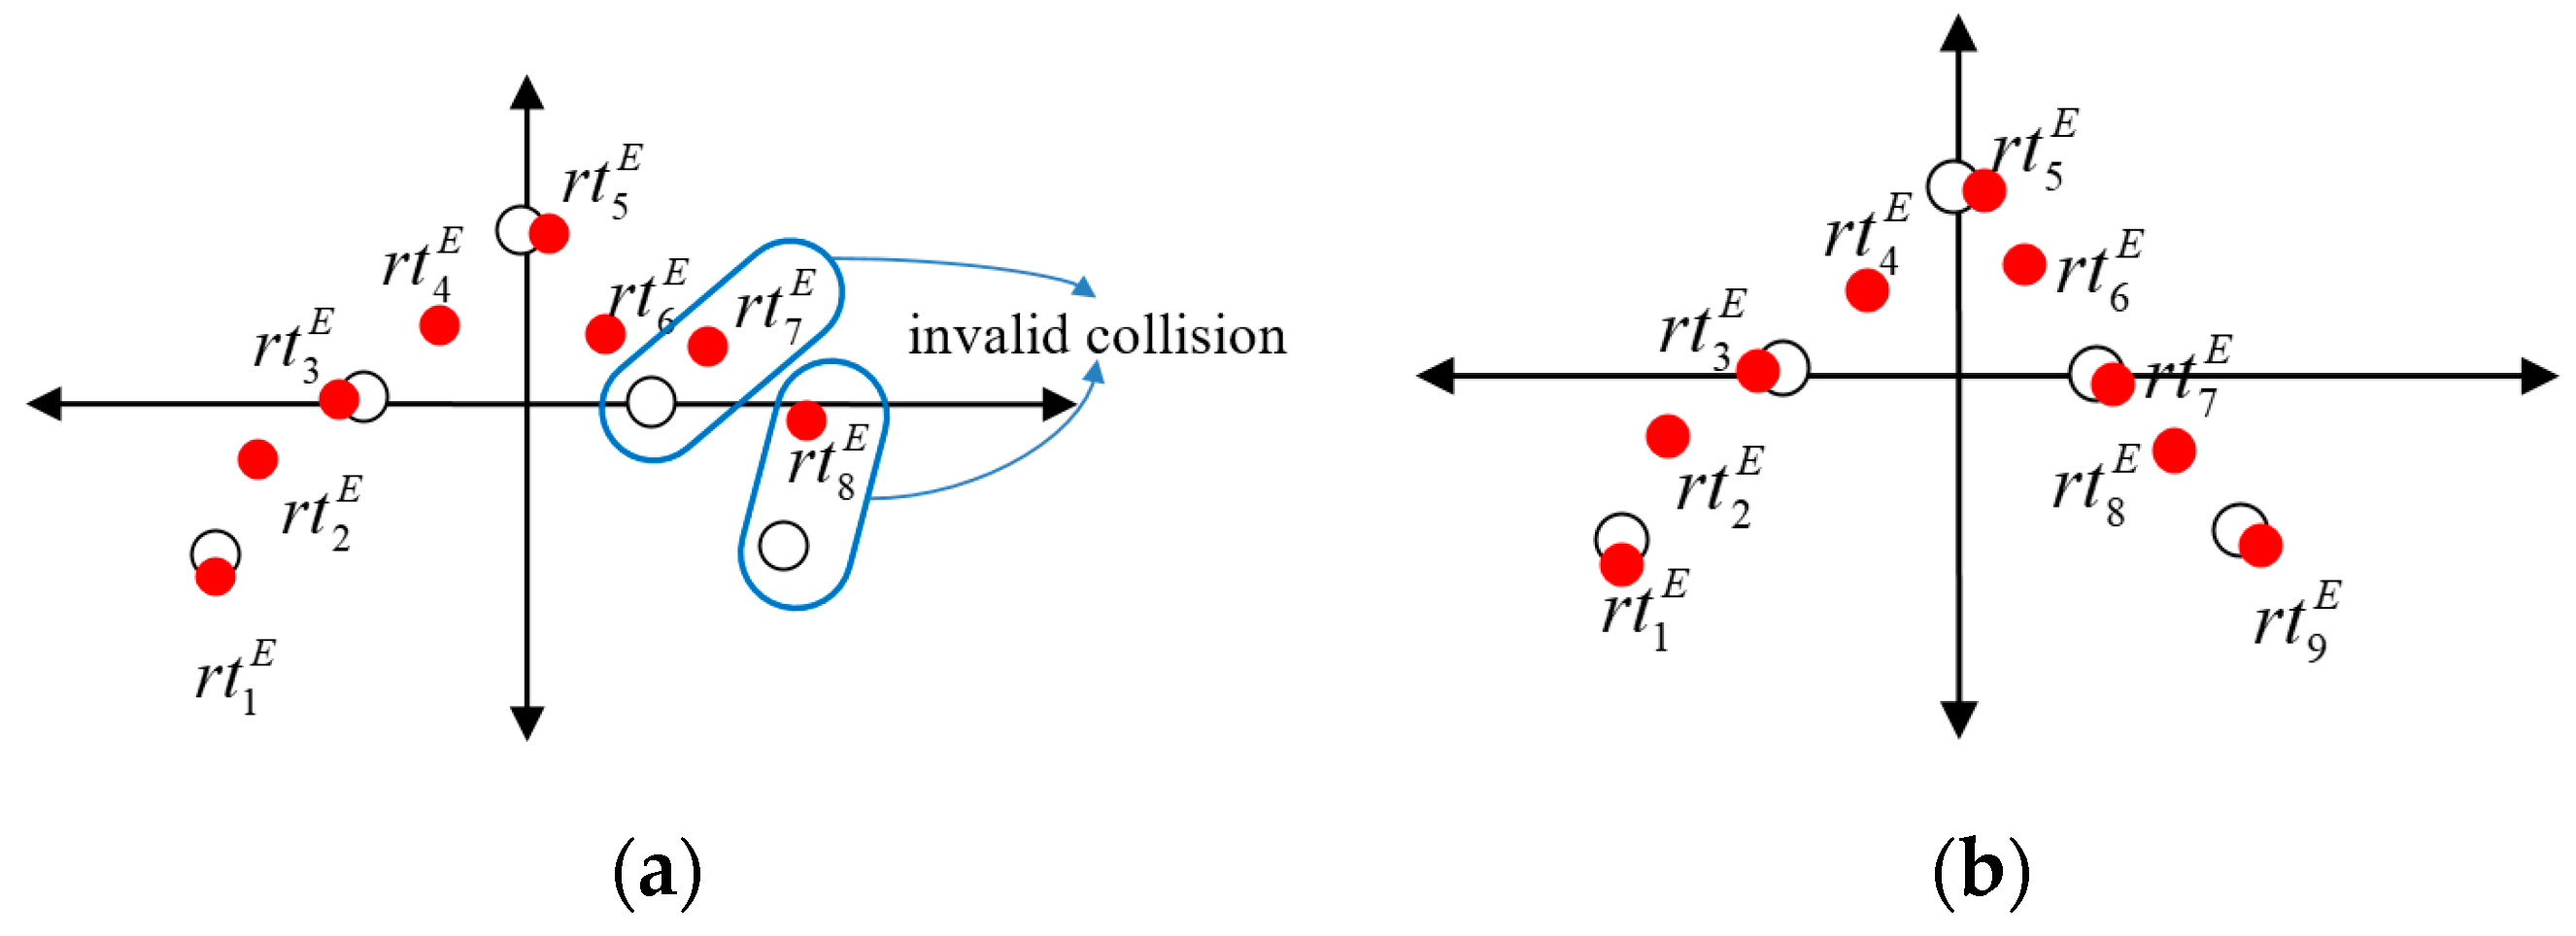
The sequential collision was used for the detection procedure and to extract the data from the eigenvalue RTE for comparison. The proposed system is a real-time system. If there was no collision with recognition targets in the comparing process, detection failed. However, if the eigenvalue made sequential collision, it meant a successful detection and the ID number was sent back to system. In Figure 7, the solid dot means the eigenvalue and hollow dot is the data library for detection. Figure 7a shows invalid collisions, resulting in failed results. Figure 7b shows the successful collisions. When all eigenvalues collided with the detection data, the user got an ID from the target database of the system.
In the recognition process, the resample data was compared in sequence with the recognition targets. If the resample data of a target collided with all the coordinates, the target was a candidate. If all targets were judged and the number of candidates was greater than 1, we located the candidate closest to the recognition targets to find the most suitable result. According to this method, even if the targets were very close, the correct results could be effectively analyzed.
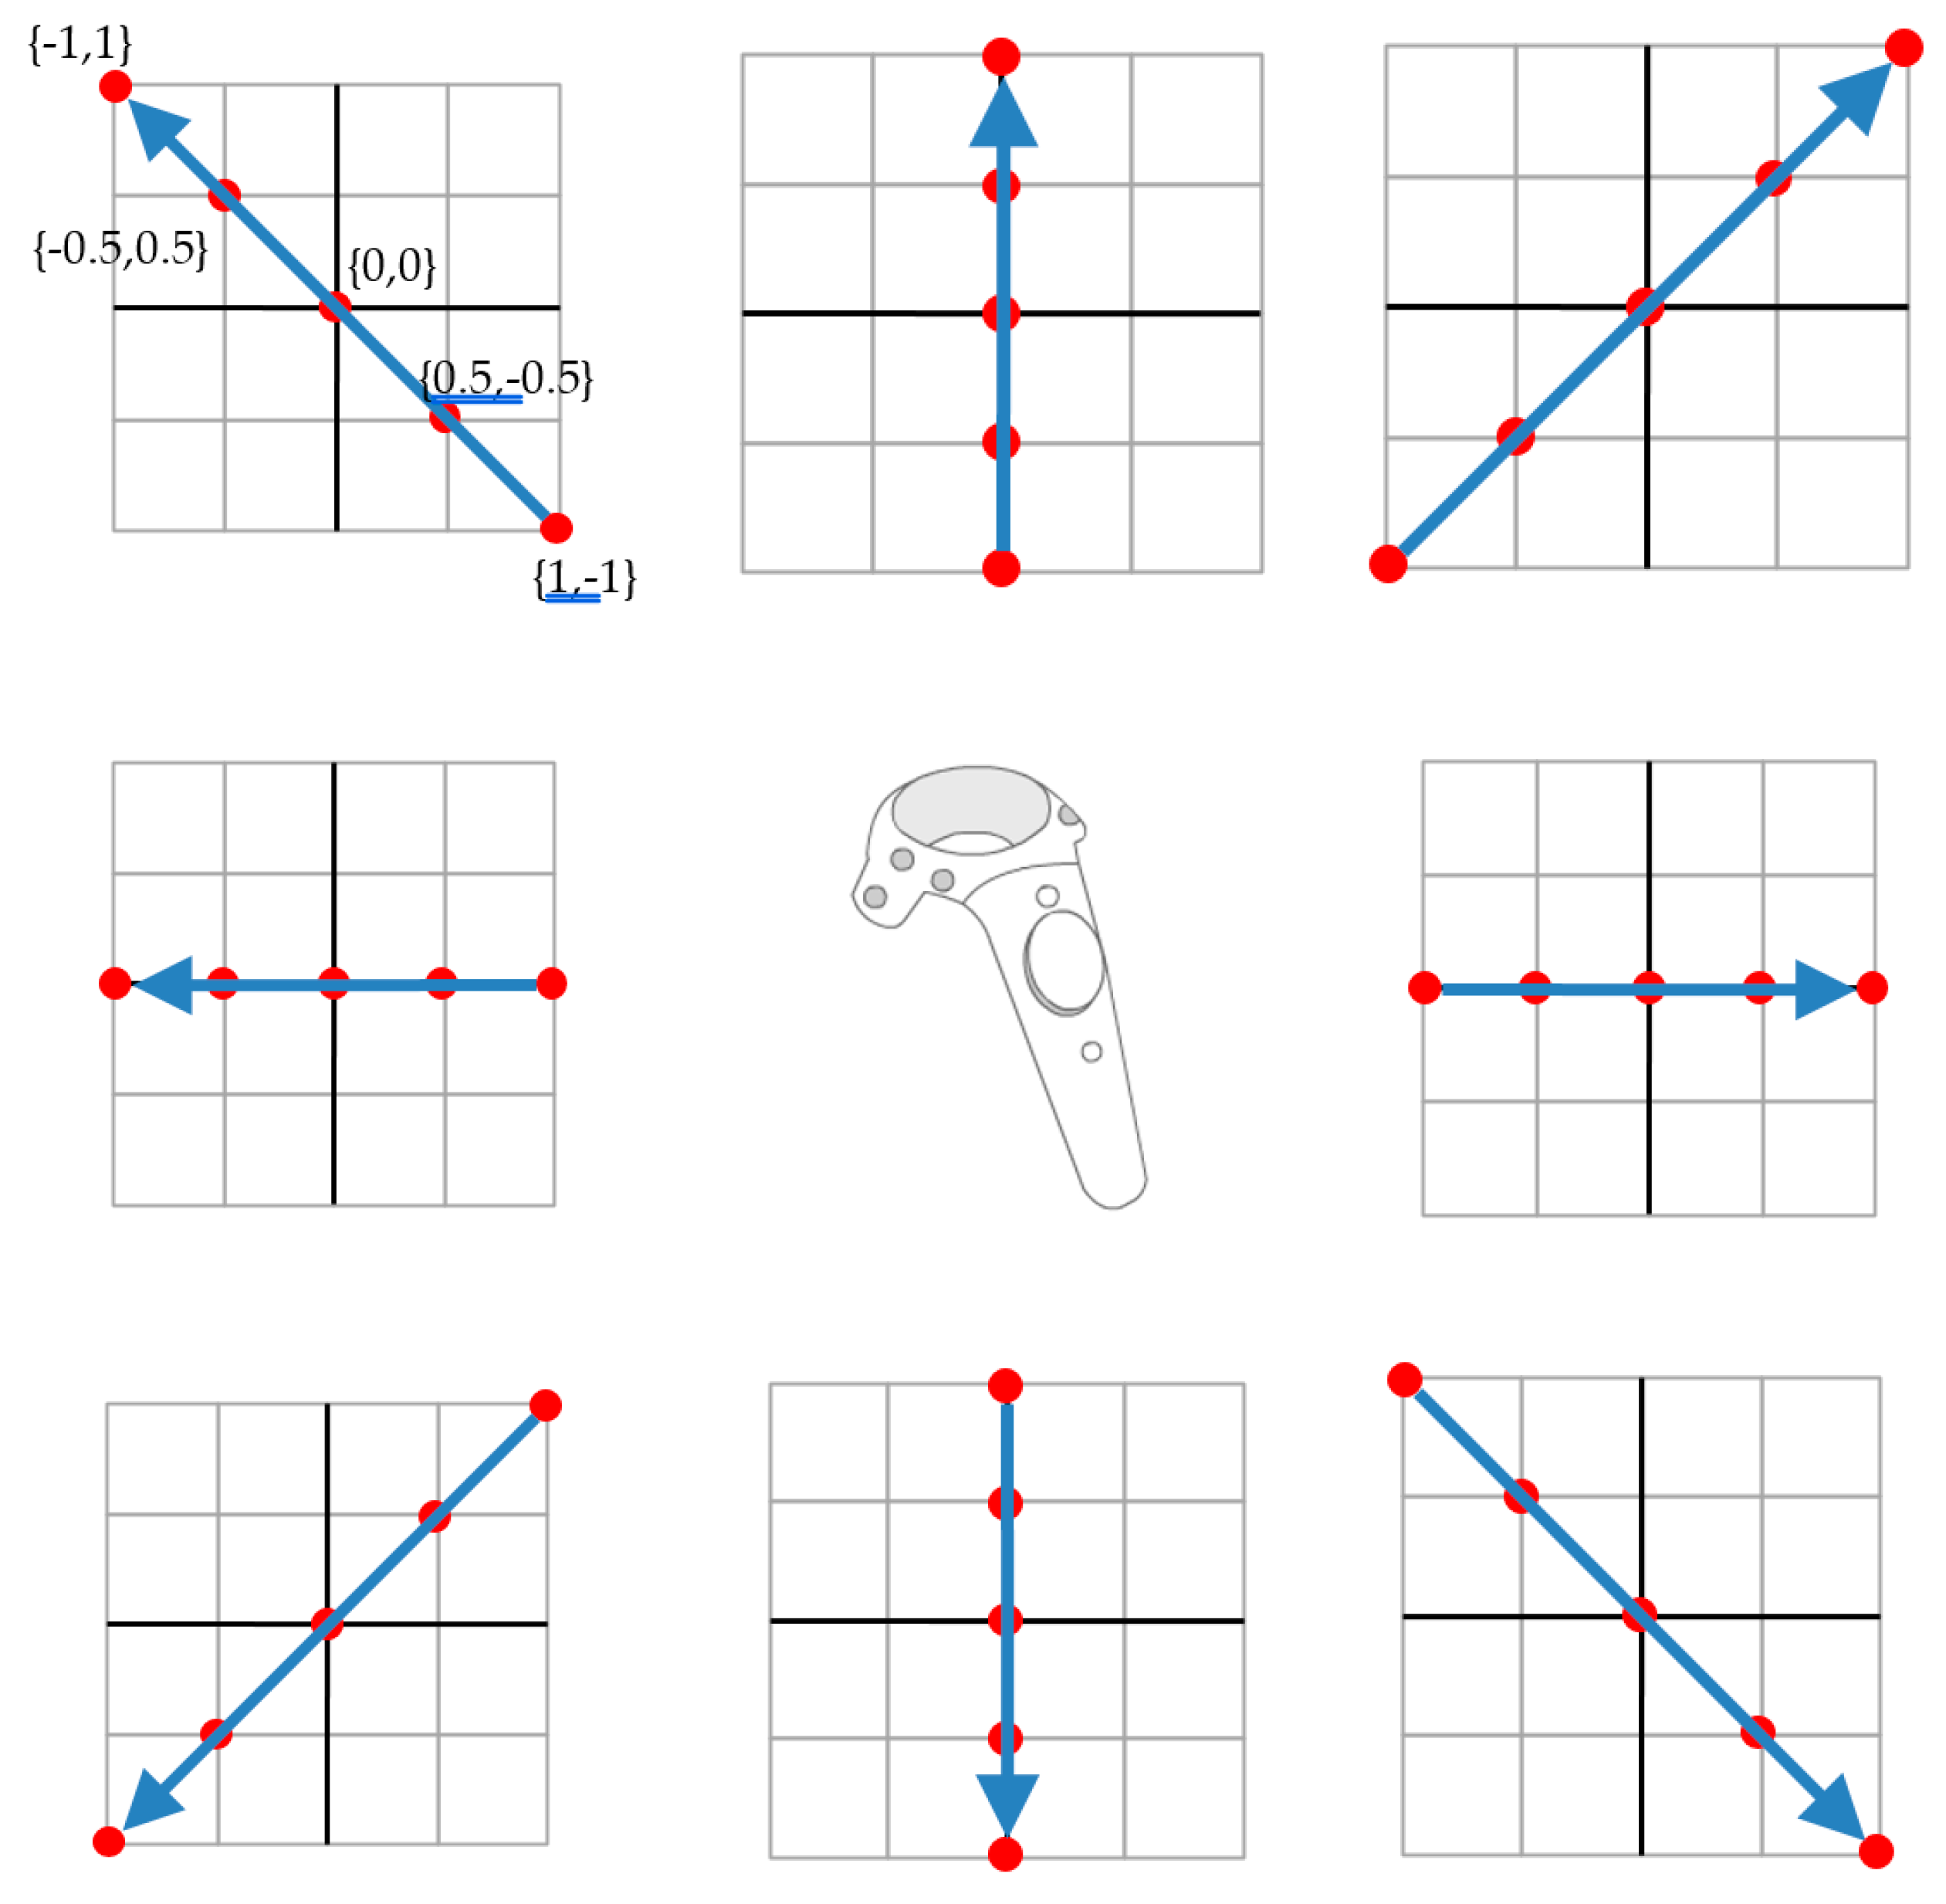
Furthermore, the structure of the database was very simple. The movement path of the target symbol was recorded in sequence, as shown in Figure 8. The recognition target on the upper left of Figure 8, their coordinates were {1, −1}, {0.5, −0.5}, {0, 0}, {−0.5, 1}, and {−1, 1}. The remaining recognition targets can be processed in the same way, and the detailed coordinate data is as shown in Table 1.
3. Experimental Results
In this section, we conducted several experiments to test the proposed system. The first experiment works with various recognition targets, such as the impact of different movement speeds on the recognition situation. We adopted three movement speeds, namely, normal movement, slow movement, and fast movement. They corresponded to normal-sampling, over-sampling, and over-sampling, respectively.
The original data is represented with a black dot and the resample data are represented with red, blue, and green dots. The blue dot shows the starting point of the track and the green dot shows the ending point of the track. We observed the position of the blue and green dots to distinguish the direction. The following experiment shows the speed performance, measured on an Intel i7-6770 CPU, with 3.4GHz and 16 GB of RAM under the Windows 10 64-bit operating system.
In this experiment, 16 kinds of recognition targets (e.g., Figure 8, Figure 9 and Figure 10) were tested for these three kinds of moving speeds, and the total data was 48. Table 4 shows the state of normal sampling, Table 5 shows over-sampling, and Table 6 shows the result of under-sampling. Results showed successful recognitions of the three sets on tests of different moving speeds.
After these 48 original data were processed by resampling, the number of original data in normal sampling was about 25–56 and the data after resampling was reduced to 8–15. The amount of original data for over-sampling fell between 162–308 and was between 8–12 after processing. Finally, the original data of under-sampling was 5–13 and the result of re-sampling was 7–16. After processing by our method, the distribution of the data can be made more uniform and beneficial to subsequent processing.
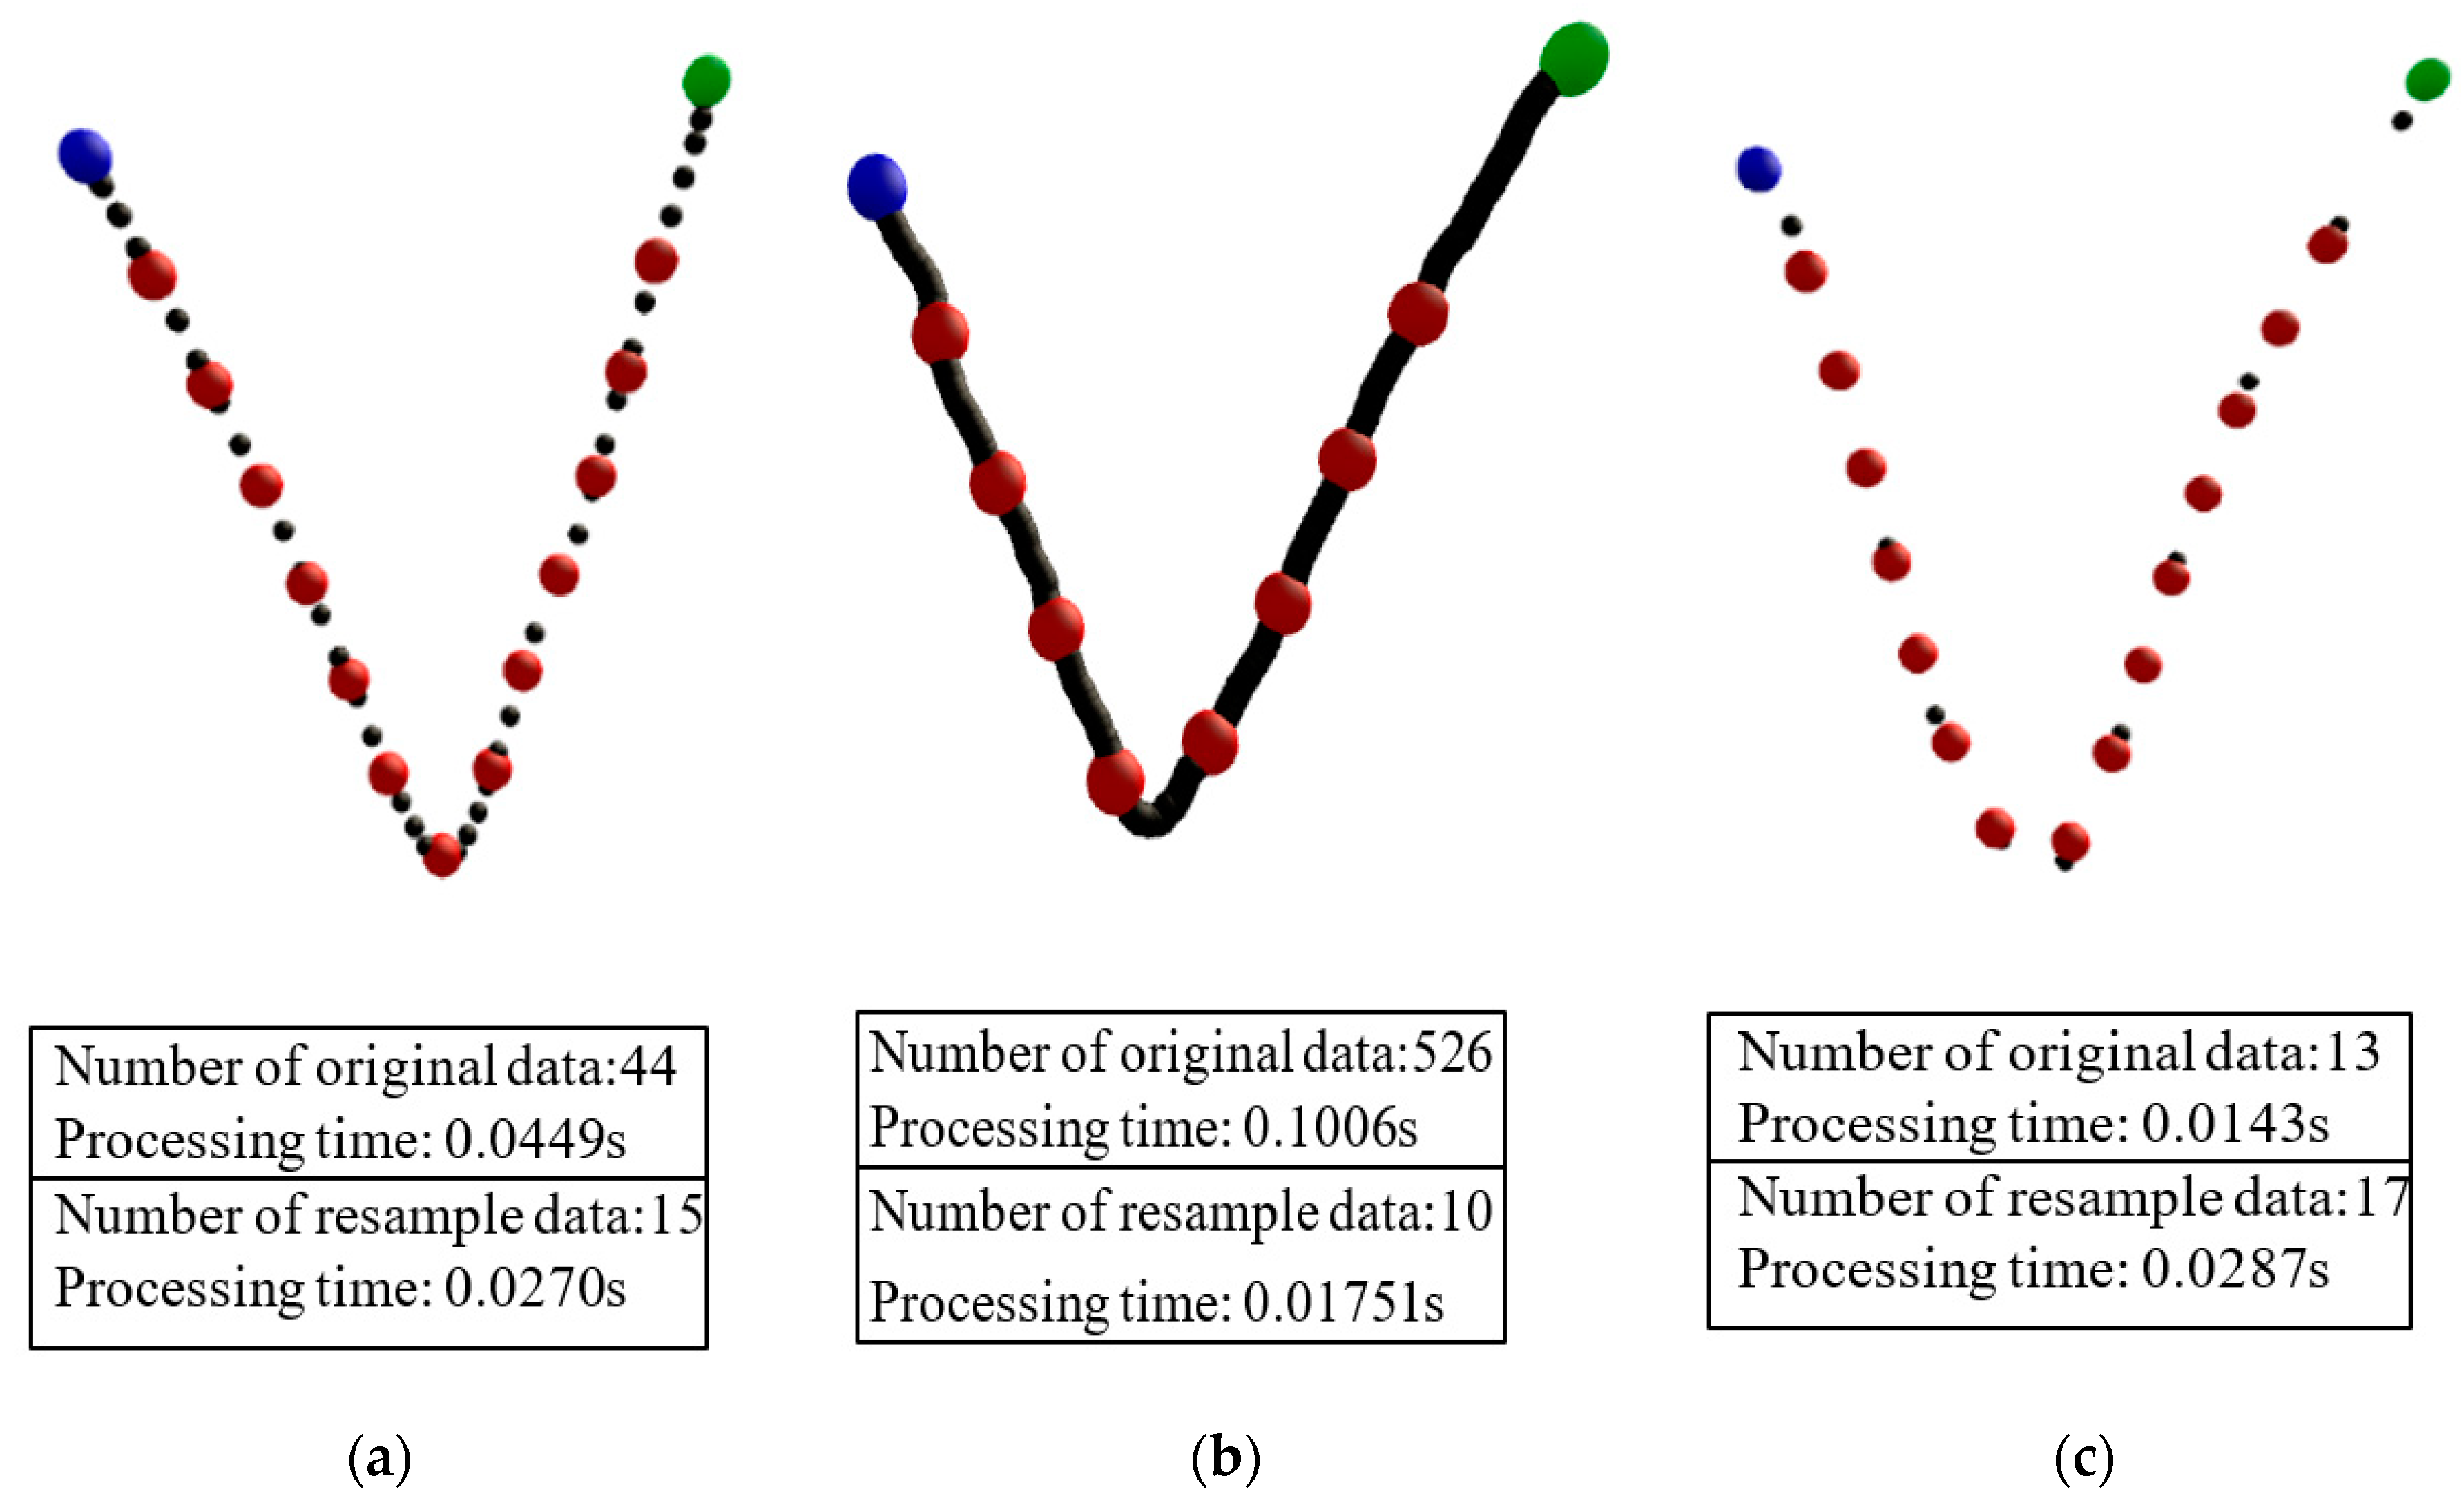
The recognition processing time experiment was conducted with a vertical V-shape from left to right. The results were the original data (black dot) and the processed resample data (red dot, blue, and green dots), respectively (as shown in Figure 11). The data containing the three moving speeds were normal sampling, over-sampling, and under-sampling. The amount of original data of normal sampling was 44, the amount after resampling was 15, and the time spent was 0.0449 s and 0.0270 s, respectively. After resampling, time saved was near double. In the over-sampling situation, the numbers of original and resample data were 526 and 10, respectively. The time spent on recognition was 0.1006 s and 0.02751 s, respectively. Time saved after resampling was almost 6 times. Finally, in the state of under-sampling, the amount of original and resample data was 13 and 17, respectively. Due to the lack of points in the original data, our algorithm automatically supplemented the area with a larger interval. Therefore, the processed points were expanded from 13 to 17 points and more processing time was required. Although more time was needed, recognition stability was increased. Overall, our resampling can effectively reduce the amount of data and achieve significantly high accuracy of the recognition procedure.
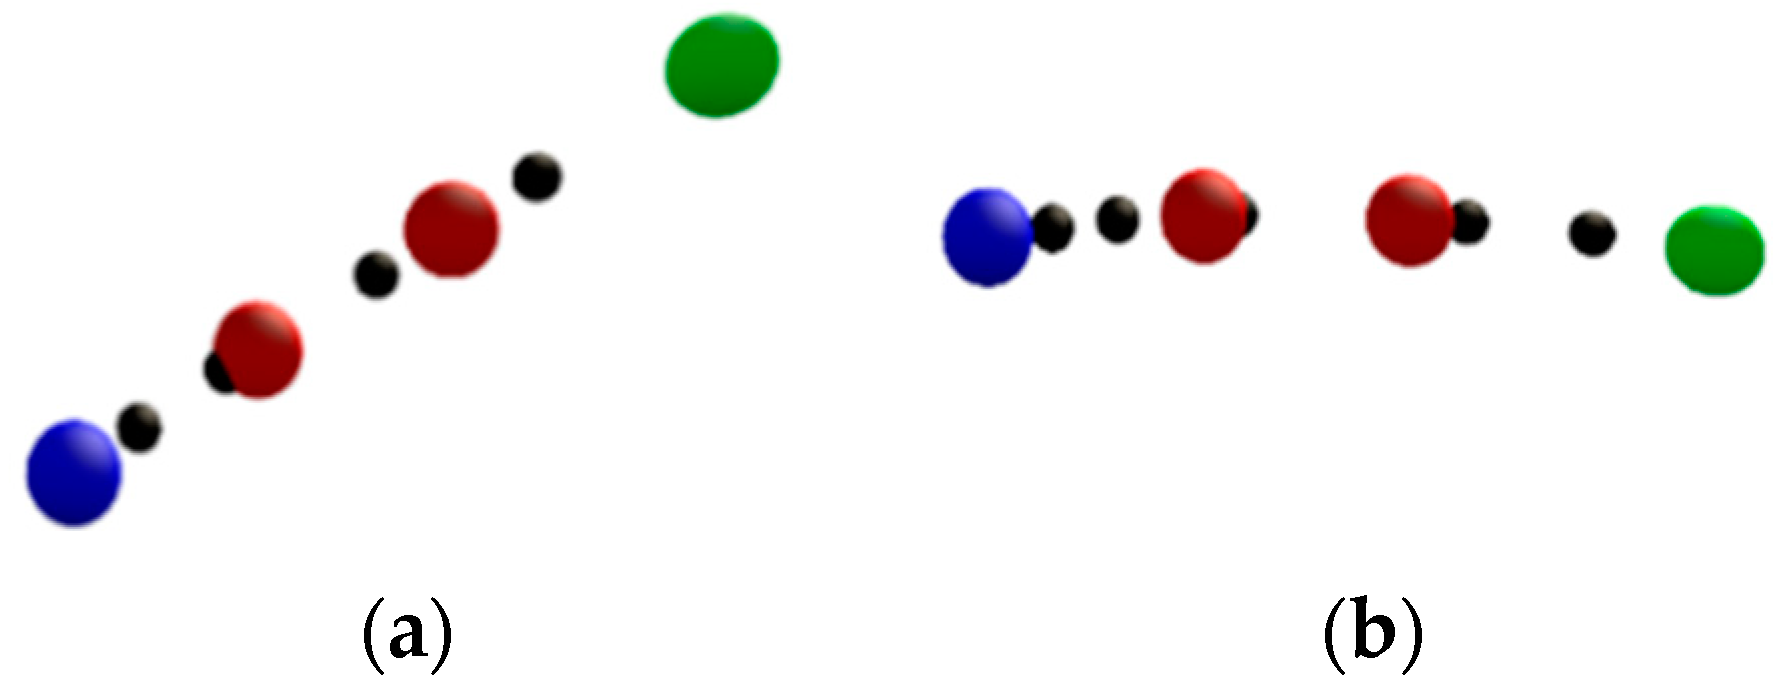
In the final experiment, we performed 100 accuracy tests for each of the 16 recognition targets. Therefore, this experiment was performed a total of 1600 times. The results are as shown in Table 7. In this experiment, the moving speed was random and the data consisted of normal sampling, over-sampling, and under-sampling. The average amount of original data is 22.23 sampling points, and the number of resample data is averaged to 8.03 after processing. The average processing time for resample data after recognition is 0.03395 s. Our processing time was very instant and did not take too much time to complete the recognition. There was almost no delay for the user since there was insignificant calculation time. In addition, the average accuracy rate of our 1600 tests was 99.8%. The recognition failures occurred in “↗” and “→”, respectively. The original data is as shown in Figure 12.
The two data were processed by resample. There were only four data points. Since our recognition targets required at least five data points, there was an error in detection. This means that the user’s total movement distance in the capture data was insufficient. Nonetheless, the accuracy of our method was still strong, with an average of 99.8%.
4. Conclusions
The current application of virtual reality is popular. This industry is at its peak, and we have developed a low-cost recognition method suitable for various user applications. It can be a stand-alone computing mode without the need of the internet. According to our experiment, the calculation time was only 0.03395 s each time and the accuracy rate was 99.8%, which is very suitable for the real-time computing environment. Our method does not require the support of special equipment and can be extended to various application levels. Future research includes focus on text recognition to make the VR application environment more user friendly.
Author Contributions
Conceptualization, C.-W.S.; methodology, C.-W.S., and J.C.; formal analysis, C.-W.S. and Y.-C.C.; investigation, C.-W.S., J.C., and Y.-C.C.; writing—original draft preparation, C.-W.S.; writing—review and editing, C.-W.S., J.C. and Y.-C.C.; supervision, C.-W.S.; project administration, C.-W.S. All authors have read and agreed to the published version of the manuscript.
Funding
This research was funded by Ministry of Science and Technology, Taiwan, 109-2628-E-155-001-MY3. And the APC was funded by Y.-C.C.
Conflicts of Interest
The authors declare no conflict of interest.
References
- Sherman, W.; Craig, A. Understanding Virtual Reality: Interface, Application, and Design; Morgan Kaufmann: Burlington, MA, USA, 2003. [Google Scholar]
- Cecotti, H.; Boumedine, C.; Callaghan, M. Hand-drawn symbol recognition in immersive virtual reality using deep extreme learning machines. In Proceedings of the Recent Trends in Image Processing and Pattern Recognition RTIP2R 2016, Bidar, India, 16–17 December 2016; Communications in Computer and Information Science. Springer: Singapore, 2017; p. 709. [Google Scholar]
- Uzwyshyn, R. Semi-structured and unstructured information systems: Information visualization. In Introduction to Information Science and Technology; Information Today: Medford, NJ, USA, 2011; pp. 100–121. [Google Scholar]
- Uzwyshyn, R.; Smith, A.M.; Coulter, P.; Stevens, C.; Hyland, S. A virtual, globally dispersed twenty-first century academic library system. In The Reference Libraria; Routledge: Abingdon, UK, 2013; pp. 226–235. [Google Scholar]
- Aske, M.; Kasper, H. Virtual reality studies outside the laboratory. In Proceedings of the 23rd ACM Symposium on Virtual Reality Software and Technology, Gothenburg, Sweden, 8–10 November 2017; Volume 9, pp. 1–10. [Google Scholar]
- Bolton, J.; Lambert, M.; Lirette, D.; Unsworth, B. PaperDude: A virtual reality cycling exergame. In Proceedings of the CHI’ 14 Extended Abstracts on Human Factors in Computing Systems, Toronto, ON, Canada, 26 April–1 May 2014; pp. 475–478. [Google Scholar]
- Santosh, K.C.; Wendling, L. Graphical symbol recognition. Wiley Encyclopedia of Electrical and Electronics Engineering; John Wiley Sons Inc.: Hoboken, NJ, USA, 2015. [Google Scholar]
- Keysers, D.; Deselaers, T.; Rowley, H.A.; Wang, L.; Carbune, V. Multi-language online handwriting recognition. IEEE Trans. Pattern Anal. Mach. Intell. 2017, 39, 1180–1194. [Google Scholar] [CrossRef]
- Nagy, G. Twenty years of document image analysis in PAMI. IEEE Trans. Pattern Anal. Mach. Intell. 2000, 22, 38–62. [Google Scholar] [CrossRef]
- Ghosh, D.; Dube, T.; Shivaprasad, A. Script recognition—A review. IEEE Trans. Pattern Anal. Mach. Intell. 2010, 32, 2142–2161. [Google Scholar] [CrossRef] [PubMed]
- Nagy, G. At the frontiers of OCR. Proc. IEEE 1992, 80, 1093–1100. [Google Scholar] [CrossRef]
- Plamondon, R.; Srihari, N.S. On-line and off-line handwritten recognition: A comprehensive survey. IEEE Trans. Pattern Anal. Mach. Intell. 2000, 22, 63–84. [Google Scholar] [CrossRef] [Green Version]
- Liu, C.L.; Nakashima, K.; Sako, H.; Fujisawa, H. Handwritten digit recognition: Benchmarking of state-of-the-art techniques. Pattern Recognit. 2003, 36, 2271–2285. [Google Scholar] [CrossRef]
- Park, J. Emotional reactions to the 3D virtual body and future willingness: The effects of self-esteem and social physique anxiety. Virtual Real. 2018, 22, 1–11. [Google Scholar] [CrossRef]
- Weech, S.; Kenny, S.; Barnett-Cowan, M. Presence and cybersickness in virtual reality are negatively related: A review. Front. Psychol. 2019, 10, 158. [Google Scholar] [CrossRef] [PubMed] [Green Version]
- Huygelier, H.; Schraepen, B.; Ee, R.V.; Abeele, V.V.; Gillebert, C.R. Acceptance of immersive head-mounted virtual reality in older adults. Sci. Rep. 2019, 9, 4519. [Google Scholar] [CrossRef] [Green Version]
- Makransky, G.; Terkildsen, T.S.; Mayer, R.E. Adding immersive virtual reality to a science lab simulation causes more presence but less learning. Learn. Instr. 2019, 60, 225–236. [Google Scholar] [CrossRef]
- Hassan, R. Digitality, virtual reality and the ‘empathy machine’. Digit. J. 2020, 8, 195–212. [Google Scholar] [CrossRef]
Figure 1.
Eight signs of the symbol direction for recognition.

Figure 2.
Schematic diagram of 2D mapping. (a) the relationship between the original data and the helmet, (b) remove the helmet rotation and position status and (c) results of removing z-axis information.
Figure 2.
Schematic diagram of 2D mapping. (a) the relationship between the original data and the helmet, (b) remove the helmet rotation and position status and (c) results of removing z-axis information.

Figure 3.
Conceptual image of the virtual screen.

Figure 4.
The normalization processes. (a) Before normalization and (b) after normalization.

Figure 5.
Diagram of over-sampling and under-sampling.

Figure 6.
The diagram for the resampling.

Figure 7.
The diagram of eigenvalue detection. (a) invalid collisions and (b) successful collisions.
Figure 7.
The diagram of eigenvalue detection. (a) invalid collisions and (b) successful collisions.

Figure 8.
Eight recognition targets.

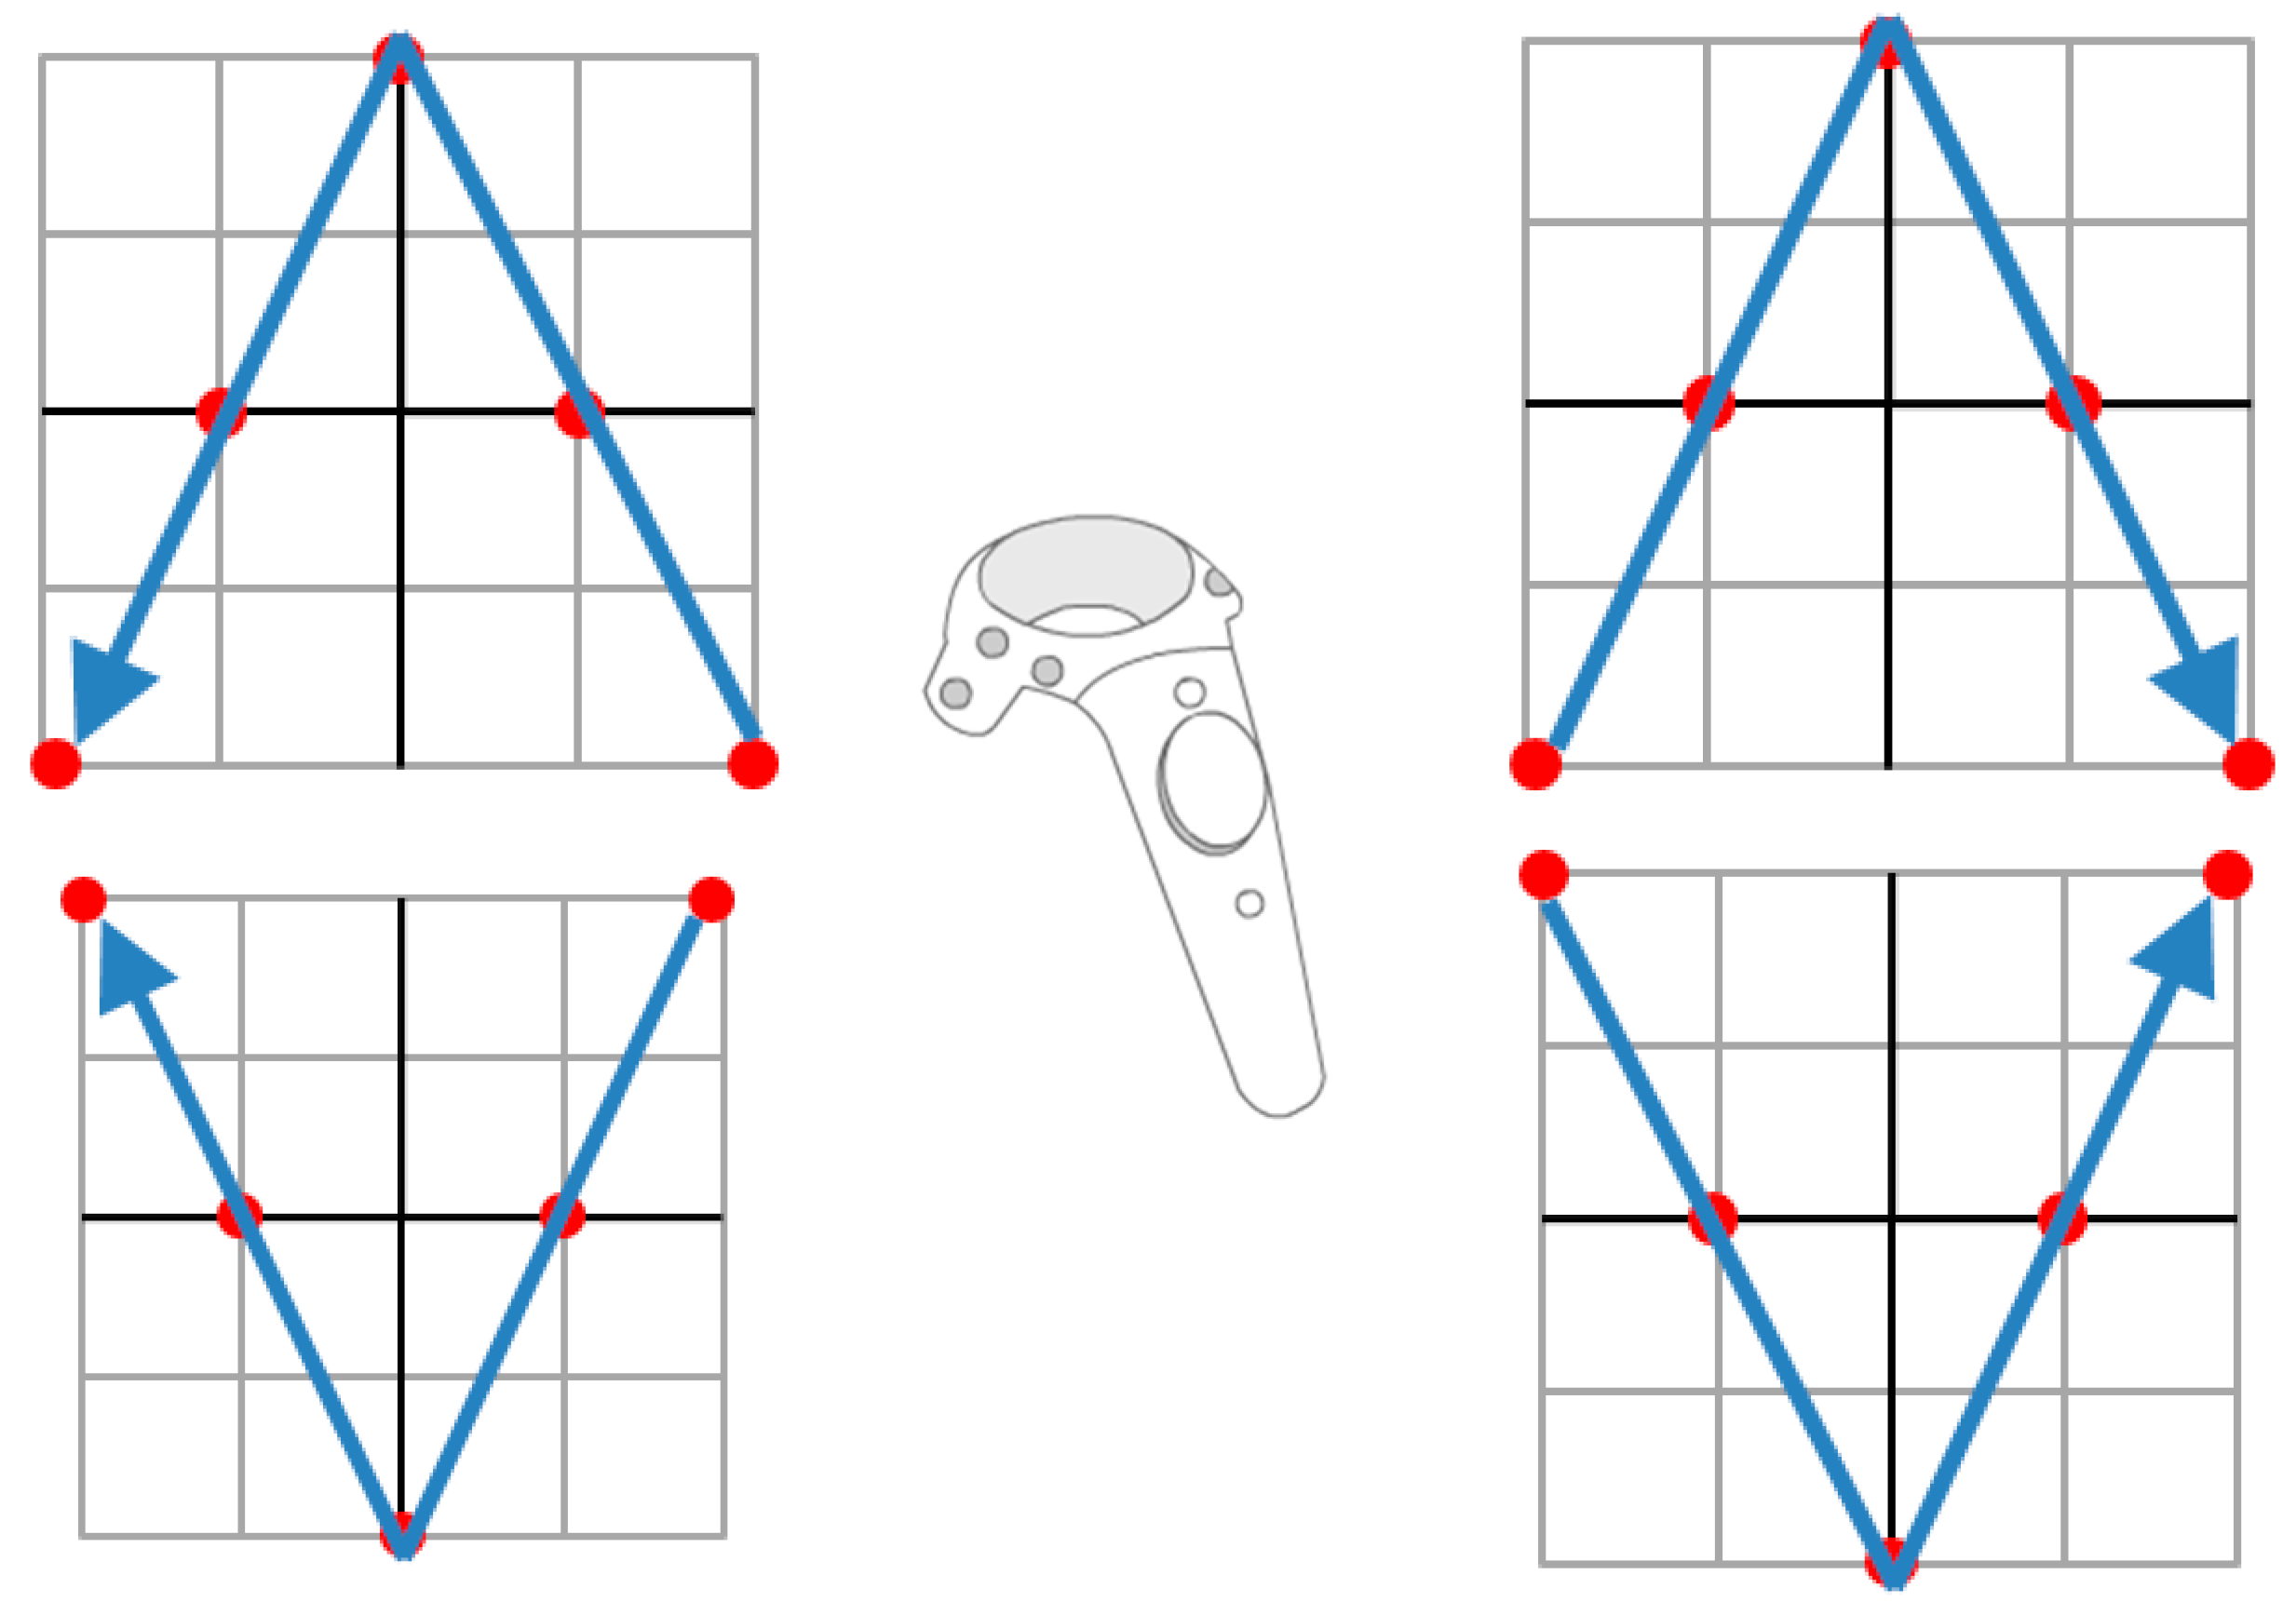
Figure 9.
Four recognition targets for vertical V-shaped recognition targets.

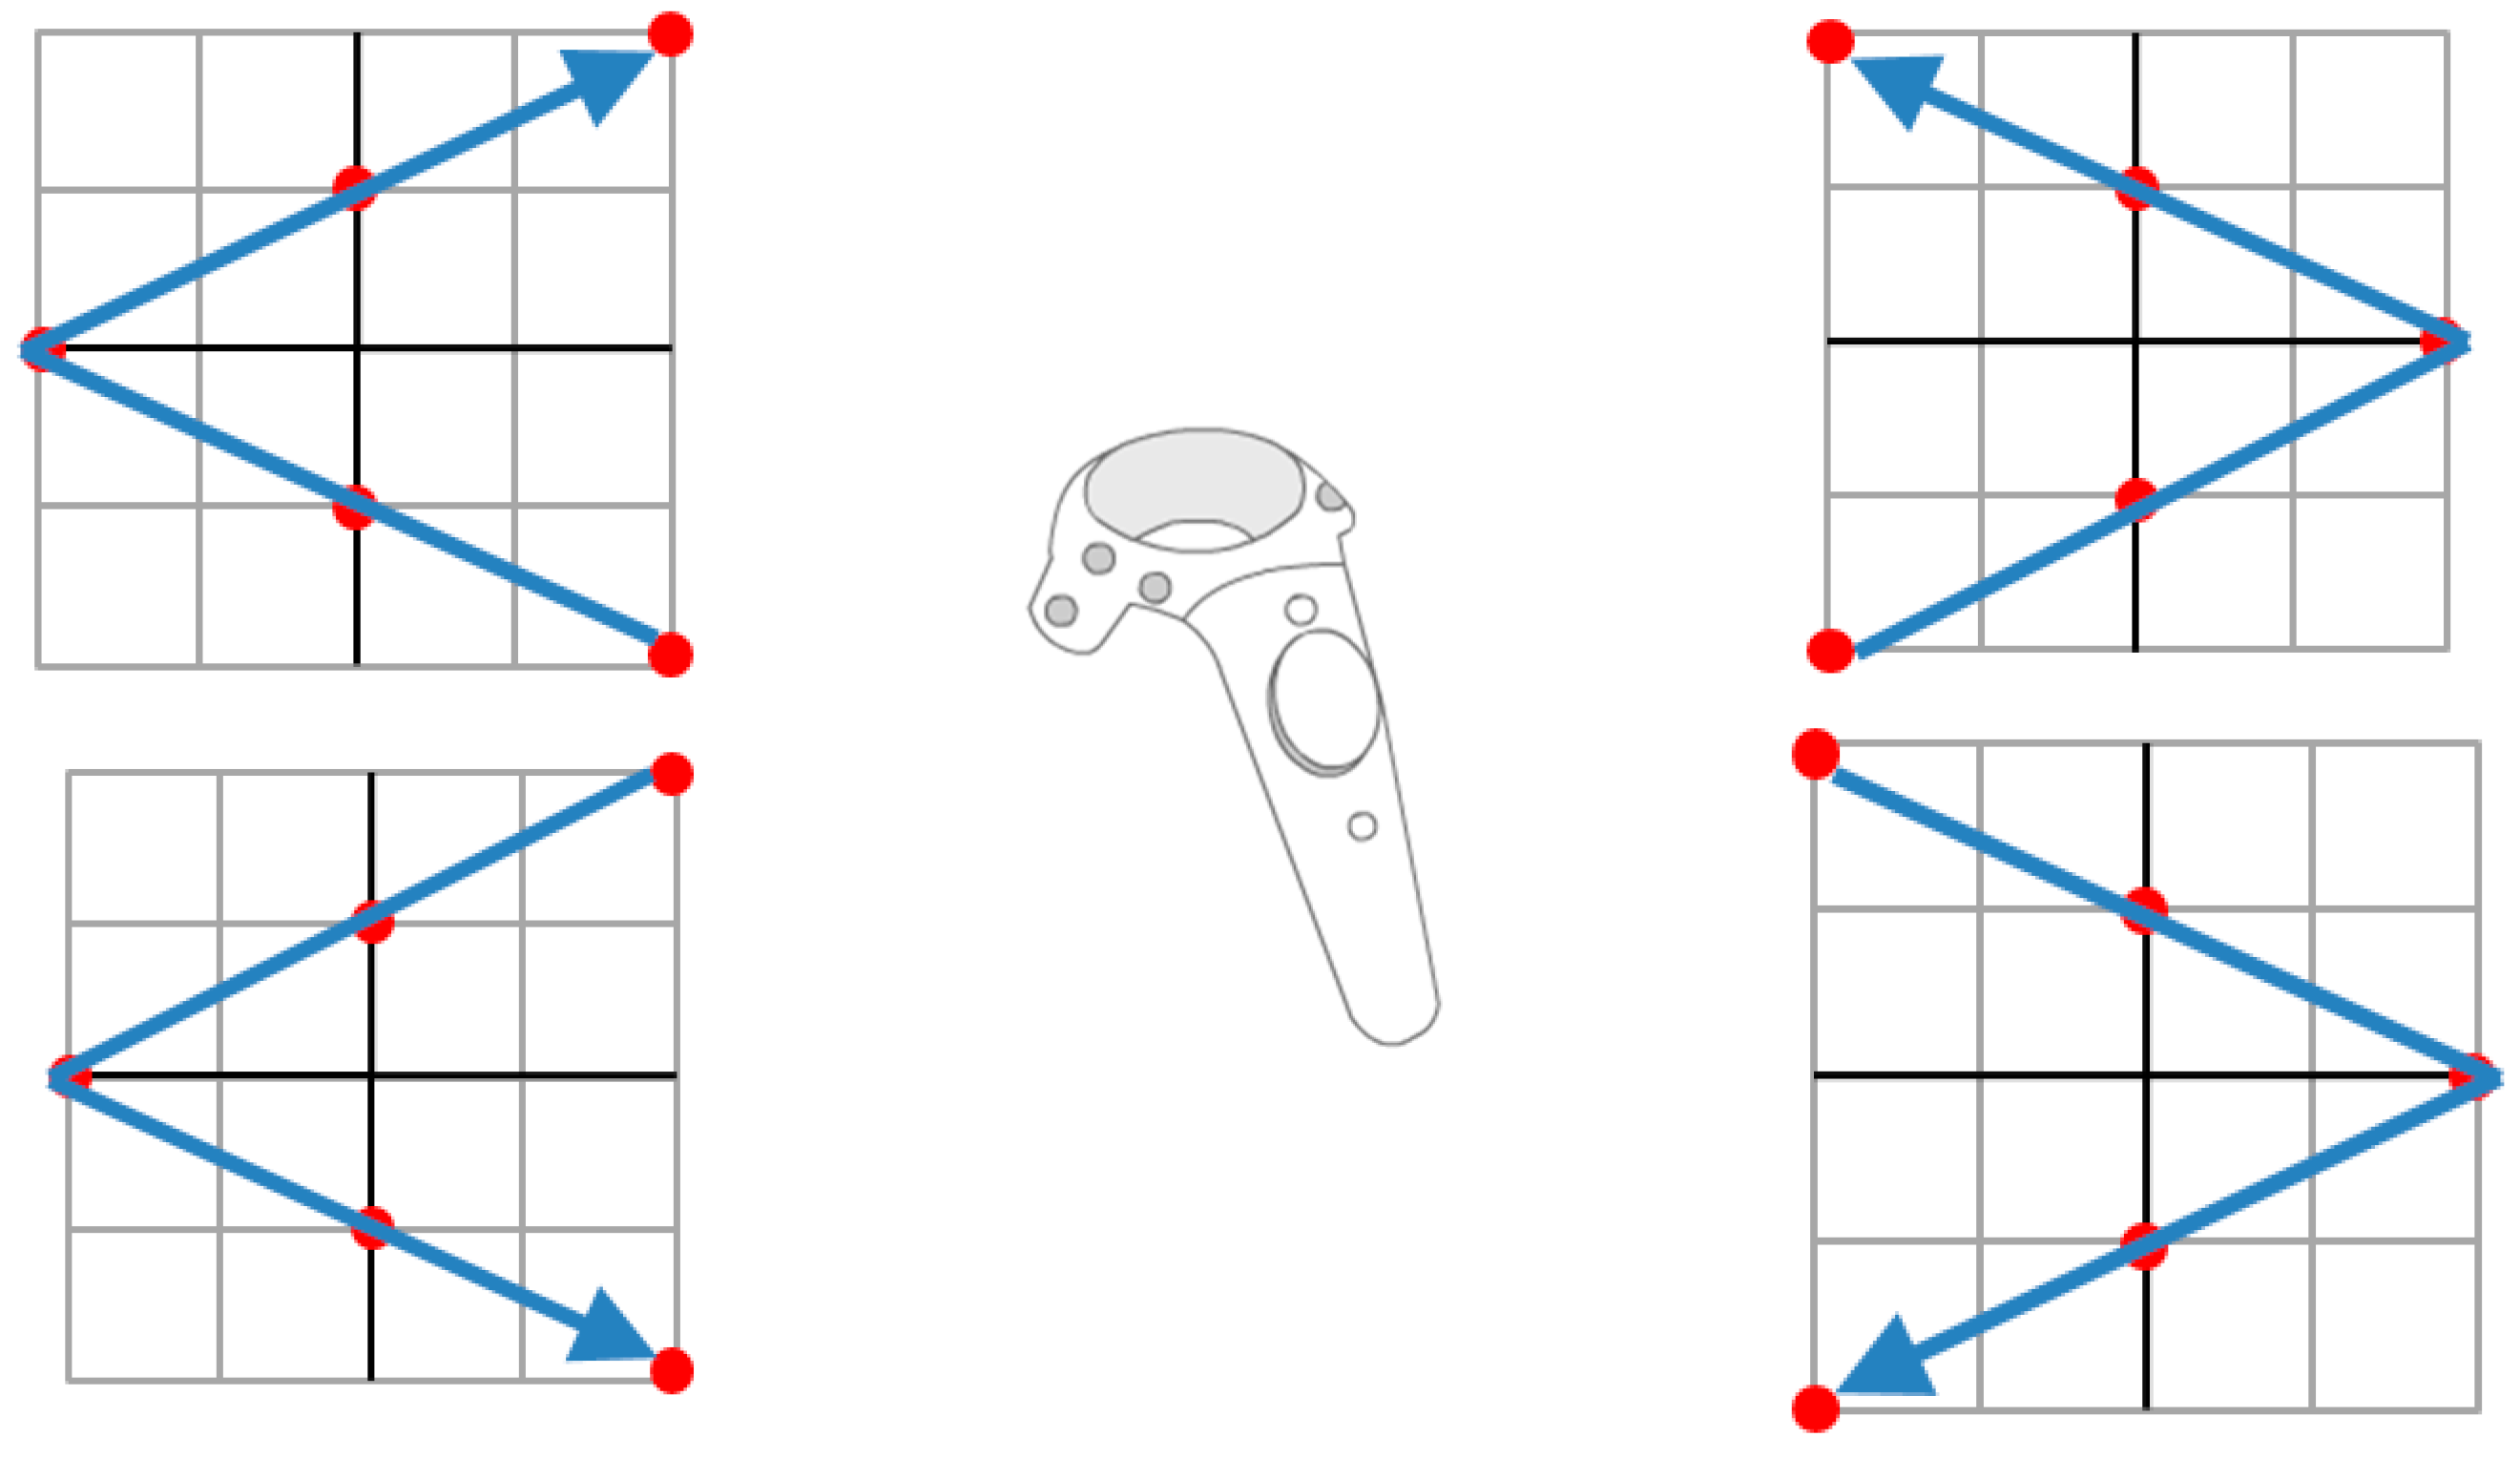
Figure 10.
Four recognition targets for horizontal V-shaped recognition targets.

Figure 11.
Recognition time for different moving speeds. (a) Normal-sampling; (b) over-sampling; and (c) under-sampling.
Figure 11.
Recognition time for different moving speeds. (a) Normal-sampling; (b) over-sampling; and (c) under-sampling.

Figure 12.
The data with recognition errors in “↗” and “→”.


Table 1.
Details of eight recognition targets.
| IDs | Target | Data |
|---|---|---|
| 1 | ↖ | {1,−1}, {0.5, −0.5}, {0,0}, {−0.5,1}, {−1,1} |
| 2 | ↑ | {0,−1}, {0,−0.5}, {0,0}, {0,0.5}, {0,1} |
| 3 | ↗ | {−1,−1}, {−0.5,−0.5}, {0,0}, {0.5,0.5}, {1,1} |
| 4 | ← | {1,0}, {0.5,0}, {0,0}, {−0.5,0}, {−1,0} |
| 5 | → | {−1,0}, {−0.5,0}, {0,0}, {0.5,0}, {1,0} |
| 6 | ↙ | {1,1}, {0.5,0.5}, {0,0}, {−0.5,−0.5}, {−1,-1} |
| 7 | ↓ | {0,1}, {0,0.5}, {0,0}, {0,−0.5}, {0,−1} |
| 8 | ↘ | {−1,1}, {−0.5,1}, {0,0}, {0.5,−0.5}, {1,−1} |
Table 2.
Details of four recognition targets for vertical V-shapes.
| IDs | Target | Data |
|---|---|---|
| 9 | ↙↖ | {1,−1}, {0.5,0}, {0,1}, {−0.5,0}, {−1,−1} |
| 10 | ↗↘ | {−1,−1}, {−0.5,0}, {0,1}, {0.5,0}, {1,−1} |
| 11 | ↖↙ | {1,1}, {0.5,0}, {0,−1}, {−0.5,0}, {−1,1} |
| 12 | ↘↗ | {−1,1}, {−0.5,0}, {0,−1}, {0.5,0}, {1,1} |
Table 3.
Details of four recognition targets for horizontal V-shapes.
| IDs | Target | Data |
|---|---|---|
| 13 | ↗ ↖ | {1,−1}, {0,−0.5}, {−1,0}, {0,0.5}, {1,1} |
| 14 | ↙ ↘ | {−1,−1}, {0,−0.5}, {1,0}, {0,0.5}, {−1,1} |
| 15 | ↗ ↖ | {1,1}, {0,0.5}, {−1,0}, {0,−0.5}, {1,−1} |
| 16 | ↙ ↘ | {−1,1}, {0,0.5}, {1,0}, {0,−0.5}, {−1,−1} |
Table 4.
Recognition result at normal sampling.
| Original & Resample Data | Detect Result | Original & Resample Data | Detect Result | ||
|---|---|---|---|---|---|
 | ↖ |  | ↙↖ | ||
 | ↑ |  | ↗↘ | ||
 | ↗ |  | ↖↙ | ||
 | ← |  | ↘↗ | ||
 | → |  | ↗↖ | ||
 | ↙ |  | ↖↗ | ||
 | ↓ |  | ↙↘ | ||
 | ↘ |  | ↘↙ |
Table 5.
Recognition result at over-sampling.
| Original & Resample Data | Detect Result | Original & Resample Data | Detect Result | ||
|---|---|---|---|---|---|
 | ↖ |  | ↙↖ | ||
 | ↑ |  | ↗↘ | ||
 | ↗ |  | ↖↙ | ||
 | ← |  | ↘↗ | ||
 | → |  | ↗↖ | ||
 | ↙ |  | ↘↙ | ||
 | ↓ |  | ↖↗ | ||
 | ↘ |  | ↘↙ |
Table 6.
Recognition result at under-sampling.
| Original & Resample Data | Detect Result | Original & Resample Data | Detect Result | ||
|---|---|---|---|---|---|
 | ↖ |  | ↙↖ | ||
 | ↑ |  | ↗↘ | ||
 | ↗ |  | ↖↙ | ||
 | ← |  | ↘↗ | ||
 | → |  | ↗↖ | ||
 | ↙ |  | ↖↗ | ||
 | ↓ |  | ↙↘ | ||
 | ↘ |  | ↘↙ |
Table 7.
The result of 16 kinds of recognition targets executed 100 times.
| Target | Original Data Number | Resample Number | Recognition Time | Correct Rate |
|---|---|---|---|---|
| ↖ | 14.68 | 7.30 | 0.04893 | 100% |
| ↑ | 13.56 | 7.11 | 0.04569 | 100% |
| ↗ | 14.98 | 5.97 | 0.03861 | 99% |
| ← | 17.05 | 7.34 | 0.04703 | 100% |
| → | 17.09 | 7.11 | 0.02608 | 99% |
| ↙ | 14.43 | 6.17 | 0.02337 | 100% |
| ↓ | 19.92 | 6.72 | 0.02115 | 100% |
| ↘ | 12.23 | 6.82 | 0.02462 | 100% |
| ↙↖ | 28.38 | 9.42 | 0.03006 | 100% |
| ↗↘ | 26.91 | 8.95 | 0.02954 | 100% |
| ↖↙ | 27.42 | 9.75 | 0.04010 | 100% |
| ↘↗ | 34.75 | 9.35 | 0.02808 | 100% |
| ↗ ↖ | 33.45 | 9.95 | 0.03589 | 100% |
| ↖ ↗ | 32.43 | 9.17 | 0.03216 | 100% |
| ↙ ↘ | 21.86 | 9.26 | 0.03348 | 100% |
| ↘ ↙ | 26.55 | 8.13 | 0.03849 | 100% |
| Avg. | 22.23 | 8.03 | 0.03395 | 99.8% |
Publisher’s Note: MDPI stays neutral with regard to jurisdictional claims in published maps and institutional affiliations. |
© 2020 by the authors. Licensee MDPI, Basel, Switzerland. This article is an open access article distributed under the terms and conditions of the Creative Commons Attribution (CC BY) license (http://creativecommons.org/licenses/by/4.0/).
Share and Cite
MDPI and ACS Style
Shiu, C.-W.; Chen, J.; Chen, Y.-C. Low-Cost Online Handwritten Symbol Recognition System in Virtual Reality Environment of Head-Mounted Display. Mathematics 2020, 8, 1967. https://0-doi-org.brum.beds.ac.uk/10.3390/math8111967
AMA Style
Shiu C-W, Chen J, Chen Y-C. Low-Cost Online Handwritten Symbol Recognition System in Virtual Reality Environment of Head-Mounted Display. Mathematics. 2020; 8(11):1967. https://0-doi-org.brum.beds.ac.uk/10.3390/math8111967
Chicago/Turabian StyleShiu, Chih-Wei, Jeanne Chen, and Yu-Chi Chen. 2020. "Low-Cost Online Handwritten Symbol Recognition System in Virtual Reality Environment of Head-Mounted Display" Mathematics 8, no. 11: 1967. https://0-doi-org.brum.beds.ac.uk/10.3390/math8111967
Note that from the first issue of 2016, this journal uses article numbers instead of page numbers. See further details here.