Fuzzy Cognitive Maps Optimization for Decision Making and Prediction


1
Department of Information Systems, Kielce University of Technology, 25-314 Kielce, Poland
2
Department of Energy Systems, Faculty of Technology, University of Thessaly, Geopolis Campus, GR 41500 Larissa, Greece
3
Department of Digital Systems, Faculty of Technology, University of Thessaly, Geopolis Campus, GR 41500 Larissa, Greece
*
Authors to whom correspondence should be addressed.
Mathematics 2020, 8(11), 2059; https://0-doi-org.brum.beds.ac.uk/10.3390/math8112059
Submission received: 19 October 2020
/
Revised: 10 November 2020
/
Accepted: 13 November 2020
/
Published: 18 November 2020
(This article belongs to the Special Issue Applications of Fuzzy Optimization and Fuzzy Decision Making)
Abstract
:Representing and analyzing the complexity of models constructed by data is a difficult and challenging task, hence the need for new, more effective techniques emerges, despite the numerous methodologies recently proposed in this field. In the present paper, the main idea is to systematically create a nested structure, based on a fuzzy cognitive map (FCM), in which each element/concept at a higher map level is decomposed into another FCM that provides a more detailed and precise representation of complex time series data. This nested structure is then optimized by applying evolutionary learning algorithms. Through the application of a dynamic optimization process, the whole nested structure based on FCMs is restructured in order to derive important relationships between map concepts at every nesting level as well as to determine the weights of these relationships on the basis of the available time series. This process allows discovering and describing hidden relationships among important map concepts. The paper proposes the application of the suggested nested approach for time series forecasting as well as for decision-making tasks regarding appliances’ energy consumption prediction.
1. Introduction
In recent years, fuzzy cognitive maps (FCMs) have become increasingly popular [1]. An FCM can be defined as a type of recurrent neural network, carrying the main aspects of fuzzy logic. An FCM allows mimicking a system or a phenomenon with the use of key concepts and causal relationships among them. FCM models are suitable and particularly useful for modeling and decision-making in the case of complex systems. They have been used in various application domains, e.g., for pattern recognition [2], in risk analysis and crisis management [3], as a decision support tool for political decisions [4], to model an undersea virtual world of dolphins, fish, and sharks [5], for sustainable socio-economic development planning [6], and to support the decision- making process for photovoltaic solar energy sector development [7].
FCMs have also been proved as an effective technique for numerical [8] and linguistic [9] forecasting of time series. In Reference [10], a novel approach based on FCMs and a granular fuzzy set-based model of inputs were proposed for realizing time series prediction at the linguistic and numerical levels. In Reference [11], a methodology that joins FCMs with a moving window approach to time series prediction was developed. The simulation analysis was performed on three different time series datasets: rainfall in London, number of births per month in New York City, and Campito tree rings. In Reference [12], the analysis of FCMs usage was focused to predict water demand based on historical time series. In addition, recently there have been some novel approaches in the literature attempting to solve time series prediction problems by combining FCMs with neural networks [13,14].
The initial information of an FCM model is based either on expert knowledge or by using learning algorithms. In standard methods of FCM learning, concepts are chosen by experts or selected based on all available data attributes. An enormous amount of data and a big number of concepts may complicate analysis and decision-making. In this direction, various modifications to standard methods have been applied aiming to simplify FCM models by reducing the number of concepts [14,15,16] and the connections between them [17,18]. These approaches allow obtaining a balance between data accuracy and model readability. To reduce the complexity and increase the readability of FCMs with a large number of concepts, clustering methods have been used with the aim to combine similar concepts based on their dynamic behavior. The related studies have been carried out on ready-made models of FCMs: FCMs initialized by experts [19] or constructed based on data [6]. Simplifying models, by reducing the number of concepts as well as clustering them, allows the creation of legible structures more similar to those created by humans, and making FCMs easier to be analyzed. In the case of a large number of concepts, a decision-making and analysis problem can be described in the form of a nested FCM that allows for a more readable representation of knowledge than the classic FCM [5]. For example, in Reference [20], this type of structure was used to evaluate water quality failures. Nested FCMs could help to understand the underlying problem, support the user to choose at what level of detail he/she wants to analyze the problem of interest, and represent complex systems in a more accurate way. Such an approach, as regards the FCMs construction, can provide more readable and easier to interpret structures, which are closer to human reasoning and inference.
The aim of the current study is to develop an approach for constructing a nested FCM-based structure that will represent a problem’s complex data in a more elaborate way. The suggested approach involves the decomposition of each concept at a higher map level into another FCM. The first stage of the proposed methodology is to cluster concepts (data attributes) based on similarities between them with the use of the k-means clustering approach [21]. Next, two popular evolutionary algorithms for learning FCMs (i.e., the Real-Coded Genetic Algorithm (RCGA) [22] and the Structure Optimization Genetic Algorithm (SOGA) [12]) are applied to find important relationships between concepts at every nesting level and determine weights of these relationships on the basis of the available data. The paper recommends applying the proposed nested approach for time series forecasting as well as for decision-making tasks in the field of appliances’ energy consumption prediction.
Specifically, energy use forecasting has a vital role in energy planning and energy consumption reduction. As energy costs increase, more effective tools are needed to analyze, manage, and propose energy use reduction and optimization [23]. In Reference [24], support vector machines have been deployed for energy consumption prediction in buildings, while in Reference [25], various regression models were utilized for energy prediction, including multiple linear regression, support vector machines with radial kernel, random forests, and gradient boosting machines. Gradient boosting machines and random forests outperformed the multiple linear regression and support vector machines with the radial kernel, in terms of achieving lower forecasting errors. Additionally, artificial neural network (ANN), autoregressive integrated moving average (ARIMA), and multiple linear regression (MLR) models were used in Reference [26] for energy consumption prediction. In Reference [27], a deep learning model based on an autoencoder was developed that predicts future energy demand according to different situations.
Moreover, evolutionary FCMs have recently found significant applicability in energy forecasting and optimization. For example, in Reference [14], historical time series involving energy consumption data were utilized along with the application of the Structure Optimization Genetic Algorithm (SOGA) [12] for the automatic construction of an evolutionary FCM. SOGA is an extension of the Real-Coded Genetic Algorithm (RCGA) [28], which provided the decision-makers with the ability to identify the most significant concepts of an examined system and the corresponding relationships among them. Considering any available historical data, FCM models can be automatically produced and optimized with the help of the SOGA algorithm application. For example, a two-stage prediction model for forecasting was introduced in Reference [14], which exploits the competent characteristics of evolutionary FCMs enriched with those of SOGA and ANNs. Recently, in Reference [13], a new ensemble-based forecasting approach was proposed for time series analysis, which deals with the problem of natural gas demand prediction, case studying three major cities in Greece. In this study, the outstanding capabilities of FCMs and ANNs were highlighted, through the investigation of an ensemble of the related methods, applied to multivariate time series prediction in natural gas demand forecasting. Moreover, in Reference [29], an approach based on high order FCMs and high order fuzzy time series was developed to predict solar energy. Public data from Brazilian solar stations, from the year 2012 to 2015, were used in simulations. The produced results confirmed the usefulness of the developed approach.
Traditional energy prediction models mainly focus on the prediction accuracy; however, it is also important to determine and monitor various other variables (concepts) that affect energy consumption in order to better understand the energy use behavior and find ways to reduce it. The innovation of the present work lies on the following issues that highlight the research contribution of the article:
- The paper suggests the construction of an efficient FCM-based nested structure in which each concept at a higher map level can be decomposed into another more detailed FCM for analyzing complex data. The proposed approach for optimizing the FCM nested structure is characterized by high performance and flexibility, especially in problems with a large number of variables/concepts.
- The paper proposes the application of the rigorous SOGA algorithm to fine-tune and determine the most appropriate nested FCM architecture aiming at an enhanced prediction performance. Implementing SOGA algorithms allowed the authors to optimize the nested structure by selecting the most significant concepts from all possible concepts at every nesting level.
A simulation analysis regarding the utilization of the nested structure based on FCMs in appliances energy use prediction has been also performed. To evaluate the performance of the developed approach, a detailed comparison between the nested FCM and the standard FCM was conducted. The experiments were performed with the use of an appliances’ energy consumption prediction dataset [25].
The outline of the paper is as follows. Section 2 describes an overview of the FCM method. In Section 3, the proposed approach for constructing a nested structure based on FCMs is described. Section 4 presents the simulation analysis results, which were obtained from applying the proposed approach to an appliances’ energy prediction dataset. The section also presents a comparative analysis between the proposed technique and the standard FCM in terms of forecasting performance. Section 5 presents a discussion of the results as well as summarizes the main conclusions of the paper.
2. Fuzzy Cognitive Maps Overview
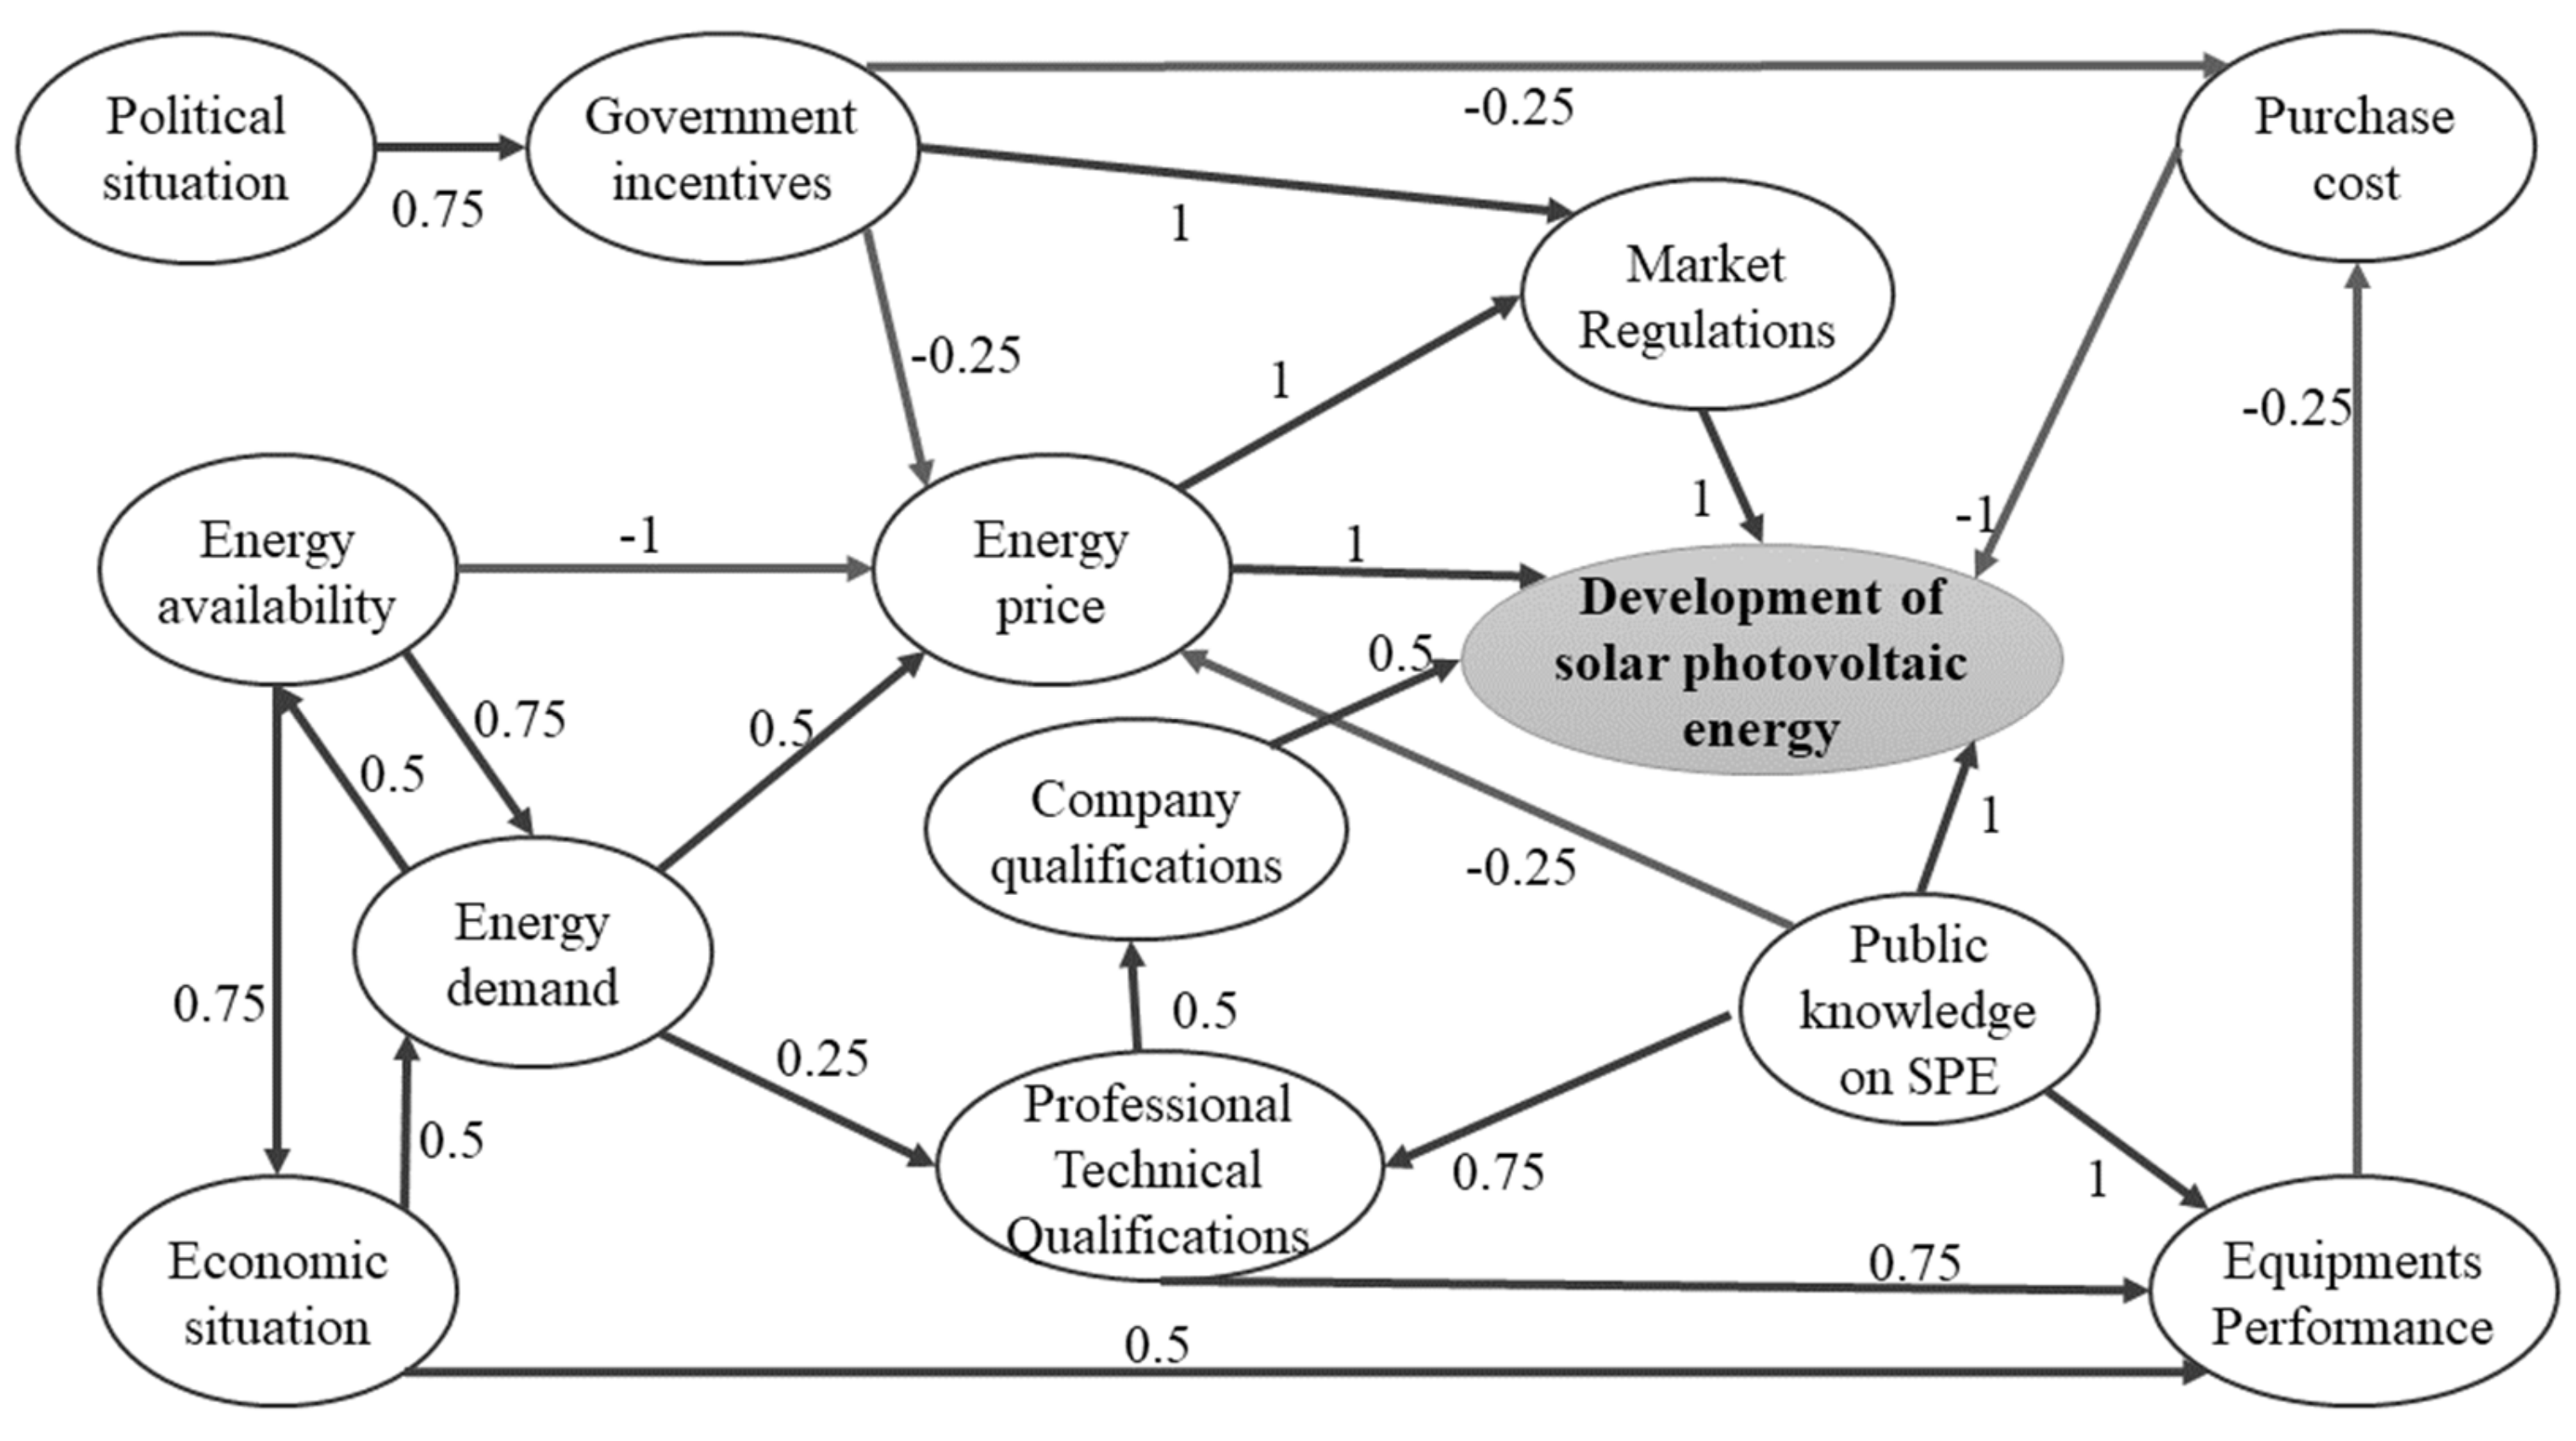
A fuzzy cognitive map (FCM) has the form of a knowledge graph consisting of nodes (concepts) and links among them [1]. The concepts are nonlinear and represent variables in a causal system. They can take values in the range [0, 1]. The directed links that define the relationships between concepts can be positive or negative taking values between [−1,1]. Figure 1 presents an example of an FCM for exploring the development of the photovoltaic solar energy sector in Brazil [30], in economic and political terms.
Due to the causal nature of the relationships between the concepts, FCMs are an effective tool for modeling decision support systems and time series prediction. Concepts’ values undergo a change over time due to the dynamics of the model. In the current research study, the following popular nonlinear dynamics model is applied to calculate the values of concepts:
where is the value of the i-th concept at the t-th iteration of the FCM execution, t is discrete time, i,j = 1, 2, …, n, n is the number of concepts, is the weight that determines the linkage strength between the j-th concept and the i-th concept taking value in the interval [−1,1], and F(x) is the sigmoidal transformation function normalizing the concept values to the range [0,1]. Certain concepts can be defined as decision (output) concepts that should be excluded from further analysis.
FCMs can be created taking into account the experts’ knowledge or using machine learning algorithms. FCM learning aims at the determination of the weights of the existing linkages between concepts where data are available. Among the FCM learning methods is the Real-Coded Genetic Algorithm (RCGA) [10,22], in which each individual in a population is determined according to a floating-point vector that contains the weights of the connections (linkages) between concepts. Each individual is then decoded into an FCM model and a fitness function, as described below, is used for its evaluation [10,22]:
where p is the number of an individual in the population, p = 1, …, P, P is the population size, l is the number of a generation, l = 1, …, L, L is the maximum number of generations, is a parameter, and is the learning error that can be described as follows:
where t = 1, …, T, T is the number of learning records, is the forecasted value of the decision (output) concept at the t-th iteration, and is the actual normalized value of the decision (output) concept at the t-th iteration.
The Structure Optimization Genetic Algorithm (SOGA) constitutes a partial extension of the RCGA algorithm [28]. SOGA allows optimizing the structure of an FCM, during its learning process, by selecting the most significant concepts and the relationships between them. Each individual in SOGA is represented by a floating-point vector containing the weights of the relationships between concepts and by a binary vector of size n containing the information about the concepts incorporated into the candidate FCM model. The evaluation of a candidate FCM is based on a new learning error. A large number of concepts and the non-zero relationships between them increase the FCM complexity providing an additional penalty. The learning error is given by the following function [28]:
where is the learning error type, , are the learning parameters, is the number of the existing linkages between concepts, is the number of the concepts in the analyzed fuzzy cognitive map, and is the number of all possible concepts.
3. The Proposed Approach for Constructing Nested Structure Based on Fuzzy Cognitive Maps
This section describes the proposed approach for constructing a nested FCM structure in which each concept of a higher level can be decomposed into another FCM model illustrating a more detailed image of complex data.
3.1. Data Clustering
The first stage of the proposed approach is to cluster data attributes (concepts) based on the similarity between their values with the use of k-means clustering [21]. It contains the following steps:
- Determine the number of clusters K via trial and error.
- Set the output concept as a separate cluster.
- Initialize cluster centers from available data attributes (excluding the output concept).
- Calculate the distance between concepts values and cluster centers based on the Euclidean distance:where t = 1, …, T, T is the number of records, is the value of concept A at the t-th iteration, and is the value of cluster center C at the t-th iteration. The output concept is omitted in this step.
- Assign concepts to the closest cluster center.
- Update the cluster centers based on the values assigned to them.
- Repeat steps 4–6 until convergence.
3.2. Constructing the First Level of the Nested Structure
The next stage of the proposed approach regards the construction of the most general level of the nested structure (i.e., the first level of the nested structure). It contains the following steps:
- For each cluster, calculate the average values for concepts within one group according to the following formula:where t = 1, …, T, T is the number of records, is the general value of the k-th cluster at the t-th iteration, k = 1, …, K, K is the number of clusters, is the value of the i-th concept assigned to the k-th cluster at the t-th iteration, and i = 1, …, , is the number of concepts assigned to the k-th cluster.
- Normalize the calculated values into the interval [0,1] using the standard min–max normalization.
- Divide the averaged normalized data into learning records and testing records.
- Initialize the general FCM with K concepts based on the clustered data attributes.
- Learn the general FCM with the use of the RCGA and SOGA algorithms based on learning records in order to determine the relationships between concepts at the first level of the nested structure.
3.3. Constructing the FCM Models for the Second Level of the Nested Structure
The next stage of the proposed approach is to construct the FCM models at the second level of the nested structure (i.e., the more detailed level of the nested structure). A separate FCM model is constructed for each cluster (excluding the cluster that corresponds to the output concept) and is used to predict the output concept. If the first level is sufficient for a given concept, it does not have to be decomposed into another FCM at the second level. The values for the output concept based on the k-th FCM model (i.e., the k-th cluster) are calculated according to the following formula:
where is the value of the output concept at the t-th iteration, t = 1, …, T, T is the number of learning records, i = 1, 2, …, , is the number of concepts assigned to the k-th cluster, is the weight that determines the strength of the relationship between the i-th concept and the output concept in the k-th FCM model, is the value of the i-th concept in the k-th FCM model, j = 1, 2, …, , is the number of clusters, is the weight that determines the strength of the relationship between the j-th general concept (cluster j) and the output concept in the k-th FCM model, and is the value of the j-th general concept of the first level at the t-th iteration.
The learning process of the FCM models at the second level is achieved with the use of the RCGA and SOGA algorithms considering learning records, in order to determine the relationships between concepts at the second level of the nested structure [14]. In the case of a large number of concepts in individual FCM models at the second level, we can further extend the nested FCM by another level.
3.4. Calculating the Forecasted Values for the Second Level of the Nested Structure
Additionally, the FCM models from the second level of the nested structure are proposed to be used for the calculation of the forecasted values of the output concept (at the second level). The simple average method was used to calculate the forecasted values of the output concept based on values generated by the FCM models belonging to the second level. This method assigns the same weight to every single model [31], whereas it can improve the average accuracy when increasing the number of the combined single models.
3.5. Testing and Evaluation
The evaluation of the resulting models is accomplished with the use of testing data, which are unknown to the models. In order to evaluate the one-step-ahead prediction, three common statistical indicators were used: mean square error (MSE), root mean square error (RMSE), and mean absolute error (MAE), whose mathematical equations are described below:
- Mean Squared Error:
- Root Mean Squared Error:
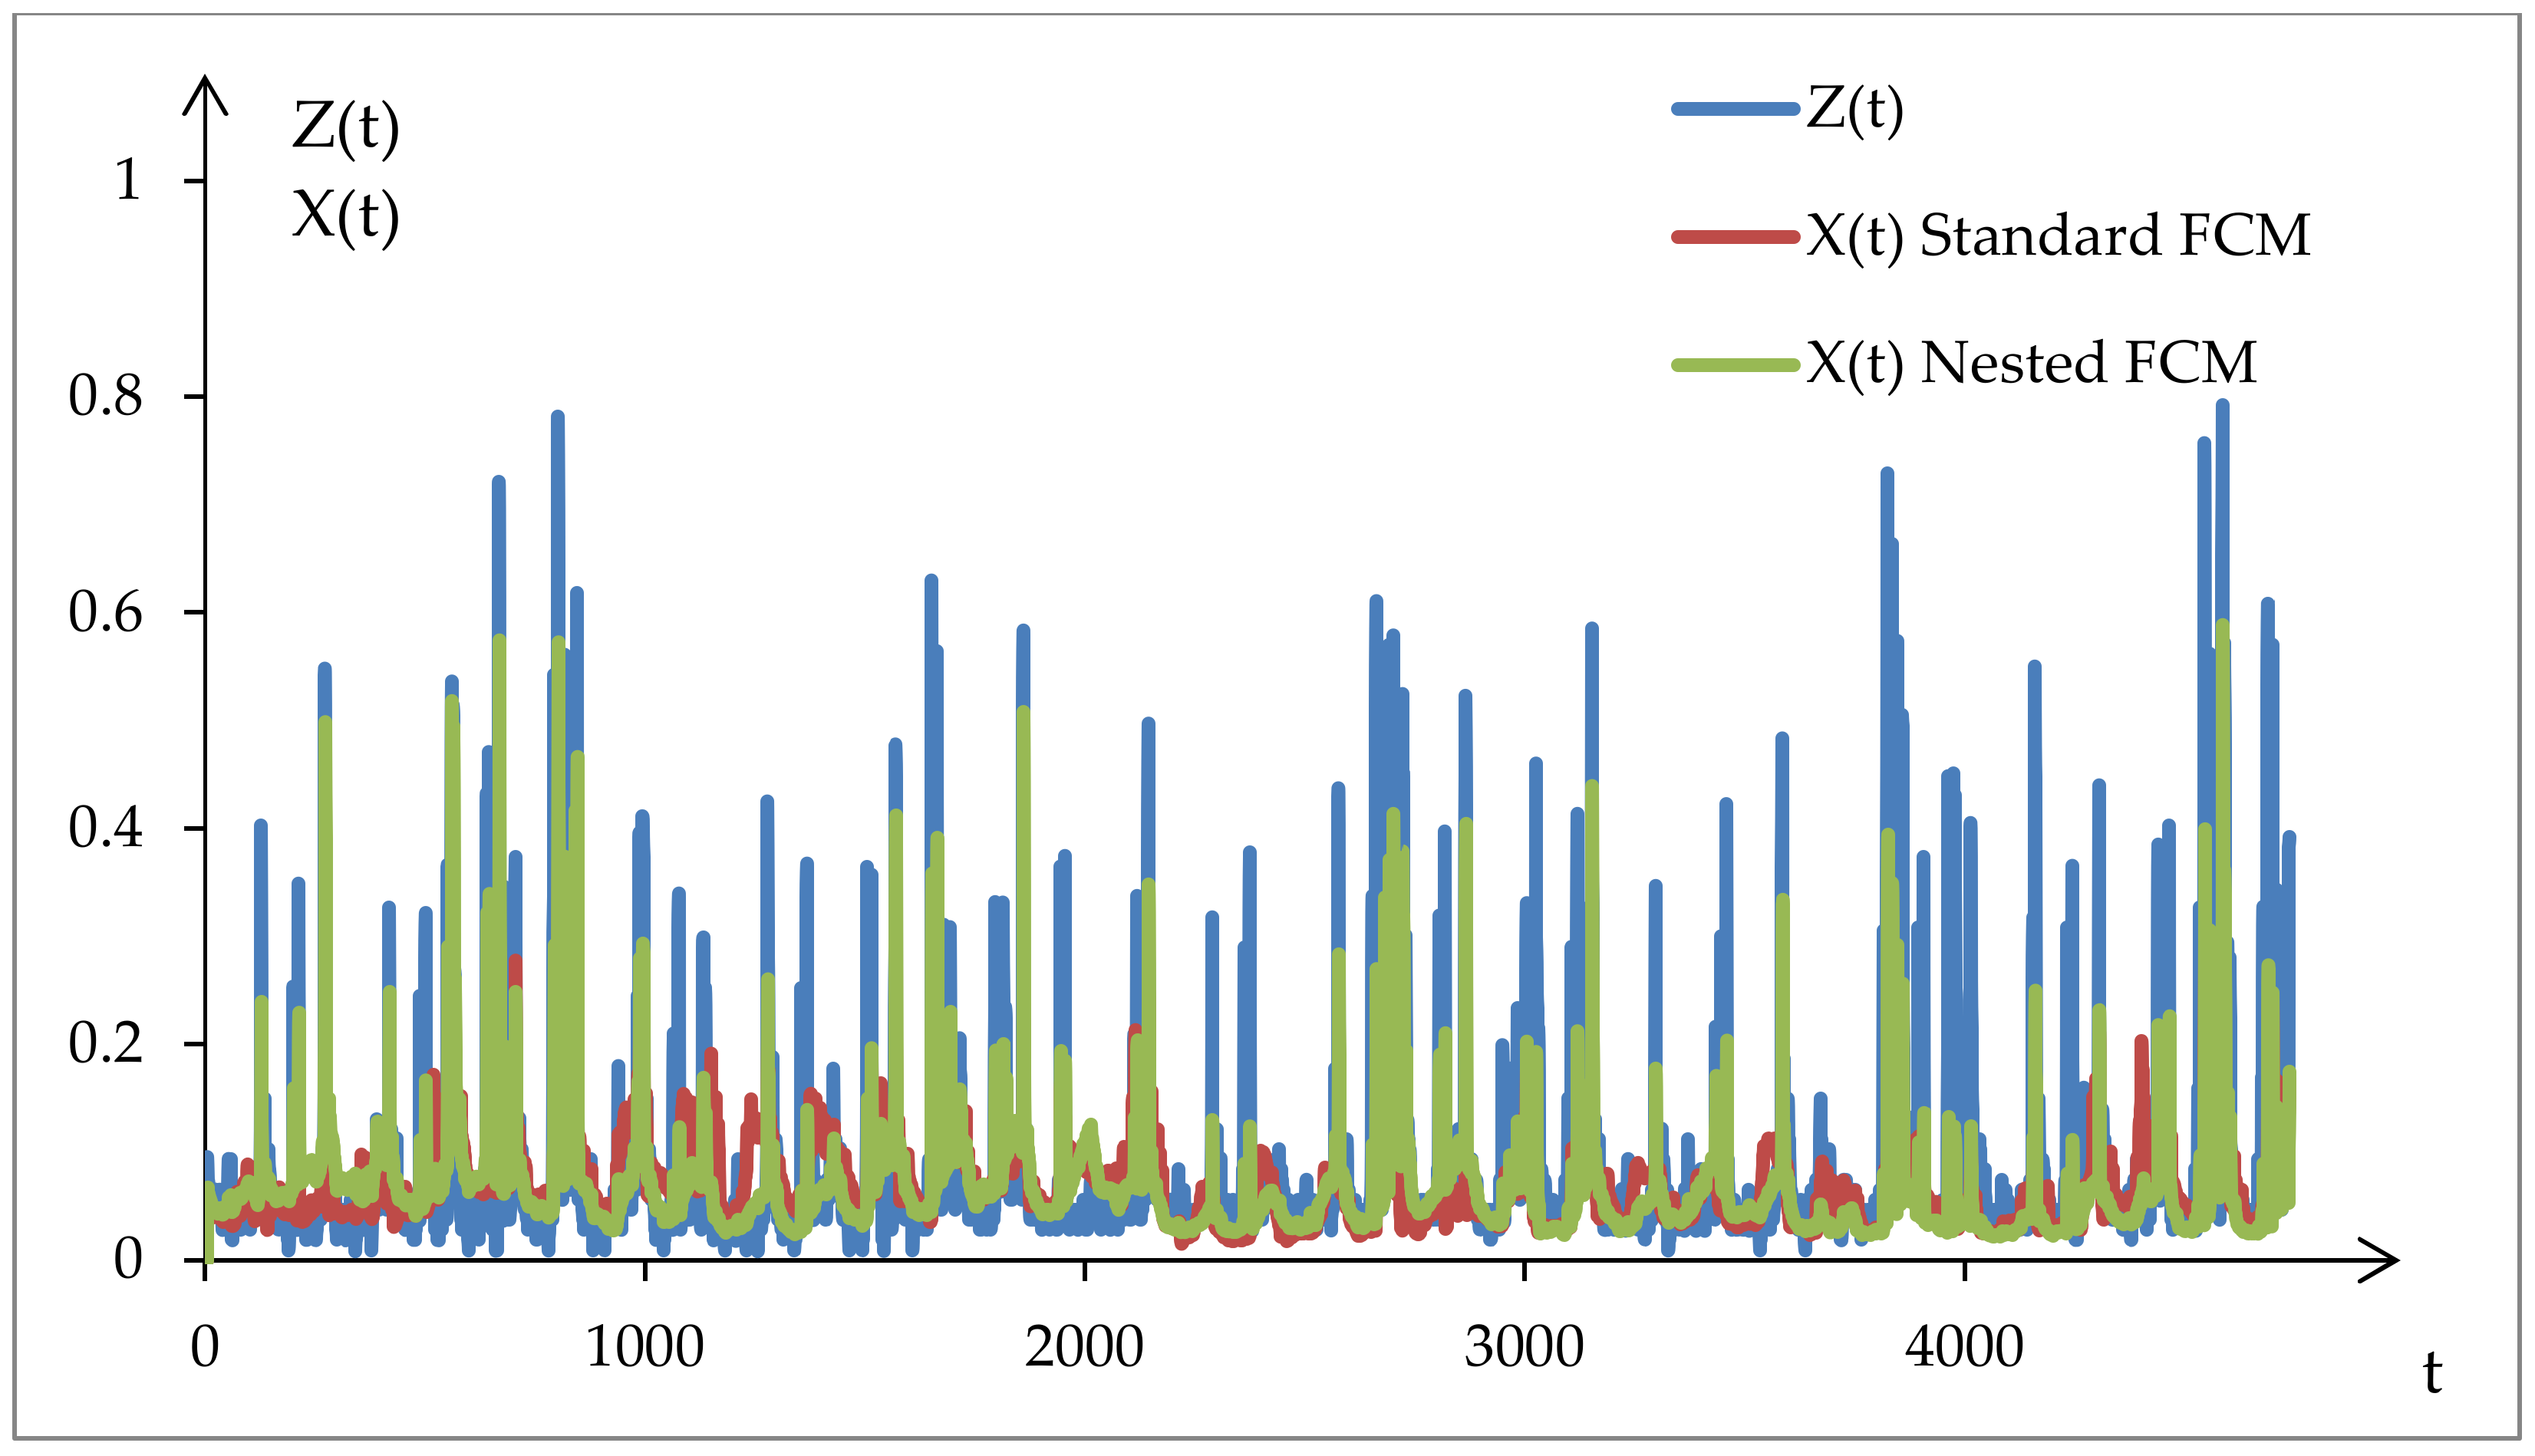
- Mean Absolute Error:where X(t) is the forecasted value of the output concept at the t-th iteration, Z(t) is the normalized actual value of the output concept at the t-th iteration, and t = 1, …, T is the number of the iteration.
3.6. Software
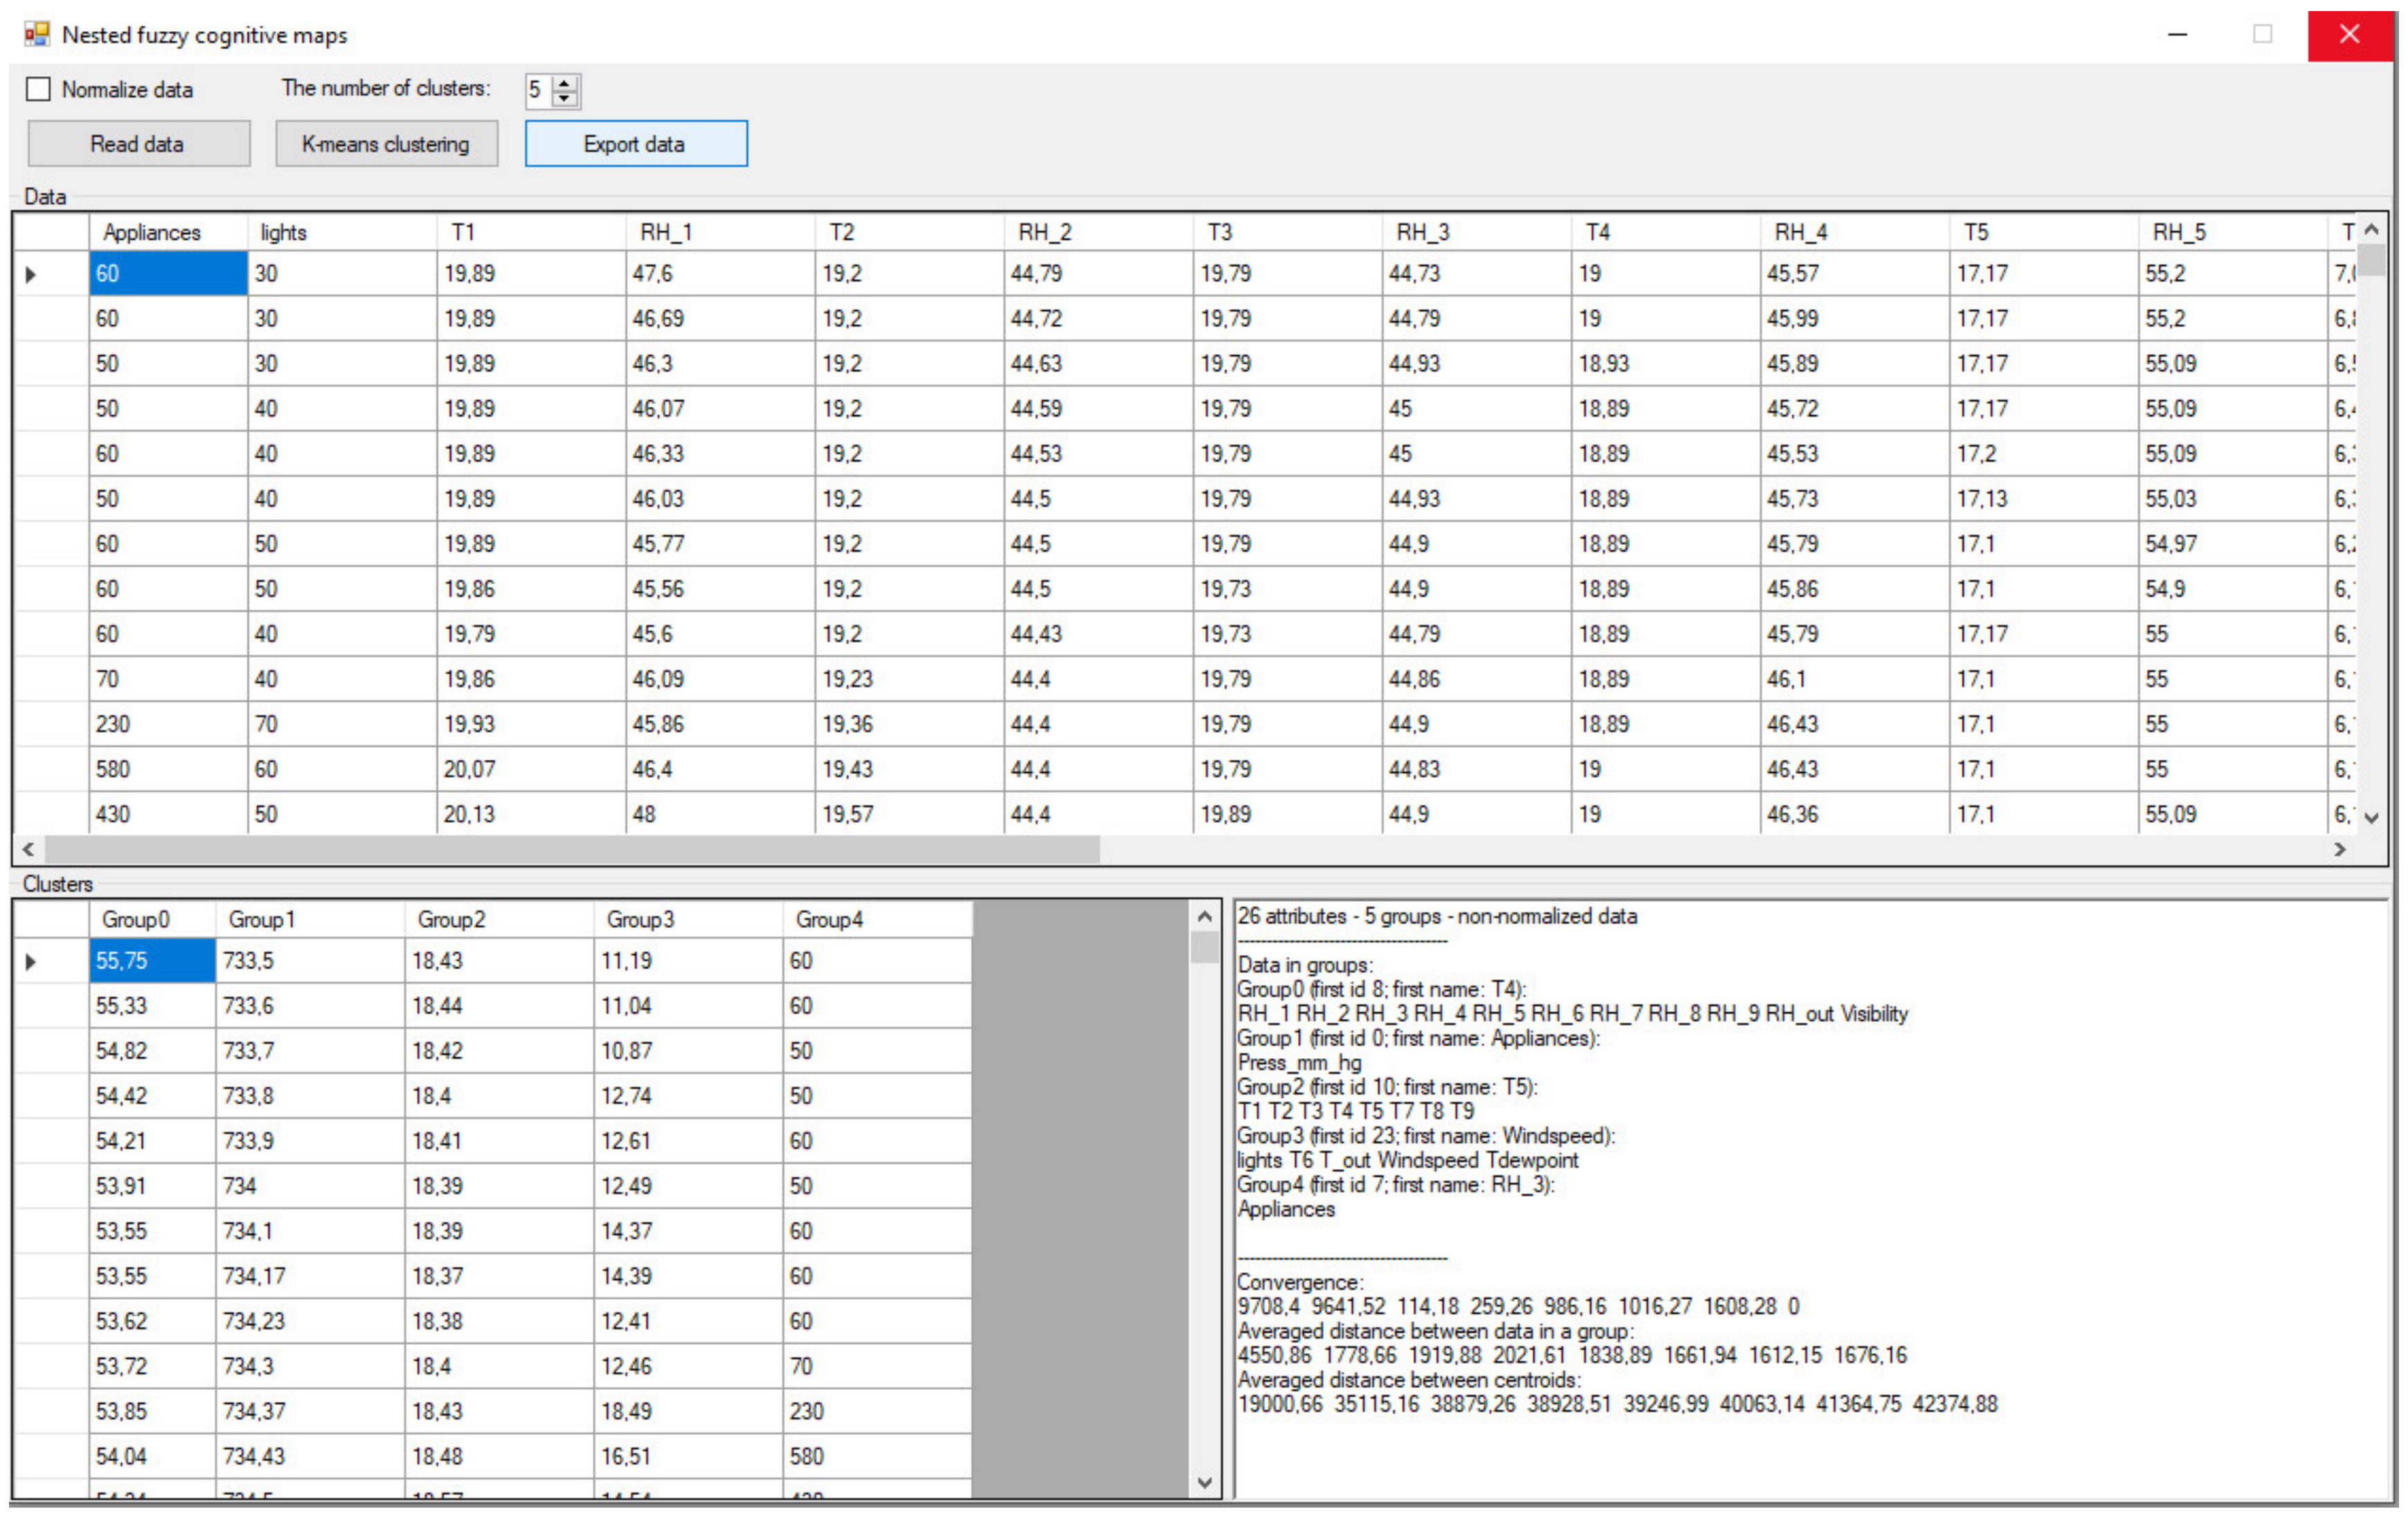
The simulation analysis of the proposed approach for constructing nested FCMs was implemented in ISEMK (Intelligent Expert System based on Cognitive Maps), a software tool that has been developed to construct and analyze FCMs [14,28]. The ISEMK tool is a C# application that allows users to construct FCMs with the use of evolutionary algorithms. In the context of the current research study, a new module has been implemented in the ISEMK tool, which enables:
- reading data from .data file,
- setting the number of clusters,
- clustering similar concepts with the use of k-means method,
- showing results of clustering,
- calculating the average values for concepts within one group in order to construct the first level (the most general level) of the nested structure,
- exporting these values to the .data file in order to use them to construct the most general FCM model with the use of RCGA and SOGA algorithms, and
- exporting the original values of the concepts in each group to separate .data files in order to construct the FCM models on the second level (the more detailed level) of the nested structure.
Figure 2 presents the implemented module for data clustering.
4. Case Study
For the purposes of this study, in order to show the functionality of the proposed methodology, a specific appliances’ energy prediction dataset was considered and analyzed [25]. This dataset contains energy data recorded for a period of four and a half months from a low energy house, which has been used as a testbed. A wireless sensor network (ZigBee) was used to monitor house temperature and humidity conditions, whereas m-bus energy meters were collecting the energy data every 10 min. Additionally, weather data were provided by a public data repository connected to an airport weather station nearby. The used data contained the following attributes (concepts):
- Appliances—energy consumption (Wh),
- Lights—light fixtures energy consumption (Wh),
- T1—kitchen temperature (Celsius),
- RH1—kitchen humidity (%),
- T2—living room temperature (Celsius),
- RH2—living room humidity (%),
- T3—laundry room temperature (Celsius),
- RH3—laundry room humidity (%),
- T4—office temperature (Celsius),
- RH4—office humidity (%),
- T5—bathroom temperature (Celsius),
- RH5—bathroom humidity (%),
- T6—outside the building temperature (north side) (Celsius),
- RH6—outside the building humidity (north side) (%),
- T7—ironing room temperature (Celsius),
- RH7—ironing room humidity (%),
- T8—teenager room 2 temperature (Celsius),
- RH8—teenager room 2 humidity (%),
- T9—parents room temperature (Celsius),
- RH9—parents room humidity (%),
- Tout—outside temperature (Celsius),
- Pressure—pressure (mm Hg),
- RHout—outside humidity (%),
- Windspeed—wind speed (m/s),
- Visibility (km), and
- Tdewpoint—due point temperature (Celsius).
In what follows, the application of the proposed approach for constructing a nested structure based on FCMs is presented by utilizing this appliances’ energy prediction dataset [25]. “Appliances” is set as the output concept of the FCM. The normalized data were divided into learning records (15,000 total in number) and testing records (4735 total in number). Table 1 presents the sample results of the clustering data related to the use of the appliances’ energy dataset into 5 clusters.
The FCM models were constructed with the use of two evolutionary learning algorithms: RCGA and SOGA. The learning parameters were selected by trial and error in order to minimize prediction errors. The learning process was repeated 10 times for each parameter configuration. The average values of the evolution criteria with standard deviation were produced accordingly. Uniform crossover [32] with crossover probability equal to 0.6, random mutation with mutation probability equal to 0.1, and ranking selection for parent selection were used in the simulations. The parents of one generation are completely replaced with the offspring. Elite strategy was applied and the single best individual was kept. Both population size and the maximum number of generations in the respective case study were set equal to 100.
Table 2 shows the calculated prediction errors (MAE, MSE, RMSE) for the first and second levels of the nested FCM. To evaluate the performance of the proposed approach, an extensive comparative analysis between the nested FCM and the standard FCM was performed. The best models in terms of having the lowest MSE value were further analyzed so the forecasted values of energy use of appliances for the second level of the nested structure (second level) would be calculated. Table 3 shows the obtained prediction errors (MAE, MSE, RMSE) for the best FCM models.
Please notice that the bold values in the above tables represent the best results associated with the least values of prediction error measures.
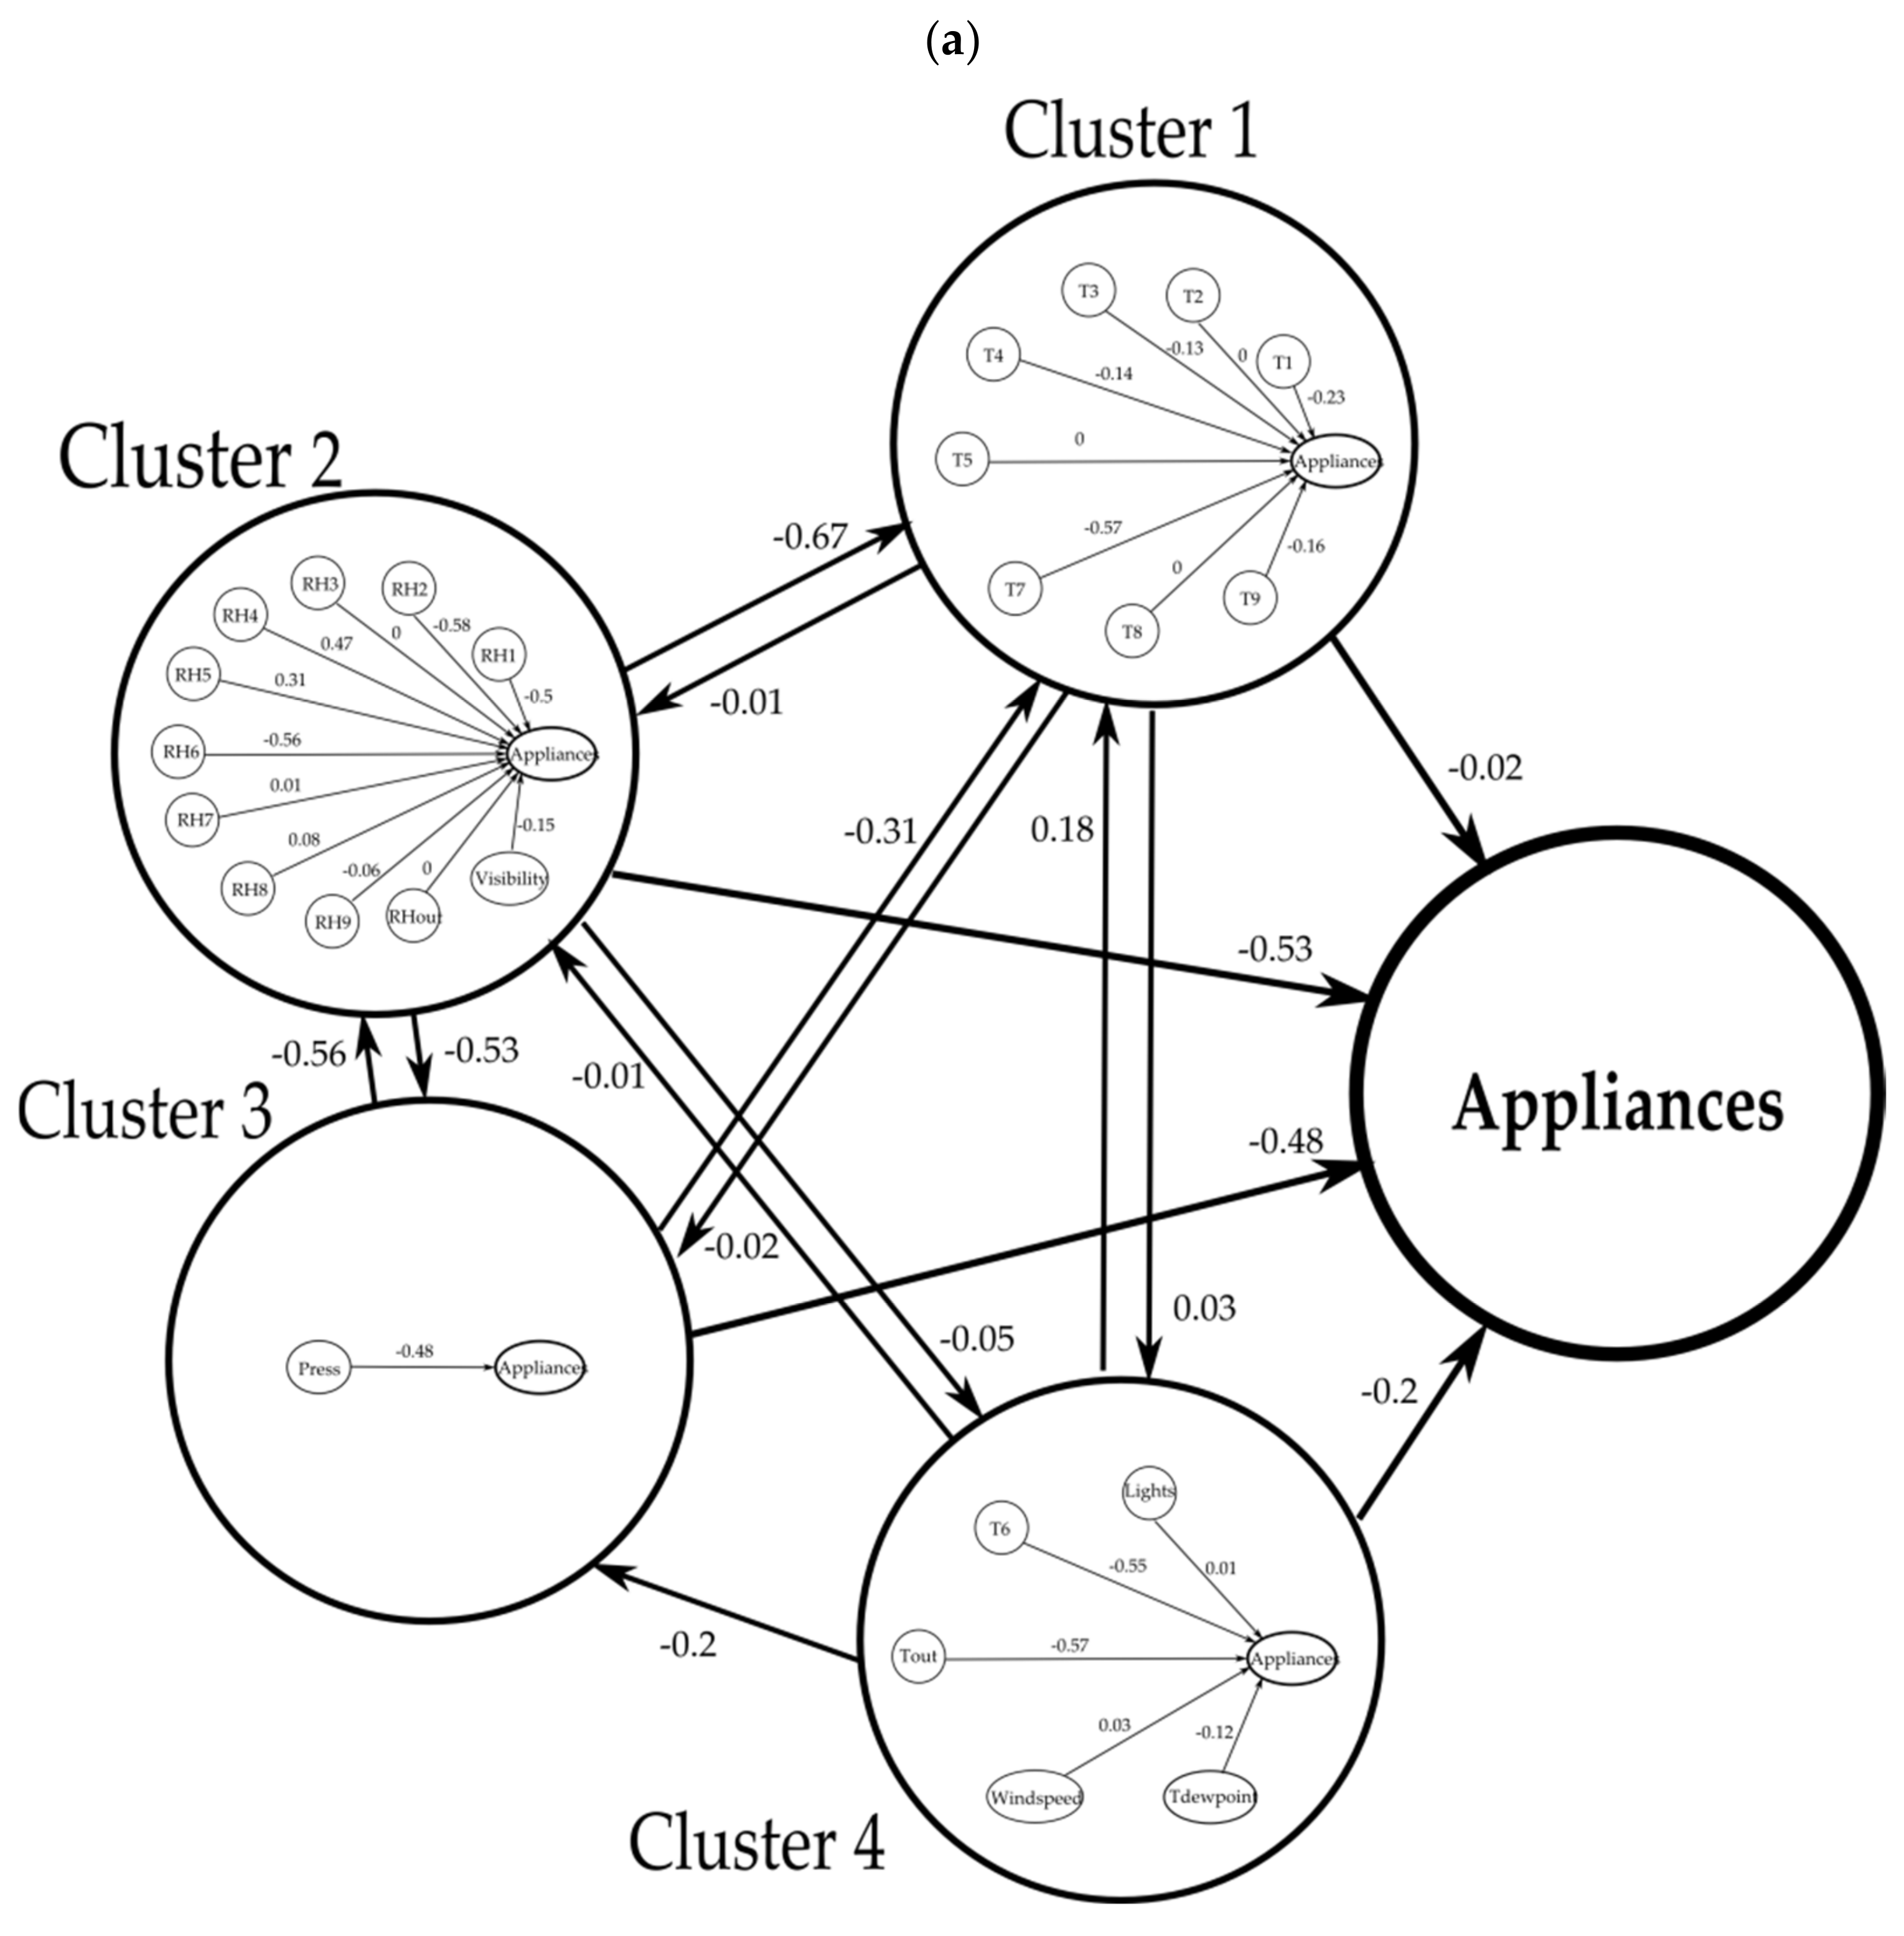
Figure 3 depicts the sample nested structure obtained with the use of the RCGA and SOGA algorithms. The proposed approach based on a genetic algorithm optimization allowed us to construct the nested fuzzy cognitive map in which each node is an independent FCM model containing similar concepts. The appliances’ energy usage prediction can be analyzed at the first (the most general) level or at a more detailed level (with the use of the detailed FCM models constructed for each cluster). Additionally, the use of SOGA allowed the optimization of the nested structure through the selection of the most significant concepts in each cluster.
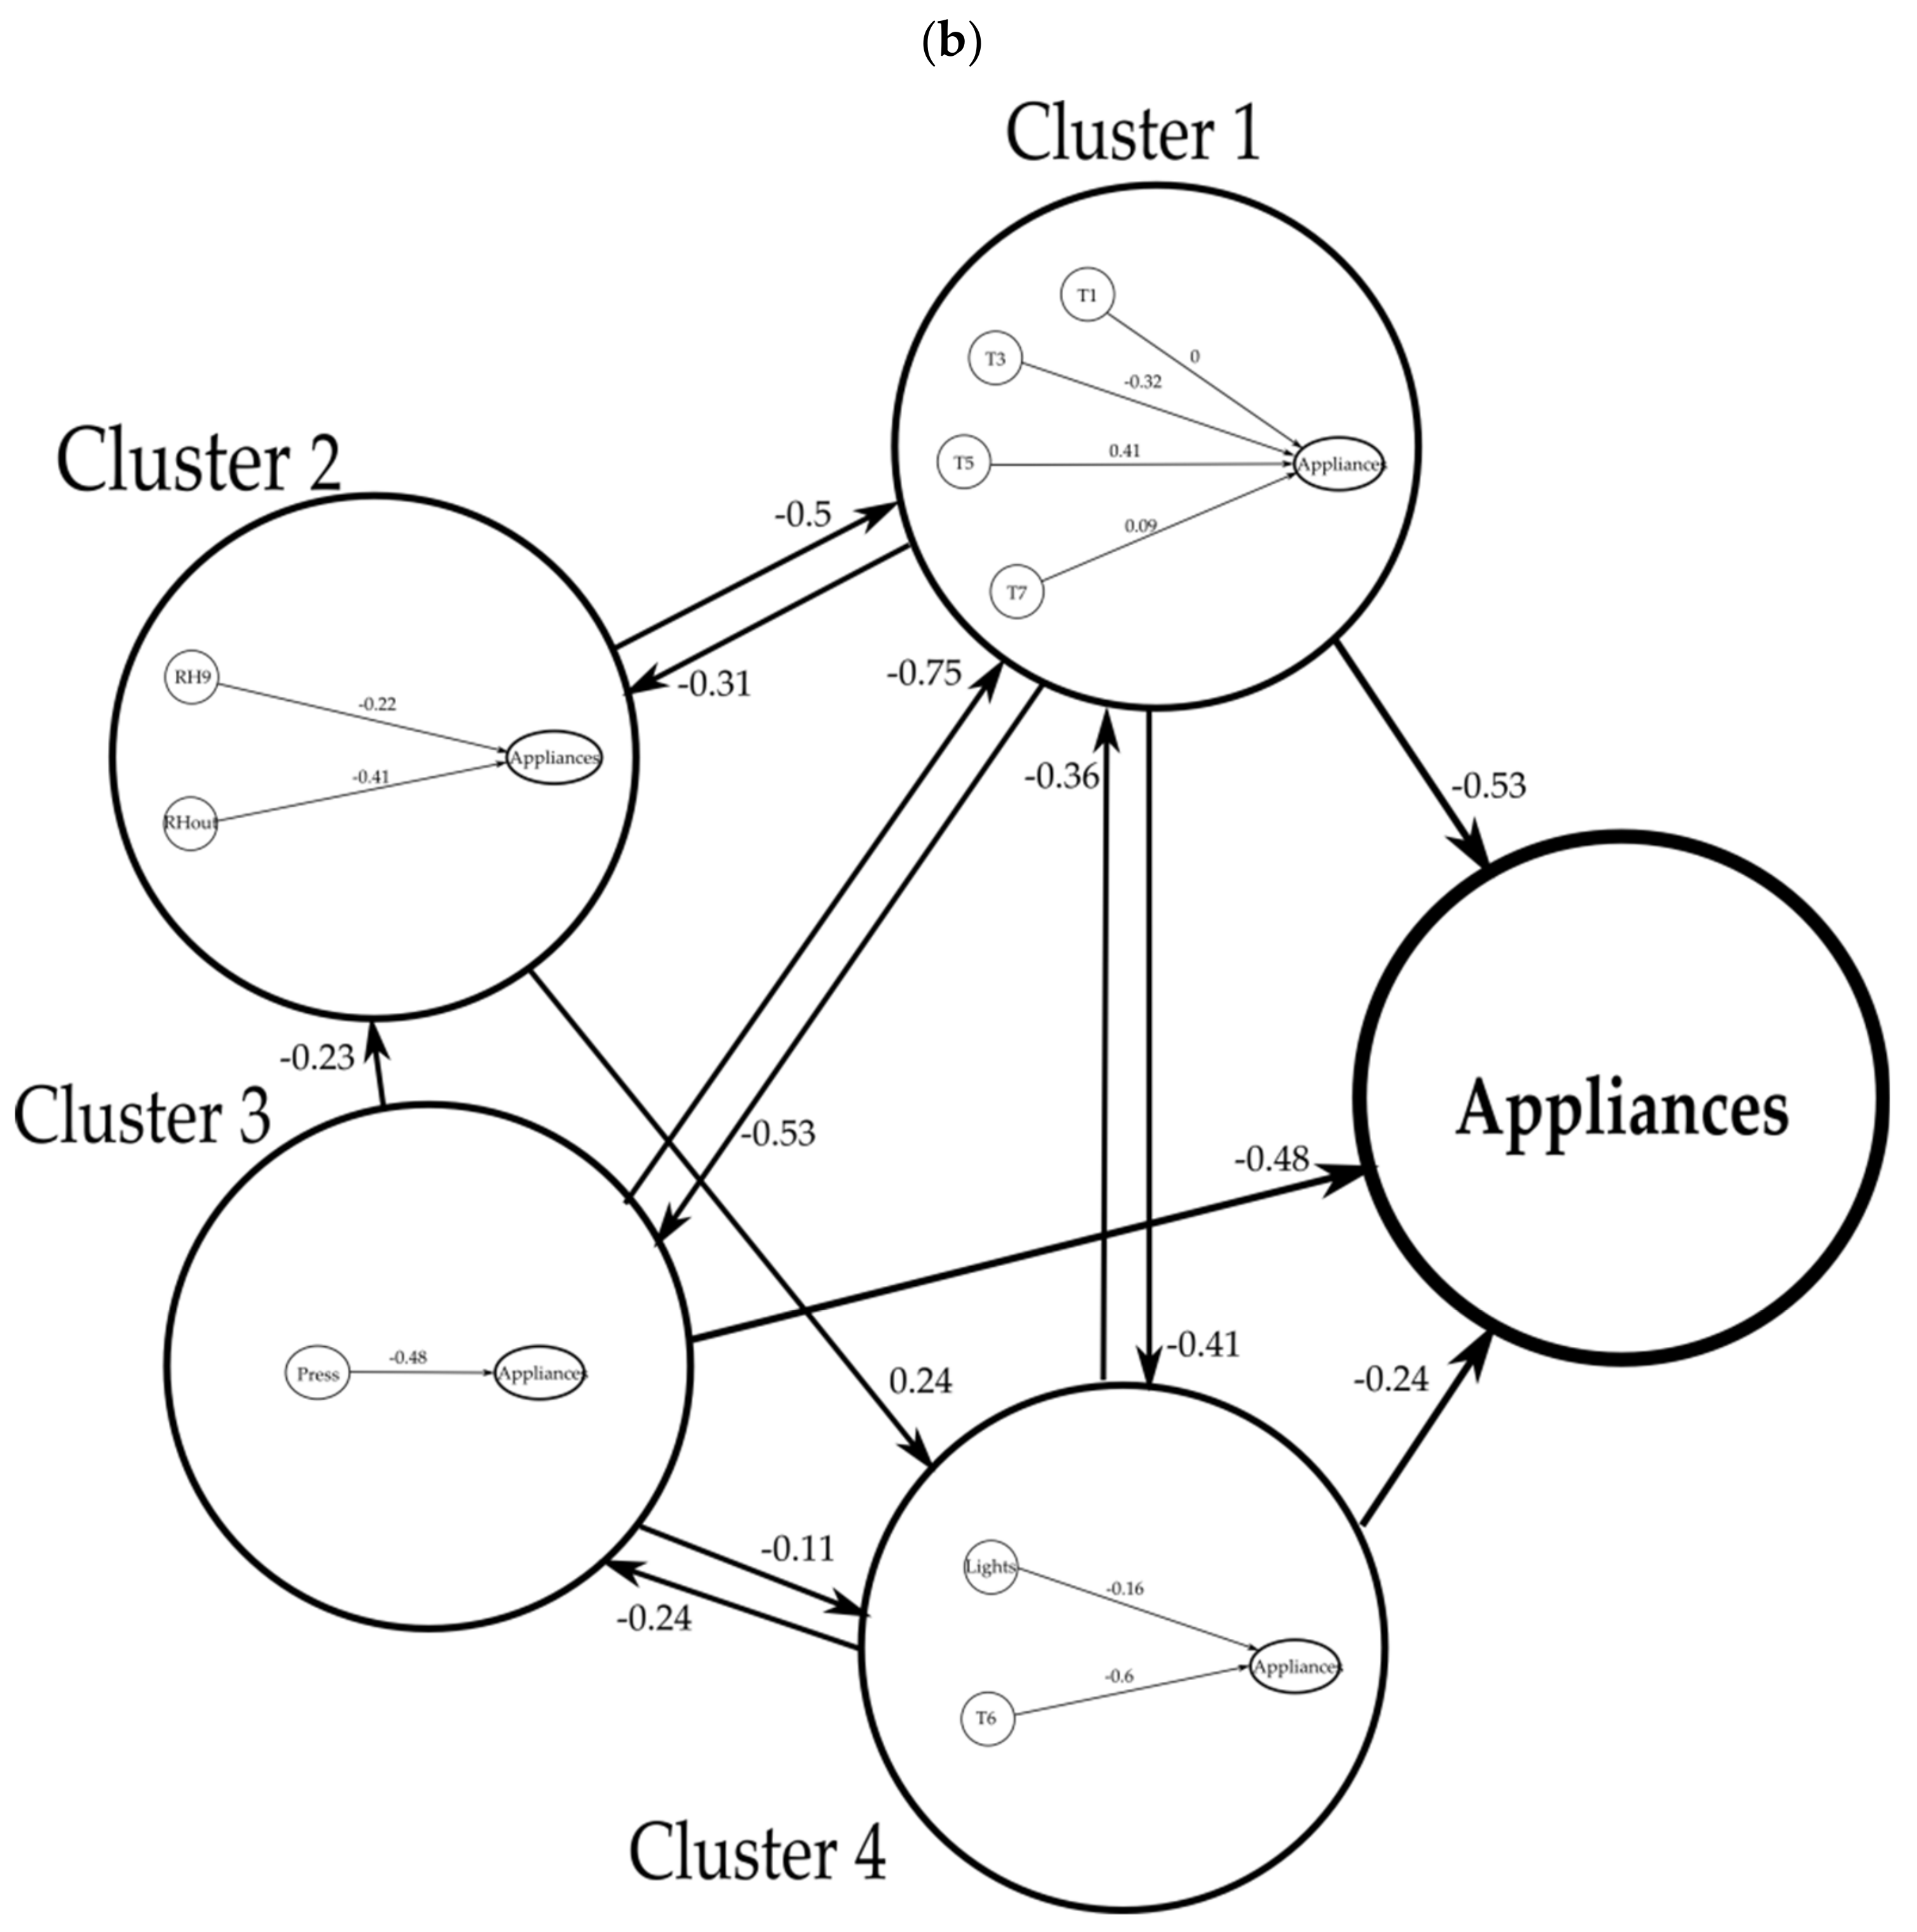
More specifically, clusters 1, 2, and 4 in Figure 3a contain more variables than those in Figure 3b, which have been selected by applying the SOGA algorithm for FCM learning. Furthermore, the number of weighted relationships among clusters is less in the optimized nested FCM structure as depicted in Figure 3b, producing a less complex model for making a prediction. Figure 3b presents the most significant concepts for the prediction automatically selected by the SOGA algorithm in the sample experiment.
The most important concepts in each cluster in the nested FCM, as they were produced by the SOGA optimization approach, are the following: T1- temperature in the kitchen area, in Celsius, T3- temperature in laundry room area, T5- temperature in bathroom, in Celsius, and T7- temperature in ironing room, in Celsius (Cluster 1), RH9- humidity in parents room, in %, and RHout- humidity outside, in %, (Cluster 2), Press (Cluster 3) and Lights, and T6- temperature outside the building (north side), in Celsius, (Cluster 4). These concepts have a significant impact on appliances to predict their behavior.
Figure 4 presents the sample results for the forecasting of energy use of appliances. The nested FCM outperformed the standard FCM in terms of achieving better forecasting results overall.
5. Discussion of Results and Conclusions
In this work, various FCM-based nested architectures were explored, considering the variables that were carefully determined by using the FCM models defined in Section 3. Through the experimental analysis, which involved learning and optimization processes, the optimum nested FCM structure was identified in terms of the overall prediction accuracy.
To further analyze the results of the proposed forecasting approach based on nested FCMs, and assess its effectiveness as well, a comparative analysis has been carried out with respect to the forecasting performance, between the proposed technique and the standard FCM, which has already been applied in similar energy problems as reported in the relevant literature. All the results produced are gathered in the tables and figures cited in the previous section. In particular, from the results shown in Table 1, it emerges that the proposed approach allowed the clustering of 26 concepts related to the use of appliances energy into 5 similar clusters. After a detailed analysis of Table 2 and Table 3, as regards the MAE, MSE, and RMSE errors, it can be concluded that the nested structure based on two levels (first level and second level) provided lower errors than the standard approach based on a single FCM.
In Figure 3, it can be noted that the proposed optimization approach allowed the authors to obtain a readable nested structure in which each concept at the first level can be decomposed into another FCM, providing a more detailed representation of appliances’ energy time series. Evolutionary algorithms for FCM learning were used to extract important relationships between the concepts at every nesting level and define corresponding weights as regards the available time series. Additionally, the SOGA algorithm helped in the optimization of the nested structure through the selection of the most significant concepts from all possible concepts at every nesting level.
The most important advantageous characteristics of the proposed nested FCM architecture, according to the results as presented in the previous section, are summarized below. More specifically, the nested FCM:
- optimizes the FCM structure by selecting the most proper concepts for decision-making;
- finds out the most important relationships between the concepts at every nesting level and determines the weights of these relationships;
- results in a readable nested structure in which each concept of a first level can be decomposed into another FCM, providing a more detailed representation of time series;
- facilitates understanding of the concepts affecting the forecast;
- clusters available concepts into similar groups
The main limitation of the proposed approach is that it could be time-consuming for large datasets, as it requires the construction of several individual FCM models. However, time series prediction can be limited only to the most general level of the nested structure.
The main outcomes of this research study are outlined as follows:
- (i)
- The proposed nested FCM method demonstrates excellent performance in the case of clustering analysis considering the examined variables/concepts of this case study. For the examined nested structure and after a number of experiments were conducted, a specific configuration was concluded as the best. In general, the optimum nested FCM model is defined through the identification of the most important relationships between the concepts at every nesting level and by determining the weights of these relationships.
- (ii)
- The proposed nested architecture is proven to be superior compared to the standard well-known FCM model, which has been previously used in prediction problems in the energy domain.
- (iii)
To sum up, we have developed and suggested a new approach for constructing a nested structure based on fuzzy cognitive maps. The proposed approach seems to be a promising method for time series forecasting and decision-making in many scientific domains. It allows the representation of a readable nested structure in which each concept of a first level can be decomposed into another fuzzy cognitive map for a more detailed presentation of the analyzed time series. Future work is oriented in analyzing the application of the developed approach based on various complex time series. Moreover, we would like to introduce different forecasting models (e.g., artificial neural networks) at the most detailed level of the nested structure in order to achieve higher prediction accuracy.
Author Contributions
Conceptualization, K.P. and E.I.P.; methodology, K.P.; software, K.P.; validation, K.P., E.I.P. and V.C.G.; formal analysis, K.P., E.I.P. and V.C.G.; investigation, K.P. and E.I.P.; resources, K.P.; data curation, K.P.; writing—original draft preparation, K.P., E.I.P. and V.C.G.; writing—review and editing, K.P., E.I.P. and V.C.G.; visualization, K.P.; supervision, E.I.P. and V.C.G. All authors have read and agreed to the published version of the manuscript.
Funding
This research received no external funding.
Conflicts of Interest
The authors declare no conflict of interest.
References
- Kosko, B. Fuzzy cognitive maps. Int. J. Man-Mach. Stud. 1986, 24, 65–75. [Google Scholar] [CrossRef]
- Papakostas, G.A.; Boutalis, Y.S.; Koulouriotis, D.E.; Mertzios, B.G. Fuzzy cognitive maps for pattern recognition applications. Int. J. Pattern Recogn. Artif. Intell. 2008, 22, 1461–1468. [Google Scholar] [CrossRef]
- Aguilar, J. Dynamic random fuzzy cognitive maps. Comput. Sist. 2004, 7, 260–271. Available online: http://www.scielo.org.mx/pdf/cys/v7n4/v7n4a5.pdf (accessed on 17 November 2020).
- Tsadiras, A.K.; Kouskouvelis, I. Using fuzzy cognitive maps as a decision support system for political decisions: The case of Turkey’s integration into the European Union. In Advances in Informatics; PCI 2005; Lecture Notes in Computer Science; Bozanis, P., Houstis, E.N., Eds.; Springer: Berlin/Heidelberg, Germany, 2005; Volume 3746, pp. 371–381. [Google Scholar] [CrossRef]
- Dickerson, J.A.; Kosko, B. Virtual worlds as fuzzy cognitive maps. Presence 1994, 3, 173–189. [Google Scholar] [CrossRef]
- Papageorgiou, K.; Singh, P.K.; Papageorgiou, E.I.; Chudasama, H.; Bochtis, D.; Stamoulis, G. Fuzzy cognitive map-based sustainable socio-economic development planning for rural communities. Sustainability 2020, 12, 305. [Google Scholar] [CrossRef] [Green Version]
- Papageorgiou, K.; Carvalho, G.; Papageorgiou, E.I.; Bochtis, D.; Stamoulis, G. Decision-making process for photovoltaic solar energy sector development using fuzzy cognitive map technique. Energies 2020, 13, 1427. [Google Scholar] [CrossRef] [Green Version]
- Song, H.; Miao, C.; Roel, W.; Shen, Z. Implementation of fuzzy cognitive maps based on fuzzy neural network and application in prediction of time series. IEEE Trans. Fuzzy Syst. 2010, 18, 233–250. [Google Scholar] [CrossRef]
- Lu, W.; Yang, J.; Liu, X. The linguistic forecasting of time series based on fuzzy cognitive maps. In Proceedings of the 2013 Joint IFSA World Congress and NAFIPS Annual Meeting, IFSA/NAFIPS 2013, Edmonton, AB, Canada, 24–28 June 2013; pp. 649–654. [Google Scholar]
- Stach, W.; Kurgan, L.; Pedrycz, W. Numerical and linguistic prediction of time series with the use of fuzzy cognitive maps. IEEE Trans. Fuzzy Syst. 2008, 16, 61–72. [Google Scholar] [CrossRef]
- Homenda, W.; Jastrzebska, A.; Pedrycz, W. Modeling time series with fuzzy cognitive maps. In Proceedings of the 2014 IEEE International Conference on Fuzzy Systems, FUZZ-IEEE 2014, Beijing, China, 6–11 July 2014; pp. 2055–2062. [Google Scholar] [CrossRef]
- Papageorgiou, E.I.; Poczeta, K.; Laspidou, C. Application of fuzzy cognitive maps to water demand prediction. In Proceedings of the 2015 IEEE International Conference on Fuzzy Systems, FUZZ-IEEE 2015, Istanbul, Turkey, 2–5 August 2015; pp. 1–8. [Google Scholar] [CrossRef]
- Papageorgiou, K.; Papageorgiou, E.I.; Poczeta, K.; Gerogiannis, V.C.; Stamoulis, G. Exploring an ensemble of methods that combines fuzzy cognitive maps and neural networks in solving the time series prediction problem of gas consumption in Greece. Algorithms 2019, 12, 235. [Google Scholar] [CrossRef] [Green Version]
- Papageorgiou, E.I.; Poczeta, K. A two-stage model for time series prediction based on fuzzy cognitive maps and neural networks. Neurocomputing 2017, 232, 113–121. [Google Scholar] [CrossRef]
- Homenda, W.; Jastrzebska, A.; Pedrycz, W. Nodes selection criteria for fuzzy cognitive maps designed to model time series. In Intelligent Systems’ 2014. Advances in Intelligent Systems and Computing; Filev, D., Ed.; Springer: Cham, Switzerland, 2014; Volume 323, pp. 859–870. [Google Scholar] [CrossRef]
- Selvin, N.N.; Srinivasaraghavan, A. Dimensionality reduction of inputs for a fuzzy cognitive map for obesity problem. In Proceedings of the 2016 International Conference on Inventive Computation Technologies, ICICT 2016, Coimbatore, Tamilnadu, India, 23–26 August 2016; pp. 1–5. [Google Scholar] [CrossRef]
- Chi, Y.; Liu, J. Learning of fuzzy cognitive maps with varying densities using multi-objective evolutionary algorithms. IEEE Trans. Fuzzy Syst. 2016, 24, 71–81. [Google Scholar] [CrossRef]
- Stach, W.; Pedrycz, W.; Kurgan, L.A. Learning of fuzzy cognitive maps using density estimate. IEEE Trans. Syst. Man Cybern. Part B 2012, 42, 900–912. [Google Scholar] [CrossRef]
- Hatwágner, M.F.; Kóczy, L.T. Parameterization and concept optimization of FCM models. In Proceedings of the 2015 IEEE International Conference on Fuzzy Systems, FUZZ-IEEE 2015, Istanbul, Turkey, 2–5 August 2015; pp. 1–8. [Google Scholar] [CrossRef]
- Sadiq, R.; Kleiner, Y.; Rajani, B.B. Interpreting fuzzy cognitive maps (FCMs) using fuzzy measures to evaluate water quality failures in distribution networks. In Proceedings of the Joint International Conference on Computation in Civil and Building Engineering, ICCCBE XI, Montreal, QC, Canada, 14–16 June 2006; pp. 1–10. [Google Scholar]
- MacQueen, J. Some methods for classification and analysis of multivariate observations. In Proceedings of the 5th Berkeley Symposium on Mathematical Statistics and Probability; Le Cam, L.M., Neyman, J., Eds.; University of California Press: Davis, CA, USA, 1967; Volume 1, pp. 281–297. Available online: https://projecteuclid.org/euclid.bsmsp/1200512992 (accessed on 17 November 2020).
- Stach, W.; Kurgan, L.; Pedrycz, W.; Reformat, M. Genetic learning of fuzzy cognitive maps. Fuzzy Sets Syst. 2005, 153, 371–401. [Google Scholar] [CrossRef]
- Makonin, S.; Ellert, B.; Bajic, I.; Popowich, F. Electricity, water, and natural gas consumption of a residential house in Canada from 2012 to 2014. Sci. Data 2016, 3, 160037. [Google Scholar] [CrossRef] [Green Version]
- Dong, B.; Cao, C.; Lee, S.E. Applying support vector machines to predict building energy consumption in tropical region. Energy Build. 2005, 37, 545–553. [Google Scholar] [CrossRef]
- Candanedo, L.M.; Feldheim, V.; Deramaix, D. Data driven prediction models of energy use of appliances in a low-energy house. Energy Build. 2017, 140, 81–97. [Google Scholar] [CrossRef]
- Kandananond, K. Forecasting electricity demand in Thailand with an artificial neural network approach. Energies 2011, 4, 1246–1257. [Google Scholar] [CrossRef]
- Kim, J.-Y.; Cho, S.-B. Electric energy consumption prediction by deep learning with state explainable autoencoder. Energies 2019, 12, 739. [Google Scholar] [CrossRef] [Green Version]
- Poczeta, K.; Yastrebov, A.; Papageorgiou, E.I. Learning fuzzy cognitive maps using structure optimization genetic algorithm. In Proceedings of the 2015 Federated Conference on Computer Science and Information Systems, FedCSIS 2015, Lodz, Poland, 13–16 September 2015; pp. 547–554. [Google Scholar] [CrossRef] [Green Version]
- Orang, O.; Silva, R.; de Lima e Silva, P.C.; Guimarães, F.G. Solar energy forecasting with fuzzy time series using high-order fuzzy cognitive maps. In Proceedings of the 2020 IEEE International Conference on Fuzzy Systems, FUZZ-IEEE 2020, Glasgow, UK, 19–24 July 2020; pp. 1–8. [Google Scholar] [CrossRef]
- Papageorgiou, K.; Carvalho, G.; Papageorgiou, E.I.; Papandrianos, N.I.; Mendonça, M.; Stamoulis, G. Exploring Brazilian photovoltaic solar energy development scenarios using the fuzzy cognitive map wizard tool. In Proceedings of the 2020 IEEE International Conference on Fuzzy Systems, FUZZ-IEEE 2020, Glasgow, UK, 19–24 July 2020; pp. 1–8. [Google Scholar] [CrossRef]
- Makridakis, S.; Winkler, R.L. Averages of forecasts: Some empirical results. Manag. Sci. 1983, 29, 987–996. Available online: https://0-www-jstor-org.brum.beds.ac.uk/stable/2630927 (accessed on 17 November 2020). [CrossRef] [Green Version]
- De Jong, K.A.; Spears, W.M. A formal analysis of the role of multi-point crossover in genetic algorithms. Ann. Math. Artif. Intell. 1992, 5, 1–26. [Google Scholar] [CrossRef] [Green Version]
Figure 1.
Example of a fuzzy cognitive map created from a group of specialists for Brazilian photovoltaic solar energy development. Republished with permission from Papageorgiou et al. [7]; Published by MDPI, 2020.
Figure 1.
Example of a fuzzy cognitive map created from a group of specialists for Brazilian photovoltaic solar energy development. Republished with permission from Papageorgiou et al. [7]; Published by MDPI, 2020.

Figure 2.
Screenshot of the implemented ISEMK (Intelligent Expert System based on Cognitive Maps) module for data clustering.
Figure 2.
Screenshot of the implemented ISEMK (Intelligent Expert System based on Cognitive Maps) module for data clustering.

Figure 3.
Sample nested fuzzy cognitive map obtained with the use of (a) real-coded genetic algorithm (RCGA) and (b) structure optimization genetic algorithm (SOGA).
Figure 3.
Sample nested fuzzy cognitive map obtained with the use of (a) real-coded genetic algorithm (RCGA) and (b) structure optimization genetic algorithm (SOGA).


Figure 4.
Forecasting results for the best model obtained with the use of the SOGA algorithm.


Table 1.
Results of clustering.
| Cluster | Attributes (Concepts) |
|---|---|
| Cluster 1 | T1 T2 T3 T4 T5 T7 T8 T9 |
| Cluster 2 | RH1 RH2 RH3 RH4 RH5 RH6 RH7 RH8 RH9 RHout Visibility |
| Cluster 3 | Pressure |
| Cluster 4 | Lights T6 Tout Windspeed Tdewpoint |
| Cluster 5 (output) | Appliances |
Table 2.
Comparison results among the nested fuzzy cognitive map and standard fuzzy cognitive map.
| Model | Algorithm | MAE | MSE | RMSE |
|---|---|---|---|---|
| First level | SOGA | 0.0423 ± 0.0140 | 0.0058 ± 0.0017 | 0.0754 ± 0.0099 |
| RCGA | 0.0370 ± 0.0015 | 0.0052 ± 0.0006 | 0.0720 ± 0.0039 | |
| Cluster 1 | SOGA | 0.0454 ± 0.0099 | 0.0067 ± 0.0019 | 0.0814 ± 0.0104 |
| RCGA | 0.0424 ± 0.0038 | 0.0060 ± 0.0006 | 0.0772 ± 0.0038 | |
| Cluster 2 | SOGA | 0.0453 ± 0.0077 | 0.0064 ± 0.0009 | 0.0801 ± 0.0054 |
| RCGA | 0.0409 ± 0.0051 | 0.0060 ± 0.0007 | 0.0774 ± 0.0045 | |
| Cluster 3 | SOGA | 0.0423 ± 0.0140 | 0.0058 ± 0.0017 | 0.0754 ± 0.0099 |
| RCGA | 0.0370 ± 0.0015 | 0.0052 ± 0.0006 | 0.0720 ± 0.0039 | |
| Cluster 4 | SOGA | 0.0414 ± 0.0036 | 0.0061 ± 0.0008 | 0.0778 ± 0.0050 |
| RCGA | 0.0373 ± 0.0022 | 0.0054 ± 0.0005 | 0.0731 ± 0.0036 | |
| Standard FCM | SOGA | 0.0485 ± 0.0135 | 0.0072 ± 0.0015 | 0.0845 ± 0.0086 |
| RCGA | 0.0426 ± 0.0025 | 0.0065 ± 0.0007 | 0.0807 ± 0.0041 |
Table 3.
Best results for the nested fuzzy cognitive map and standard fuzzy cognitive map.
| Model | Algorithm | MAE | MSE | RMSE |
|---|---|---|---|---|
| First level | SOGA | 0.0348 | 0.0045 | 0.0671 |
| RCGA | 0.0348 | 0.0045 | 0.0667 | |
| Cluster 1 | SOGA | 0.0369 | 0.0048 | 0.0692 |
| RCGA | 0.0398 | 0.0053 | 0.0731 | |
| Cluster 2 | SOGA | 0.0401 | 0.0053 | 0.0730 |
| RCGA | 0.0344 | 0.0052 | 0.0722 | |
| Cluster 3 | SOGA | 0.0348 | 0.0045 | 0.0671 |
| RCGA | 0.0348 | 0.0045 | 0.0667 | |
| Cluster 4 | SOGA | 0.0351 | 0.0048 | 0.0690 |
| RCGA | 0.0342 | 0.0044 | 0.0666 | |
| Second level | SOGA | 0.0354 | 0.0047 | 0.0682 |
| RCGA | 0.0334 | 0.0045 | 0.0673 | |
| Standard FCM | SOGA | 0.0389 | 0.0055 | 0.0740 |
| RCGA | 0.0397 | 0.0054 | 0.0736 |
Publisher’s Note: MDPI stays neutral with regard to jurisdictional claims in published maps and institutional affiliations. |
© 2020 by the authors. Licensee MDPI, Basel, Switzerland. This article is an open access article distributed under the terms and conditions of the Creative Commons Attribution (CC BY) license (http://creativecommons.org/licenses/by/4.0/).
Share and Cite
MDPI and ACS Style
Poczeta, K.; Papageorgiou, E.I.; Gerogiannis, V.C. Fuzzy Cognitive Maps Optimization for Decision Making and Prediction. Mathematics 2020, 8, 2059. https://0-doi-org.brum.beds.ac.uk/10.3390/math8112059
AMA Style
Poczeta K, Papageorgiou EI, Gerogiannis VC. Fuzzy Cognitive Maps Optimization for Decision Making and Prediction. Mathematics. 2020; 8(11):2059. https://0-doi-org.brum.beds.ac.uk/10.3390/math8112059
Chicago/Turabian StylePoczeta, Katarzyna, Elpiniki I. Papageorgiou, and Vassilis C. Gerogiannis. 2020. "Fuzzy Cognitive Maps Optimization for Decision Making and Prediction" Mathematics 8, no. 11: 2059. https://0-doi-org.brum.beds.ac.uk/10.3390/math8112059
Note that from the first issue of 2016, this journal uses article numbers instead of page numbers. See further details here.