Article

Energy Efficiency and Fuel Economy of a Fuel Cell/Renewable Energy Sources Hybrid Power System with the Load-Following Control of the Fueling Regulators

by
Nicu Bizon
1,2,3,* and
Phatiphat Thounthong
4
1
Faculty of Electronics, Communications and Computers, University of Pitesti, 110040 Pitesti, Romania
2
National Research and Development Institute for Cryogenic and Isotopic Technologies—ICSI Rm., Valcea, Uzinei Street, No. 4, P.O. Box 7 Raureni, Rm., 240050 Valcea, Romania
3
Doctoral school, Polytehnic University of Bucharest, 313 Splaiul Independentei, 060042 Bucharest, Romania
4
Renewable Energy Research Centre (RERC), King Mongkut’s University of Technology North Bangkok, Bangkok 10800, Thailand
*
Author to whom correspondence should be addressed.
Submission received: 31 December 2019 / Revised: 16 January 2020 / Accepted: 18 January 2020 / Published: 21 January 2020
(This article belongs to the Special Issue Mathematical Methods applied in Power Systems)

Abstract

:
Two Hybrid Power System (HPS) topologies are proposed in this paper based on the Renewable Energy Sources (RESs) and a Fuel Cell (FC) system-based backup energy source. Photovoltaic arrays and wind turbines are modeled as RESs power flow. Hydrogen and air needed for FC stack to generate the power requested by the load are achieved through the Load-Following control loop. This control loop will regulate the fueling flow rate to load level. A real-time optimization strategy for RES/FC HPS based on Extremum Seeking Control will find the Maximum Efficiency Point or best fuel economy point by control of the boost converter. Therefore, two HPS configurations and associated strategies based on Load-Following and optimization loops of the fueling regulators were studied here and compared using the following performance indicators: the FC net power generated on the DC bus, the FC energy efficiency, the fuel consumption efficiency, and the total fuel consumption. An increase in the FC system’s electrical efficiency and fuel economy of up to 2% and 12% respectively has been obtained using the proposed optimization strategies compared with a baseline strategy.

1. Introduction

Renewable energy sources (RES) have earned particular attention in recent decades as a potential solution to the fossil fuels depletion and the forecast of rapid climate change [1], but current energy systems will not be able to handle future energy demand [2]. The worldwide energy demand will have increased by about 1.5 times from 2014 to 2040, so carbon dioxide emissions are likely to increase in almost the same measure. Over 47 billion metric tons are expected in 2040 due to the current fossil fuel consumption rate of 82.4 million barrels per day, which is projected to grow exponentially in the coming decades [3]. In addition, the energy generated from the fossil-based on petrol, coal and natural gas reserves will decrease quickly in the coming decades [4].
The environment could be better preserved and protected if RES is used in the future for electricity production on a larger scale. Solar and wind energy systems have the following advantages: solar energy is inexhaustible and non-polluting, and has no harmful effects on the atmosphere; wind energy has zero emission of polluting substances. These types of renewable energy sources are inexhaustible and the equipment (such as the photovoltaic (PV) panels, the wind turbines (WT), and the inverters) has a long lifetime and easy maintenance [5].
The PV/WT Hybrid Power Systems (called RES HPS) along with Energy Storage Systems (ESS) are widely used [6]. In general, the two energy sources—solar energy and wind energy—are complementary [7]. By combining two renewable energy sources with ESS, the power-split strategy can optimally ensure the load demand [8,9]. The RES HPS design is conditioned by the level of the load demand, implementation costs, required efficiency and polluting emissions [10,11].
The optimal design of HPS is a huge task because the optimal configuration depends on the prediction of the energy sources profile based on variable environmental conditions and the load profiles as well [12]. Studies on modeling, configurations, planning, and optimization techniques of HPS have been conducted for various locations and constraints [13,14,15,16,17,18,19,20,21,22,23,24,25,26,27]. Autonomous energy systems may contain a conventional energy source (diesel generator) or a Fuel Cell (FC) system as a backup energy source [28,29].
Due to polluting emissions, the diesel generator is replaced with the FC system [29,30,31]. This RES/FC HPS is very efficient at low and medium power [32]. Polymer Electrolyte Membrane FC (PEMFC) stack is used in hybrid systems based on RES due to its advantages vs other types of fuel cells stacks [33,34].
One of the most important objectives of any energy management strategy is to minimize the total fuel consumption of the PEMFC stack.
The optimal control of PEMFC hybrid power systems is proposed as the best energy management strategy for fuel economy [35,36,37,38,39] based on convex programming [37] and Pontryagin’s Minimum Principle [38]. Other studies propose an optimization function as a mix of the FC lifetime and fuel economy [39]. Techniques to control the DC voltage were studied in [40,41].
It is mandatory for a hybrid system to include an ESS which stores the excess energy from the RES in order for it to be used to supply the load during a lack of RES power [42,43,44,45]. ESS devices are usually batteries and ultracapacitors [42]. Batteries are used as energy storage devices (having specific energy higher than that of the ultracapacitors), ensuring energy needs are met for a longer period [43]. The bidirectional power converters control the power flows from the ultracapacitors stack or both batteries and ultracapacitors stacks in the ESS semi-active or active ESS topologies [44].
It is worth mentioning that many studies on controlling power of renewable hybrid power system have been proposed recently in order to improve the overall performance by appropriate control of the power flows on the DC bus [46,47,48] in comparison with baseline topologies using a FC system as auxiliary energy source [45]. For example, a two-layer control strategy has been proposed for easy integration of ultracapacitors in a grid connected HPS using a model predictive control of the power flows [46]. The main drawback of the various control methods related to the need for a complete restructuring of the control system has been highlighted in this study. To solve this issue, a lot of control strategies based on artificial intelligence concepts have been proposed in the literature [47]. Some of them have been validated in simulation using models available in the literature [48], included in SimPowerSystems library [49], or developed based on the bond graph approach [50], but others have been tested using an experimental setup [51].
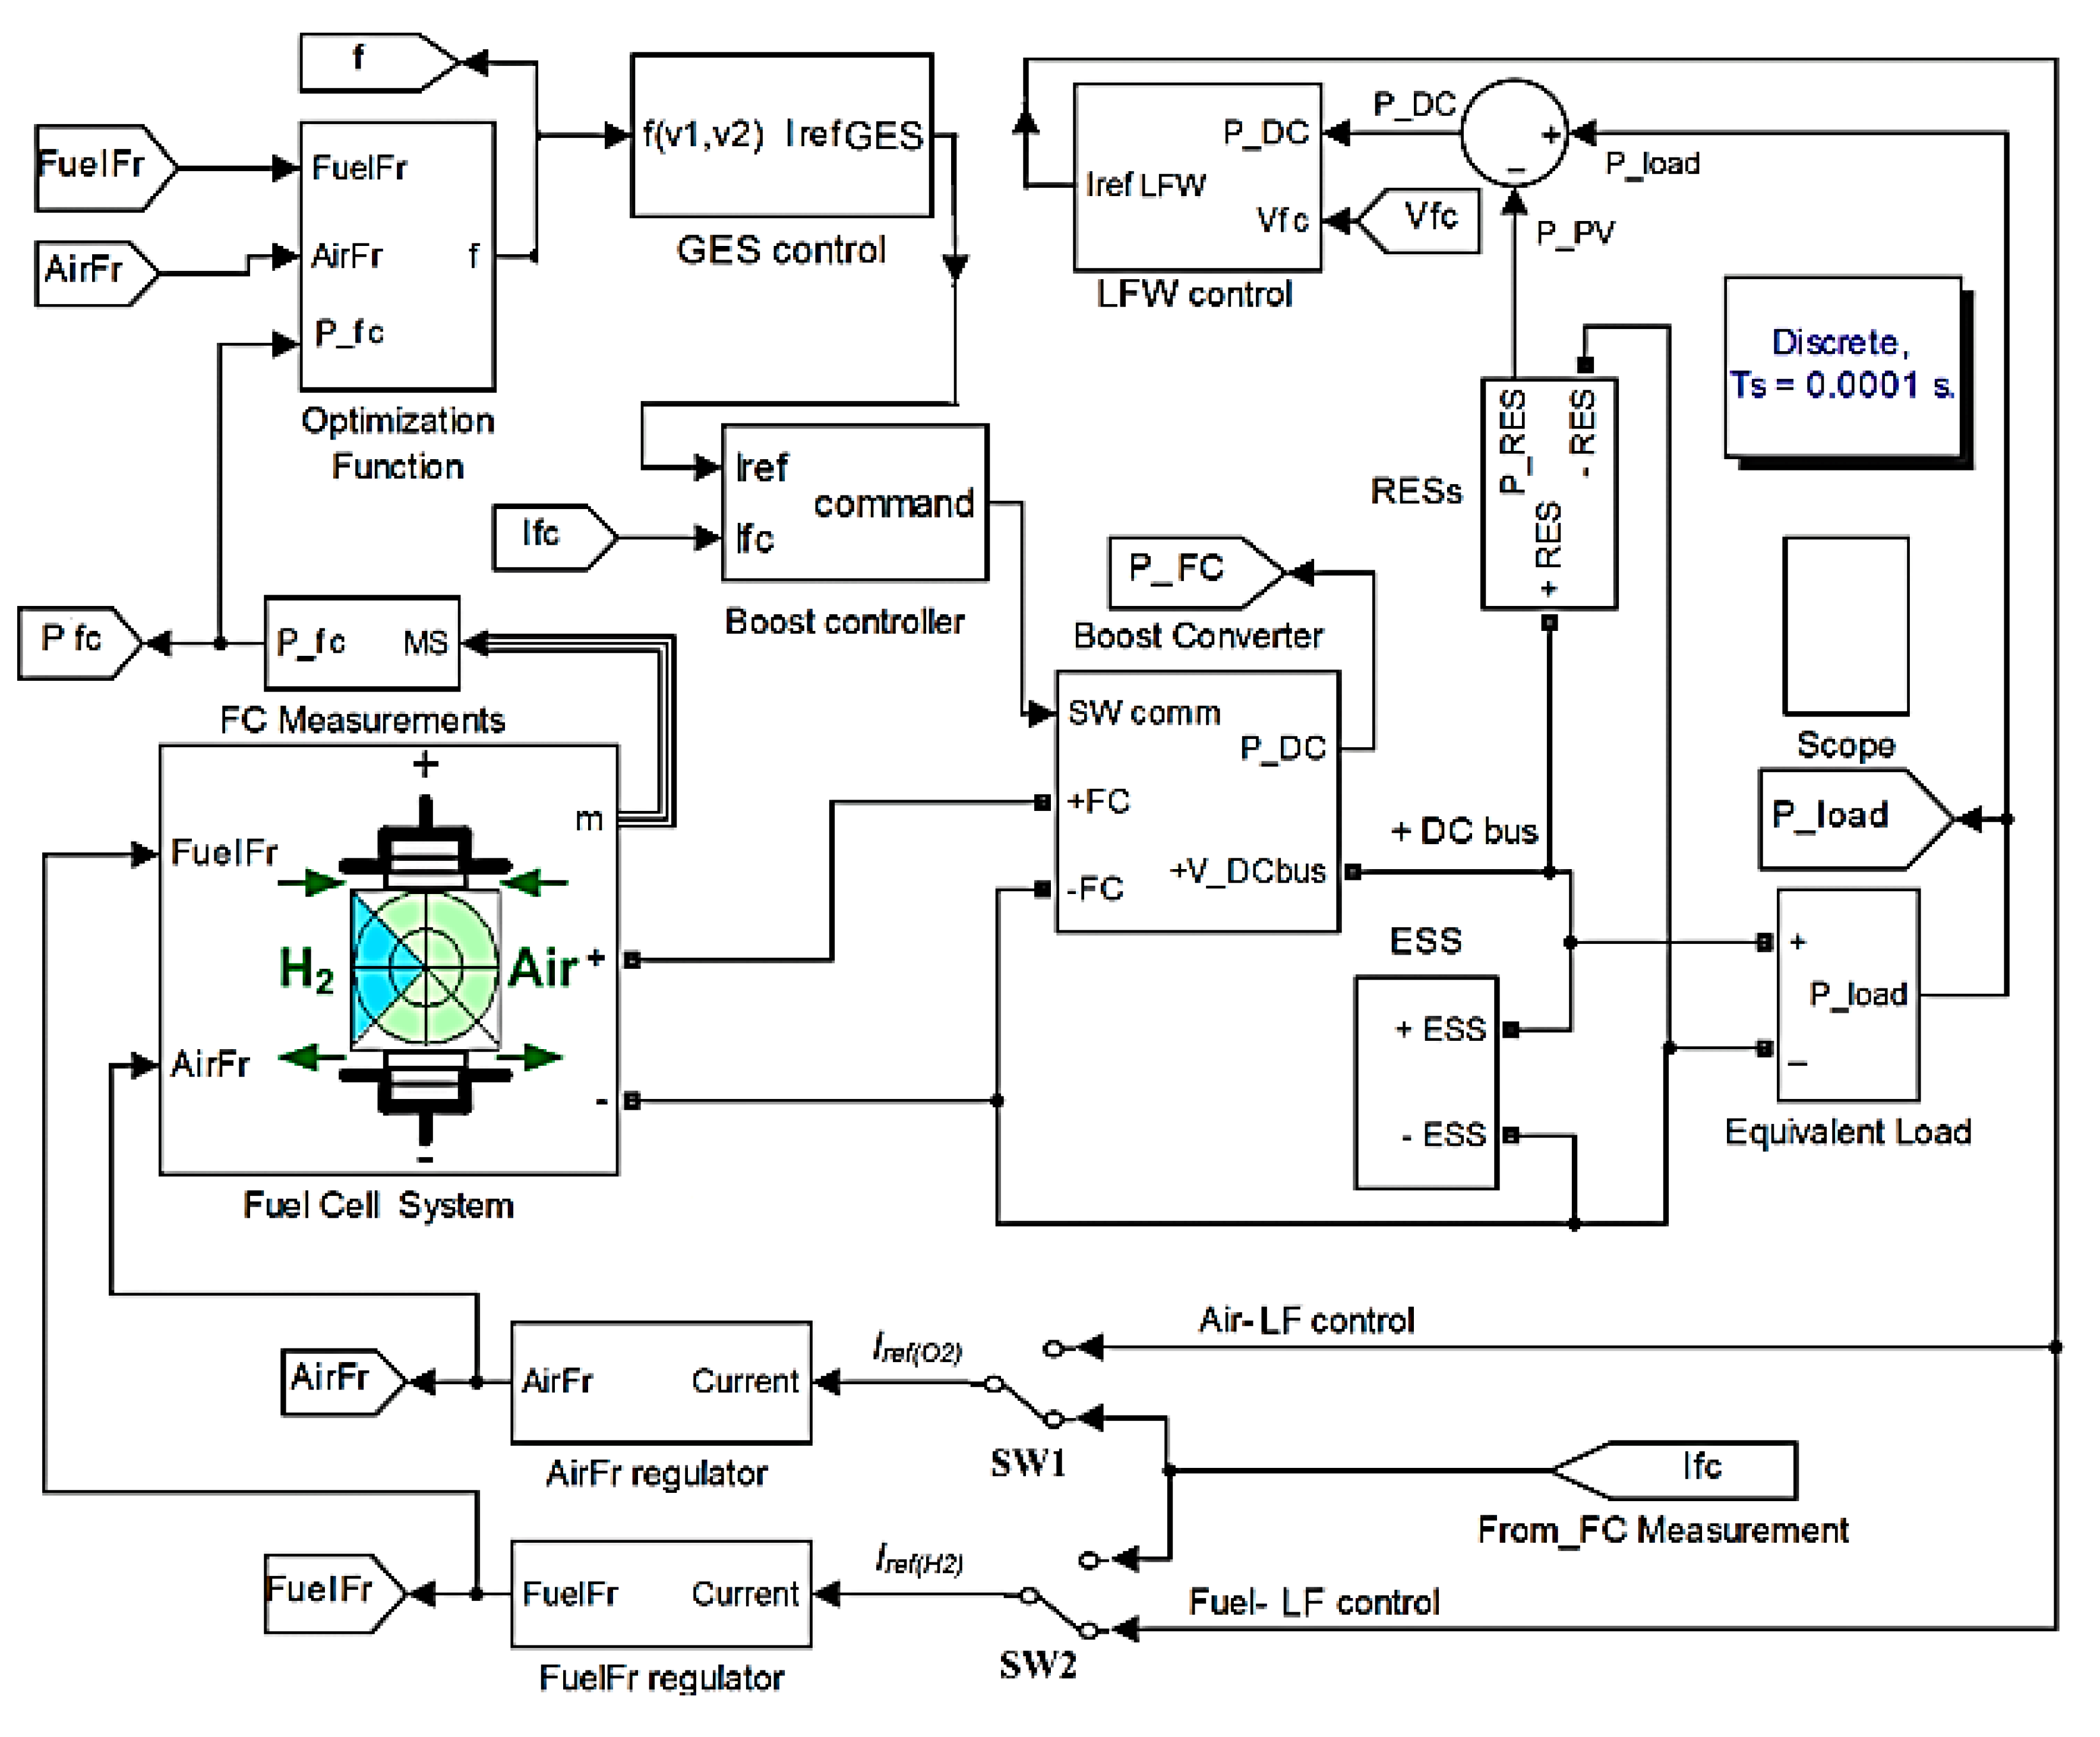
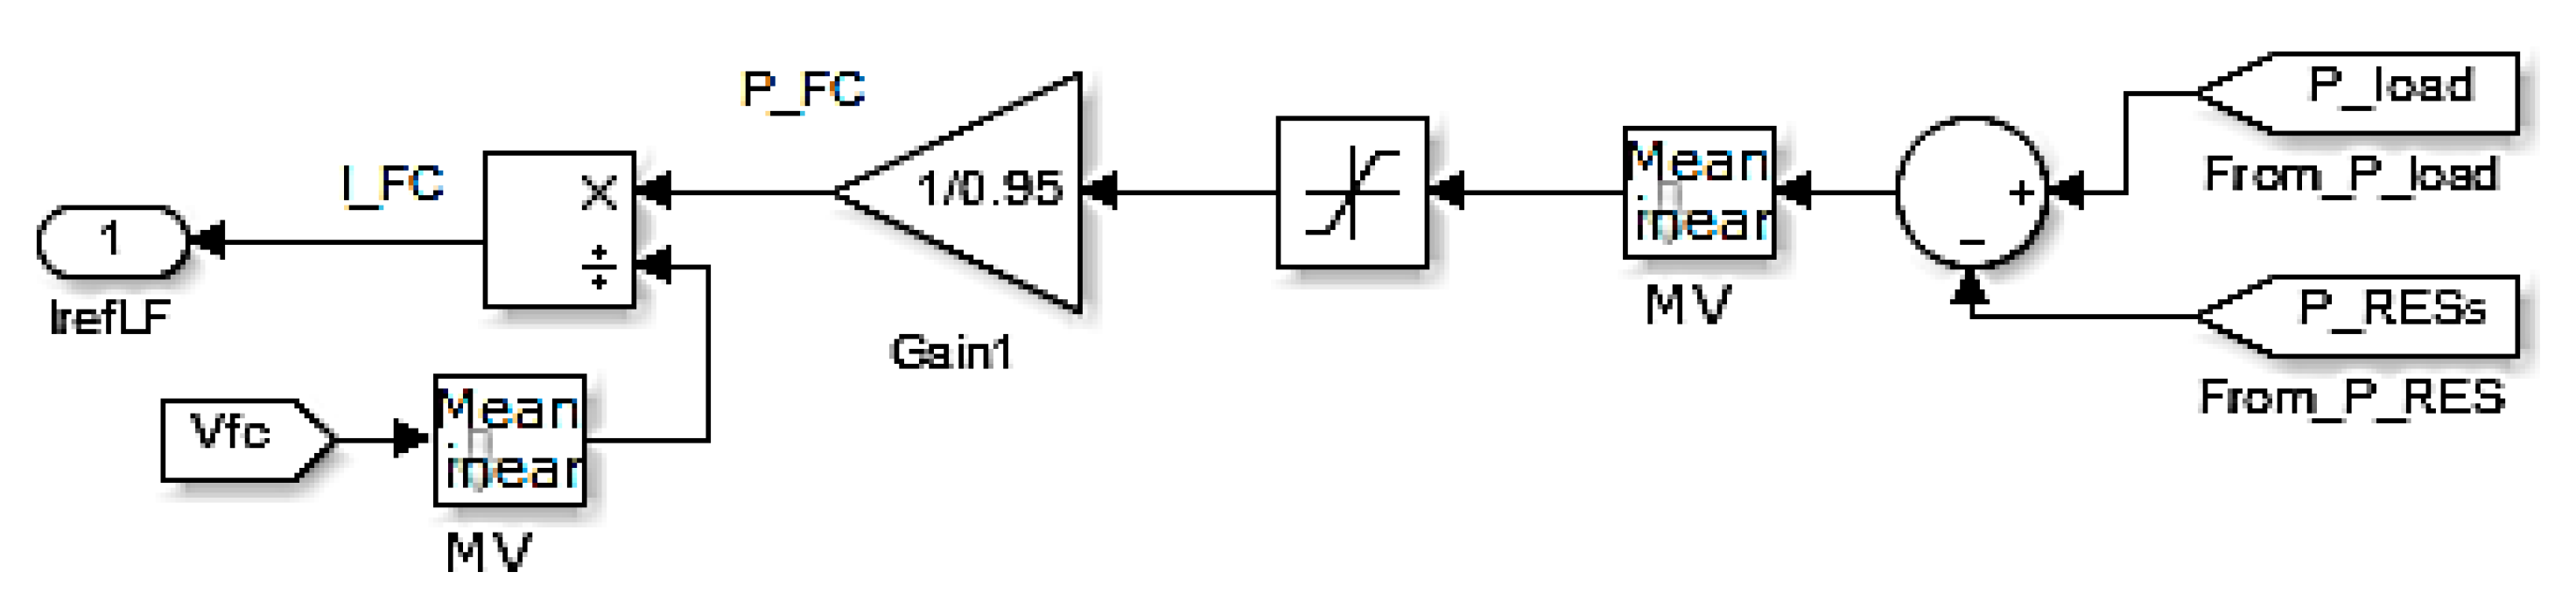
The proposed power-split strategy for the PEMFC/RES HPS is based on Load-Following (LFW) control of needed power on DC bus (pDC), pDC = pload − pRES, where pRES and pLoad are RES power and load demand on the DC bus.
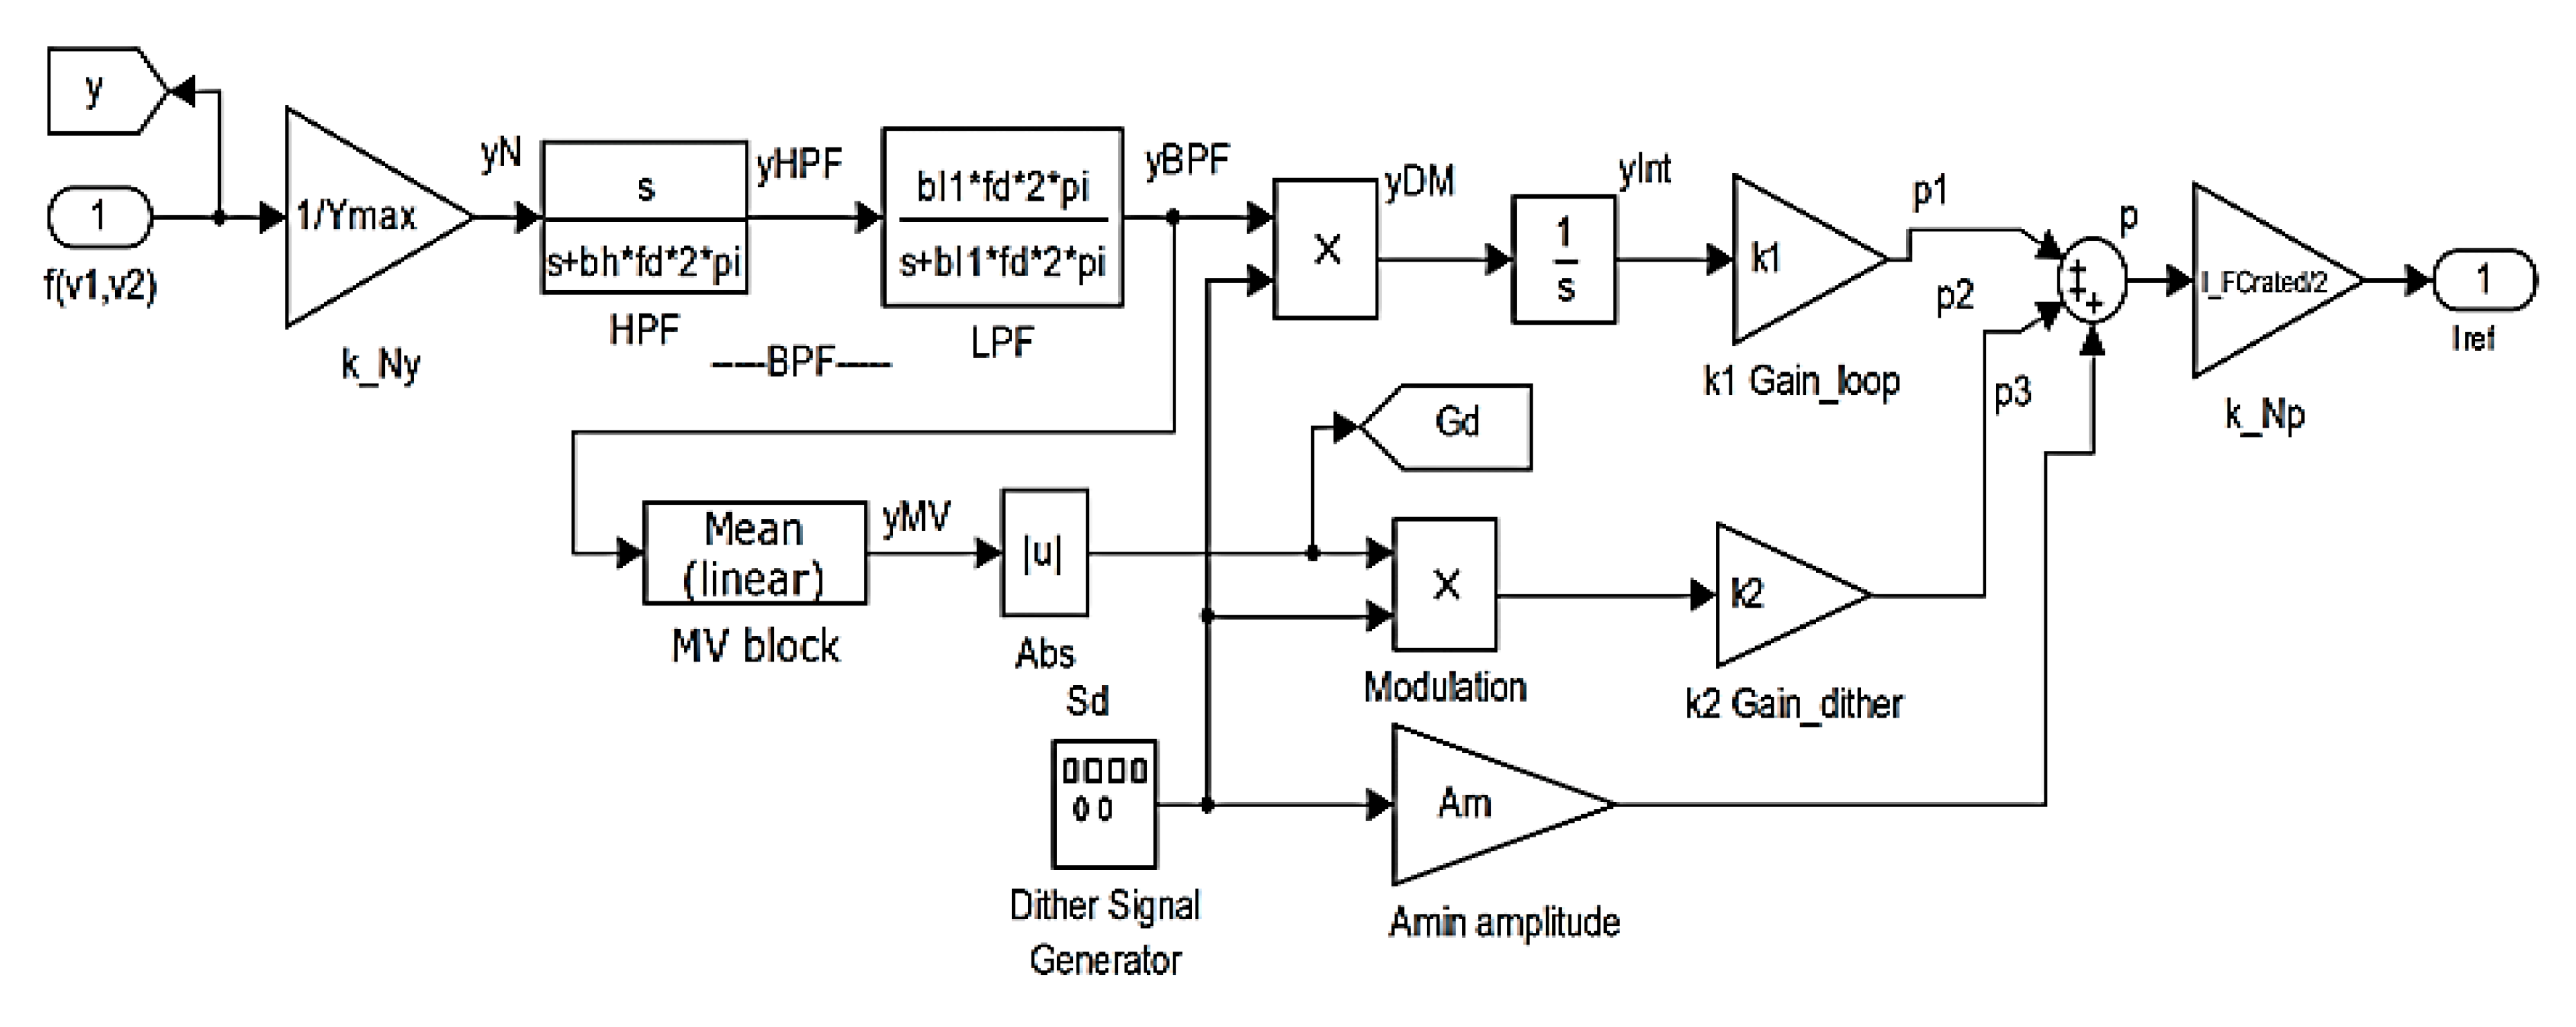
The Extremum Seeking Control (ESC) is proposed here to find the Maximum Power Point (MPP) of the FC net power, which is the Maximum Efficiency Point (MEP) of the FC system. The ESC proposed here is based on the Global Extremum Seeking (GES) scheme [52], which can find the MEP in real-time. Therefore, the Real-Time Optimization (RTO) loop will optimally operate the PEMFC system.
Two Hybrid Power System (HPS) topologies and their appropriate strategies are proposed in this paper based on LFW control of the air regulator (called Air-LFW-based strategy) and the fuel regulator (called Air-LFW-based strategy).
The novelty and main objectives of this study are as follows: (1) to analyze the behavior of the Air-LFW-based strategy for constant and variable load demand up to 8 kW; (2) to evaluate the fuel economy for Air-LFW-based strategy compared to a reference strategy called the Static Feed-Forward (sFF) strategy [45]; (3) to improve the fuel economy using a optimization function based on FC net power and efficiency of hydrogen consumption.
Therefore, this study will highlight the fuel economy of the Fuel-LFW-based strategy compared to Air-LFW-based strategy in range of 0.33–1.25% from the rated 6 kW power of the FC system. For example, a fuel economy of 68 liters [l] per minute [lpm] will be obtained under a constant load of 8 kW. Thus, an optimum strategy of fuel consumption can use the Air-LFW and Fuel-LFW strategies for load demand higher and lower respectively than nominal value of 6 kW FC stack.
On the other hand, an optimum strategy of FC energy efficiency can use the Air-LFW strategy and Fuel-LFW strategy for load demand lower and higher respectively than the nominal value of 6 kW FC stack. Therefore, for example, Air-LFW strategy is best for an FC vehicle driving on highway and Fuel-LFW strategy is needed by an FC vehicle climbing a hill.
The aforementioned findings are also sustained by the results obtained by comparing the Air-LFW and Fuel-LFW strategies with the sFF strategy.
This paper is organized as follows: The second section briefly presents the models used in simulation: the fuel cell systems, the energy storage system, the power profile of renewable energy sources, and the equivalent load. The ESC and LFW control loops, the performance indicators, and the optimization function used are also presented in Section 2. The simulation results are shown in Section 3 for constant load profile without RES power, constant load profile and same RES power, and variable profiles for both load and RES power flows. The last section concludes the paper.

2. The Models Used in Simulation

2.1. Polymer Electrolyte Membrane Fuel Cell System

The PEMFC system generates energy using chemical reactions without harmful gases emission. For an FC system using hydrogen (anode) and oxygen (cathode) as reactants, the only reaction product is the drinkable water. The PEMFC is the best option for FC/HPS thanks to hydrogen high energy density, lack of polluting emissions, and long lifetime, which ensures efficient operation if it is powered with hydrogen. Additionally, this fuel cell has high efficiency, a lower temperature in the exploitation process, and it can follow the power required by the load with a delay of hundreds of milliseconds, which is mainly given by the FC time constant and 100 A/s slope limiters used by the fueling regulators [45].
The lack of power on the DC bus will be dynamically compensated by the ultracapacitors’ stack. The RES/FC HPS topology is presented in Figure 1.
The Fuel-LFW and Air-LFW control loops are obtained with switches SW1 and SW2 on positions shown in Figure 1 and on top positions, respectively.
The average balance of power flows on DC bus is given in both cases by Equation (1):
P R E S + P E S S + η 1 P F C n e t = P l o a d ,
where P R E S , P E S S , P F C n e t , P l o a d are the average values of the power flows for the hybrid system and η 1 = 0.95 is the average energy efficiency of the boost converter. If P E S S = 0 (the battery operates in charge-sustained mode) the FC net power needed to be generated under LFW control will be given by (2):
P F C n e t = P l o a d P R E S η 1 = ( P l o a d P R E S )   × G a i n 1 ,
where G a i n 1 = 1 η 1 .
The FC has a number of auxiliary components (such as compressor, humidifier, etc.) that consume a part of the energy generated by the fuel cell. The remaining power is the FC net power (3):
p F C n e t = p F C p a u x ,
where   p a u x is the power required by the auxiliary components.
A 6 kW/45 V PEMFC will be used in this study. The FC system is modeled using the available detailed model from the SimPowerSystems library [49]. The air compressor is considered here as the main power consumer, the power of which is calculated with Equation (4) [53]:
P c m = ( a 2 A i r F r 2 + a 1 A i r F r + a 0 ) · ( b 1 I F C + b 0 ) ,
where IFC is the FC current, AirFr is the compressor air flow rate, and a 0 = 0.6 ,   a 1 = 0.04 ,   a 2 = 0.00003231 ,   b 0 = 0.9987 ,   b 1 = 46.02   [53]. The compressor is modeled with the help of the static function f(u) given by (4) and a dynamic system of the second order, and Figure 2 shows the diagram of the compressor model, where G a i n 2 = 45 / 100 is the static gain for which the compressor power is of about 1 kW in nominal operating conditions of the FC system.
The fueling flow rates for fuel (FuelFr) and air (AirFr) are as follows:
F u e l F r = 60 , 000 · R ( 273 + θ ) · N C · I r e f ( H 2 ) 2 F ( 101 , 325 · P f ( H 2 ) ) · ( U f ( H 2 ) 100 ) · ( X H 2 / 100 ) ,
A i r F r = 60 , 000 · R ( 273 + θ ) · N C · I r e f ( O 2 ) 4 F ( 101 , 325 · P f ( O 2 ) ) · ( U f ( O 2 ) 100 ) · ( X O 2 / 100 )   ,
where R = 8 , 3145   J / ( molK ) ; F = 96 , 485   As / mol , N C = 65 cells in series,   θ = 65 °C, I r e f ( H 2 ) and I r e f ( O 2 ) are the reference currents, and other default parameters are mentioned in [43].
The proposed strategy uses the reference currents I r e f ( O 2 ) and I r e f ( H 2 ) (for the AirFr and FuelFr regulators in the Air-LFW and Fuel-LFW strategies, respectively) that are set by the LFW control, using the switches SW1 and SW2 as follows.
The SW1 and SW2 will be set on positions “Air-LF control” (the output of the LFW control) and “IFC” (the FC current from FC measurements) for the Air-LFW strategy. Therefore, for the Air-LFW strategy:
I r e f ( O 2 ) = I r e f ( L F W )   a n d   I r e f ( H 2 ) = I F C .
The switches SW1 and SW2 will be switched on the other position for the Fuel-LFW strategy. Thus, the SW1 and SW2 will be set on positions “Fuel-LF control” (the output of the LFW control) and “IFC” (the FC current from FC measurements) for the Fuel-LFW strategy. Therefore, for the Fuel-LFW strategy:
I r e f ( O 2 ) = I F C   a n d   I r e f ( H 2 ) = I r e f ( L F W ) .
Note that both Air-LFW and Fuel-LFW strategies optimize the fuel consumption using the same optimization function described by (9):
f ( v 1 , v 2 ) = k n e t P F C n e t + k f u e l F u e l e f f ,
where v 1 = A i r F r   and v 2 = F u e l F r are the searching variables for the optimum, and k n e t and k f u e l are the weighting parameters that set the optimization objective: maximization of the P F C n e t if k f u e l = 0 or maximization of the both P F C n e t and F u e l e f f if k f u e l 0 .
In the first case study (called case A: knet = 0.5, kfuel = 0) the FC net power P F C n e t will be maximized, so the optimization strategy will track the Maximum Efficiency Point (MEP). Note that the electrical energy efficiency of the PEMFC system ( η sys = P F C n e t / P F C [%]) will be improved as well.
In the second case the optimization function is oriented for fuel economy by adding the second term k f u e l F u e l e f f , where F u e l e f f = P F C n e t / F u e l F r measures the fuel consumption efficiency. Two case studies (called case B and case C when knet = 0.5 and kfuel = 25, and knet = 0.5 and kfuel = 50, respectively) will be considered in this paper in order to analyze the effect of parameter k f u e l in the obtained fuel economy. The optimum value of the parameter k f u e l for the best fuel economy can be obtained by a sensitivity analysis of this parameter.
The optimization function (9) is computed in the function block shown in Figure 1 by using the aforementioned relations for P F C n e t and F u e l e f f . The search for optimum of the f ( v 1 , v 2 ) = k n e t P F C n e t + k f u e l F u e l e f f can be made using a global searching algorithm from the literature. In this paper, the global searching algorithm based on Extremum Seeking has been considered due to reported performance for global search on the multimodal functions. The Global Extremum Seeking (GES) algorithm generates the reference I r e f ( G E S ) for the controller of the boost DC-DC power converter:
I r e f ( b o o s t ) = I r e f ( G E S ) .
For example, using a 0.1 A hysteresis controller for the boost DC-DC power converter, the reference I r e f ( G E S ) will be followed by the FC current (the second inputs of the hysteresis controller) and then by FuelFr based on Equations (5) and (7), or by AirFr based on Equations (6) and (8). Thus, the searching loop for the optimum is closed by setting the next values for the fueling flow rates FuelFr and AirFr.
It is worth mentioning that the settings for the sFF strategy are as follows [45]:
I r e f ( O 2 ) = I r e f ( H 2 ) = I F C   a n d   I r e f ( b o o s t ) = I r e f ( L F W ) ,
The sFF strategy does not use an optimization loop, so a better fuel economy is expected for the Air-LFW and Fuel-LFW strategies compared to the sFF strategy. The Results section highlights this advantage of using an optimization loop.
The fuel cell system can supply the DC bus with power, either the load or the ESS. During the regenerative load phases (for example the braking or deceleration phases of a vehicle), when the load power changes the sign (Pload < 0), the regenerative load flow charges the battery [42]. The fuel cell system is better to operate in standby-mode during regenerative braking stages, avoiding the rather complex start–stop actions [42]. The excess of renewable power will determine the battery to operate in charging mode [44].

2.2. Energy Storage System

A semi-active topology is used for the ESS. The battery stack is directly connected on the DC bus and the ultracapacitors is connected via a bidirectional DC-DC converter [54]. If the LFW control is not used, the ESS will operate alternatively in charging- and discharging-modes due to RES power variation. The ESS accumulates the energy during periods of surplus excess and then the energy is released during times of power shortage [55]. The lithium-ion batteries are commonly used in practical applications (including the fuel cell vehicles) due to their performances [42]. The lithium-ion battery and the ultracapacitors’ stack are modeled using the available models from the SimPowerSystems library [49]. The initial battery state of charge (SOC) is established here at 70%, the nominal voltage at 200 volts, and the nominal capacity is of 100 Ah. The ultracapacitor stack is necessary to dynamically compensate the sharp power profile of the load due to the step variations of the consumption. The ultracapacitors are modeled here using the well-known electric circuit [56,57]. The number of charge/discharge cycles is limited for batteries vs ultracapacitors stack, the cycles of which are unlimited. Therefore, the charge-sustained mode of operation is obtained here due to LFW control of the AirFr or FuelFr.

2.3. DC-DC Converters

The DC-DC converters are used as an interface between the backup power source (fuel cell) and ultracapacitors stacks with the DC bus. The boost converter is used to operate the FC system at Maximum Efficiency Point (MEP) based on the ESC scheme that will find the maximum of the FC net power. The power flow from ultracapacitor to the DC bars is controlled by the buck-boost convertor to ensure power flows balance, and this adjusts the voltage on the DC bus as well [43]. The converter modeling is done using electrical devices included in SimPowerSystems library [49].

2.4. Renewable Energy Sources

Renewable energy sources—which include solar energy and wind—are inexhaustible, clean, and economically beneficial, but depend largely on the weather. WT and PV energy resources are complementary in a certain period of time, being integrated into RES HPS using different energy management strategy [5]. The diagram of the RES model is shown in Figure 3.
The profile of the RES power is also presented in Figure 3 for a sunny/cloudy day with moderate wind. The top value of the power for RES is 4.8 kW and the average value during a load cycle is about 2.2 kW. Because of the random nature of the RES (PV and WT), the power produced differs from the power required by the load. Therefore, a backup source is necessary [58].

2.5. The Equivalent Load

A controlled power source operating in constant or variable power mode is used to model the equivalent load demand on the DC bus (Figure 4).
Furthermore, the power ripple on the DC bus is modeled by the different levels of the first three harmonics resulting due to normal operation of the inverter.

2.6. The Extremum Seeking Control

The Extremum Seeking Control (ESC) scheme used here to find the MEP (maximum of the FC net power or of the fuel economy optimization function f ( v 1 , v 2 ) = k n e t P F C n e t + k f u e l F u e l e f f ) is that proposed in [52] due to its performance (the GES feature) and simple implementation (see GES control block in Figure 1 and the ESC diagram in Figure 5). The reader interested to find more information about the ESC design is redirected to [59,60], where numerous design examples are presented and the ESC performance is fully evaluated.
The parameters and values used in simulation performed here for the ESC are the following:
  • the dither frequency is f d = 1/ T d = 100 Hz;
  • the loop gain ( k 1 = ωd);
  • the dither gain ( k 2 = 2);
  • the cut-off frequency of the high-pass filter (HPF), f h = b h f d , where b h = 0.1;
  • the cut-off frequency of the low-pass filter (LPF), f l = b l f d , where b l = 5.5;
  • the normalization gain of the FC net power is k N y = 1 / Y m a x = 1 / 500;
  • the normalization gain of the searching signal is k N p = I F C ( r a t e d ) / 2 = 5 0;
  • the minimum sinusoidal amplitude is Am = 0.001.

2.7. The Load-Following Control

Considering Equation (2), the reference current (IrefLFW) can be evaluated using Equation (12):
I r e f L F W = ( P l o a d P R E S )   × G a i n 1 / V F C ,
The saturation block is used to set the lower and upper limits of the FC power (upper limit is infinite and the lower limit is 100 W to ensure the standby operation mode for FC system). The average energy efficiency of the converter is set to 0.95, so the static gain is G a i n 1 = 1 0.95 (see Figure 6). The Mean Value (MV) blocks calculate the average values in order to smooth the variables used in Equation (12).

2.8. The Performance Indicators

Besides the performance indicators that are usually used for RES/FC HPS during constant load demand such as the fuel consumption efficiency (Fueleff [W/lpm]) and the electrical energy efficiency of the PEMFC system (ηsys [%]), the Total Fuel consumption (FuelT measured in liters [l]) must be used for variable load demand:
F u e l e f f = P F C n e t / F u e l F r ,
η s y s = P F C n e t / P F C ,
F u e l T =   F u e l F r ( t ) d t ,
The differences in performance indicators (13a–c) are described by Equations (14a–d):
Δ   P F C n e t = P F C n e t 1 P F C n e t 2 ,
Δ   η s y s =   η s y s 1       η s y s 2 ,
Δ   F u e l e f f =   F u e l e f f 1 F u e l e f f 2 ,
Δ   F u e l T = F u e l T 1   F u e l T 2 ,
where subscripts 1 and 2 denote the results obtained for the Air-LFW and Fuel-LFW strategies, the Air-LFW and sFF strategies, and the Fuel-LFW and sFF strategies, which are registered in Table 1, Table 2 and Table 3, respectively.
It is worth mentioning that other performance indicators, such as specific power, power density, efficiency of H2 consumption (called effH2), and lifetime, can be used to evaluate the performance of an energy management strategy for FC systems. The efficiency of H2 consumption (15) is currently lower than 60%, but the target for coming decades is 70%:
e f f H 2 = 100 P F C o u t L H V H 2 c o n s u m e d ,
where the LHV is the lower heating value for hydrogen.

3. Results

For both Air-LFW and Fuel-LFW strategies the same load profile is used (constant load and variable load profile) to evaluate their performance based on performance indicators mentioned above: F u e l e f f [W/lpm], η s y s [%], and F u e l T [l].

3.1. Case Study 1: Constant Load Demand Without Renewable Power Flow

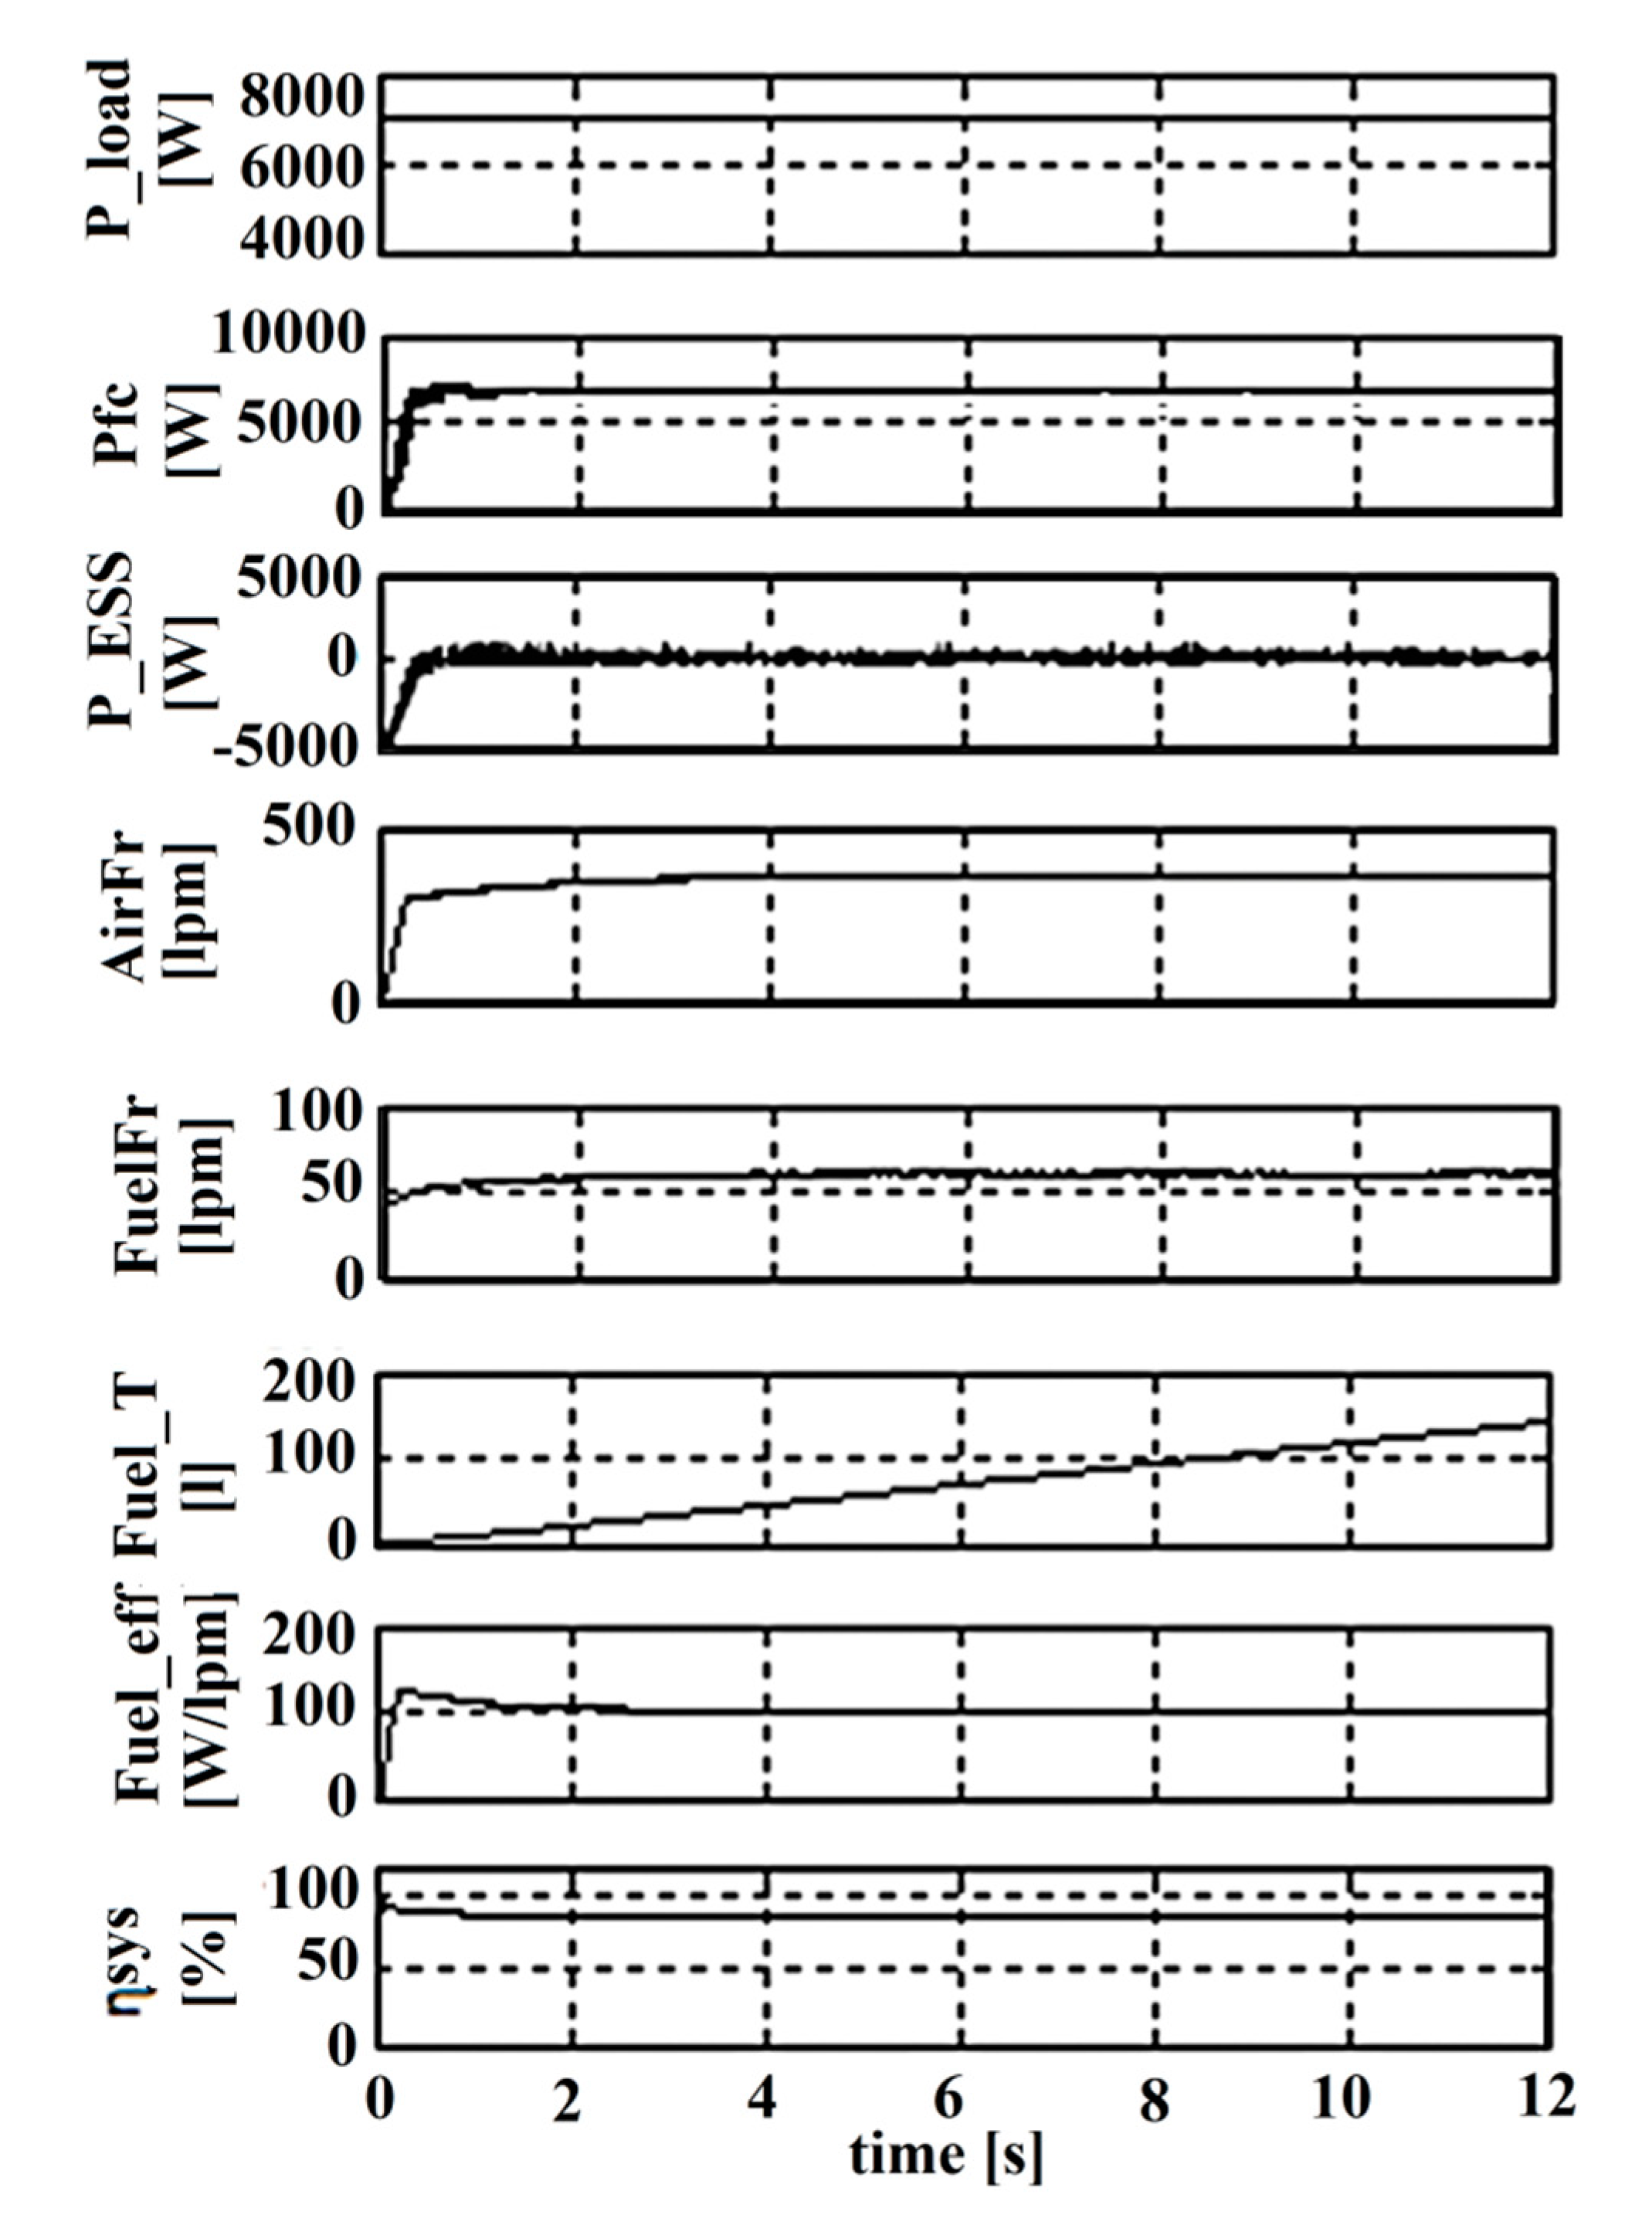
The behavior of the RES/FC HPS operating without RES power under 7 kW constant load power is shown in Figure 7 using the Fuel-LFW-based strategy. The plots in Figure 7 are as follows: the first graphic shows the 7 kW load; the second graphic shows the FC net power; the third graphic shows the ESS power; the fueling flow rates ( FuelFr and AirFr) are illustrated in the next two graphics; the performance indicators ( F u e l T   , F u e l e f f and η s y s ) are represented in the last three graphics. In case of the Fuel-LFW-based strategy, the results obtained are as follows: FC net power ( P F C n e t ) is 6170 W and the fuel flow rates are F u e l F r   = 61.7 lpm and AirFr = 362 lpm; the fuel efficiency, total fuel consumption, and FC system energy efficiency are F u e l e f f = 98,2 W/lpm, F u e l T = 150 l, η s y s = 86%.
In the case of the Air-LFW control the results are close to those obtained for Fuel-LFW control ( P F C n e t is 6138 W for F u e l F r = 64.54 l and AirFr = 390.9 l and the performance indicators F u e l e f f = 96.2 W/lpm, F u e l T = 152.3 l, and η s y s = 85.6%), so only the gaps (9) are mentioned in Table 1 to compare the Air-LFW and Fuel-LFW strategies in Case A (knet = 0.5, kfuel = 0).
The LFW control implemented for both Air-LFW and Fuel-LFW topologies forces the battery to operate in charge-sustained mode (see the third graphic in Figure 7, where P E S S power is approximately zero, except for the start-up phase).
The Air-LFW strategy compared with the Fuel-LFW strategy is better in fuel consumption ( Δ F u e l T < 0 and F u e l e f f > 0 ) at maximum load (in range 7.5 kW to 8 kW) and in FC energy efficiency ( Δ   η s y s > 0 and   Δ   P F C n e t > 0 ) at light load (up to 4.5 kW and 5.5 kW). Both strategies give appropriate results in nominal range of FC system (around 6 kW load). Thus, an optimum strategy in fuel consumption can use the Air-LFW strategy and Fuel-LFW strategy for load demand higher and lower than nominal value of 6 kW.
On the other hand, an optimum strategy in FC energy efficiency can use the Air-LFW strategy and Fuel-LFW strategy for load demand lower and higher than nominal value of 6 kW. For example, the first optimization strategy is requested by an FC vehicle driving on highway and the second is needed by an FC vehicle climbing a hill.
These conclusions are sustained by the obtained results by comparing the Air-LFW and Fuel-LFW strategies with the sFF strategy (see the gaps in each performance indicator ( Δ P F C n e t ,   Δ η s y s ,   Δ F u e l e f f ,     Δ F u e l T ) recorded in Table 2 and Table 3 in order to compare these strategies at light, nominal and maximum load).
For example, the fuel economies for the Air-LFW strategy compared to sFF strategy are slightly higher and much higher at nominal and maximum load respectively, but lower at light load. On the other hand, the fuel economies for the Fuel-LFW strategy compared to sFF strategy are higher in the full range of load. Thus, the Air-LFW and Fuel-LFW strategies can be used for load demand higher and lower than a threshold around 6 kW. The optimum threshold can be found using a sensitivity analysis of this parameter.

3.2. Case Study 2: Constant Load Demand and Available Renewable Power Flow

The behavior of the RES/FC HPS operating under variable RES power and 7 kW constant load power is shown in Figure 8 using the Air-LFW-based strategy with optimization function in Case A.
The structure of graphics in Figure 8 is the same as in Figure 7 with the exception of a graphic added to show the RES power. The battery still operates in charge-sustained mode due to the LFW control implemented for both topologies (see that the average value for P E S S is approximately zero on the fourth plot of Figure 8).
The gaps in fuel economy are given in Table 4 at different Pload, but same PRES. The Fuel-LFW strategy compared with the Air-LFW strategy is better in fuel consumption ( Δ F u e l T > 0 ) for load up to 8 kW (which means in average about 5.8 kW from FC system).
Note that this level was of about 7.5 kW power generated by the FC system without RES power. This means that the Fuel-LFW strategy compared with the Air-LFW strategy is better in fuel consumption for FC power up to nominal FC power, considering the optimization function in Case A: knet = 0.5, kfuel = 0.
In the next section, the optimization function will be considered in Case B and Case C to compare the fuel economy obtained for both strategies.

3.3. Case Study 3: Variable Profiles for Load and Renewable Power Flow

Simulation results for RES/FC HPS under constant and variable load profile and the same RES power were also performed for both strategies, but they were performed in Case B and Case C in order to compare the fuel economy for kfuel ≠ 0. The results obtained are shown in Table 5 and Table 6 for different values of the constant load and average values of the variable load.
The variable load is defined as Pload(AV), 125% Pload(AV), and 75% Pload(AV) for the three steps of 4 s, resulting the average value (Pload(AV)) mentioned in first column of 
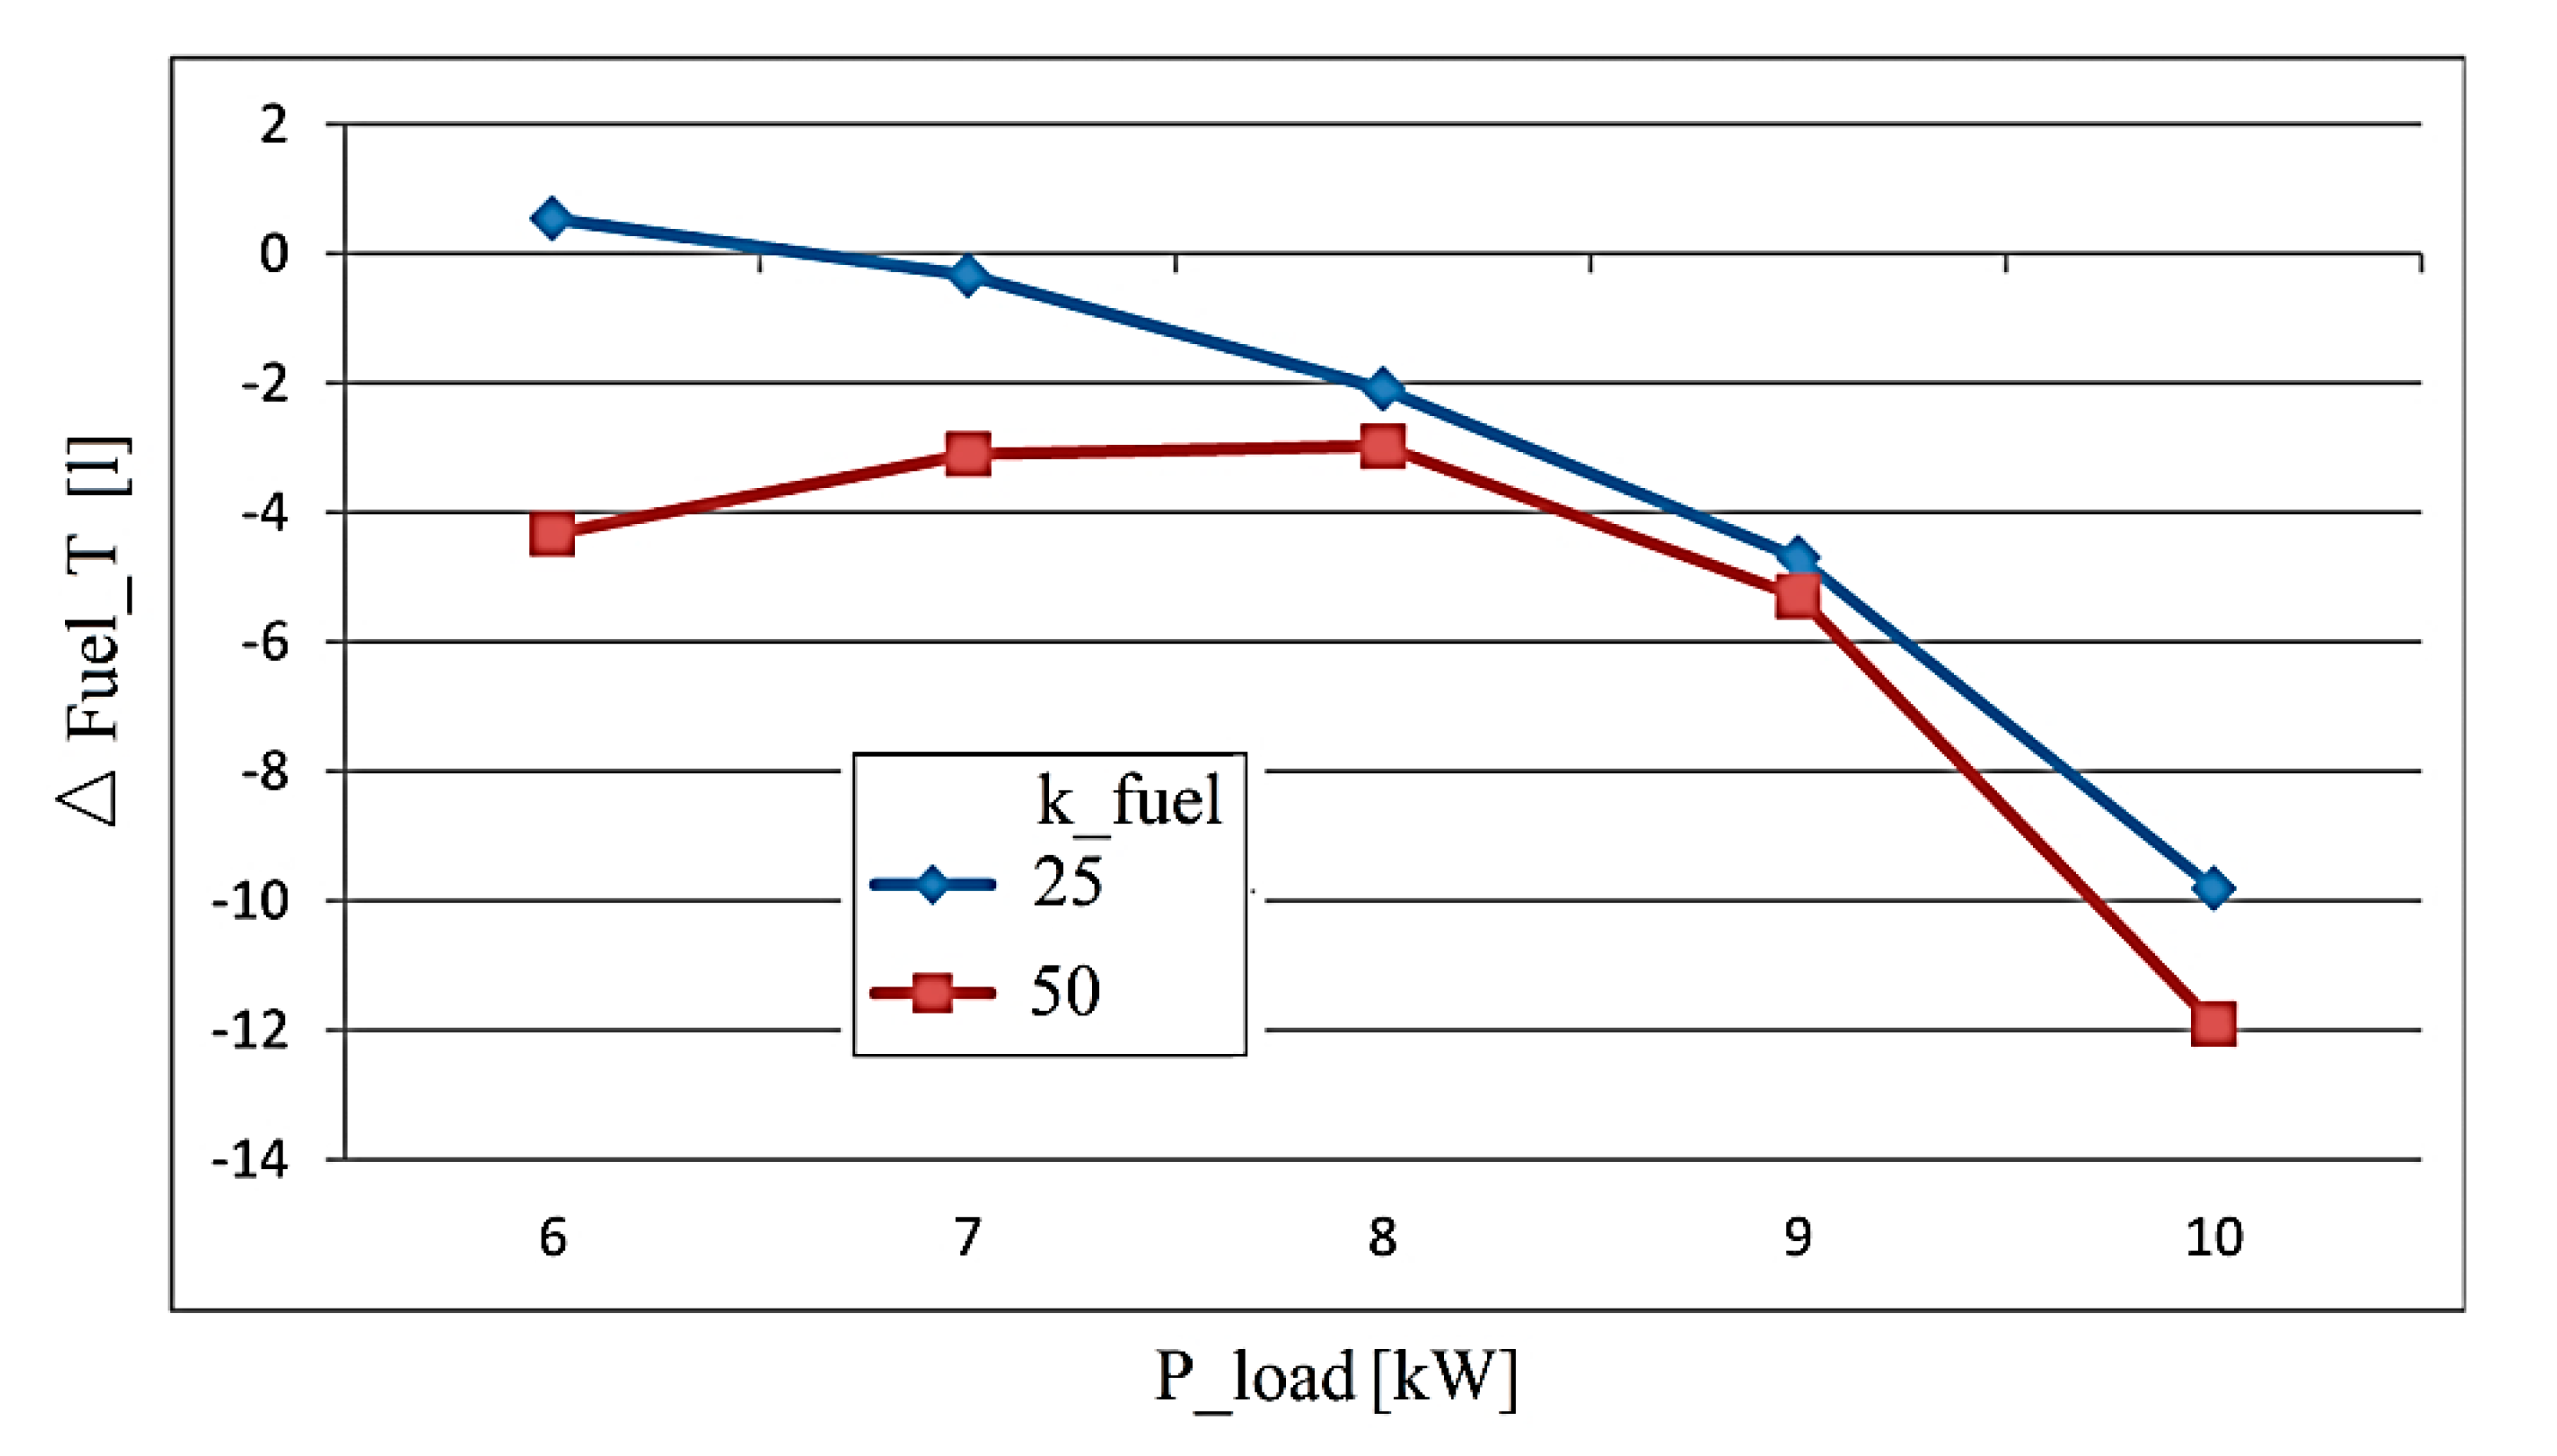
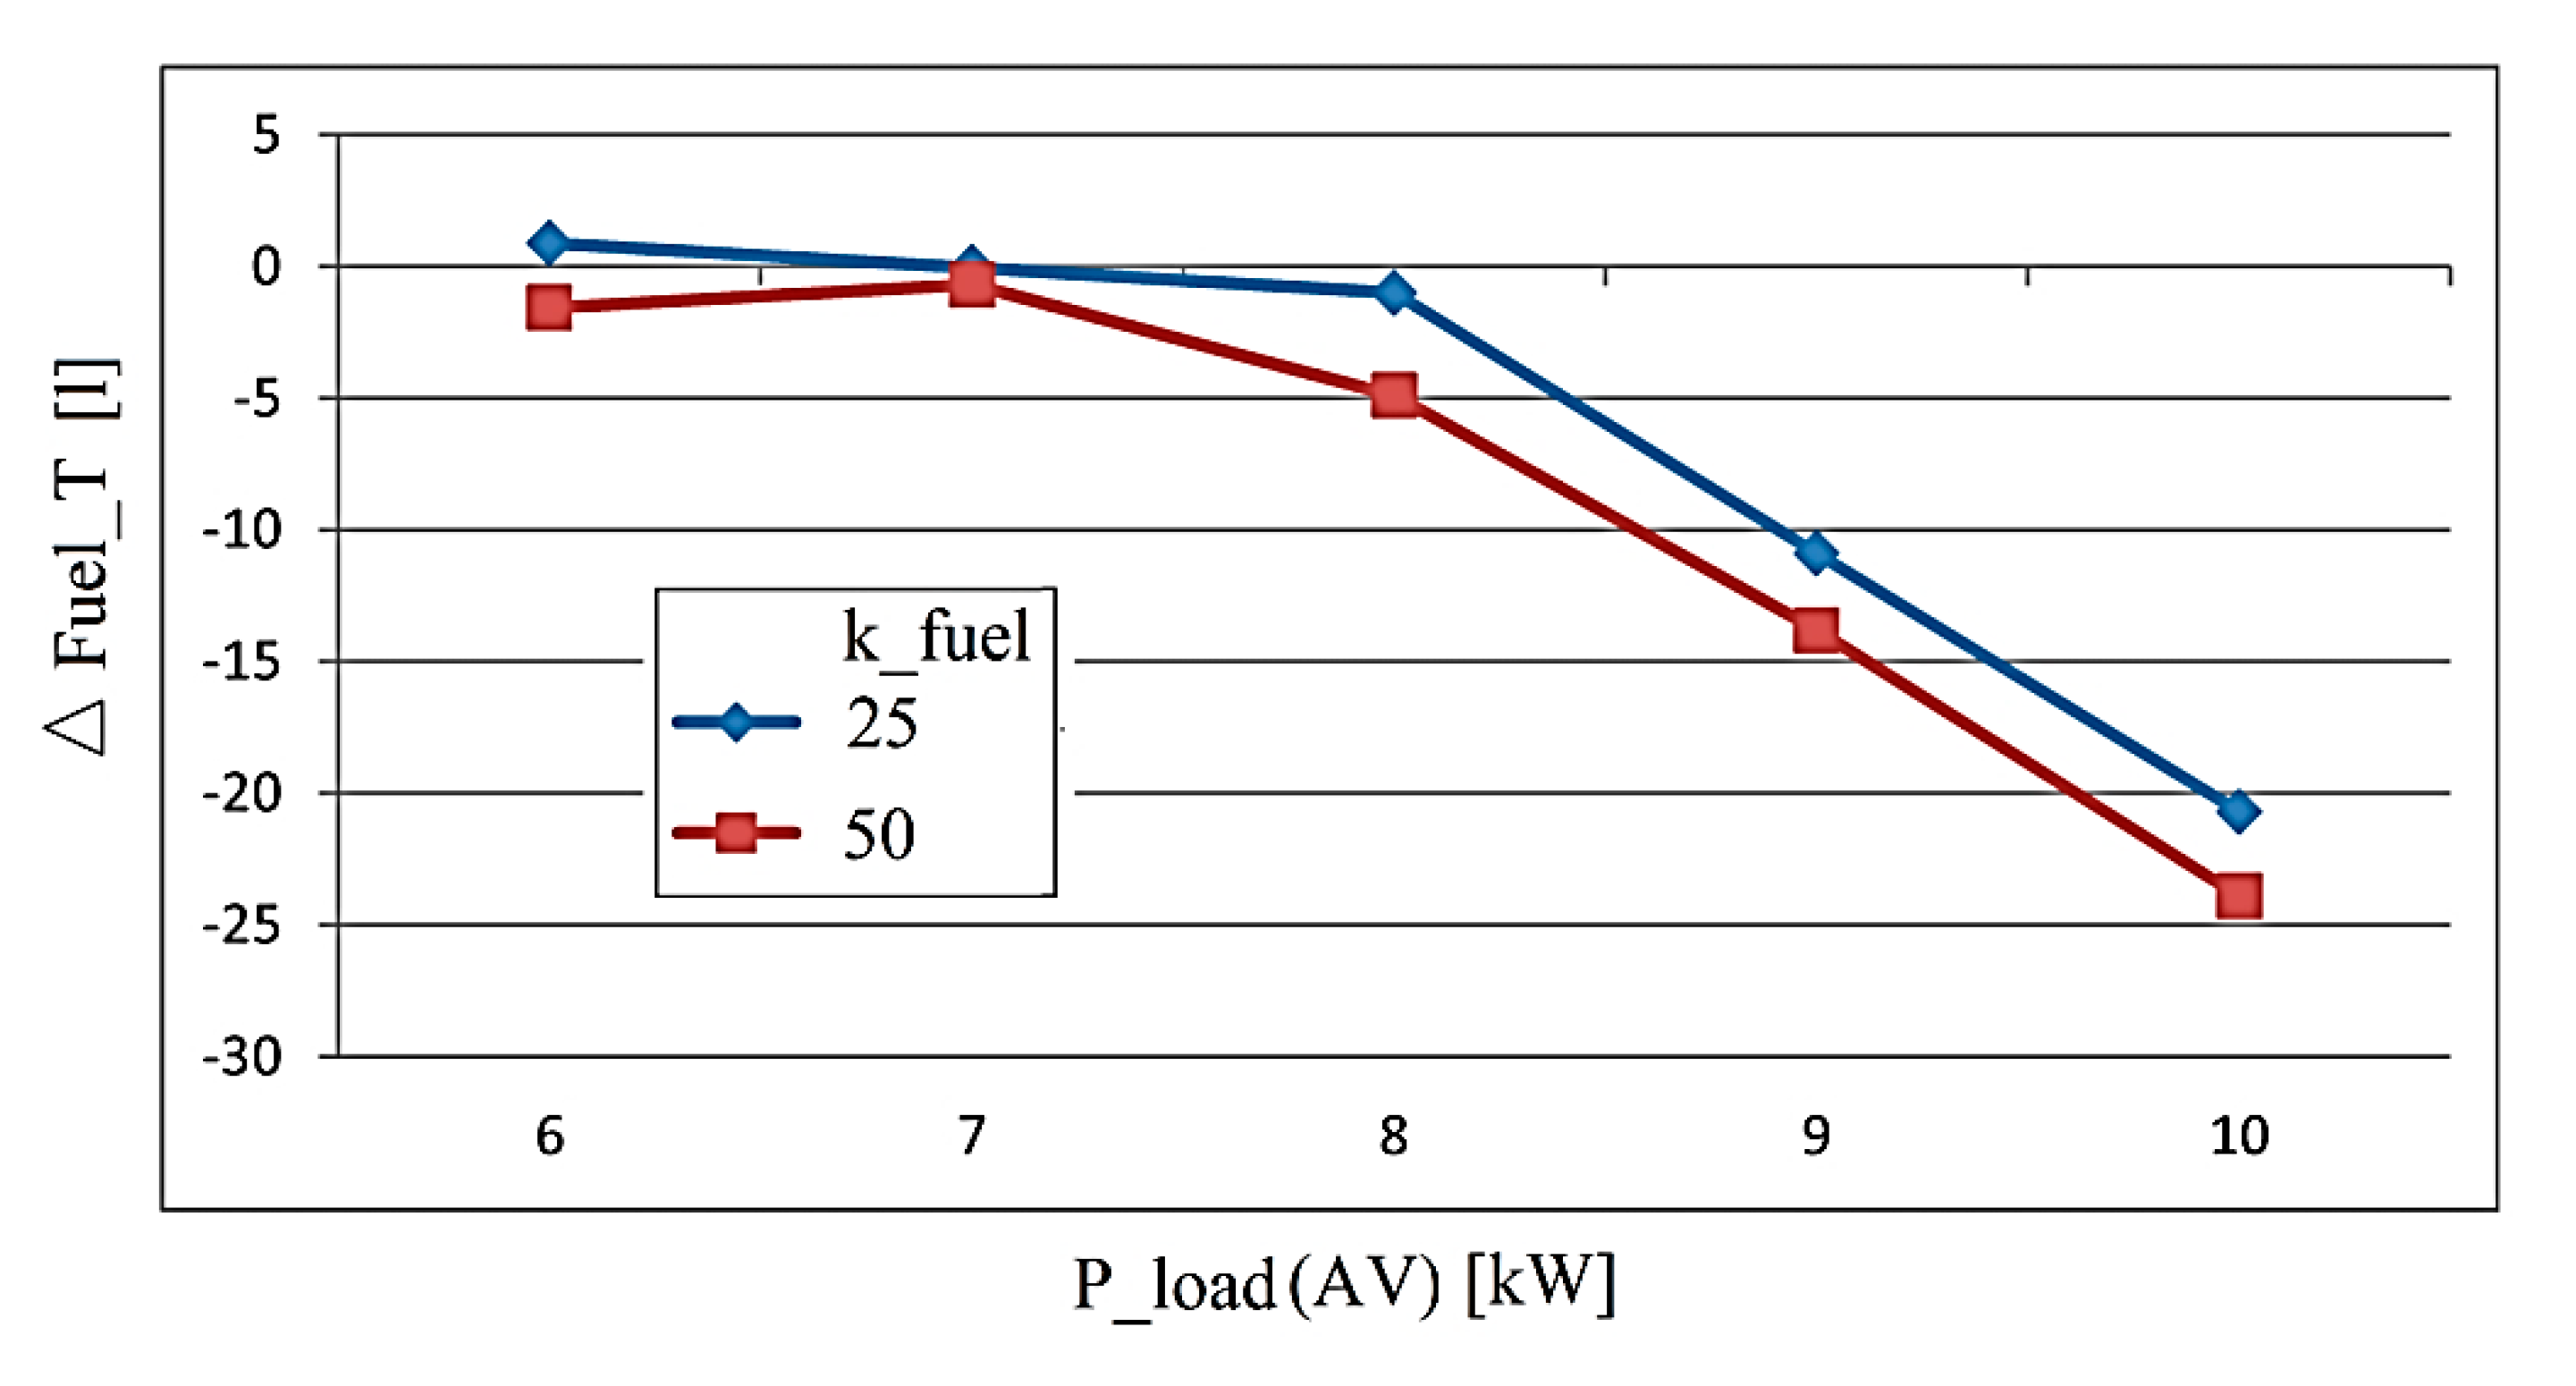
Table 6. The range of load power was chosen considering the RES power range and the range of the FC net power. The gaps in total fuel consumption for different Pload and Pload(AV) are represented in Figure 9 and Figure 10.
Note the same shape of fuel consumption for kfuel = 25 and kfuel = 50. Additionally, the Air-LFW strategy compared with the Fuel-LFW strategy is better in fuel consumption ( Δ F u e l T < 0 ) in full load range considered if kfuel = 50. Thus, the Air-LFW strategy improves the fuel economy if the optimization function (9) uses knet = 0.5 and kfuel ≠ 0.

4. Discussion

Compared with the RTO strategies proposed in this study, the rule-based strategies are simple to implement, but these strategies require adjusting the parameters if the requested load varies. For example, the parameters are adjusted using fuzzy-based strategies [61,62]. However, it is worth noting that these rule-based strategies cannot guarantee optimality [63]. In addition, these fuzzy-based strategies are difficult to implement in real-time. Thus, the RTO strategies based on the LFW control of the fueling regulators and fuel optimization using the GES control for searching the optimum (the MEP or the best fuel economy) are proposed.
The research must continue in order to find the simplest strategy to split the power requested on the DC bus (pDC = pload − pRES) in low and high frequency bands and test where the DC voltage regulation is better to be implemented. The low frequency component of the power requested on the DC bus will be used as input for the LFW control. The low frequency component can be easily obtained using a low-pass filter [64] in comparison with other more complex techniques based on rules [65] or artificial intelligence concepts [66,67]. In this paper the low frequency component has been obtained via an averaging technique, but the use of low-pass filter with 0.1 Hz cut-off frequency has been tested as well. It is worth mentioning that the use of a lower value for the cut-off frequency will better filter the reference current IrefLFW (12), but the response time of the LFW control loop will increase as well.
The DC voltage regulation can be performed on the side of the PEMFC system, battery, or ultracapacitors’ stack [64]. The LFW and optimization loops are implemented at the PEMFC side. Using a semi-active ESS topology, the battery is directly connected to the DC bus. Therefore, the remaining variant is to implement the DC voltage regulation on the ultracapacitors’ side via the bidirectional DC-DC power converter.
The performance obtained with the RTO strategies proposed in this study is compared with those obtained with the sFF strategy [45] as follows:
  • The increase in FC system electrical efficiency and fuel economy for the Air-LFW strategy is of 1.61% and 142 lpm for Pload = 8 kW and PRES = 0 respectively (see Table 2);
  • The increase in FC system electrical efficiency and fuel economy for the Fuel-LFW strategy is of 3.45% and 74.4 lpm for Pload = 8 kW and PRES = 0 respectively (see Table 3).
Thus, the proposed RTO strategies outperform the performance of the sFF strategy in the entire load range for the Air-LFW strategy, and for the Fuel-LFW strategy except in the light load range. It is worth mentioning that the fuel economy increases with the load demand if an optimization strategy is used instead of one without an optimization loop (such as the sFF strategy). This is normal, because more fuel is necessary if the load demand increases and a fuel optimization strategy produces a higher fuel economy for maximum load compared with the case of a light load.
Additionally, the performance obtained with the Air-LFW strategy proposed in this study can be compared with those obtained with the Air-LFW Fuel-GES strategy [66] (which, besides the GES control for the boost controller, uses a second GES control to search the best fuel economy using the fuel regulator) as follows:
  • The increase in the FC system’s electrical efficiency and fuel economy using the Air-LFW strategy and the Air-LFW Fuel-GES strategy is (for Pload = 8 kW and PRES = 0) of 1.61% and 142 lpm, and 2.13% and 216.7 lpm [68], respectively;
  • The increase in fuel economy using the Air-LFW strategy and the Air-LFW Fuel-GES strategy is (for Pload(AV) = 6.25 kW and PRES = 0) of 95.5 lpm, and 171.4 lpm [68], respectively.
Additionally, under 7 kW load, the fuel economy obtained is still high, being of about 8% (=100·12.16/152.3) and 9% (=100·14.46/150) using the Air-LFW and Fuel-LFW strategies. The experimental and simulation studies [69,70,71] validate the aforementioned fuel savings by comparison with a baseline strategy, reporting a fuel economy in the same range, as follows: a fuel economy of 12.36% (=100·(4.47−3.9782)/3.9782) using a hierarchical energy management strategy [69]; a lower fuel economy of 6.25% (=100·(64.91−61.09)/61.09) using a Kriging-based bi-objective constrained optimization strategy as reported in [70]; a fuel economy of 8.6% and 13.5% compared with those based on the charge-depletion–charge-sustaining strategy and equivalent consumption minimization strategy have been reported for a multi-objective hierarchical prediction energy management strategy [71] when the drive cycle is unknown.
Compared with the studies performed in [72,73], which maximize the FC net power, this study uses a mixed optimization function   ( f ( v 1 , v 2 ) = k n e t P F C n e t + k f u e l F u e l e f f ) to increase the fuel economy if kfuel ≠ 0. It is worth mentioning that the same fuel economy is reported in studies published in recent years [74,75], where a fuel economy of 7.8% and 6.8% is reported for instantaneous optimization strategy compared to the efficiency optimization strategy [74] and a hybrid strategy based on the cost break-even time optimization of a PEMFC/ultracapacitors system [74], respectively.
The review paper [76] comparatively analyzes the performance of the latest EMSs proposed in the literature and compares the fuel economy for nine EMSs. The best performance for salp swarm algorithm based on external energy maximization strategy minimum consumed fuel and maximum energy efficiency is of 19.4 gm and 85.61%, respectively. The second strategy identified is the mine-blast optimization based on the ECMS for which the FuelFr is about 70 lpm. Similar results are obtained in this study for the Air-LFW and Fuel-LFW strategies, where the recorded results are FuelFr = 64.54 lpm and FuelFr = 61.7 lpm, and ηsys = 85.6% and ηsys = 86%, respectively.
However, the fuel economy can increase if the optimization function is focused to concurrently optimize fuel consumption and PEMFC cell lifetime in a hybrid vehicle [77]. The fuel consumption increases with 3.6% in order to reduce the PEMFC degradation by 15% using a stochastic dynamic programming strategy.
The variability of REW sources and load demand is managed in this study based on the LFW control of the FC system considered as a backup energy source. If the HPS does not include a backup energy source, then this variability may be managed based on an optimal scheduling problem [78] considering a sample of minutes during the scheduled period [79].
Additionally, it is worth mentioning that a better fuel economy is obtained for the Air-LFW strategy compared with the Fuel-LFW strategy because the LFW control loop include the air regulator and fuel regulator and the optimization loop include the fuel regulator and air regulator, respectively. Therefore, the fuel consumption will be minimized by an optimized operation of the fuel regulator in the Air-LFW strategy.
Furthermore, the use of two optimization loops instead of one increases the complexity of implementation, but the direct search with two variables extends the searching space and the global optimum can then be found. Note that an increase of about 12% of the fuel economy can be obtained at maximum load (constant or variable) if a second GES control is implemented.
Consequently, research remains open in proposing advanced fuel economy strategies based on new optimization architectures or better search algorithms. For example, the MPP tracking algorithm based on advanced fractional order incremental conductance techniques [80] has comparable performance with the MPP tracking algorithm based on the GES control used in this study, but the rules-based strategy used in [80] is harder to implement. In addition, about 10% FC power ripple is obtained even if a variable step is used for the MPP tracking algorithm. It is worth mentioning that using the MPP tracking algorithm based on the GES control the FC power ripple is almost zero (see the second plot in Figure 7 and Figure 8) due to the asymptotical decrease of the sinusoidal dither amplitude during stationary regimes (after the optimum is found). During the searching regime, the amplitude of the sinusoidal dither is higher in order to locate the optimum in less than 15 dither periods (which means less than 150 milliseconds for a 100 Hz sinusoidal dither). This short searching time allows the GES-based MPP tracking algorithm to optimize in real-time the PEMFC operation under variable RES power, maintaining the charge-sustaining mode for the battery (see the third plot in Figure 8). The ripple on the ESS power appears due to dynamic compensation of the high frequency component of the power requested on the DC bus (pDC = pload − pRES) by the ultracapacitors’ stack via appropriate control of the bidirectional DC-DC power converter.
As mentioned, the FC system electrical efficiency for the Air-LFW strategy and the Fuel-LFW strategy is of 1.61% and 3.45%, being lower than about 7% electrical efficiency reported in [81], where the master–slave strategy based on fuzzy logic control and power compensation method is only focused on increasing the electrical efficiency of the PEMFC system. Considering once again the main advantage of the proposed strategies based on a mixed optimization function   ( f ( v 1 , v 2 ) = k n e t P F C n e t + k f u e l F u e l e f f ) to easily change the optimization objective (which can be the FC net power P F C n e t maximization if kfuel = 0 or fuel economy maximization if kfuel ≠ 0), it is worth mentioning that this feature could be very interesting for implementing in FC vehicles. Safe implementation in FC vehicles can be ensured by 100 A/s slope limiters of the reference currents I r e f ( O 2 ) and I r e f ( H 2 ) from the fueling regulators (5–6), which will limit the fueling flow rates AirFr and FuelFr, avoiding fuel starvation [82].

5. Conclusions

Analysis of two RTO strategies (Air-LFW and Fuel-LFW) is performed in this paper for constant load profile without RES power, constant load profile and variable RES power, and variable profile for load and RES power in order to determine which control strategy is more effective.
For constant load profile without RES, the following findings were obtained considering the optimization function in Case A (knet = 0.5, kfuel = 0):
  • The fuel energy efficiency in the case of the Air-LFW strategy is less dependent on the load level, but in the case of the Fuel-LFW strategy, fuel energy efficiency is more dependent on the level of the load; thus, gaps in fuel energy efficiency result, as in Table 1.
  • Compared with the Fuel-LFW strategy, the Air-LFW strategy is better on FC energy efficiency ( Δ   η s y s > 0 and   Δ   P F C n e t > 0 ) at light load (up to 4.5 kW and 5.5 kW).
  • Compared with the Air-LFW strategy, the Fuel-LFW strategy is better on fuel consumption ( Δ F u e l T > 0 ) in almost the full load range (up to 7.5 kW).
As a first conclusion considering the optimization function with knet = 0.5 and kfuel = 0, the Fuel-LFW strategy is the best option to supply the load with the necessary power in an efficient way. Therefore, this strategy can be used for an FC vehicle climbing a hill.
The simulations for a constant load profile and same RES power reveal that the Fuel-LFW strategy compared with the Air-LFW strategy is better in the fuel consumption for FC power up to nominal FC power (6 kW) considering the same optimization function (knet = 0.5, kfuel = 0). Therefore, this can be used for a standalone RES/FC HPS to efficiently supply a residential home in an area where it is easy to refuel the fuel tank.
However, if the fuel tank is limited (see the case of the FC vehicle) or can be refueled only periodically (e.g., chalets and other buildings in mountains) the RTO strategy must be oriented to fuel economy considering the optimization function with kfuel ≠ 0. The results for constant load profile and variable RES power, and variable profile for load and RES power highlighted that Air-LFW strategy is the best option for RES/FC HPS supplying energy for isolated buildings. Additionally, the Air-LFW strategy is the best option for an FC vehicle if fuel economy is selected as the objective by the driver.
Thus, as a second conclusion considering the optimization function with knet = 0.5 and kfuel ≠ 0, the Air-LFW strategy is the best option to efficiently supply the load with minimum fuel consumption.
Considering that the LFW control for RES/FC HPS is appropriately designed, the third conclusion is that the battery will normally operate in charge-sustaining mode for variable profiles of load and RES power. This reduces the battery capacity needed to ensure the power flow balance on the DC bus, and also increases its lifetime due to a limited number of charge-discharge cycles.
However, as mentioned, the charge-discharge cycles can have an effect in some cases, so the battery state of charge must be monitored as well. For example, the battery will operate in charging mode during a light load when the available RES power exceeds the load demand [83]. In this case, the electrolyzer must be started (when the battery is fully charged) to produce hydrogen (refueling the fuel tank), and avoiding battery overcharging. Additionally, the battery will operate in discharging mode during the peaks of load demand that are higher than the maximum of both FC power and RES power flows available. The design of the RES/FC HPS must avoid deep discharge of the battery and reduce the number of such charge-discharge cycles, but this subject was and will be further discussed in the literature, being outside the aims of this study.
An interesting idea would be to switch the proposed strategies based on load level to maximize the fuel economy for an FC vehicle [84]. The Fuel-LFW strategy would be used to maximize fuel economy when needed (for example, when the FC vehicle is running on a highway or has to reach the first hydrogen fueling station with what hydrogen is still in the tank). The FC net power optimization strategy (Case A: knet = 0.5, kfuel = 0) would be used to maximize the FC power generated on the DC bus in order to increase the available power for the FC vehicle while climbing a steep slope (when fuel economy is no longer a priority). This mode of operation can be performed automatically by using a load threshold or manually at the driver’s request. This could be the subject of further research.

Author Contributions

Conceptualization, Methodology, and Writing—Original Draft Preparation: N.B.; Validation and Supervision: P.T.; Writing—Review & Editing: N.B., P.T. All authors have read and agreed to the published version of the manuscript.

Funding

This work was supported in part by King Mongkut’s University of Technology North Bangkok. Contract no. KMUTNB-63-KNOW-040.

Conflicts of Interest

The authors declare no conflict of interest.

Nomenclature

AirFr Air Flow rate
AV Average value
fddither frequency
fhHPF cut-off frequency
flLPF cut-off frequency
effH2Efficiency of H2 consumption
EMSEnergy Management Strategy
ECMS Equivalent Consumption Minimization Strategy
ESExtremum Seeking
ESSEnergy Storage System
FuelFr Fuel Flow rate
FCFuel cell
PFCFC stack power
PFcnet FC net power
PcmAir compressor power
ηsysFC electrical efficiency
FCHPSFuel Cell Hybrid Power System
FuelTTotal Fuel Consumption
FueleffFuel Consumption Efficiency
GESGlobal Extremum Seeking
HPSHybrid Power System
kNv1 and kNv1 Output normalization gains
kNfInput normalization gain
Iref(LFW)Load-following reference
Iref(GES)GES reference
I r e f ( H 2 ) Hydrogen flow reference
I r e f ( O 2 ) Oxygen flow reference
IFC and VFCFC current and voltage
LFWLoad-following
LCLoad cycle
LHV Lower heating value for hydrogen
LPFLow-pass filter
HPFHigh-pass filter
MEPMaximum Efficiency Point
MPPMaximum Power Point
GMPPGlobal Maximum Power Point
MV Mean Value
PVPhotovoltaic
PEMFCProton Exchange Membrane Fuel
PloadStationary load power (constant power demand)
ploadDynamic load power (variable power demand)
RTO Real-Time Optimization
sFFStatic Feed-Forward
SWSwitch
kfuelWeighting coefficient of the fuel consumption efficiency
knetWeighting coefficient of the FC net power
WTWind Turbine

References

  1. Jones, L.E. Renewable Energy Integration: Practical Management of Variability, Uncertainty, and Flexibility in Power Grids; Academic Press: Cambridge, MA, USA, 2014. [Google Scholar]
  2. International Energy Agency (IEA). World Energy Outlook 2014; OECD/IEA: Paris, France, 2015; Available online: https://www.iea.org/publications/freepublications/publication/WEIO2014.pdf (accessed on 3 January 2020).
  3. Worldwatch Institute. Global Fossil Fuel Consumption Surges. Available online: http://www.worldwatch.org/global-fossil-fuel-consumption-surges (accessed on 3 January 2020).
  4. International Energy Agency (IEA). World Energy Outlook 2009; OECD/IEA: Paris, France, 2009; Available online: www.worldenergyoutlook.org/media/weowebsite/2009/WEO2009.pdf (accessed on 3 January 2020).
  5. Nikolova, S.; Causevski, A.; Al-Salaymeh, A. Optimal operation of conventionalpower plants in power system with integrated renewable energy sources. Energy Convers. Manag. 2013, 65, 697–703. [Google Scholar] [CrossRef]
  6. Onur, E.; Ugur, S.S. A comparative sizing analysis of a renewable energy supplied stand-alone house considering both demand side and source side dynamics. Appl. Energy 2012, 96, 400–406. [Google Scholar]
  7. Tascikaraoglu, A.; Boynuegri, A.R.; Uzunoglu, M. A demand side management strategy based on forecasting of residential renewable sources: A smart home system in Turkey. Energy Build. 2014, 80, 309–320. [Google Scholar] [CrossRef]
  8. Tascikaraoglu, A.; Erdinc, O.; Uzunoglu, M.; Karakas, A. An adaptive load dispatching and forecasting strategy for a virtual power plant including renewable energy conversion units. Appl. Energy 2014, 119, 445–453. [Google Scholar] [CrossRef]
  9. Ahmed, N.A.; Miyatake, M.; Al-Othman, A.K. Power fluctuations suppression of stand-alone hybrid generation combining solar photovoltaic/wind turbine and fuel cell systems. Energy Convers Manag. 2008, 49, 2711–2719. [Google Scholar] [CrossRef]
  10. García-Trivino, P.; Llorens-Iborra, F.; García-Vázquez, C.A.; Gil-Mena, A.J.; Fernández-Ramírez, L.M.; Jurado, F. Long-term optimization based on PSO of a gridconnected renewable energy/battery/hydrogen hybrid system. Int. J. Hydrogen Energy 2014, 9, 10805–10816. [Google Scholar] [CrossRef]
  11. Lior, N. Sustainable energy development: The present (2009) situation and possible paths to the future. Energy 2010, 35, 3976–3994. [Google Scholar] [CrossRef]
  12. Zahraee, S.M.; KhalajiAssadi, M.; Saidur, R. Application of artificial intelligence methods for hybrid energy system optimization. Renew. Sustain. Energy Rev. 2016, 66, 617–630. [Google Scholar] [CrossRef]
  13. Sinha, S.; Chandel, S.S. Review of recent trends in optimization techniques for solar photovoltaic–wind based hybrid energy systems. Renew. Sustain. Energy Rev. 2015, 50, 755–769. [Google Scholar] [CrossRef]
  14. Said, Z.A.; Alshehhi, A.A.; Mehmood, A. Predictions of UAE’s renewable energy mix in 2030. Renew. Energy 2018, 118, 779–789. [Google Scholar] [CrossRef]
  15. Rajanna, S.; Saini, R.P. Modeling of integrated renewable energy system for electrification of a remote area in India. Renew. Energy 2016, 90, 175–187. [Google Scholar] [CrossRef]
  16. Tsagarakis, K.P.; Mavragani, A.; Jurelionis, A.; Prodan, P.; Andrian, T.; Bajare, D.; Korjakins, A.; Magelinskaite-Legkauskiene, S.; Razvan, V.; Stasiuliene, L. Clean vs. Green: Redefining renewable energy. Evidence from Latvia, Lithuania, and Romania. Renew. Energy 2018, 121, 412–419. [Google Scholar] [CrossRef]
  17. Al Busaidi, A.S.; Kazem, H.A.; Al-Badi, A.H.; Farooq Khan, M. A review of optimum sizing of hybrid PV–Wind renewable energy systems in oman. Renew. Sustain. Energy Rev. 2016, 53, 185–193. [Google Scholar] [CrossRef]
  18. Upadhyay, S.; Sharma, M.P. A review on configurations, control and sizing methodologies of hybrid energy systems. Renew. Sustain. Energy Rev. 2014, 38, 47–63. [Google Scholar] [CrossRef]
  19. Olatomiwa, L.; Mekhilef, S.; Huda, A.S.N.; Ohunakin, O.S. Economic evaluation of hybrid energy systems for rural electrification in six geo-political zones of Nigeria. Renew. Energy 2015, 83, 435–446. [Google Scholar]
  20. Zhou, W.; Lou, C.; Li, Z.; Lu, L.; Yang, H. Current status of research on optimum sizing of stand-alone hybrid solar–wind power generation systems. Appl. Energy 2010, 87, 380–389. [Google Scholar] [CrossRef]
  21. Frangou, M.; Aryblia, M.; Tournaki, S.; Tsoutsos, T. Renewable energy performance contracting in the tertiary sector Standardization to overcome barriers in Greece. Renew. Energy 2018, 125, 829–839. [Google Scholar] [CrossRef]
  22. Shivarama Krishna, K.; Sathish Kumar, K. A review on hybrid renewable energy systems. Renew. Sustain. Energy Rev. 2015, 52, 907–916. [Google Scholar] [CrossRef]
  23. Carroquino, J.; Dufo-López, R.; Bernal-Agustín, J.L. Sizing of off-grid renewable energy systems for drip irrigation in Mediterranean crops. Renew. Energy 2015, 76, 566–574. [Google Scholar] [CrossRef]
  24. Erdinc, O.; Uzunoglu, M. Optimum design of hybrid renewable energy systems: Overview of different approaches. Renew. Sustain. Energy Rev. 2012, 16, 1412–1425. [Google Scholar] [CrossRef]
  25. Fadaee, M.; Radzi, M.A.M. Multi-objective optimization of a stand-alone hybrid renewable energy system by using evolutionary algorithms: A review. Renew. Sustain. Energy Rev. 2012, 16, 3364–3369. [Google Scholar] [CrossRef]
  26. Luna-Rubio, R.; Trejo-Perea, M.; Vargas-Vázquez, D.; Ríos-Moreno, G.J. Optimal sizing of renewable hybrids energy systems: A review of methodologies. Sol. Energy 2012, 86, 1077–1088. [Google Scholar] [CrossRef]
  27. Bourennani, F.; Rahnamayan, S.; Naterer, G.F. Optimal design methods for hybrid renewable energy systems. Int. J. Green Energy 2014, 12, 148–159. [Google Scholar] [CrossRef]
  28. Carapellucci, R.; Giordano, L. Modeling and optimization of an energy generation island based on renewable technologies and hydrogen storage systems. Int. J. Hydrogen Energy 2012, 37, 2081–2093. [Google Scholar] [CrossRef]
  29. Eroglu, M.; Dursun, E.; Sevencan, S.; Song, J.; Yazici, S.; Kilic, O. A mobile renewablechouse using PV/wind/fuel cell hybrid power system. Int. J. Hydrogen Energy 2011, 36, 7985–7992. [Google Scholar] [CrossRef]
  30. Erdinc, O.; Uzunoglu, M. A new perspective in optimum sizing of hybridrenewable energy systems: Consideration of component performance degradation issue. Int. J. Hydrogen Energy 2012, 37, 10479–10488. [Google Scholar] [CrossRef]
  31. Erdem, H.; Tartan, E.O.; Berkol, A. Application of three intelligent methods for harmonic estimation: Adaline, Adaline-LS, PSO-LS. J. Electr. Eng. Electron. Control Comput. Sci. 2015, 1, 1–6. Available online: https://jeeeccs.net/index.php/journal/article/view/7 (accessed on 3 January 2020).
  32. Trifkovic, M.; Sheikhzadeh, M.; Nigim, K.; Daoutidis, P. Modeling and control of a renewable hybrid Energy system with hydrogen storage. IEEE Trans. Control Syst. Technol. 2014, 22, 169–179. [Google Scholar] [CrossRef]
  33. Bizon, N. Load-following mode control of a standalone renewable/fuel cell hybrid power source. Energy Convers Manag. 2014, 77, 763–772. [Google Scholar] [CrossRef]
  34. Chen, P.-C. Robust voltage tracking control for proton exchange membrane fuel cells. Energy Convers Manag. 2013, 65, 408–419. [Google Scholar] [CrossRef]
  35. Zheng, C.H.; Kim, N.W.; Cha, S.W. Optimal control in the power management of fuel cell hybrid vehicles. Int. J. Hydrogen Energy 2012, 37, 655–663. [Google Scholar] [CrossRef]
  36. Xu, L.; Ouyang, M.; Li, J.; Yang, F.; Lu, L.; Hua, J. Application of Pontryagin’s Minimal Principle to the energy management strategy of plugin fuel cell electric vehicles. Int. J. Hydrogen Energy 2013, 38, 10104–10115. [Google Scholar] [CrossRef]
  37. Hu, X.; Murgovski, N.; Johannesson, L.M.; Egardt, B. Optimal dimensioning and power management of a fuel cell/battery hybrid bus via convex programming. IEEE/ASME Trans. Mechatron. 2015, 20, 457–468. [Google Scholar] [CrossRef]
  38. Hemi, H.; Ghouili, J.; Cheriti, A. Combination of Markov chain and optimal control solved by Pontryagin’s minimum principle for a fuel cell/supercapacitor vehicle. Energy Convers. Manag. 2015, 91, 387–393. [Google Scholar] [CrossRef]
  39. Zheng, C.H.; Xu, G.Q.; Park, Y.I.; Lim, W.S.; Cha, S.W. Prolonging fuel cell stack lifetime based on Pontryagin’s Minimum Principle in fuel cell hybrid vehicles and its economic influence evaluation. J. Power Sources 2014, 248, 533–544. [Google Scholar] [CrossRef]
  40. Bizon, N. Nonlinear control of fuel cell hybrid power sources: Part I-Voltage control. Appl. Energy 2011, 88, 2559–2573. [Google Scholar] [CrossRef]
  41. Bizon, N. Nonlinear control of fuel cell hybrid power sources: Part II-Current control. Appl. Energy 2011, 88, 2574–2591. [Google Scholar] [CrossRef]
  42. Bizon, N.; Radut, M.; Oproescu, M. Energy control strategies for the Fuel Cell Hybrid Power Source under unknown load profile. Energy 2015, 86, 31–41. [Google Scholar] [CrossRef]
  43. Bizon, N.; Oproescu, M.; Raceanu, M. Efficient energy control strategies for a Standalone Renewable/Fuel Cell Hybrid Power Source. Energy Convers. Manag. 2015, 90, 93–110. [Google Scholar] [CrossRef]
  44. Giaouris, D.; Papadopoulos, A.I.; Ziogou, C.; Ipsakis, D.; Voutetakis, S.; Papadopoulou, S. Performance investigation of a hybrid renewable power generation and storage system using systemic power management models. Energy 2013, 61, 621–635. [Google Scholar] [CrossRef]
  45. Pukrushpan, J.T.; Stefanopoulou, A.G.; Peng, H. Control of Fuel Cell Power Systems; Springer: New York, NY, USA, 2004. [Google Scholar]
  46. Masaki, M.S.; Zhang, L.; Xia, X. A hierarchical predictive control for supercapacitor-retrofitted grid-connected hybrid renewable systems. Appl. Energy 2019, 242, 393–402. [Google Scholar] [CrossRef]
  47. Hasanien, H.M.; El-Fergany, A.A. Salp swarm algorithm-based optimal load frequency control of hybrid renewable power systems with communication delay and excitation cross-coupling effect. Electr. Power Syst. Res. 2019, 175, 105938–105947. [Google Scholar] [CrossRef]
  48. Djeziri, M.A.; Benmoussa, S.; Sanchez, R. Hybrid method for remaining useful life prediction in wind turbine systems. Renew. Energy 2018, 116, 73–187. [Google Scholar] [CrossRef]
  49. Perelmuter, V. Renewable Energy Systems: Simulation with Simulink® and SimPowerSystems−; CRC Press: Boca Raton, FL, USA, 2016. [Google Scholar]
  50. Saisset, R.; Fontes, G.; Turpin, C.; Stephan, S. Bond Graph model of a PEM fuel cell. J. Power Sources 2006, 156, 100–107. [Google Scholar] [CrossRef]
  51. Zhang, Z.; Sato, K.; Nagasaki, Y.; Tsuda, M.; Miyagi, D.; Komagome, T.; Tsukada, K.; Hamajima, T.; Ishii, Y.; Yonekura, D. Continuous operation in an electric and hydrogen hybrid energy storage system for renewable power generation and autonomous emergency power supply. Int. J. Hydrogen Energy 2019, 44, 23384–23395. [Google Scholar] [CrossRef]
  52. Bizon, N. Global Extremum Seeking Control of the Power Generated by a Photovoltaic Array under Partially Shaded Conditions. Energy Convers Manag. 2016, 109, 71–85. [Google Scholar] [CrossRef]
  53. Restrepo, C.; Ramos-Paja, C.A.; Giral, R.; Calvente, J.; Romero, A. Fuel cell emulator for oxygen excess ratio estimation on power electronics applications. Comp. Electr. Eng. 2012, 38, 926–937. [Google Scholar] [CrossRef]
  54. Erdinc, O.; Uzunoglu, M. The importance of detailed data utilization on the performance evaluation of a grid independent hybrid renewable energy system. Int. J. Hydrogen Energy 2011, 36, 12664–12677. [Google Scholar] [CrossRef]
  55. Divya, K.C.; Østergaard, J. Battery energy storage technology for power systems—An overview. Electr. Power Syst. Res. 2009, 79, 511–520. [Google Scholar] [CrossRef]
  56. Nelms, R.M.; Spyker, R.L. Classical equivalent circuit parameters for a doublelayer capacitor. IEEE Trans. Aerosp. Electron. Syst. 2000, 36, 829–836. [Google Scholar]
  57. Weidner, J.W.; Srinivasan, V. Mathematical modeling of electrochemical capacitors. J. Electrochem. Soc. 1999, 146, 1650–1658. [Google Scholar]
  58. Gillenwater, M. Probabilistic decision model of wind power investment and influence of green power market. Energy Policy 2013, 63, 1111–1125. [Google Scholar] [CrossRef]
  59. Bizon, N.; Kurt, E. Performance Analysis of the Tracking of the Global Extreme on Multimodal Patterns using the Asymptotic Perturbed Extremum Seeking Control Scheme. Int. J. Hydrogen Energy 2017, 42, 17645–17654. [Google Scholar] [CrossRef]
  60. Bizon, N.; Thounthong, P.; Raducu, M.; Constantinescu, L.M. Designing and Modelling of the Asymptotic Perturbed Extremum Seeking Control Scheme for Tracking the Global Extreme. Int. J. Hydrogen Energy 2017, 42, 17632–17644. [Google Scholar] [CrossRef]
  61. Ahmadi, S.; Bathaee, S.M.T. Multi-objective genetic optimization of the fuel cell hybrid vehicle supervisory system: Fuzzy logic and operating mode control strategies. Int. J. Hydrogen Energy 2015, 40, 12512–12521. [Google Scholar] [CrossRef]
  62. Tiar, M.; Betka, A.; Drid, S.; Abdeddaim, S.; Tabandjat, A. Optimal energy control of a PV-fuel cell hybrid system. Int. J. Hydrogen Energy 2017, 42, 1456–1465. [Google Scholar] [CrossRef]
  63. Yu, H.; Tarsitano, D.; Hu, X.; Cheli, F. Real time energy management strategy for a fast charging electric urban bus powered by hybrid energy storage system. Energy 2016, 112, 322–331. [Google Scholar] [CrossRef]
  64. Turpin, C.; Morin, B.; Bru, E.; Rallieres, O.; Roboam, X.; Sareni, B.; Arregui, G.A.; Roux, N. Power for Aircraft Emergencies—A hybrid proton-exchange membrane H2/O2 fuel cell and ultracapacitor system. IEEE Electrif. Mag. 2017, 5, 72–85. [Google Scholar] [CrossRef]
  65. Gokce, K.; Ozdemir, A. A Rule Based Power Split Strategy for Battery/Ultracapacitor Energy Storage Systems in Hybrid Electric Vehicles. Int. J. Electrochem. Sci. 2016, 11, 1228–1246. [Google Scholar]
  66. Wu, J.; Wang, X.; Li, L.; Qin, C.; Du, Y. Hierarchical control strategy with battery aging consideration for hybrid electric vehicle regenerative braking control. Energy 2018, 145, 301–312. [Google Scholar] [CrossRef]
  67. Chong, L.W.; Wong, Y.W.; Rajkumar, R.K.; Isa, D. An optimal control strategy for standalone PV system with Battery—Supercapacitor Hybrid Energy Storage System. J. Power Sources 2016, 331, 553–565. [Google Scholar] [CrossRef]
  68. Bizon, N. Real-Time Optimization Strategy for Fuel Cell Hybrid Power Sources with Load-Following Control of the Fuel or Air Flow. Energy Convers. Manag. 2018, 157, 13–27. [Google Scholar] [CrossRef]
  69. Fu, Z.; Li, Z.; Si, P.; Tao, F. A hierarchical energy management strategy for fuel cell/battery/supercapacitor hybrid electric vehicles. Int. J. Hydrogen Energy 2019, 44, 22146–22159. Available online: https://0-doi-org.brum.beds.ac.uk/10.1016/j.ijhydene.2019.06.158 (accessed on 3 January 2020). [CrossRef]
  70. Li, Y.; Wu, Y.; Zhang, Y.; Wang, S. A Kriging-based bi-objective constrained optimization method for fuel economy of hydrogen fuel cell vehicle. Int. J. Hydrogen Energy 2019, 44, 29658–29670. Available online: https://0-doi-org.brum.beds.ac.uk/10.1016/j.ijhydene.2019.04.094 (accessed on 3 January 2020). [CrossRef]
  71. Liu, Y.; Li, J.; Chen, Z.; Qin, D.; Zhang, Y. Research on a multi-objective hierarchical prediction energy management strategy for range extended fuel cell vehicles. J. Power Sources 2019, 429, 55–66. [Google Scholar] [CrossRef]
  72. Hoarca, C.I.; Enescu, F.M. On the energy efficiency of standalone fuel cell/renewable hybrid power sources Part I: Simulation results for constant load profile without RES power. In Proceedings of the 2018 International Conference on Applied and Theoretical Electricity (ICATE), Craiova, Romania, 4–6 October 2018. [Google Scholar] [CrossRef]
  73. Hoarca, C.I.; Enescu, F.M. On the energy efficiency of standalone fuel cell/renewable hybrid power sources Part II: Simulation results for variable load profile with different renewable energy sources profiles (RES). In Proceedings of the 2018 International Conference on Applied and Theoretical Electricity (ICATE), Craiova, Romania, 4–6 October 2018. [Google Scholar] [CrossRef]
  74. Xu, H.; Feiqiang, L.; Tao, Z.; Tong, Z.; Ke, S. Economic energy management strategy design and simulation for a dual-stack fuel cell electric vehicle. Int. J. Hydrog Energy 2017, 42, 11584–11595. [Google Scholar]
  75. Shin, D.; Lee, K.; Chang, N. Fuel economy analysis of fuel cell and supercapacitor hybrid systems. Int. J. Hydrogen Energy 2016, 41, 1381–1390. [Google Scholar] [CrossRef]
  76. Rezk, H.; Nassef, A.M.; Abdelkareem, M.A.; Alami, A.H.; Fathy, A. Comparison among various energy management strategies for reducing hydrogen consumption in a hybrid fuel cell/supercapacitor/battery system. Int. J. Hydrogen Energy 2019. [Google Scholar] [CrossRef]
  77. Tom, F.; Rob, T.; Martin, W. An Energy Management Strategy to concurrently optimise fuel consumption & PEM fuel cell lifetime in a hybrid vehicle. Int. J. Hydrogen Energy 2016, 41, 21503–21515. [Google Scholar]
  78. Reddy, S.S. Optimal scheduling of thermal-wind-solar power system with storage. Renew. Energy 2017, 101, 1357–1368. [Google Scholar] [CrossRef]
  79. Reddy, S.S.; Bijwe, P.R. Real time economic dispatch considering renewable energy resources. Renew. Energy 2015, 83, 1215–1226. [Google Scholar] [CrossRef]
  80. Chen, P.I.; Yu, K.N.; Yau, H.T.; Li, J.T.; Liao, C.K. A novel variable step size fractional order incremental conductance algorithm to maximize power tracking of fuel cells. Appl. Math. Model. 2017, 45, 1067–1075. [Google Scholar] [CrossRef]
  81. Peng, F.; Zhao, Y.; Li, X.; Zhixiang Liu, Z.; Chen, W.; Liu, Y.; Zhou, D. Development of master-slave energy management strategy based on fuzzy logic hysteresis state machine and differential power processing compensation for a PEMFC-LIB-SC hybrid tramway. Appl. Energy 2017, 206, 346–363. [Google Scholar] [CrossRef]
  82. Nikiforow, K.; Koski, P.; Ihonen, J. Discrete ejector control solution design, characterization, and verification in a 5 kW PEMFC system. Int. J. Hydrogen Energy 2017, 42, 16760–16772. [Google Scholar] [CrossRef]
  83. Bizon, N. Efficient fuel economy strategies for the Fuel Cell Hybrid Power Systems under variable renewable/load power profile. Appl. Energy 2019, 251, 113400–113518. [Google Scholar] [CrossRef]
  84. Bizon, N. Fuel saving strategy using real-time switching of the fueling regulators in the Proton Exchange Membrane Fuel Cell System. Appl. Energy 2019, 252, 113449–113453. [Google Scholar] [CrossRef]
Figure 1. The RES/FC HPS topology.
Mathematics 08 00151 g001
Figure 2. The diagram of the compressor model.
Mathematics 08 00151 g002
Figure 3. The diagram of the RES model.
Mathematics 08 00151 g003
Figure 4. The diagram of the equivalent load.
Mathematics 08 00151 g004
Figure 5. The diagram of the ESC scheme.
Mathematics 08 00151 g005
Figure 6. The diagram of the load-following control.
Mathematics 08 00151 g006
Figure 7. Fuel-LFW-based strategy.
Mathematics 08 00151 g007
Figure 8. Air-LFW-based strategy.
Mathematics 08 00151 g008
Figure 9. Δ Fuel T registered in Table 5.
Mathematics 08 00151 g009
Figure 10. Δ F u e l T registered in Table 6.
Mathematics 08 00151 g010
Table 1. The gaps in performance indicators for the Air-LFW and Fuel-LFW strategies (PRES = 0).
Pload [kW]∆PFCnet [W]∆ηsys [%]∆Fueleff [W/lpm]∆FuelT [l]60⋅∆FuelT/12 [lpm]
23840.7−1712.663
33420.31−10.112.2861.4
41420.05−3.77.738.5
569−0.07−2.65.125.5
645−0.19−2.24.824
7−32−0.4−22.311.5
8−198−1.840.97−13.6−68
Table 2. The gaps in performance indicators for the Air-LFW and sFF strategies (PRES = 0).
PloadΔPFCnetΔηsysΔFueleffΔFuelT60ΔFuelT/12
[kW][W][%][W/lpm][l][lpm]
2357−0.35−15.311.2656.3
3161−0.01−34.1420.7
4900.06−0.72.0810.4
5560.130.4−0.08−0.4
6380.271.4−2.28−11.4
7−190.633.31−12.16−60.8
8−1691.6111.2−28.48−142.4
Table 3. The gaps in performance indicators for the Fuel-LFW and sFF strategies (PRES = 0).
PloadΔPFCnetΔηsysΔFueleffΔFuelT60ΔFuelT/12
[kW][W][%][W/lpm][l][lpm]
2−27−1.051.7−1.34−6.7
3−181−0.327.1−8.14−40.7
4−520.013−5.62−28.1
5−130.23−5.18−25.9
6−70.463.6−7.08−35.4
7131.035.31−14.46−72.3
8293.4510.23−14.88−74.4
Table 4. The gaps in total fuel consumption for the Air-LFW and Fuel-LFW strategies (Case A and same PRES ≠ 0).
Pload [kW]∆FuelTA [l]60∆FuelTA/12 [lpm]
65.5527.75
71.718.55
80.42
9−0.9−4.5
10−9.3−46.5
Table 5. Δ F u e l T for the Air-LFW and Fuel-LFW strategies (Case B and C, same PRES, and different Pload).
Case BCase C
Pload [kW]∆FuelTB = FuelT1B−FuelT2B [l]60 ∆FuelTB/12 [lpm]∆FuelTC = FuelT1C − FuelT2C [l]60∆FuelTC/12 [lpm]
60,542,7−4,33−21,65
7−0,33−1,65−3,1−15,5
8−2,09−10,45−2,97−14,85
9−4,7−23,5−5,3−26,5
10−9,8−49−11,9−59,5
Table 6. Δ F u e l T for the Air-LFW and Fuel-LFW strategies (Cases B and C, same PRES, and different Pload(AV)).
Case BCase C
Pload(AV) [kW]∆FuelTB(LC) = FuelT1B(LC) − FuelT2B(LC) [l]60∆FuelTB(LC)/12 [lpm]∆FuelTC(LC) = FuelT1C(LC) − FuelT2C(LC) [l]60∆FuelTC(LC)/12 [lpm]
60.884.4−1.57−7.85
7−0.04−0.20.693.45
8−1−5−4.9−7.25
9−10.9−54.5−13.8−69
10−20.7−103.5−23.9−119.5

