Fingerprint Liveness Detection Based on Fine-Grained Feature Fusion for Intelligent Devices

1
College of Management and Economics, Tianjin University, Tianjin 300072, China
2
School of Computer and Software, Nanjing University of Information Science & Technology, Nanjing 210044, China
*
Author to whom correspondence should be addressed.
Mathematics 2020, 8(4), 517; https://0-doi-org.brum.beds.ac.uk/10.3390/math8040517
Submission received: 1 March 2020
/
Revised: 26 March 2020
/
Accepted: 27 March 2020
/
Published: 3 April 2020
(This article belongs to the Special Issue Computing Methods in Steganography and Multimedia Security)
Abstract
:Currently, intelligent devices with fingerprint identification are widely deployed in our daily life. However, they are vulnerable to attack by fake fingerprints made of special materials. To elevate the security of these intelligent devices, many fingerprint liveness detection (FLD) algorithms have been explored. In this paper, we propose a novel detection structure to discriminate genuine or fake fingerprints. First, to describe the subtle differences between them and take advantage of texture descriptors, three types of different fine-grained texture feature extraction algorithms are used. Next, we develop a feature fusion rule, including five operations, to better integrate the above features. Finally, those fused features are fed into a support vector machine (SVM) classifier for subsequent classification. Data analysis on three standard fingerprint datasets indicates that the performance of our method outperforms other FLD methods proposed in recent literature. Moreover, data analysis results of blind materials are also reported.
1. Introduction
Protecting digital information from illegal attacks is becoming increasingly important in our daily life [1,2,3]. With the coming of the information age, intelligent devices with fingerprint identification are used in various information management systems, such as intelligent devices quick payment and bank attendance. The development of image technology and the application of intelligent devices enable us to capture significant amounts of high-resolution images. Among these, biometric images have attracted considerable attention owing to the popularity of intelligent devices with biometric authentication. Unlike conventional authentication methods based on passwords and tokens, biometrics has the advantage of being hard to forget, copy, lose, or forge. Thus, as an important biometric technique, fingerprint identification is widely employed for unlocking intelligent devices or using them for payment. However, as a result of overuse, fingerprints are becoming the targets of attackers or imposters. Scholars [4] have proven that intelligent devices with fingerprint identification are vulnerable to artificial replicas made from common materials, such as silica, gelatin, clay, and Play-Doh, and attackers or imposters can hinder these optical and capacitive sensors using these forged fingerprints when fingers press on the surface of the scanners. Thus, one of the common problems with these intelligent devices is that they cannot guarantee the authenticity of fingerprints before identification; specifically, they cannot distinguish between genuine or fake fingerprints [5].
The fingerprint liveness detection (FLD) method aims to solve the problems of spoofing attacks. Several researchers have devoted considerable effort to distinguishing genuine fingerprints from fake ones based on different physical or psychological characteristics in recent years [5], and the existing FLD methods mainly consist of two categories: hardware-based FLD methods and software-based FLD methods. In hardware-based methods, additional sensor devices are essential to collect intrinsic properties of human live fingerprint, such as oxygen saturation, blood pressure, skin distortion, or odor of fingertips. Accordingly, these methods are usually complex and costlier. Moreover, it is hard to update or maintain when attackers adopt a new craft to improve the quality of forged fingerprints [6]. In contrast, software-based FLD approaches are relatively simple and low cost without extra hardware, and discriminative traits can be directly extracted from raw images to verify the fingertip liveness using fingerprint data analysis algorithms. Additionally, software-based methods are a very suitable solution to protect against biometrics spoofing attacks.
The software-based FLD methods are further divided into five categories: image quality, sweat pores, perspiration, skin deformation, and texture features. The first four FLD methods need two or more images to compare resulting in poor user experience. The methods based on texture features analyze the fine texture information individually, and can measure using just one image, which solves the problems in the first four methods. Texture is an important visual trait that describes the homogeneity phenomenon of the image, and reflects the arrangement property of the surface structure with slow change. Genuine and fake fingerprints can show different texture properties, such as morphology, smoothness, and orientation, and, hence, texture information of fingerprints could be employed for FLD.
At present, how to better describe the texture pattern of the fingerprints and achieve higher classification accuracy is a research hotspot of FLD. Abhyankar et al. [7] proposed a novel FLD method by combining multiresolution texture analysis and cross ridge frequency analysis. They attempted to use different texture information to quantify how the pixel value distribution of the fingerprints changed when the physical structure changed. Yuan et al. [8] introduced a multi-scale local phase quantization (LPQ) and principal component analysis (PCA) algorithm. By performing a series of data analyses based on several common feature extraction algorithms, including LPQ, local binary pattern (LBP), and convolutional neural networks (CNN) [9,10,11], they demonstrated that the detection accuracy of their method was optimal. Ghiani et al. [12] proposed a new method of binary statistical image feature (BSIF), which encoded the local fingerprint texture into a feature vector using a set of filters learnt from natural images. Xia et al. [13] built a co-occurrence array by calculating the horizontal and vertical gradient of the quantified fingerprint image, and extracted features from the array, which were fed into a support vector machine (SVM) for discrimination. Nika et al. [14] used LBP to extract the local texture features and reduce the dimension of the feature vector by sequential forward floating selection (SFFS). Fingerprint images were classified by a hybrid classifier.
The key to distinguishing true fingerprints from fakes is to extract the significant features between them. The scale-invariant feature transform (SIFT) is invariant to image scaling, translation, and rotation, and partially invariant to illumination changes and affine or three-dimensional projection [15]. This is conducive to the effective expression of target feature information, but is cannot be used to extract features from the dataset accurately and smoothly. LBP [16] has the advantages of rotation invariance and gray invariance, however, it does not satisfy scale invariance. Histograms of oriented gradients (HOG) [17] represent the structural feature of an edge (gradient) and describe the local shape information. Because the influence of light color on the image data is ignored to some extent, the dimension of the representation data required by the image is reduced. In addition, because of its processing method of dividing blocks and dividing units, the relationship between local pixels of the image can be well represented.
To sum up, the contributions of this paper are as follows: firstly, aiming at the defects of the existing texture feature algorithm, a fine-grained feature fusion structure is proposed, which can well solve the shortcomings of the single feature method. Secondly, feature fusion has a variety of approaches, so this paper proposes a feature fusion rule to improve the detection performance of the algorithm. Finally, the experimental results on three standard fingerprint sets demonstrates that the detection performance of the proposed method outperforms other algorithms, and that it also achieves better detection performance in blind material detection.
The remainder of this paper is organized as follows. Section 2 presents the methodology, including different feature extraction algorithms and particulars of the proposed model. Section 3 describes the database and design of the experiments. Section 4 analyzes the results of the experiments. Section 5 concludes.
2. Proposed Method
2.1. Feature Extraction
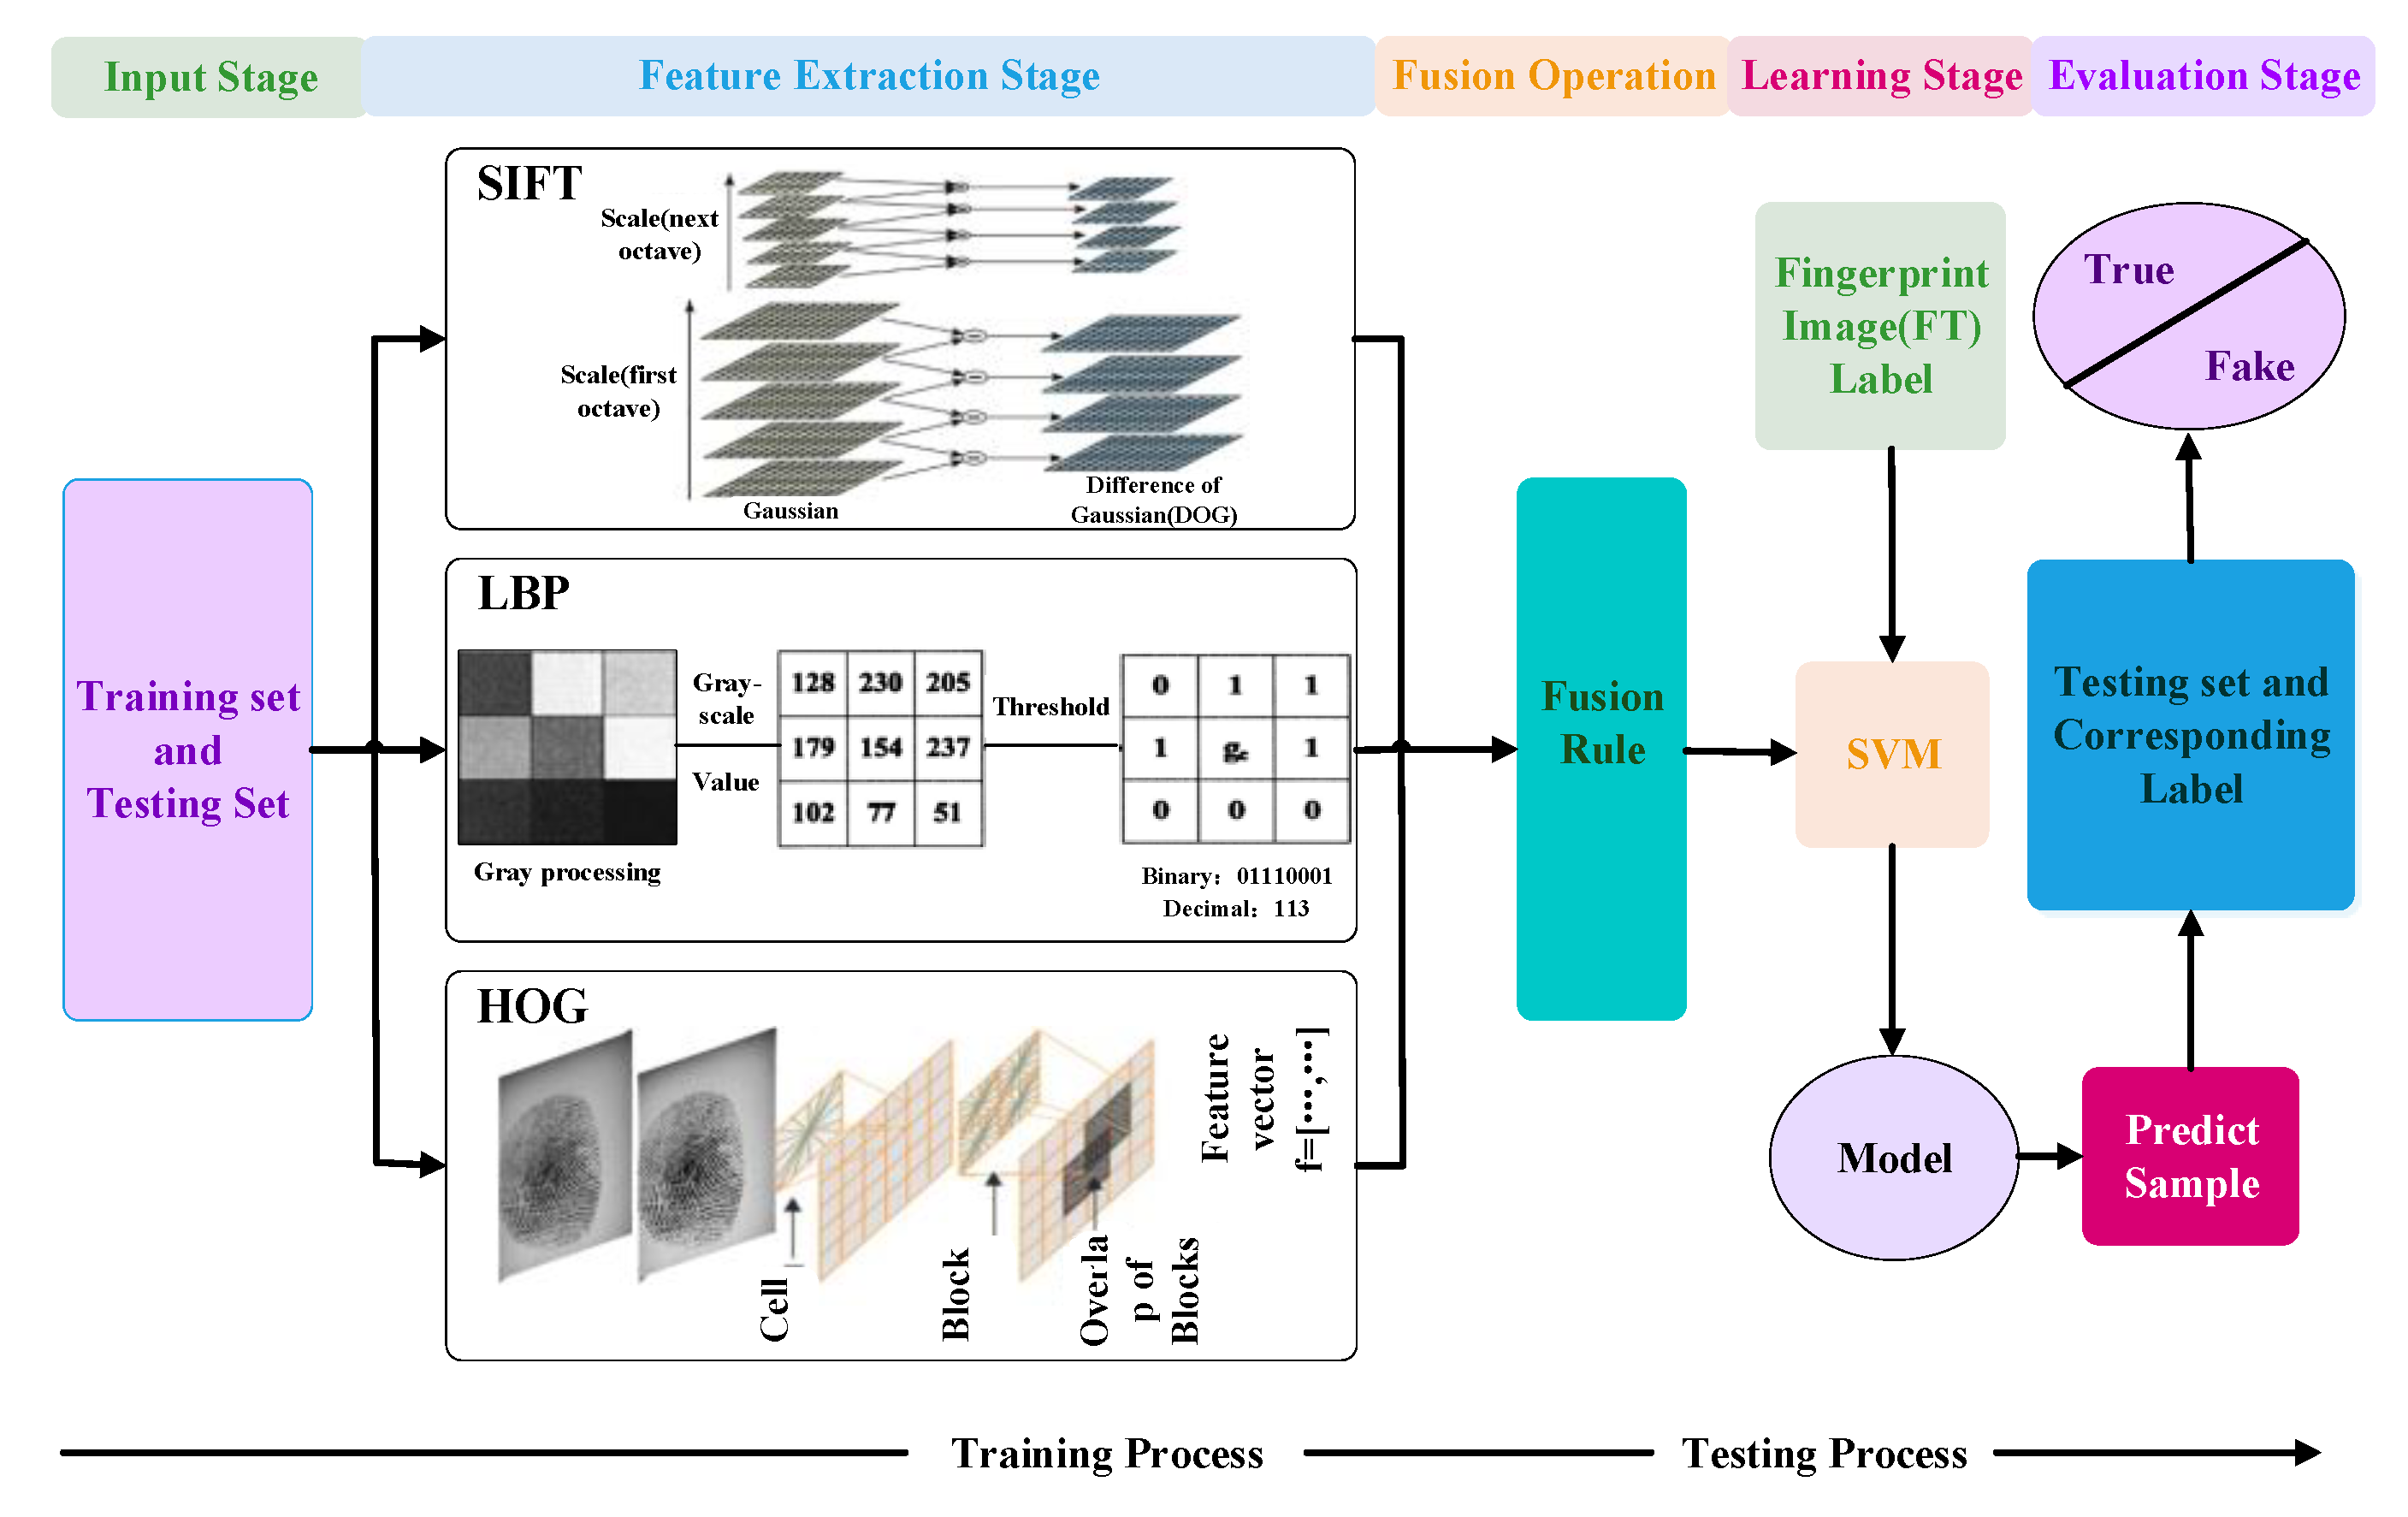
In order to better describe the differences between genuine and fake fingerprints in our data analysis method, we establish feature fusion rules to concatenate the extracted features using three feature extraction algorithms (SIFT, LBP, and HOG). As shown in Figure 1, our framework consists of two processes, namely, the training process and testing processing. The former obtains the model classifier through the training set, while the latter uses the testing set to verify the performance of the model classifier. Firstly, the training set and the testing set of the fingerprint images are used as the inputs of the feature extraction stage (including three feature extractors: SIFT, LBP, and HOG) to extract features of the fingerprint images. Because the dimensions of extracted features are different, it is hard to directly splice them. Thus, before feature fusion, insufficient parts of the feature vector need to be filled with 0. Next, the above features are processed using the feature fusion operation proposed in this paper. Then the fused features of the training set are input into the SVM classifier for training, and the model classifier is obtained. Finally, in the evaluation stage, the testing set is used to verify the performance of the model classifier.
SIFT is a kind of local feature descriptor, and can detect the key subtle information differences between genuine and fake fingerprints. As a stable descriptor of local features, SIFT remains unchanged when these images are rotated and zoomed, even when the intensity changes. First, the image scale is reconstructed using gray-scale transformation to gain the multi-scale space representation sequences of images, and the main contour of the scale space is extracted from these sequences, which are regarded as a feature vector to realize the extraction of key points in edge and corner detection at different resolutions. Then, to ensure that the detected key points are local extreme points in the scale space and two-dimensional image space, each pixel point is compared with its adjacent points, and the location of the key points realized. In addition, the stable extreme points are extracted in the space of different scales, to guarantee the scale invariance of the key points. In order to make the key points invariable to the image angle and rotation, the direction assignment is realized finding the gradient of each extremum. Finally, the key point descriptor is used to generate a unique vector by dividing the pixel area around the key point into blocks, calculating the gradient histogram within the key point, and this vector is an abstract representation of the image information in the area.
In above calculation, the scale space denotes the convolutional operation between the original image and a variable-scale two-dimensional Gaussian function , and the distribution is as follows:
The scale space of the image is the calculation of the convolution operation using the Gaussian distribution and the original image, which can be expressed as follows:
LBP [18,19] is an operator used to describe local texture features of images, and has obvious advantages of rotation invariance and gray invariance. The aim is to measure the local contrast of the fingerprints and describe the local texture information of the image. Before constructing the local texture, we need to preprocess the given image, then transform the image into a gray-scale image and analyze its pixels. The LBP operator is defined in the window of size 3 × 3, and the threshold is the pixel in the center of the window. Then, the central pixel values are compared with those of the adjacent 8 pixels. If the surrounding pixels are larger than the central pixel value, the position of the pixel is marked as 1, otherwise as 0. In this way, 8-bit binary numbers are generated by comparing the adjacent 8 points in the window of size 3 × 3, which are arranged in sequence to form a binary number. This value is taken as the LBP value of the pixel in the center of the window to reflect the texture information of the window of size 3 × 3. Usually, the image after LBP operation is divided into many square regions, such as 4 × 4, 10 × 10 or 16 × 16, and obtain 16, 100, or 256 histograms, respectively, representing the feature of fingerprint images by means of the above regions. The equation of the LBP is as follows:
where represents the position of the center pixel in a 3 × 3 window, and denote the gray of the neighbor pixel and center pixel, respectively, and represents the symbolic function. The formula of the symbolic function is as follows:
HOG [20] are made up of local features calculating the gradient direction histogram of the given images. Since HOG denote the structural feature of an edge (gradient), they can describe the local shape information, thus, they are a commonly used feature descriptor. The quantization of position and direction space can restrain the influence of translation and rotation to some extent. In addition, after normalizing the histogram in the local region, the influence of illumination change can be partially offset. Before calculation, gray-scale and brightness correction need to be carried out to reduce the influence of local shadow and light changes in the image. Meanwhile, to some extent, the interference of noise is suppressed. Then, to obtain a histogram of gradient, the horizontal and the vertical gradients of the image are calculated by filtering the image with the kernel matrix. Next, the magnitude and direction of each pixel are calculated. Then, each cell consists of 4 × 4 pixels, and the histograms of gradients are counted for each pixel in the cell. To make the generated feature robust to light, shadow, and edge changes, it is also necessary to normalize the HOG features of the block. Finally, a block is denoted by 4 × 4 cells and the features of the block are concatenated to get the final feature of the image, which is employed for subsequent classification.
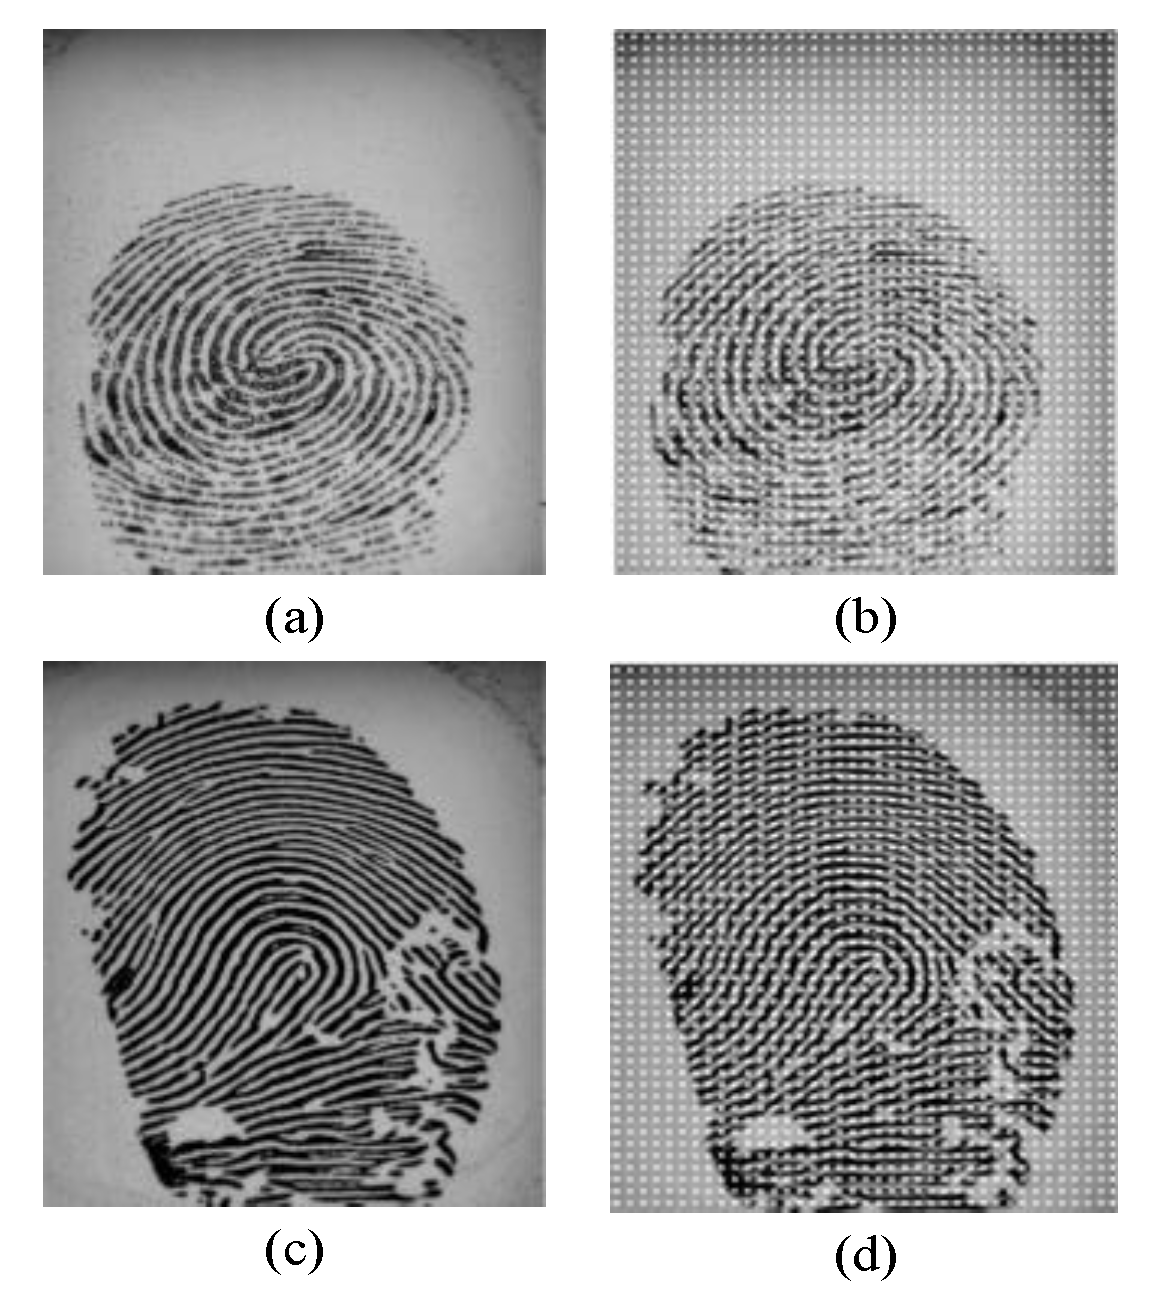
As shown in Figure 2, visual images of the true and fake feature fingerprints using the HOG method are given. For these features extracted by HOG, the genuine fingerprint features are evenly distributed, while the fake ones are damaged more with stains and other fuzzy states.
2.2. Feature Fusion Rule
As we know, the fusion forms of different features are diverse. To better represent the differences between genuine and fake fingerprints, we construct feature fusion rules to concatenate extracted features. Firstly, different feature extractors make the dimensions of feature vectors different. For example, in our method, feature dimension extracted by SIFT is 128, feature dimension extracted by HOG is 379, and feature dimension extracted by LBP is 312. Thus, it is difficult to directly splice them. To fuse these different features and unify their feature dimensions, next, we need to make up 0 for the features of different dimensions before concatenation. That is, before performing the splicing operation, the dimension of the final features is made the same by filling the end of the feature vector with 0, i.e., in our method, all of them are 379. Then, we design five feature fusion rules, namely, addition operation, maximum operation, minimum operation, average operation and concatenation operation.
Table 1 reports the specific operation for each feature fusion rule, where denotes the corresponding feature using different feature extractor (x is SIFT, LBP, or HOG), and addition operation, maximum operation, minimum operation, average operation, and concatenation operation are abbreviated as Add, Max, Min, Ave, and Con, respectively. Please refer to the algorithm 1 process for the detailed operation process of different feature fusion.
| Algorithm 1. Proposed feature fusion rules. |
| Input: Given fingerprint training set , k is the kth image, and y is label; |
| Output: The classification results of different feature fusion operations; |
| Step 1: Extract feature of the image using corresponding feature extractor x (x is SIFT, LBP or HOG, respectively), which denotes ; |
| Step 2: Set String[] ope; ope [0] = “Add”, ope [1] = “Max”, ope [2] = “Min”, ope [3] = “Ave”, ope [4] = “Con” |
| Whilei < ope.length do |
| Step 3: Fill the end of feature with 0 to make the dimension of the feature vectors equal. |
| Step 4: For the kth image, implement feature fusion via matrix operation: . |
| Step 5: Use SVM to train the fused features . |
| Step 6: Use testing set to validate the performance of the model classifier. |
| Step 7: Repeat steps 3 to 6 (ope.length – 1) times, obtain classification accuracies for feature |
| fusion operation. |
| End while |
2.3. Parameter Optimization
After fusing the features using our proposed rules, the generated features are fed into an SVM classifier for the subsequent training and testing.
The basic model of SVM is a binary classification model, which is suitable for binary fingerprint liveness detection. Due to the high dimension of the fusion feature, it is linearly indivisible in the low dimensional space, so we choose an RBF (radial basis function) [21] kernel function to realize the nonlinear mapping. SVM is a kind of model classifier using the criterion of structural risk minimization [22,23], and is divided into two categories depending on the common nuclear function: linear or nonlinear. To eliminate the adverse effects caused by outliers’ dimensions, first, a standardization operation is performed. Then, to obtain a robust and effective model classifier, two parameters, C penalty coefficient and gamma, should be found. Parameter C, which is common in all SVM kernels, competes with the simplicity of the decision surface and performs a valuable conversion of misclassification of training samples. A smaller C makes the decision surface smoother, while a higher C is designed to correctly classify all training samples. The parameter gamma defines how much impact a single training sample can have. A larger gamma would affect other samples more. The gamma parameter can be considered as the inverse of the radius of the influence of the sample selected by the model support vector. Finally, using the above optimal parameter pair <C, gamma>, we get the model classifier and test the performance of model classifier using the testing samples.
3. Experiments
3.1. Databases
The performance of our proposed method is evaluated using the benchmark fingerprint datasets LivDet 2011 [13], 2013 [24], and 2015 [6], which were derived from 2011, 2013 and 2015 FLD competitions, respectively, and publicly downloaded after registration. Each set consists of real and fake fingerprints and is procured using four different flat optical sensors. Each real or fake dataset also consists of two parts: a training set and a testing set. The detailed description of LivDet 2011, 2013, and 2015 datasets is given in Table 2, Table 3 and Table 4. From Table 2, Table 3 and Table 4, we can clearly observe the distribution of fingerprint images. It is worth emphasizing that there is no overlap between them.
3.2. Experimental Process and Evaluation Metrics
First, we adopt an image gray processing operation to eliminate the influence of light and other factors on the fingerprints. Then, the features of the fingerprints are extracted via three classical feature extraction algorithms, namely, SIFT, LBP, and HOG. However, the detection performance of the fingerprint liveness based on a single feature method is unsatisfactory, and our experimental results also confirm this. To solve the problem, one possible solution is to fuse the features to make up for the shortcomings of a single feature algorithm, thereby further enhancing the final performance.
Because of the difference between the three algorithms, the dimensions of the features extracted are inconsistent. To successfully perform the five feature fusion operations in Section 2.2, insufficient parts need to be filled with 0. Since the distributions and ranges of each feature are different, it is necessary to map these features extracted to the same interval using normalization operations to make the components of features consistent. Moreover, rescaling to the appropriate range can make training and testing faster. Then, it is necessary to optimize parameters to find the best C and gamma, which are employed for the subsequent model training. Finally, the classification result is obtained using a trained model classifier.
In order to verify the performance of the feature extraction algorithm in the paper, we adopt the average classification error (ACE) [24,25,26] as the metric of performance evaluation. The formula is defined as follows:
where FAR (false accept rate) denotes the ratio of a fake fingerprint being mistaken as a genuine one, while FRR (false reject rate) is the probability of a genuine fingerprint being improperly rejected as a fake fingerprint; these can be expressed as follows:
The outcome of fingerprint liveness detection may be any value between 0 and 100. Finally, we can obtain the performance of our proposed algorithm using Equation (5). The smaller the ACE, the better the detection performance of the algorithm.
4. Results and Data Analysis
4.1. Parameter Optimization
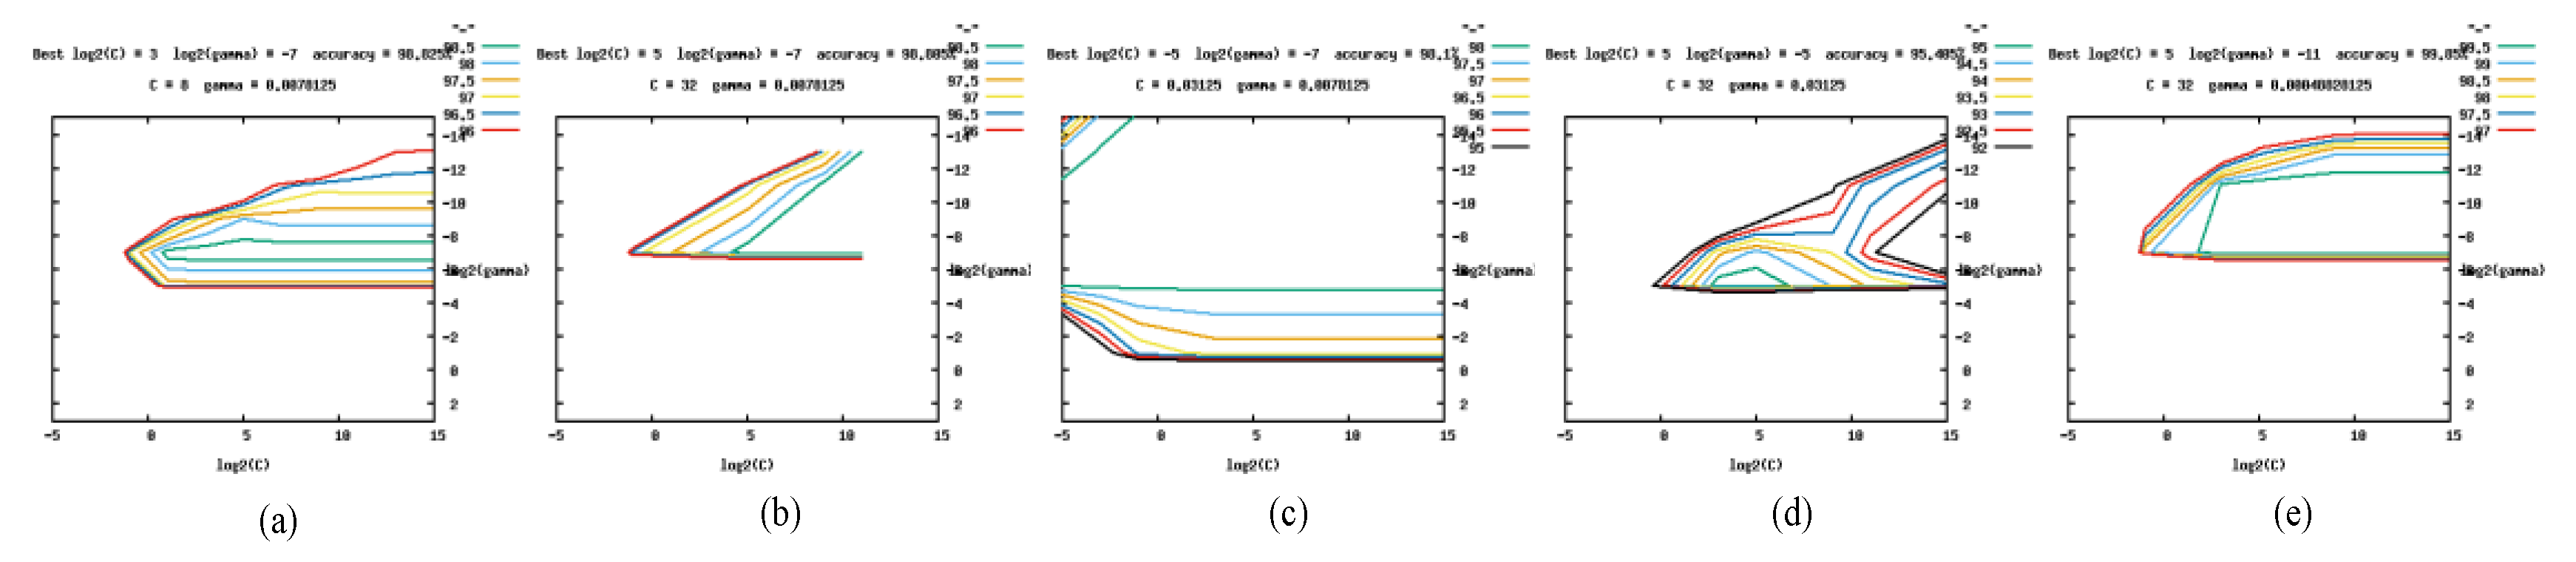
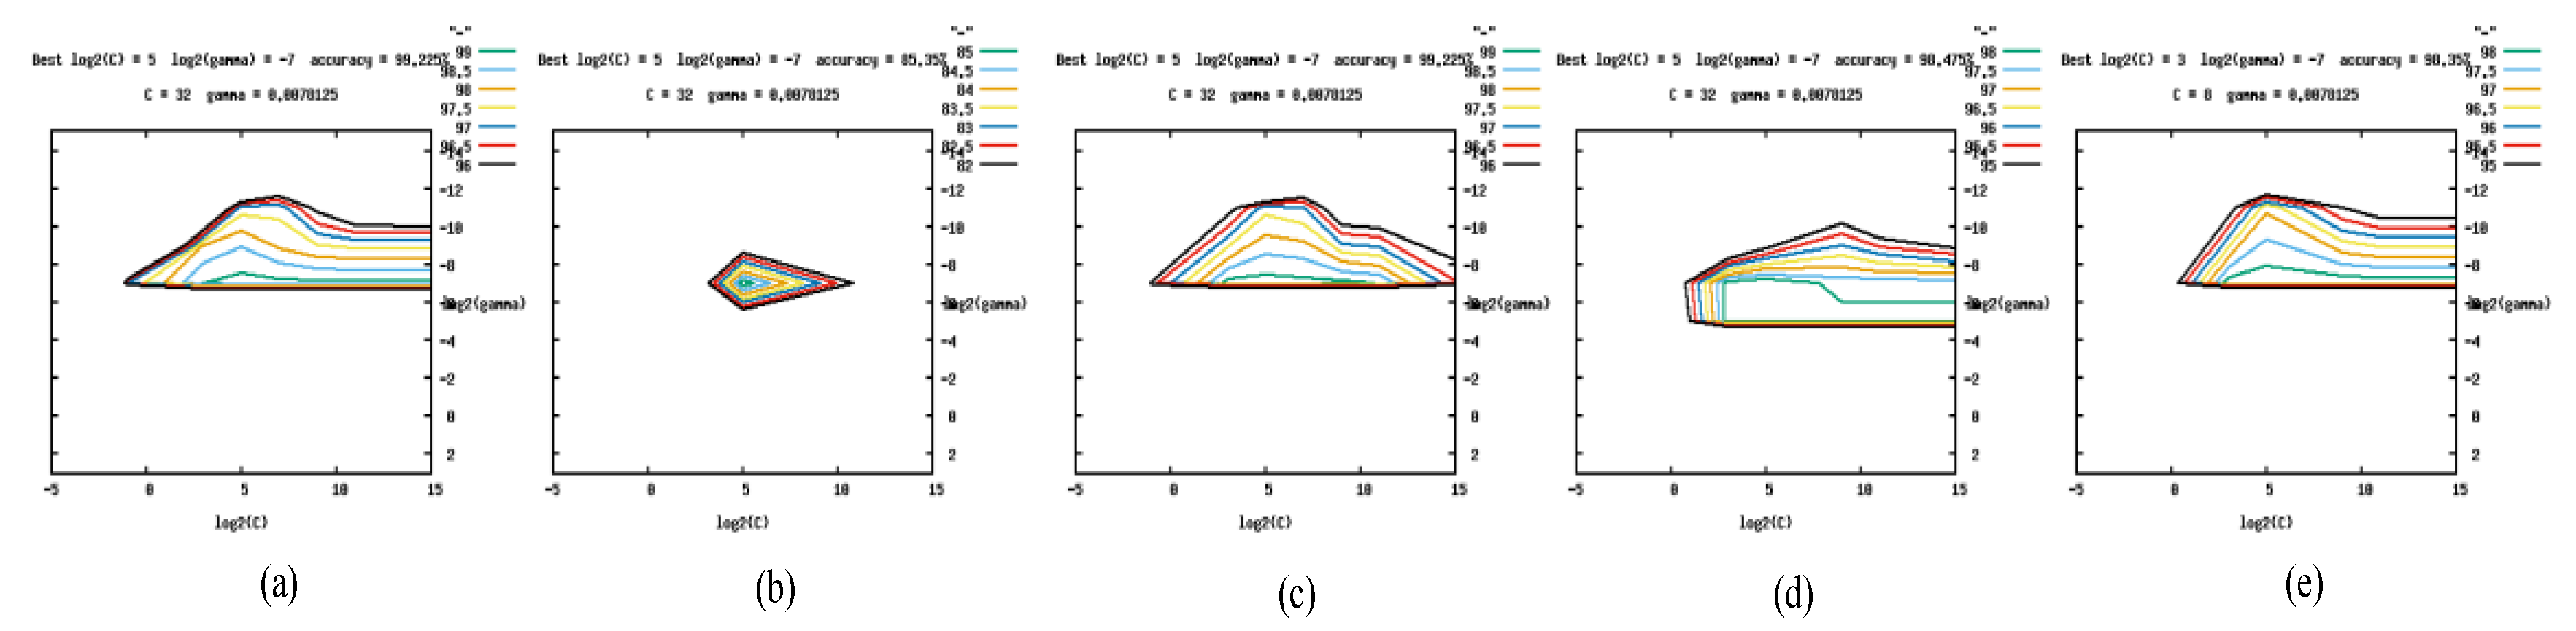
Before training using an SVM with an RBF, to obtain a model classifier with better robustness, it is necessary to find the optimal parameter pair <C, gamma>. For the parameter pair <C, gamma>, we directly use the grid.py program in the libsvm [23] toolkit to train the classifier, and take the corresponding <C, gamma> with the highest classification accuracy as the optimization. Figure 3, Figure 4 and Figure 5 provides the visual images of optimal parameter pairs in the LivDet 2011 dataset from Digital, the LivDet 2013 dataset from Biometrika, and the LivDet 2015 dataset from Hi_Scan. At the top of each panel, the optimal parameter pairs <C, gamma> are given and input into the SVM for subsequent model training. In our experiments, the optimal values of parameter pairs <C, gamma> in Figure 3a–e are <8, 0.03125>, <8, 0.03125>, <128, 0.03125>, <32, 0.03125>, and <8, 0.0078125>, respectively, and the optimal values of parameter pairs <C, gamma> in Figure 4a–e are <8, 0.0078125>, <32, 0.0078125>, <0.03125, 0.0078125 >, <32, 0.03125>, and <32, 0.00049>, respectively. The optimal values <C, gamma> in Figure 5a–e are <32, 0.0078125>, <32, 0.0078125>, <32, 0.0078125>, <32, 0.0078125>, and <8, 0.0078125>, respectively.
4.2. Classification Accuracy Discussion
In this section, we first analyze and evaluate the performance of our method within LivDet 2011, LivDet 2013, and LivDet 2015 datasets when adopting different feature fusion rules, and the detailed results are reported in Table 5, Table 6 and Table 7. According to the observations in Table 5, Table 6 and Table 7, in general, the detection results after feature fusion are better than those of a single feature algorithm, and the time required to test all datasets is acceptable. Moreover, testing a fingerprint can be done without individuals knowing it, which indicates that our method is also applicable to real life.
As shown in Table 5, in the LivDet 2011 dataset from Digital, the classification accuracies of SIFT, LBP, and HOG are 87.8%, 91.2%, and 92.1%, respectively. After performing feature fusion operation, the classification accuracy of SIFT + HOG is 96.9%. The detection accuracy of the algorithm is improved significantly after fusion features. In the LivDet 2011 dataset from Sagem, the classification accuracies of SIFT, LBP, and HOG are 92.3%, 99.8%, and 99.9%, respectively. After performing the feature fusion operation, the classification accuracies of Add, Max, Ave, and Con are all 99.9%. The maximum operations, minimum operations, and average operations run more quickly than the algorithm for a single feature. The same conclusion can be drawn from the Biometrika and Italdata sensors. However, abnormal results may also occur. For example, in Digital, the detection results of feature fusion operations Max, Min, and Ave are weaker than those of a single feature. Based on our analysis, it is possible that the more expressive texture features are discarded after the three matrix operations, resulting in weaker final classification performance. Looking at the fusion operation Con, the results are the best. Although there are some outliers, the overall situation shows that the detection performance of the operation after feature fusion is higher than that of the single feature.
As shown in Table 6, for the Biometrika scanner on the LivDet 2013 dataset, the classification accuracies of SIFT, LBP, and HOG are 86.7%, 94.0%, and 93.8%, respectively. After carrying out the feature fusion operation, the classification accuracy of LBP + HOG is 99.9%. Thus, feature fusion can improve the identification performance of genuine and fake fingerprints. In the CrossMatch scanner on the LivDet 2013 dataset, the classification results of SIFT, LBP, and HOG are 88.8%, 90.6%, and 90.5%, respectively. After performing the feature fusion operation, the classification accuracy of SIFT + LBP is 93.6. The results once again show that the proposed feature fusion method can improve the performance of fingerprint liveness detection.
As shown in Table 7, in the Hi_Scan sensor on the LivDet 2015 fingerprint set, the average classification correct accuracies of SIFT, LBP, and HOG are 85.0%, 98.8%, and 75.8%, respectively, while the classification accuracies of addition and minimum operations are both 99.2%, slightly higher than the classification accuracy rate of a single algorithm. In the Digital-Persona dataset, the classification accuracies of SIFT, LBP, and HOG are 83.2%, 90.6%, and 77.8%, respectively. The average classification correct accuracies of SIFT + LBP and LBP + HOG are 90.7% and 92.4%, respectively, higher than that of single feature method. The same problem occurs in Table 7. There are some outliers, but the overall situation still suggests that the detection performance of the operation after feature fusion is higher than that of the single feature.
In addition, the time required for testing all datasets is also listed in Table 5, Table 6 and Table 7, and is acceptable. Moreover, under testing a fingerprint, it is basically done without our even knowing it, which indicates that our proposed method is also applicable to real life.
Existing FLD methods are based on known fake fingerprint materials. However, the type of fake fingerprint material is not known when testing it in reality. Thus, we also carried out a cross-material evaluation of the fingerprint image sets used in this paper. For each dataset, we extracted the features of fake fingerprints made by different materials for the training set and the testing set, and compared the accuracy of our feature fusion method with Nogueira et al. [25]. Table 8 provides the results, where the ‘-’ indicates that the experiment was not performed in [25]. Regarding the results of other sensors described above, the experiment shows that the detection accuracy of feature fusion is higher than that of a single feature when performing blind material detection; that is, if we do not know what the fake fingerprint was made of, the accuracy rate and the error rate are equal. Using the method proposed in this work, the experiments indicate that the results are more accurate than those obtained simply by guessing.
4.3. Comparisons of Algorithms
Table 9, Table 10 and Table 11 list the detailed comparison results when we perform the concatenation operation. To provide a clear comparison of each algorithm, the optimal results for each fingerprint sensor are described in bold in each row. The smaller the ACE, the better the proposed method. The results for each table are described below.
In Table 9, the average classification error (ACE) of our method is the lowest, which is 4.6%. By observing the results of different scanners, it is found that the result of the Sagem scanner on the LivDet 2011 is close to 0. That is, when the type of fingerprint scanner is known to be Sagem, we are 99% sure that the fingerprint to be tested is true or fake, and the performance is significantly higher than other algorithms. Moreover, the ACE of our method is 2.64% lower than the best result of [29]. Although our result for the Biometrika scanner is 7.45% higher than one result of [29], the result of the Digital sensor is 7.32% lower than that of [29].
In Table 10, the average classification error (ACE) of our method is the lowest, which is 3.48%. The result of the Biometrika scanner on the LivDet 2013 dataset is close to 0. That is, when the type of fingerprint scanner is known to be Biometrika, we are 99% sure that the fingerprint to be tested is true or false, and the performance is significantly higher than other algorithms. Although our result for the Italdata scanner is 2.75% higher than one result of [29], the ACE of our method is still 3.76% lower than the best result of [29], and the result for Crossmatch is 3.92% lower than the result of [29].
In Table 11, the average classification error (ACE) of our method is the lowest, which is 4.03%. The result of the CrossMatch scanner on the LivDet 2015 dataset is close to 0, and the ACE of our method is still 3.21% lower than the best result of [29]. Although our result for the GreenBit scanner is 3.85% higher than one result of [29], the result for the Hi_Scan sensor is 7.32% lower than that of [29]. To sum up, Table 9, Table 10 and Table 11 again shows that, to obtain better FLD detection performance, different feature fusion methods can be used when the types of fingerprint scanners are known.
5. Conclusions
The development of image technology and the application of intelligent devices enable us to capture many high-resolution images. Among these, intelligent devices with fingerprint identification are most popular. However, the study found that they are vulnerable to attack by fake fingerprints made of special materials. To elevate the security of these intelligent devices, in this study we propose a data analysis method to distinguish genuine fingerprints from fake ones. It is well-known that the SIFT feature descriptor is characterized by invariance to rotation, scale, and brightness; the HOG feature descriptor ignores the influence of light on the image, reducing the dimension of the feature for the image; and the LBP feature descriptor is insensitive to light and fast to operate. Combining the advantages of SIFT features, LBP features, and HOG features can make up for the shortcomings of each algorithm and improve the final detection performance. Finally, the fused features are fed into an SVM classifier for the subsequent training and testing. From comparison by experiment, the classification performance based on fused features using SIFT, HOG, and LBP is better than other FLD methods, and our method is more suitable for fingerprint liveness detection to prevent spoof attacks related to these artificial replicas.
Since the feature fusion operation can achieve better detection performance than a single feature, we will try to explore more feature fusion schemes in future work, such as the linear combination of features, to further improve the FLD performance.
Author Contributions
Conceptualization, C.Y. and X.L.; methodology, X.L. and C.Y.; software, C.Y. and W.C.; formal analysis, X.L., C.Y. and Q.C.; investigation, X.L.; resources, C.Y. and W.G.; writing—original draft preparation, X.L. and C.Y.; supervision, C.Y.; funding acquisition, C.Y. and B.Y. All authors have read and agreed to the published version of the manuscript.
Funding
This research was funded by the National Natural Science Foundation of China (U1836208, U1536206, U1836110, 61602253, 61672294, 71471129), the Startup Foundation for Introducing Talent of NUIST (2020r015), CICAEET and the PAPD fund.
Conflicts of Interest
The authors declare no conflict of interest.
References
- Xiang, L.; Li, Y.; Hao, W.; Yang, P.; Shen, X. Reversible Natural Language Watermarking Using Synonym Substitution and Arithmetic Coding. CMC-Comput. Mater. Con. 2018, 55, 541–559. [Google Scholar]
- Zhang, P.; Liu, Y.; Yang, G.; Zhang, G. A distributionally robust optimization model for designing humanitarian relief network with resource reallocation. Soft Comput. 2020, 24, 2749–2767. [Google Scholar] [CrossRef]
- Wang, B.; Kong, W.; Li, W.; Xiong, N.N. A dual-chaining watermark scheme for data integrity protection in Internet of Things. CMC-Comput. Mater. Con. 2019, 58, 679–695. [Google Scholar] [CrossRef] [Green Version]
- Yuan, C.; Sun, X. Fingerprint liveness detection using histogram of oriented gradient based texture feature. J. Internet Technol. 2018, 19, 1499–1507. [Google Scholar]
- Yuan, C.; Chen, X.; Yu, P.; Meng, R.; Cheng, W.; Wu, Q.J.; Sun, X. Semi-supervised stacked autoencoder-based deep hierarchical semantic feature for real-time fingerprint liveness detection. J. Real-Time Image Pr. 2020, 17, 55–71. [Google Scholar] [CrossRef]
- Ghiani, L.; Yambay, D.; Valerio, M.; Gian, L.; Rolo, F.; Schuckers, S. Review of the Fingerprint Liveness Detection (LivDet) competition series: 2009 to 2015. Image Vis. Comput. 2016, 58, 110–128. [Google Scholar] [CrossRef] [Green Version]
- Abhyankar, A.; Schuckers, S. Fingerprint liveness detection using local ridge frequencies and multiresolution texture analysis techniques. In Proceedings of the International Conference on Image Processing, Atlanta, GA, USA, 8–11 October 2006; pp. 321–324. [Google Scholar]
- Yuan, C.; Sun, X.; Lv, R. Fingerprint liveness detection based on multi-scale LPQ and PCA. China Commun. 2016, 13, 60–65. [Google Scholar] [CrossRef]
- Nogueira, R.F.; de Alencar Lotufo, R.; Machado, R.C. Evaluating software-based fingerprint liveness detection using convolutional networks and local binary patterns. In Proceedings of the IEEE Workshop on Biometric Measurements and Systems for Security and Medical Applications (BIOMS), Rome, Italy, 17 October 2015; pp. 22–29. [Google Scholar]
- Cui, Q.; McIntosh, S.; Sun, H. Identifying materials of photographic images and photorealistic computer generated graphics based on deep CNNs. CMC-Comput. Mater. Con. 2018, 55, 229–241. [Google Scholar]
- Meng, R.; Rice, S.G.; Wang, J.; Sun, X. A fusion steganographic algorithm based on faster R-CNN. CMC-Comput. Mater. Con. 2018, 55, 1–16. [Google Scholar]
- Ghiani, L.; Hadid, A.; Marcialis, G.L.; Roli, F. Fingerprint liveness detection using local texture features. IET Biom. 2016, 6, 224–231. [Google Scholar] [CrossRef]
- Xia, Z.; Lv, R.; Zhu, Y.; Ji, P.; Sun, H.; Shi, Y.Q. Fingerprint liveness detection using gradient-based texture features. Signal Image Video 2017, 11, 381–388. [Google Scholar] [CrossRef]
- Nikam, S.B.; Agarwal, S. Texture and wavelet-based spoof fingerprint detection for fingerprint biometric systems. In Proceedings of the First International Conference on Emerging Trends in Engineering and Technology, Nagpur, India, 16–18 July 2008; pp. 675–680. [Google Scholar]
- Lowe, D.G. Object recognition from local scale-invariant features. In Proceedings of the International Conference on Computer Vision, Corfu, Greece, 20–27 September 1999; pp. 1150–1157. [Google Scholar]
- Ojala, T.; Pietikainen, M.; Maenpaa, T. Multiresolution gray-scale and rotation invariant texture classification with local binary patterns. IEEE Trans. Pattern Anal. 2002, 24, 971–987. [Google Scholar] [CrossRef]
- Dalal, N.; Triggs, B. Histograms of oriented gradients for human detection. In Proceedings of the IEEE Computer Society Conference on Computer Vision and Pattern Recognition (CVPR’05), San Diego, CA, USA, 20–25 June 2005; pp. 886–893. [Google Scholar]
- Beamer, L.J.; Carroll, S.F.; Eisenberg, D. The BPI/LBP family of proteins: A structural analysis of conserved regions. Protein Sci. 1998, 7, 906–914. [Google Scholar] [CrossRef] [PubMed] [Green Version]
- Tan, X.; Triggs, B. Fusing Gabor and LBP feature sets for kernel-based face recognition. In International Workshop on Analysis and Modeling of Faces and Gestures; Springer: Berlin/Heidelberg, Germany, 2007; pp. 235–249. [Google Scholar]
- Saito, H.; Tatebayashi, K. Regulation of the osmoregulatory HOG MAPK cascade in yeast. J. Biochem. 2004, 136, 267–272. [Google Scholar] [CrossRef]
- Kuo, B.; Ho, H.; Li, C.; Hung, C.; Taur, J. A Kernel-Based Feature Selection Method for SVM with RBF Kernel for Hyperspectral Image Classification. IEEE J. STARS 2014, 7, 317–326. [Google Scholar]
- Li, R.; Liu, Y.; Qiao, Y.; Ma, T.; Wang, B.; Luo, X. Street-Level Landmarks Acquisition Based on SVM Classifiers. CMC-Comput. Mater. Con. 2019, 59, 591–606. [Google Scholar] [CrossRef]
- Chang, C.; Lin, C. LIBSVM: A library for support vector machines. ACM T. Intel. Syst. Tec. 2011, 2, 1–27. [Google Scholar] [CrossRef]
- Yuan, C.; Sun, X.; Wu, Q.J. Difference co-occurrence matrix using BP neural network for fingerprint liveness detection. Soft Comput. 2019, 23, 5157–5169. [Google Scholar] [CrossRef]
- Nogueira, R.F.; de Alencar Lotufo, R.; Machado, R.C. Fingerprint liveness detection using convolutional neural networks. IEEE Trans. In. Foren. Sec. 2016, 11, 1206–1213. [Google Scholar] [CrossRef]
- Jiang, Y.; Liu, X. Uniform local binary pattern for fingerprint liveness detection in the Gaussian pyramid. J. Elect. Comput. Eng. 2018, 1–9. [Google Scholar] [CrossRef]
- Gottschlich, C.; Marasco, E.; Yang, A.Y.; Cukic, B. Fingerprint liveness detection based on histograms of invariant gradients. In Proceedings of the IEEE International Joint Conference on Biometrics, Cleanwater, FL, USA, 29 September–2 October 2014; pp. 1–7. [Google Scholar]
- Ghiani, L.; Yambay, D.; Mura, V.; Tocco, S.; Marcialis, G.L.; Roli, F.; Schuckcrs, S. Livdet 2013 fingerprint liveness detection competition 2013. In Proceedings of the International Conference on Biometrics (ICB), Madrid, Spain, 4–7 June 2013; pp. 1–6. [Google Scholar]
- Yuan, C.; Xia, Z.; Sun, X.; Wu, Q.M.J. Deep Residual Network with Adaptive Learning Framework for Fingerprint Liveness Detection. IEEE Trans. Cogn. Dev. Syst. 2019, 1–13. [Google Scholar]
Figure 1.
Flow chart of fingerprint liveness detection based on fine-grained feature fusion.

Figure 2.
True and fake fingerprints and their visualizations using histograms of oriented gradients (HOG): (a) true fingerprint; (b) true fingerprint visualization; (c) fake fingerprint; (d) fake fingerprint visualization.
Figure 2.
True and fake fingerprints and their visualizations using histograms of oriented gradients (HOG): (a) true fingerprint; (b) true fingerprint visualization; (c) fake fingerprint; (d) fake fingerprint visualization.

Figure 3.
Parameter optimization figures under different feature fusion operation in the LivDet 2011 dataset from Digital: (a) addition operation; (b) maximum operation; (c) minimum operation; (d) average operation; (e) concatenation operation.
Figure 3.
Parameter optimization figures under different feature fusion operation in the LivDet 2011 dataset from Digital: (a) addition operation; (b) maximum operation; (c) minimum operation; (d) average operation; (e) concatenation operation.

Figure 4.
Parameter optimization figures under different feature fusion operation in the LivDet 2013 dataset from Biometrika: (a) addition operation; (b) maximum operation; (c) minimum operation; (d) average operation; (e) concatenation operation.
Figure 4.
Parameter optimization figures under different feature fusion operation in the LivDet 2013 dataset from Biometrika: (a) addition operation; (b) maximum operation; (c) minimum operation; (d) average operation; (e) concatenation operation.

Figure 5.
Parameter optimization figures under different feature fusion operation in the LivDet 2015 dataset from Hi_Scan: (a) addition operation; (b) maximum operation; (c) minimum operation; (d) average operation; (e) concatenation operation.
Figure 5.
Parameter optimization figures under different feature fusion operation in the LivDet 2015 dataset from Hi_Scan: (a) addition operation; (b) maximum operation; (c) minimum operation; (d) average operation; (e) concatenation operation.


Table 1.
Feature fusion rules of different fusion operations.
| Operation | Addition | Maximum | Minimum | Average | Concatenation |
|---|---|---|---|---|---|
| Rule |
Table 2.
The image distribution of the LivDet 2011 dataset.
| Dataset ID | Sensor | Size | Samples in Training Set | Samples in Testing Set | ||
|---|---|---|---|---|---|---|
| Live | Spoof | Live | Spoof | |||
| Liv2011-1 | Biometrika | 315 × 372 | 1000 | 1000 | 1000 | 1000 |
| Liv2011-2 | Digital Persona | 355 × 391 | 1004 | 1000 | 1000 | 1000 |
| Liv2011-3 | ItalData | 640 × 480 | 1000 | 1000 | 1000 | 1000 |
| Liv2011-4 | Sagem | 352 × 384 | 1008 | 1008 | 1000 | 1036 |
Table 3.
The image distribution of the LivDet 2013 dataset.
| Dataset ID | Sensor | Size | Samples in Training Set | Samples in Testing Set | ||
|---|---|---|---|---|---|---|
| Live | Spoof | Live | Spoof | |||
| Liv2013-1 | Biometrika | 352 × 384 | 1000 | 1000 | 1000 | 1000 |
| Liv2013-2 | CrossMatch | 800 × 750 | 1250 | 1000 | 1250 | 1000 |
| Liv2013-3 | ItalData | 480 × 640 | 1000 | 1000 | 1000 | 1000 |
| Liv2013-4 | Swipe | 1500 × 208 | 1221 | 979 | 1153 | 1000 |
Table 4.
The image distribution of the LivDet 2015 dataset.
| Dataset ID | Sensor | Size | Samples in Training Set | Samples in Testing Set | ||
|---|---|---|---|---|---|---|
| Live | Spoof | Live | Spoof | |||
| Liv2015-1 | CrossMatch | 800 × 750 | 1510 | 1473 | 1500 | 1448 |
| Liv2015-2 | Digital_Persona | 252 × 324 | 1000 | 1000 | 1000 | 1500 |
| Liv2015-3 | GreenBit | 500 × 500 | 1000 | 1000 | 1000 | 1500 |
| Liv2015-4 | Hi_Scan | 1000 × 1000 | 1000 | 1000 | 1000 | 1500 |
Table 5.
Average classification accuracy and testing time of different feature fusions in the LivDet 2011 fingerprint set.
Table 5.
Average classification accuracy and testing time of different feature fusions in the LivDet 2011 fingerprint set.
| Feature Fusion | Average Classification Correct Accuracy (%) | Testing Time (s) | ||||||
|---|---|---|---|---|---|---|---|---|
| Biometrika | Digital | Italdata | Sagem | Biometrika | Digital | Italdata | Sagem | |
| SIFT | 85.0 | 87.8 | 85.9 | 92.3 | 7 | 7 | 11 | 9 |
| LBP | 84.5 | 91.2 | 93.4 | 99.8 | 12 | 14 | 19 | 15 |
| HOG | 79.3 | 92.1 | 66.5 | 99.9 | 60 | 30 | 66 | 10 |
| SIFT + LBP | 87.1 | 93.8 | 95.0 | 99.9 | 42 | 61 | 78 | 8 |
| SIFT + HOG | 83.6 | 96.9 | 82.7 | 99.9 | 62 | 40 | 67 | 43 |
| LBP + HOG | 85.7 | 96.6 | 94.0 | 98.0 | 26 | 19 | 18 | 21 |
| Add (SIFT, LBP, HOG) | 86.3 | 95.9 | 94.5 | 99.9 | 32 | 29 | 43 | 6 |
| Max (SIFT, LBP, HOG) | 75.0 | 87.5 | 61.2 | 99.9 | 6 | 5 | 6 | 1 |
| Min (SIFT, LBP, HOG) | 64.8 | 73.6 | 60.8 | 78.7 | 6 | 4 | 5 | 6 |
| Ave (SIFT, LBP, HOG) | 74.2 | 87.0 | 71.0 | 99.9 | 5 | 4 | 5 | 1 |
| Con (SIFT, LBP, HOG) | 89.0 | 97.4 | 95.3 | 99.9 | 65 | 99 | 128 | 14 |
Table 6.
Average classification accuracy and testing time of different feature fusions in the LivDet 2013 fingerprint set.
Table 6.
Average classification accuracy and testing time of different feature fusions in the LivDet 2013 fingerprint set.
| Feature Fusion | Average Classification Correct Accuracy (%) | Testing Time (s) | ||||||
|---|---|---|---|---|---|---|---|---|
| Biometrika | Crossmatch | Italdata | Swipe | Biometrika | Crossmatch | Italdata | Swipe | |
| SIFT | 86.7 | 88.8 | 85.2 | 91.2 | 9 | 19 | 15 | 12 |
| LBP | 94.0 | 90.6 | 90.6 | 93.3 | 23 | 10 | 73 | 43 |
| HOG | 93.8 | 90.5 | 96.6 | 92.3 | 42 | 9 | 37 | 59 |
| SIFT + LBP | 84.9 | 93.6 | 95.6 | 97.9 | 33 | 45 | 62 | 25 |
| SIFT + HOG | 78.4 | 86.4 | 85.9 | 95.7 | 13 | 25 | 33 | 11 |
| LBP + HOG | 99.9 | 84.0 | 91.5 | 96.2 | 20 | 34 | 54 | 15 |
| Add (SIFT, LBP, HOG) | 99.6 | 92.4 | 94.3 | 96.5 | 12 | 22 | 25 | 10 |
| Max (SIFT, LBP, HOG) | 98.8 | 83.9 | 95.0 | 96.6 | 3 | 21 | 24 | 9 |
| Min (SIFT, LBP, HOG) | 98.1 | 56.5 | 72.3 | 79.3 | 15 | 7 | 10 | 7 |
| Ave (SIFT, LBP, HOG) | 95.4 | 94.2 | 94.7 | 93.7 | 14 | 17 | 17 | 14 |
| Con (SIFT, LBP, HOG) | 99.9 | 94.0 | 94.9 | 97.3 | 19 | 51 | 45 | 12 |
Table 7.
Average classification accuracy and testing time of different feature fusions in the LivDet 2015 fingerprint set.
Table 7.
Average classification accuracy and testing time of different feature fusions in the LivDet 2015 fingerprint set.
| Feature Fusion | Average Classification Correct Accuracy (%) | Testing Time (s) | ||||||
|---|---|---|---|---|---|---|---|---|
| CrossMatch | Digital_Persona | GreenBit | Hi_Scan | CrossMatch | Digital_Persona | GreenBit | Hi_Scan | |
| SIFT | 90.9 | 83.2 | 79.3 | 85.0 | 7 | 8 | 9 | 8 |
| LBP | 99.9 | 90.6 | 95.3 | 98.8 | 51 | 47 | 63 | 103 |
| HOG | 60.9 | 77.8 | 72.6 | 75.8 | 61 | 58 | 63 | 47 |
| SIFT + LBP | 99.9 | 90.7 | 94.4 | 98.7 | 14 | 33 | 44 | 93 |
| SIFT + HOG | 91.4 | 85.5 | 78.7 | 84.1 | 49 | 60 | 71 | 62 |
| LBP + HOG | 99.9 | 92.4 | 94.1 | 98.8 | 78 | 88 | 98 | 110 |
| Add (SIFT, LBP, HOG) | 99.9 | 89.1 | 92.8 | 99.2 | 38 | 34 | 40 | 82 |
| Max (SIFT, LBP, HOG) | 76.5 | 90.7 | 93.6 | 85.4 | 157 | 61 | 78 | 171 |
| Min (SIFT, LBP, HOG) | 99.8 | 75.7 | 70.1 | 99.2 | 59 | 48 | 125 | 146 |
| Ave (SIFT, LBP, HOG) | 99.9 | 90.3 | 92.2 | 98.5 | 77 | 36 | 59 | 108 |
| Con (SIFT, LBP, HOG) | 99.9 | 91.8 | 93.8 | 98.4 | 20 | 64 | 83 | 127 |
Table 8.
Accuracy of different fake fingerprint materials in different datasets.
| Datasets | Materials Used to Fabricate Fake Fingerprints | Nogueira et al. [24] | Feature Fusion | |||||||
|---|---|---|---|---|---|---|---|---|---|---|
| Materials in Training Set | Materials in Testing Set | CNN-VGG | SIFT | LBP | HOG | SIFT + LBP | SIFT + HOG | LBP + HOG | SIFT + LBP + HOG | |
| Bio2011 | EcoFlex, Gelatine, Latex | Silgum, Wood Glue | 10.1 | 28.6 | 15.5 | 4.3 | 15.0 | 8.1 | 13.7 | 14.5 |
| Dig2011 | Gelatin, Latex, Play-Doh | Silicone, Wood Glue | - | 19.7 | 9.1 | 8.0 | 8.0 | 4.3 | 4.2 | 3.2 |
| Ita2011 | EcoFlex, Gelatine, Latex | Silgum, Wood Glue, Other | 22.1 | 27.7 | 7.6 | 33.1 | 7.4 | 26.5 | 6.3 | 5.5 |
| Sag2011 | Gelatin, Latex, Play-Doh | Silicone, Wood Glue | - | 19.0 | 20.0 | 0.1 | 15.5 | 0.1 | 0.1 | 2.0 |
| Bio2013 | Modalsil, Wood Glue | EcoFlex, Gelatine, Latex | 4.9 | 23.7 | 8.8 | 0.1 | 8.5 | 0.1 | 0.1 | 0.1 |
| Cro2013 | BodyDouble, Wood Glue | Play-Doh, Latex | - | 14.8 | 15.1 | 44.3 | 6.1 | 14.9 | 14.8 | 6.3 |
| Ita2013 | Modalsil, Wood Glue | EcoFlex, Gelatine, Latex | 6.3 | 20.2 | 1.8 | 38.4 | 5.4 | 21.0 | 6.5 | 5.8 |
| Swi2013 | BodyDouble, Wood Glue | Play-Doh, Latex | - | 17.1 | 3.0 | 2.9 | 2.3 | 2.2 | 1.1 | 1.1 |
| HiS2015 | EcoFlex, Gelatine, Latex, Wood Glue | Liquid Ecoflex, RTV | 5.64 | 17.8 | 1.2 | 25.6 | 1.3 | 15.2 | 15.2 | 1.8 |
| GreB2015 | EcoFlex, Gelatine, Latex, Wood Glue | Liquid Ecoflex, RTV | 4.6 | 23.5 | 6.2 | 24.9 | 5.3 | 22.2 | 5.6 | 5.8 |
| DigP2015 | EcoFlex, Gelatine, Latex, Wood Glue | Liquid Ecoflex, RTV | 6.28 | 28.7 | 9.6 | 12.4 | 10.9 | 12.0 | 6.5 | 6.5 |
| Cro2015 | EcoFlex, Body Double, Play-Doh | OOMOO, Gelatine | 1.9 | 5.8 | 0.1 | 39.1 | 0.1 | 6.0 | 0.1 | 0.1 |
Table 9.
The comparisons of the average classification error (ACE) of different algorithms in the LivDet 2011 dataset.
Table 9.
The comparisons of the average classification error (ACE) of different algorithms in the LivDet 2011 dataset.
| Algorithm Name | Average Classification Error Rate ACE in (%) | ||||
|---|---|---|---|---|---|
| Biometrika | Digital | Italdata | Sagem | Average | |
| Feature fusion | 11.0 | 2.6 | 4.7 | 0.1 | 4.6 |
| ULBP [26] | 10.68 | 46.09 | 13.7 | 14.35 | 21.21 |
| HIG-MC [27] | 4.3 | 39.96 | 10.6 | 32.41 | 21.92 |
| UniNap [28] | 4.7 | 31.2 | 3.5 | 14.07 | 13.37 |
| HIG-BP [27] | 3.9 | 34.13 | 8.3 | 14.44 | 15.19 |
| PHOG [29] | 3.87 | 9.92 | 6.7 | 9.05 | 7.24 |
| MSDCM [29] | 3.55 | 20.84 | 2.35 | 5.25 | 7.59 |
| Winner [28] | 4.7 | 31.2 | 3.5 | 14.07 | 13.37 |
Table 10.
The comparisons of the ACE of different algorithms in the LivDet 2013 dataset.
| Algorithm Name | Average Classification Error Rate ACE in (%) | ||||
|---|---|---|---|---|---|
| Biometrika | Crossmatch | Italdata | Swipe | Average | |
| Feature fusion | 0.1 | 6.0 | 5.1 | 2.7 | 3.48 |
| ULBP [26] | 10.68 | 46.09 | 13.7 | 14.35 | 21.21 |
| HIG-MC [27] | 4.3 | 39.96 | 10.6 | 32.41 | 21.92 |
| UniNap [28] | 4.7 | 31.2 | 3.5 | 14.07 | 13.37 |
| HIG-BP [27] | 3.9 | 34.13 | 8.3 | 14.44 | 15.19 |
| PHOG [29] | 3.87 | 9.92 | 6.7 | 9.05 | 7.24 |
| MSDCM [29] | 3.55 | 20.84 | 2.35 | 5.25 | 7.59 |
| Winner [28] | 4.7 | 31.2 | 3.5 | 14.07 | 13.37 |
Table 11.
The comparisons of the ACE of different algorithms in LivDet 2015 dataset.
| Algorithm Name | Average Classification Error Rate ACE in (%) | ||||
|---|---|---|---|---|---|
| CrossMatch | Digital_Persona | GreenBit | Hi_Scan | Average | |
| Feature fusion | 0.1 | 8.2 | 6.2 | 1.6 | 4.03 |
| ULBP [26] | 10.68 | 46.09 | 13.7 | 14.35 | 21.21 |
| HIG-MC [27] | 4.3 | 39.96 | 10.6 | 32.41 | 21.92 |
| UniNap [28] | 4.7 | 31.2 | 3.5 | 14.07 | 13.37 |
| HIG-BP [27] | 3.9 | 34.13 | 8.3 | 14.44 | 15.19 |
| PHOG [29] | 3.87 | 9.92 | 6.7 | 9.05 | 7.24 |
| MSDCM [29] | 3.55 | 20.84 | 2.35 | 5.25 | 7.59 |
| Winner [28] | 4.7 | 31.2 | 3.5 | 14.07 | 13.37 |
© 2020 by the authors. Licensee MDPI, Basel, Switzerland. This article is an open access article distributed under the terms and conditions of the Creative Commons Attribution (CC BY) license (http://creativecommons.org/licenses/by/4.0/).
Share and Cite
MDPI and ACS Style
Li, X.; Cheng, W.; Yuan, C.; Gu, W.; Yang, B.; Cui, Q. Fingerprint Liveness Detection Based on Fine-Grained Feature Fusion for Intelligent Devices. Mathematics 2020, 8, 517. https://0-doi-org.brum.beds.ac.uk/10.3390/math8040517
AMA Style
Li X, Cheng W, Yuan C, Gu W, Yang B, Cui Q. Fingerprint Liveness Detection Based on Fine-Grained Feature Fusion for Intelligent Devices. Mathematics. 2020; 8(4):517. https://0-doi-org.brum.beds.ac.uk/10.3390/math8040517
Chicago/Turabian StyleLi, Xinting, Weijin Cheng, Chengsheng Yuan, Wei Gu, Baochen Yang, and Qi Cui. 2020. "Fingerprint Liveness Detection Based on Fine-Grained Feature Fusion for Intelligent Devices" Mathematics 8, no. 4: 517. https://0-doi-org.brum.beds.ac.uk/10.3390/math8040517
Note that from the first issue of 2016, this journal uses article numbers instead of page numbers. See further details here.