Modeling an Uncertain Productivity Learning Process Using an Interval Fuzzy Methodology


1
Department of Industrial Engineering and Management, National Chin-Yi University of Technology, 57, Sec. 2, Zhongshan Rd., Taiping, Taichung City 411, Taiwan
2
Department of Industrial Engineering and Management, National Chiao Tung University, 1001, University Road, Hsinchu 300, Taiwan
*
Author to whom correspondence should be addressed.
Mathematics 2020, 8(6), 998; https://0-doi-org.brum.beds.ac.uk/10.3390/math8060998
Submission received: 20 May 2020
/
Revised: 15 June 2020
/
Accepted: 16 June 2020
/
Published: 18 June 2020
(This article belongs to the Special Issue Applications of Fuzzy Optimization and Fuzzy Decision Making)
Abstract
:Existing methods for forecasting the productivity of a factory are subject to a major drawback—the lower and upper bounds of productivity are usually determined by a few extreme cases, which unacceptably widens the productivity range. To address this drawback, an interval fuzzy number (IFN)-based mixed binary quadratic programming (MBQP)–ordered weighted average (OWA) approach is proposed in this study for modeling an uncertain productivity learning process. In the proposed methodology, the productivity range is divided into the inner and outer sections, which correspond to the lower and upper membership functions of an IFN-based fuzzy productivity forecast, respectively. In this manner, all actual values are included in the outer section, whereas most of the values are included within the inner section to fulfill different managerial purposes. According to the percentages of outlier cases, a suitable forecasting strategy can be selected. To derive the values of parameters in the IFN-based fuzzy productivity learning model, an MBQP model is proposed and optimized. Subsequently, according to the selected forecasting strategy, the OWA method is applied to defuzzify a fuzzy productivity forecast. The proposed methodology has been applied to the real case of a dynamic random access memory factory to evaluate its effectiveness. The experimental results indicate that the proposed methodology was superior to several existing methods, especially in terms of mean absolute error, mean absolute percentage error, and root mean square error in evaluating the forecasting accuracy. The forecasting precision achieved using the proposed methodology was also satisfactory.
1. Introduction
Productivity is a measure of how efficient a system is in converting inputs into outputs and is usually measured by dividing the quantity or value of outputs by that of inputs [1,2,3]. Productivity can be measured at different levels, such as for a factory (or store), city, or even country [4]. This study focuses on the productivity of a factory. In a factory, productivity increases with time because of operators becoming more familiar with their tasks, equipment engineers becoming skilled in maintaining and repairing machines, product engineers becoming more experienced in solving product quality problems, and other reasons [5].
Factories are adopting an increasing number of information technologies (ITs) that include software, hardware, and artificial intelligence [6,7]. For example, factories rely on transaction processing systems (TPSs) to automate routine operations, which obviously elevates productivity [8,9,10,11]. Consequently, human workers are now trained to be familiar with MISs rather than with routine operations. The emergence of Industry 4.0 has created opportunities for further enhancing productivity. For example, when wireless sensors are incorporated in a machine, the sensors can detect abnormal operating conditions before a serious shutdown that results in the loss of productivity, thereby enabling predictive maintenance [12]. Although some researchers have asserted that artificial intelligence will eventually replace human workers for performing many tasks, the applications of artificial intelligence do not necessarily enhance productivity due to reasons such as false hopes, mismeasurement, redistribution, and implementation lags [13]. Nevertheless, productivity improves as users learn to master IT. Although productivity improves by conducting activities involving substantial human intervention, productivity is subject to considerable uncertainty [14,15]. To address this problem, fuzzy logic [16] has been extensively applied to model productivity. For example, in a study by Hougaard [17], the inputs and outputs of a production plan were given in or estimated with fuzzy numbers. After enumerating all possible values of fuzzy inputs and outputs, the α cuts of fuzzy productivity were derived. Finally, a triangular fuzzy number was used to approximate fuzzy productivity. Similarly, Emrouznejad et al. [18] modeled inputs, outputs, and prices through fuzzy numbers. The α cuts of fuzzy parameters were fed as interval data into a data envelopment analysis model to calculate the overall profit Malmquist productivity index. Wang and Chen [19] proposed a fuzzy collaborative forecasting approach for forecasting the productivity of a factory. In the fuzzy collaborative forecasting approach, multiple experts fitted a fuzzy productivity learning process with quadratic or nonlinear programming models to forecast productivity. The fuzzy productivity forecasts by experts were aggregated using fuzzy intersection. Then, the aggregation result was defuzzified using a back propagation network. In a study by Chen and Wang [20], fuzzy productivity forecasts were compared with a competitive region to assess the productivity competitiveness of a factory. Recently, Chen et al. [21] proposed a heterogeneous fuzzy collaborative forecasting approach in which experts constructed either mathematical programming models or artificial neural networks to forecast productivity. The adoption of different fuzzy forecasting methods contributed to the diversification of fuzzy productivity forecasts, which was considered a favorable property for a multiple-expert forecasting problem.
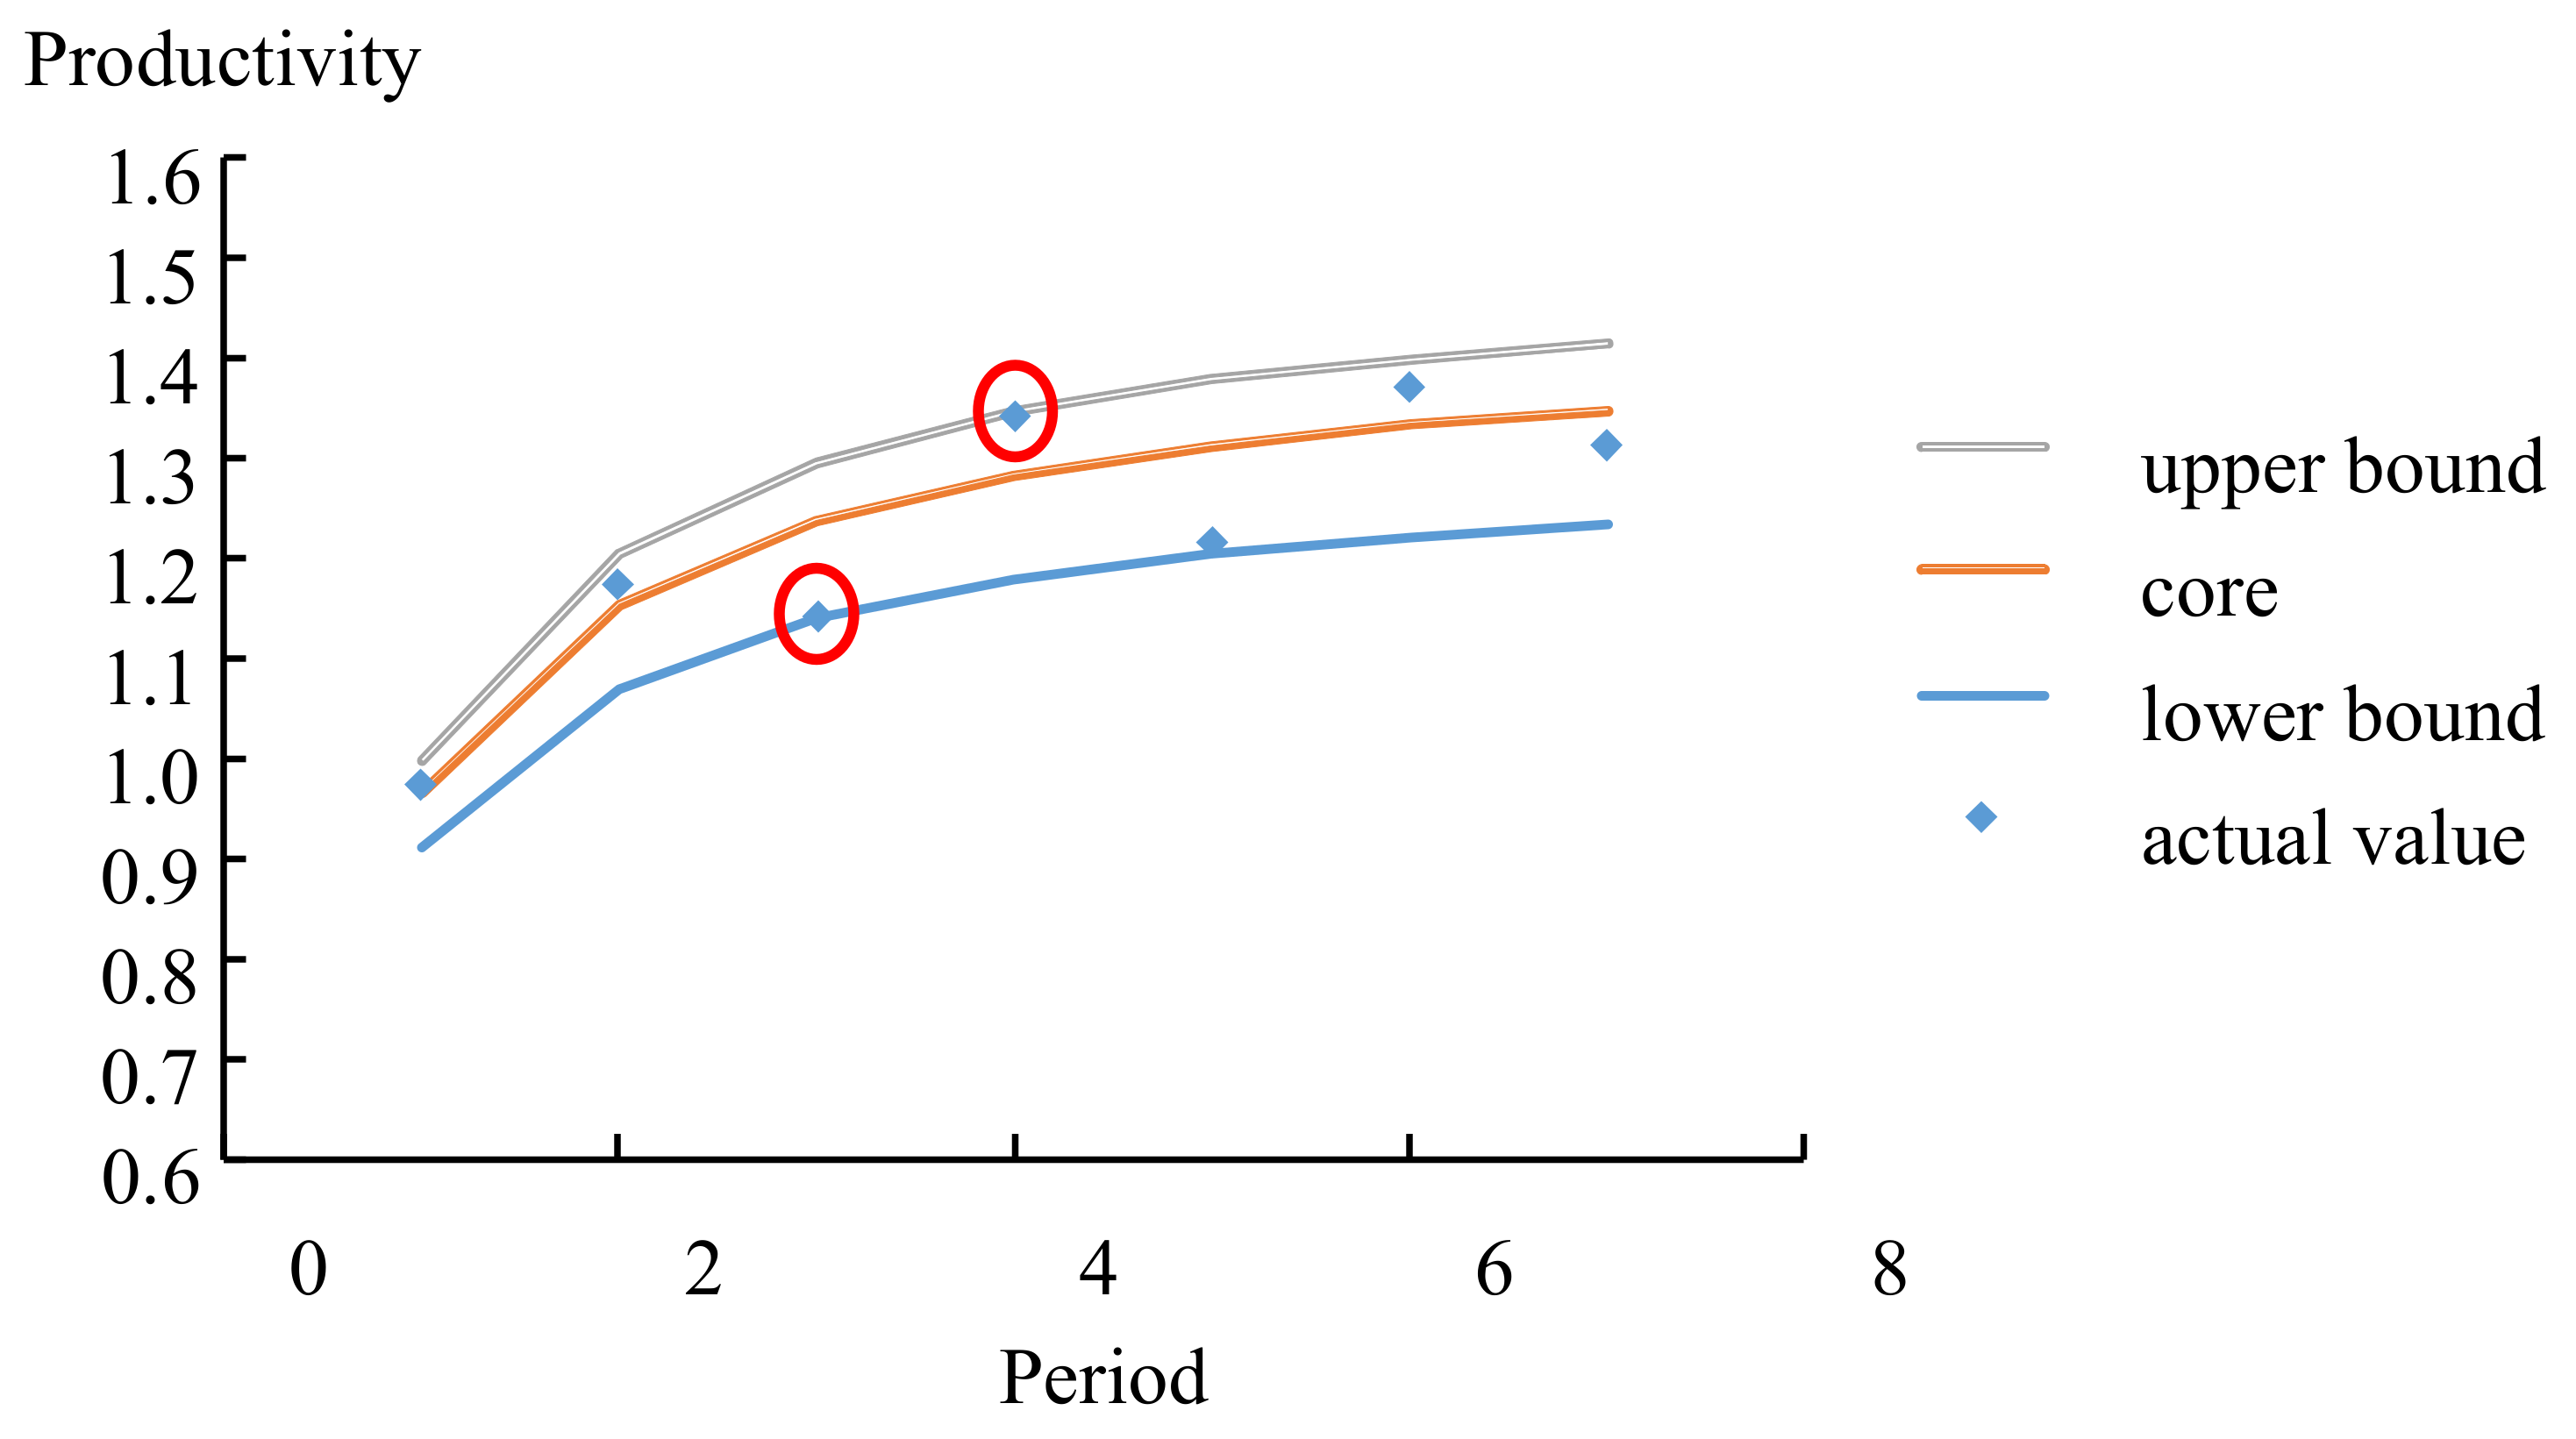
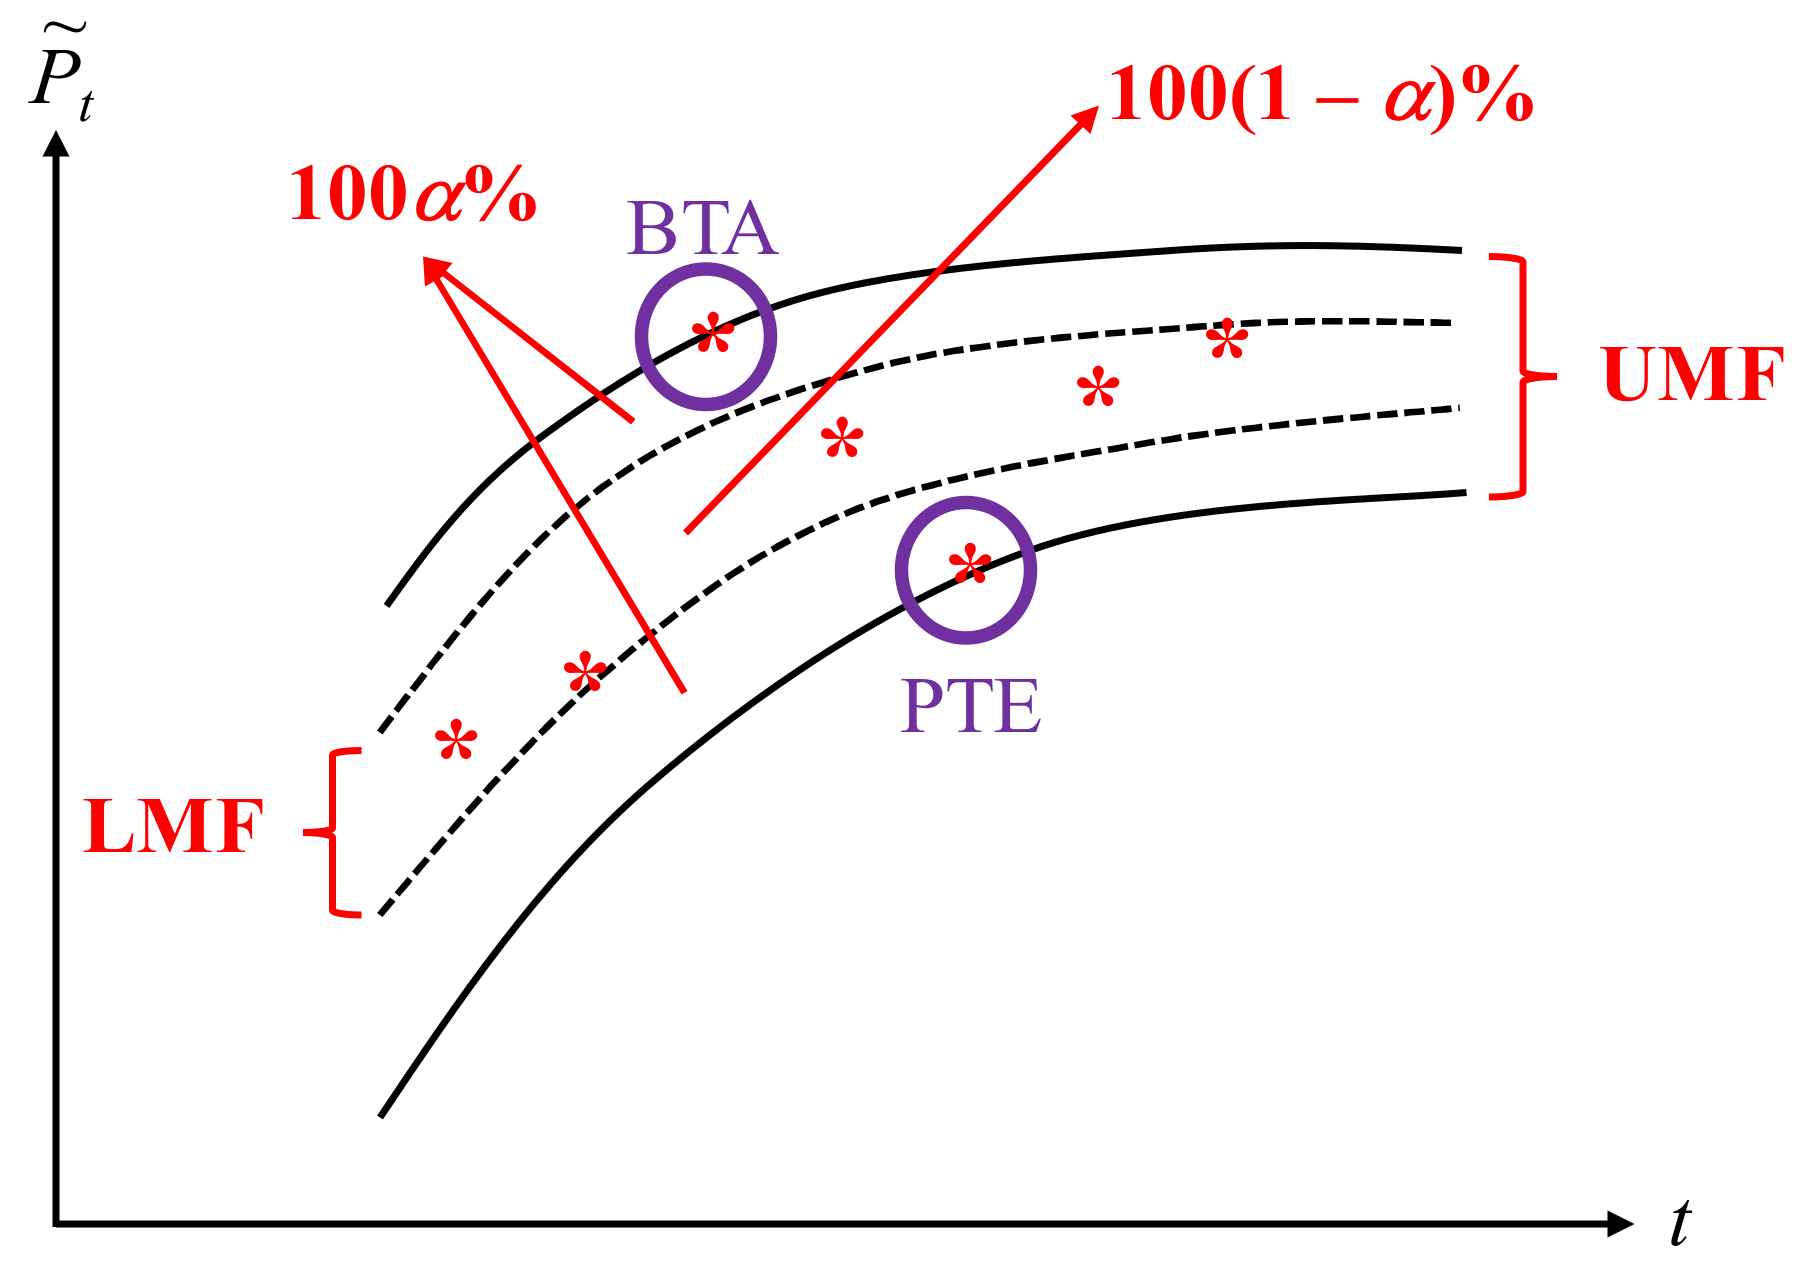
However, a problem associated with existing methods is that the lower and upper bounds on a fuzzy productivity forecast are usually determined by a few extreme cases [20]. Moreover, other cases may lie considerably close to cores (or centers), which unreasonably widens the range of a fuzzy productivity forecast, as illustrated in Figure 1, in which red circles represent extreme cases. There exist two types of extreme cases, namely better-than-anticipated (BTA) and poorer-than-expected (PTE) cases.
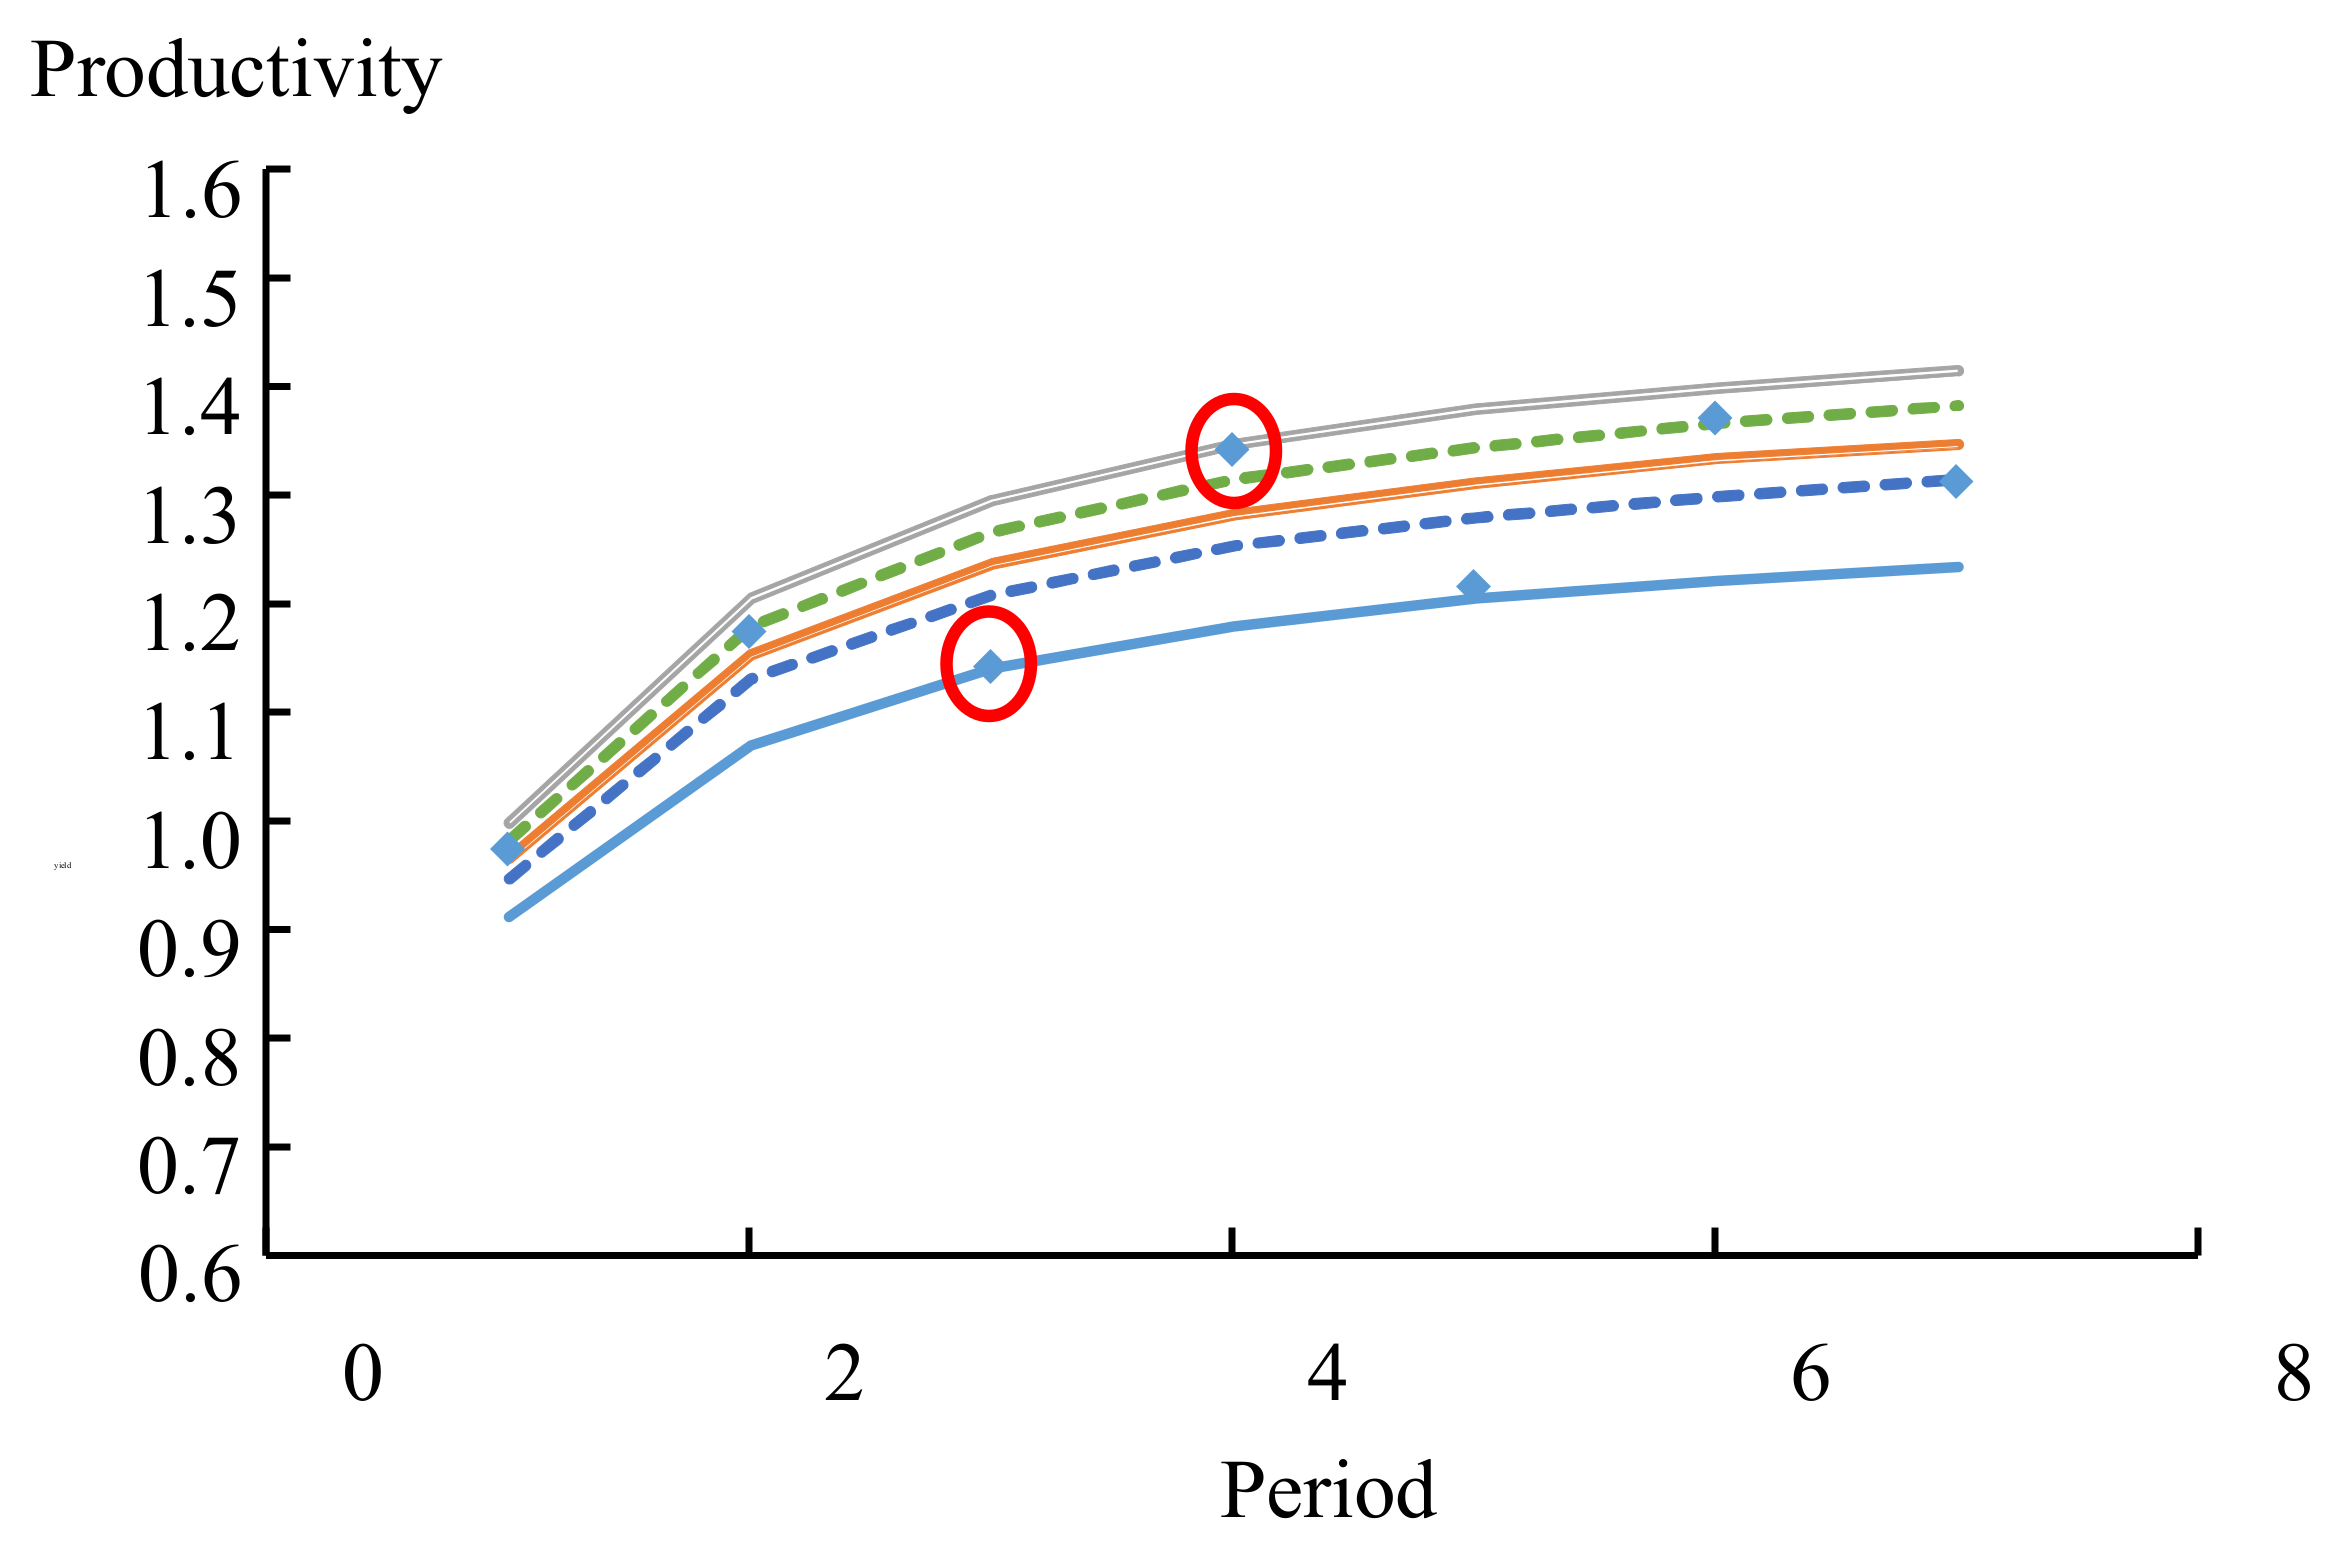
Therefore, a desirable option is to form a narrow interval that contains most of the collected data by excluding extreme cases, as illustrated in Figure 2. To this end, an interval fuzzy number (IFN) [22,23,24] is a viable option. There exist two membership functions in an IFN, one of which is suitable for modeling the inner part of a fuzzy productivity forecast, whereas the other is suitable for modeling the outer part.
Due to the aforementioned reasons, an IFN-based mixed binary quadratic programming (MBQP)–ordered weighted average (OWA) approach is proposed in this study for modeling an uncertain productivity learning process by distinguishing between BTA and PTE cases. The motives for this study are explained as follows:
- (1)
- Owing to the existence of extreme cases, fuzzy productivity forecasts generated using an existing fuzzy forecasting method are not sufficiently precise.
- (2)
- Fuzzy productivity forecasts generated using existing fuzzy forecasting methods are usually type-1 fuzzy numbers [2,15,19]. Compared with type-1 fuzzy numbers, IFNs can better consider uncertainty [25,26]. However, fuzzy forecasting methods that generate IFN-based fuzzy productivity forecasts are not widely used.
- (3)
- A special defuzzifier needs to be proposed for an IFN-based fuzzy productivity forecast that separates extreme cases from normal cases.
To the best of our knowledge, the present study is the first attempt of its kind. The parameters of the IFN-based fuzzy productivity learning model are given in the form of IFNs. Consequently, fuzzy productivity forecasts generated by the IFN-based fuzzy productivity learning model are also in the form of IFNs. In the proposed methodology, the range of productivity is divided into the inner and outer sections that correspond to the lower and upper membership functions of an IFN-based fuzzy productivity forecast, respectively. In this manner, all actual values are included in the outer section, whereas most of the values lie within the inner section. Moreover, the ratio of the number of PTE cases to the number of BTA cases is a useful factor for selecting a suitable forecasting strategy. To derive the values of parameters in the IFN-based fuzzy productivity learning model, an MBQP model is proposed and optimized. Finally, according to the selected forecasting strategy, the OWA method [27] was applied to defuzzify a fuzzy productivity forecast.
The remainder of this paper is organized as follows. First, some arithmetic operations on IFNs are introduced in Section 2. The proposed methodology is detailed in Section 3. To illustrate the applicability of the proposed methodology, a real case is discussed in Section 4. The performance of the proposed methodology is also compared with those of several existing methods. Finally, the conclusions of this study and some directions for future research are provided in Section 5.
2. Preliminary
IFNs have been extensively applied in multiple-criteria decision-making problems. For example, Hu et al. [28] considered a multiple-criteria decision-making problem in which criteria took the values of IFNs. Moreover, some of the weights assigned to criteria were unknown. To address this problem, an expected value function was optimized through a maximizing deviation method. However, in existing studies on IFN applications, the motives for adopting IFNs are not clear or strong. By contrast, in this study, the motive for adopting an IFN to represent a fuzzy productivity forecast is clear.
This section introduces some arithmetic operations on IFNs. First, the definition of an IFN is given as follows [29]:
Definition 1.
An IFN is a subset of real numbers R and is defined as the set of ordered pairs
= {(x, )| x
∈ R}, where : R → [0, 1] is the interval-valued membership function of .
If is Moore-continuous, then there exist two membership functions for , namely the lower membership function (LMF) and the upper membership function (UMF) , such that . An IFN is a special case of type-II fuzzy sets [30].
Some attributes of an IFN are defined as follows:
Definition 2.
The inner support, outer support, and core of an IFN of R are defined, respectively, as follows:
Definition 3.
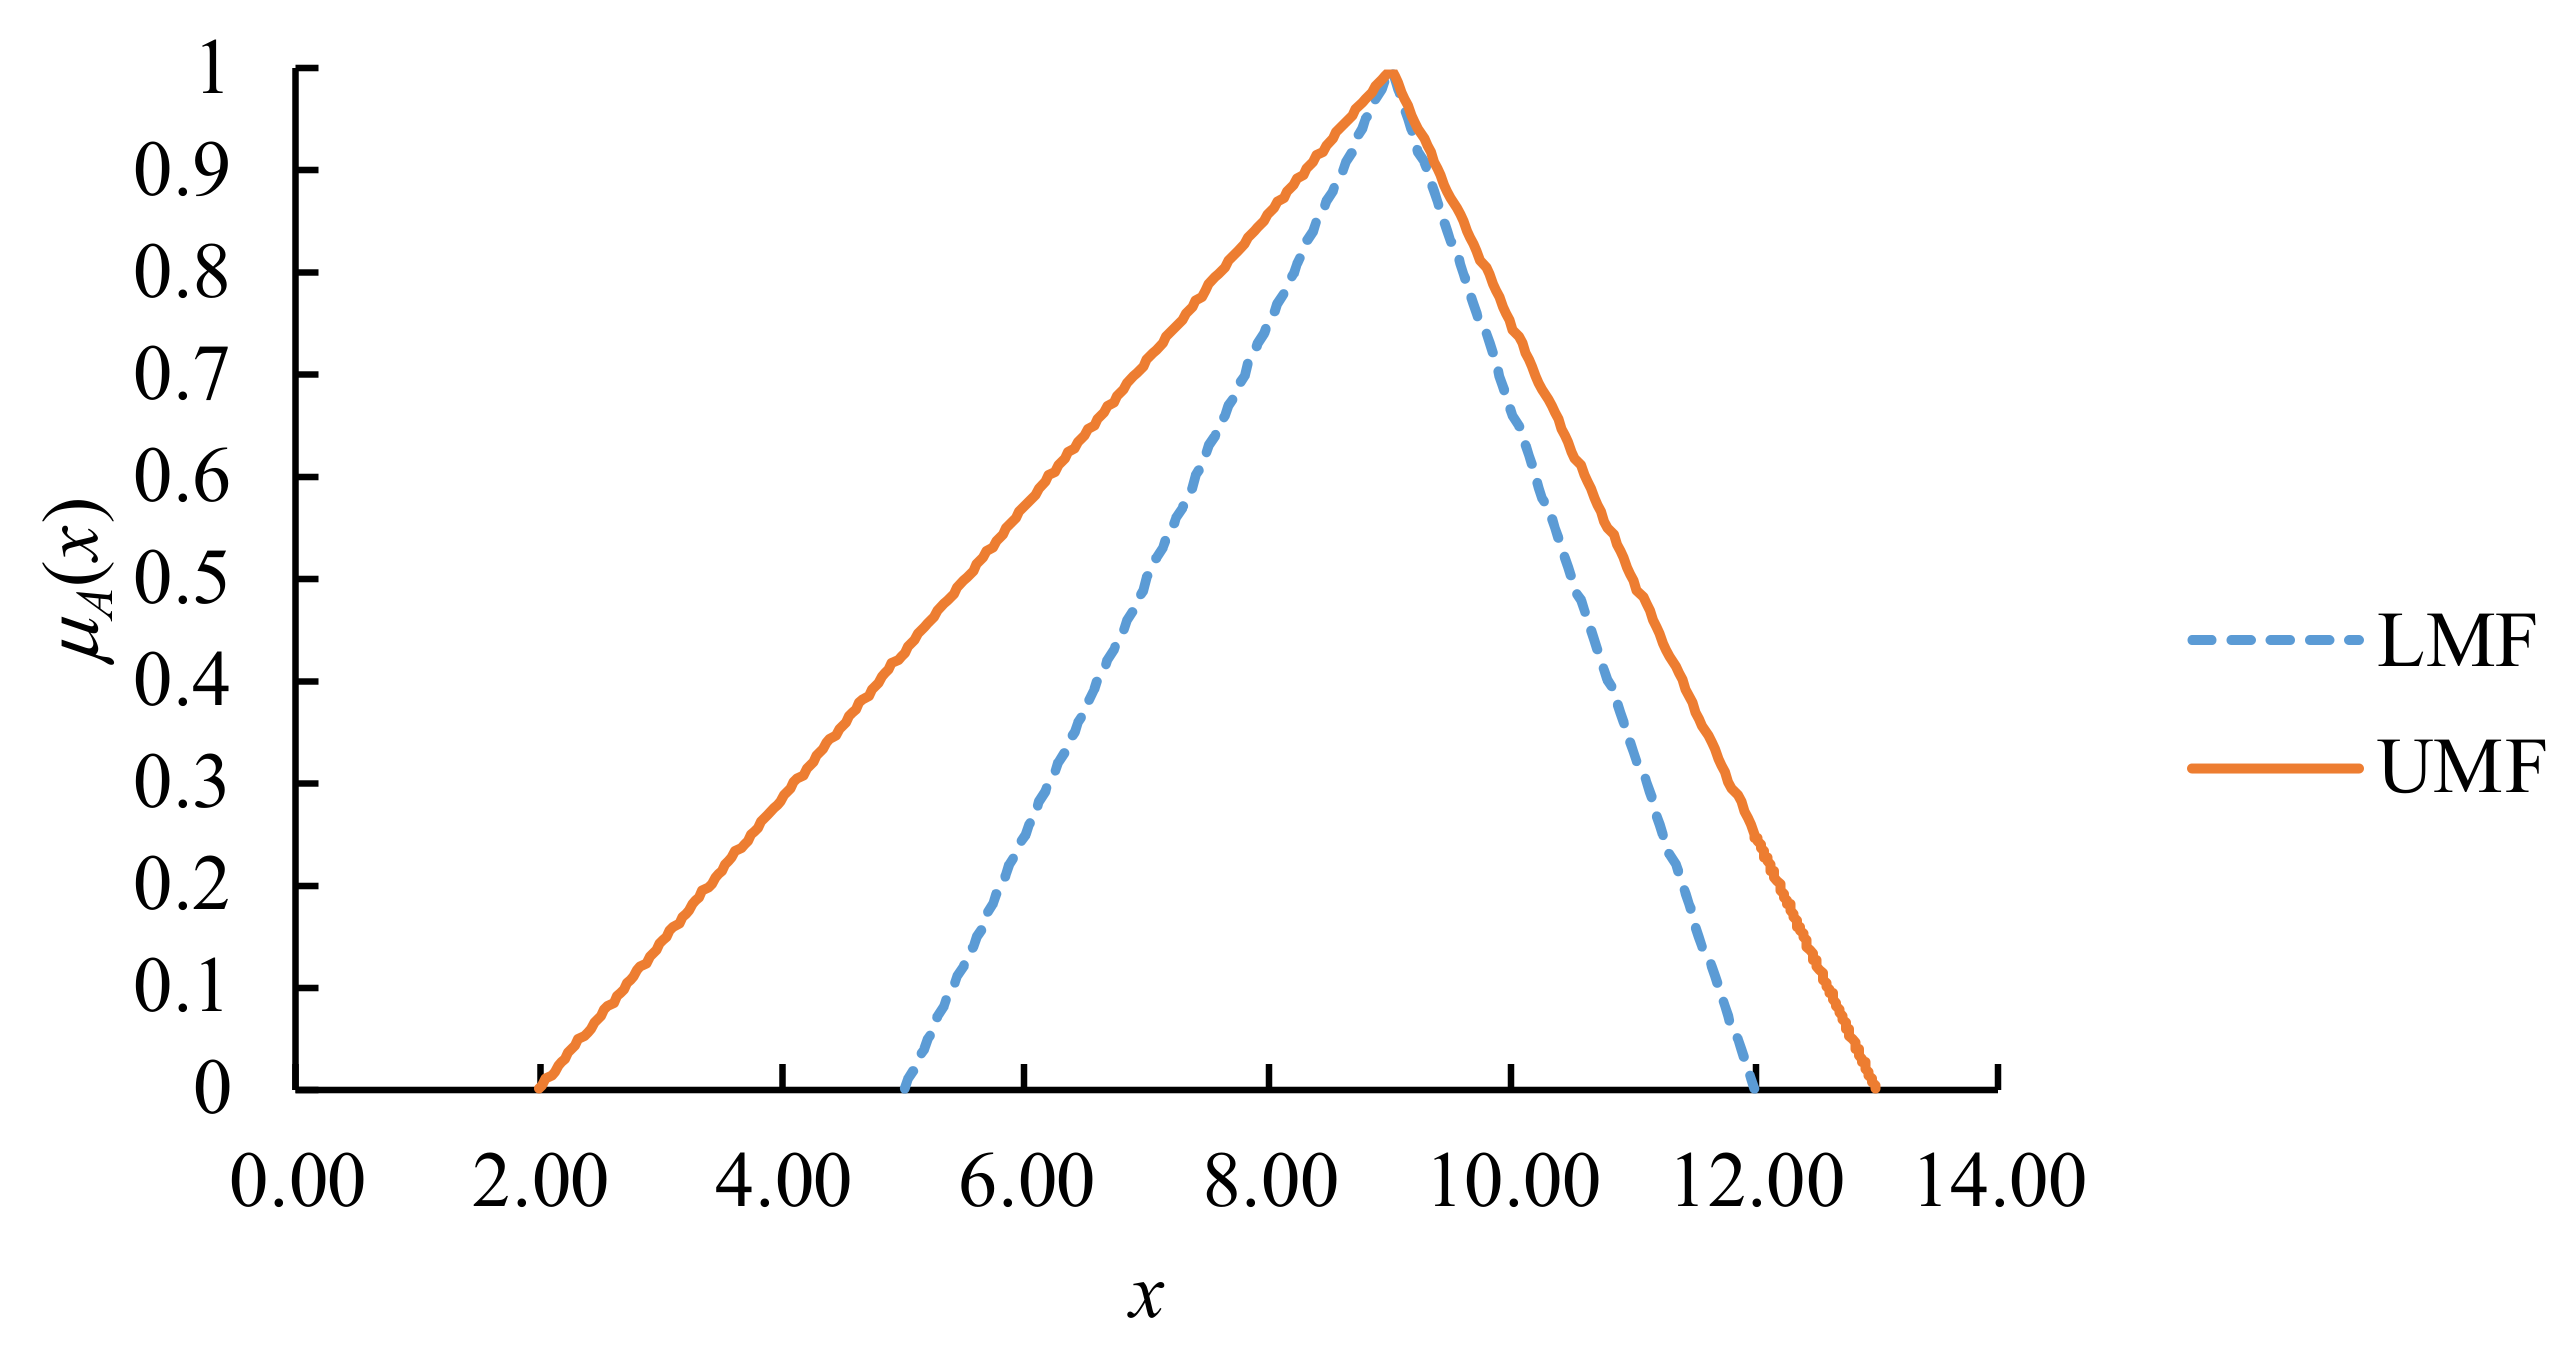
An IFNis an interval triangular fuzzy number (ITFN) if both the LMF and UMF ofare triangular functions,
can be briefly denoted by ((), ()) or ().
An ITFN is shown in Figure 3, in which = ((5, 9, 12), (2, 8, 13)) or (2, 5, 9, 12, 13).
Property 1.
The inner support, outer support, and core of an ITFNcan be derived as follows:
Theorem 1.
(Arithmetic Operations on ITFNs)
- (1)
- Fuzzy addition:.
- (2)
- Fuzzy subtraction:.
- (3)
- Fuzzy product (or multiplication):whenever.
- (4)
- Fuzzy division:whenever.
- (5)
- Exponential function:.
- (6)
- Logarithmic function:whenever.
3. Proposed Methodology
The proposed methodology comprises the following steps. First, the collected productivity data are analyzed to make sure that a productivity learning process exists. Subsequently, all parameters in the productivity learning model are fuzzified as IFNs to consider uncertainty. To derive the values of IFN-based fuzzy parameters, an MBQP model is proposed and optimized. Finally, the OWA method is applied to defuzzify an IFN-based fuzzy productivity forecast. IFNs, rather than general type-2 fuzzy numbers, are adopted in the proposed methodology because the mathematics needed for IFNs, primarily interval arithmetic, is much simpler than that needed for general type-2 fuzzy numbers [34].
3.1. Data Preanalysis
In a factory, many performance measures exhibit learning phenomena [35,36,37]. However, the fuzzy learning model of productivity is different from that of other performance measures, such as yield or unit cost, because the asymptotic or final value of productivity is unbounded, whereas that of yield or unit cost is bounded.
Productivity → ∞; yield → 100%; the unit cost → 0
Therefore, before applying the proposed methodology, it should be ensured that the collected productivity data follow a learning process:
where is the productivity forecast at time period t (t = 1 – T); P0 is the asymptotic or final productivity; b > 0 is the learning constant; and r(t) is a homoscedastical and serially uncorrelated error term that is often ignored. Taking the logarithmic values of both sides gives the following Equation:
A linear regression model is presented in the aforementioned Equation, whose validity can be measured in terms of the coefficient of determination R2, which is given as follows:
where
is expected to approach a value of 1 if the collected productivity data follow a learning process.
3.2. IFN-Based Fuzzy Productivity Learning Model
The IFN-based fuzzy productivity learning model is proposed by defining the parameters in (8) with ITFNs.
where
Because t ≠ 0, according to the formula of fuzzy division, dividing by −t gives the following Equation:
By taking the exponential of (19), we obtain the following Equation:
can be derived by multiplying to both sides of (20) by using the formula of fuzzy multiplication:
3.3. MBQP Model for Deriving the Values of Fuzzy Parameters
Mathematical programming models involving type-2 or other types of fuzzy numbers have been extensively applied in the literature [38,39,40]. By taking the logarithm of (15), we obtain the following Equation:
The following MBQP model is optimized to derive the values of fuzzy parameters.
Model MBQP:
subject to
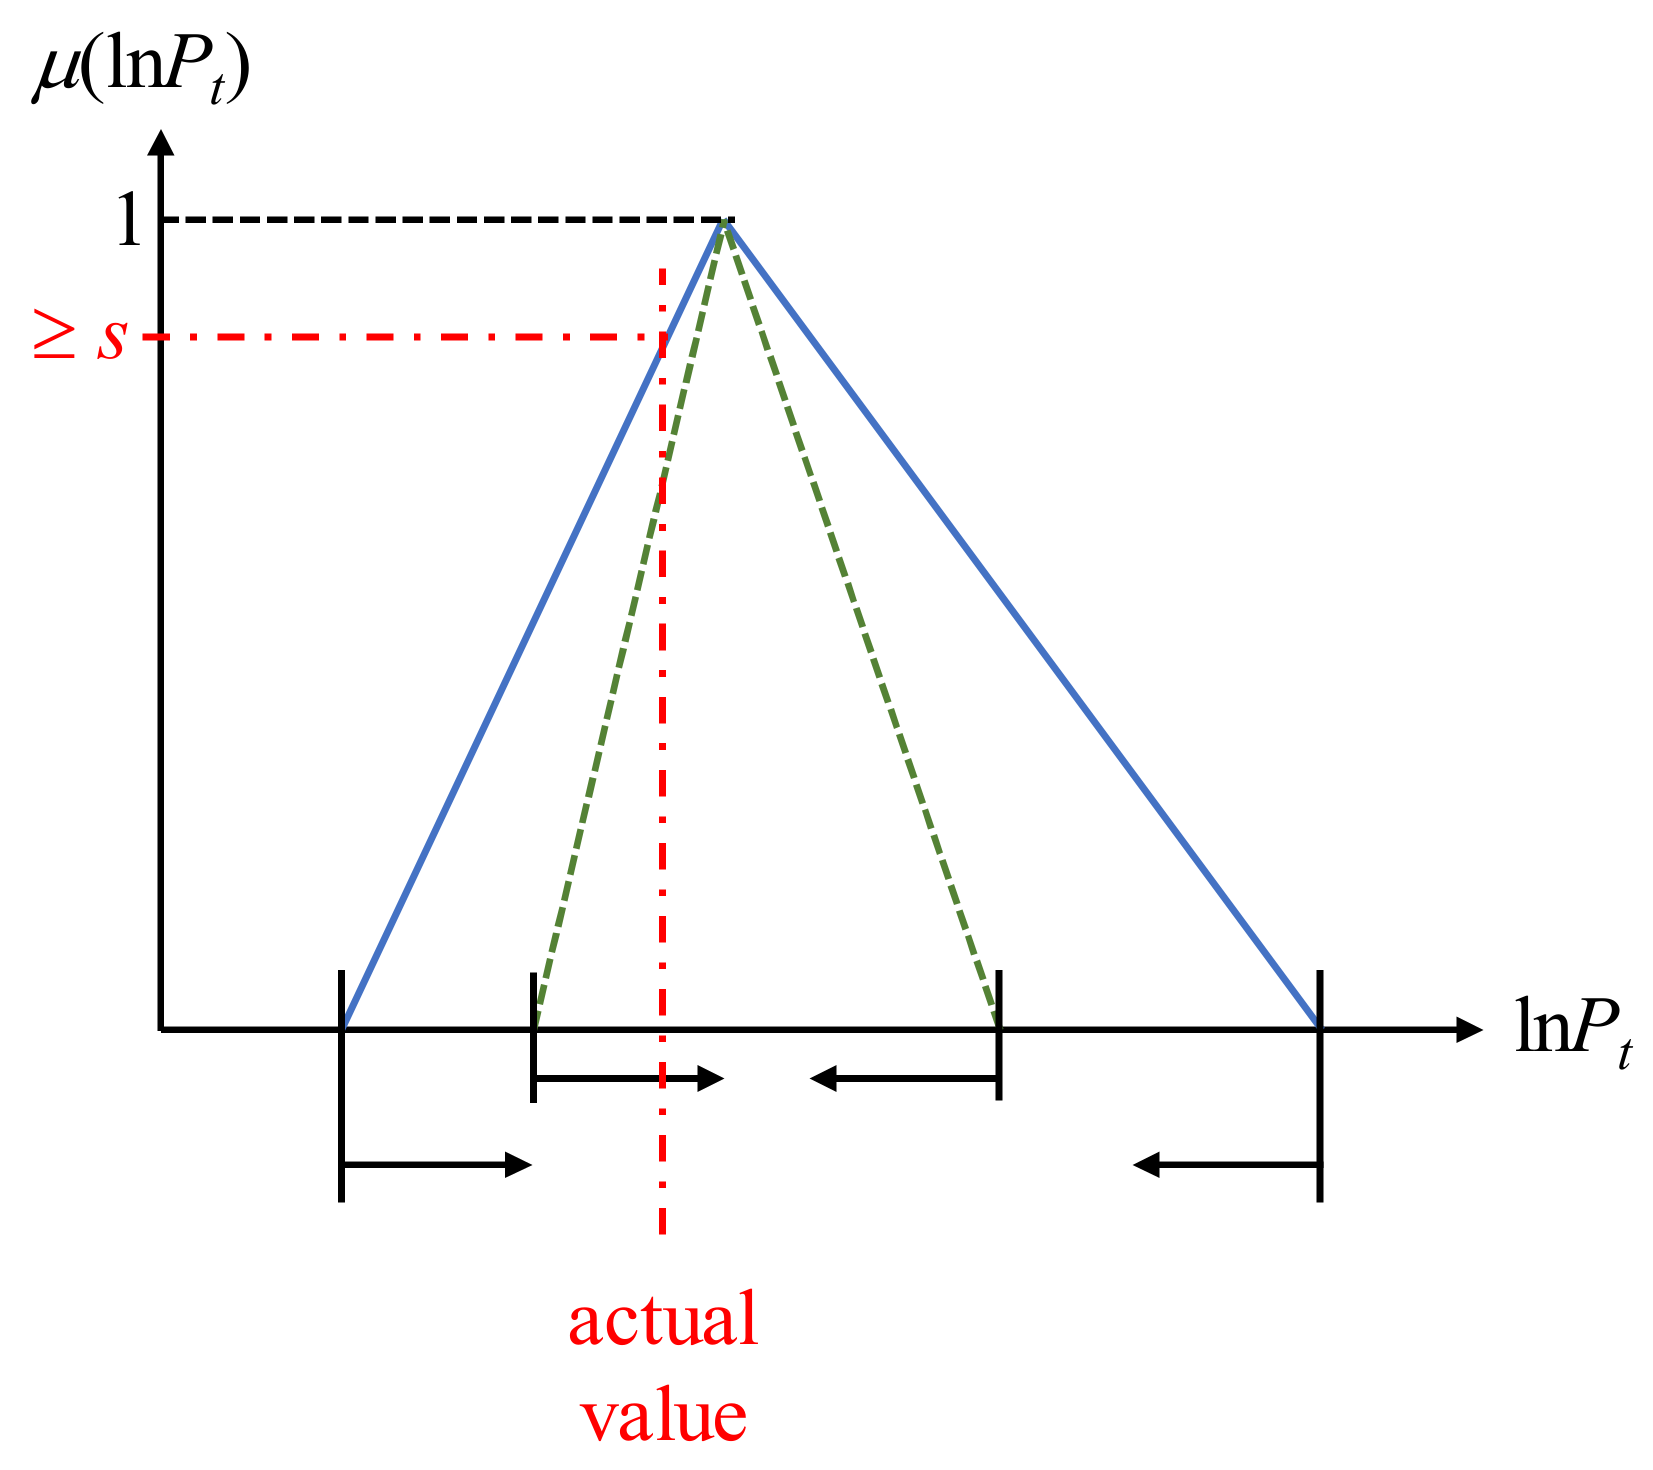
The objective function minimizes the sum of the widths of fuzzy productivity forecasts by considering both LMF and UMF, thereby narrowing both the ranges of LMF and UMF (Figure 4) to maximize the forecasting precision [41]. Constraints (24) and (25) suggest that the membership of an actual value in the corresponding fuzzy forecast should be higher than the satisfaction level (s) based on UMF. and are binary variables, as defined in (29). When both and are equal to 1, an actual value lies within the range of LMF, as suggested by Constraints (27) and (28). Otherwise, the actual value lies outside the LMF range. In this manner, the inclusion level [42] is higher than 100(1 − α)% (Figure 5), as required by Constraint (26). Constraints (26)–(29) are quadratic constraints or can be converted into quadratic constraints. Constraints (30) and (31) define the sequences of endpoints in the ITFNs. The MBQP model has one linear objective function, 2T + 6 variables, 4T + 9 linear constraints, and 2T + 1 quadratic constraints.
By moving variables independent of t out of the summation function, the objective function changes as follows:
Let
Then,
Note that (33) is a divergent harmonic series [43].
3.4. OWA for Defuzzifying a Fuzzy Productivity Forecast
In the literature, various formulas have been proposed to defuzzify an ITFN. For example, according to Dahooie et al. [44], an ITFN can be defuzzified as follows:
which is an extension of the center-of-gravity (COG) formula or
Lee et al. [31] proposed the following formula:
However, existing defuzzification formulas consider PTE and BTA cases likely, which is questionable because they have distinct meanings in practice.
Definition 4.
A PTE case is a case that lies outside the LMF on the left-hand side, that is, .
Definition 5.
A BTA case is a case that lies outside the LMF on the right-hand side, that is, .
To address the aforementioned problem, the concept of OWA is applied in the proposed methodology. The rationale for applying OWA to defuzzify an IFN-based fuzzy productivity forecast is explained as follows:
- (1)
- Using existing defuzzification methods, the defuzzification result of an IFN-based fuzzy productivity forecast is usually the weighted sum of its endpoints. OWA also calculates the weighted sum of data.
- (2)
- OWA aggregates data that have been sorted. The endpoints of an IFN-based fuzzy productivity forecast, from the leftmost to the rightmost, also form a sorted series.
There exist five decision strategies in OWA that assign unequal weights to different attributes according to their performances. The five strategies are optimistic, moderately optimistic, neutral, moderately pessimistic, and pessimistic strategies [44,45]. Most formulas for defuzzifying an ITFN also assign weights to its endpoints. Therefore, assigning weights to the endpoints of according to their possibilities is reasonable. In the training data, if the number of PTE cases is considerably higher than that of BTA cases, then the “pessimistic” strategy appears to be suitable. By contrast, if the number of BTA cases is considerably higher than that of PTE cases, then the “pessimistic” strategy can be selected. On the basis of these beliefs, a fuzzy productivity forecast is defuzzified according to the selected forecasting strategy, as presented in Table 1. These strategies are subjective selections based on objective historical statistics [46].
Property 2.
The “neutral” forecasting strategy is equivalent to the COG defuzzification method.
4. Application of the Proposed Methodology to a Real Case
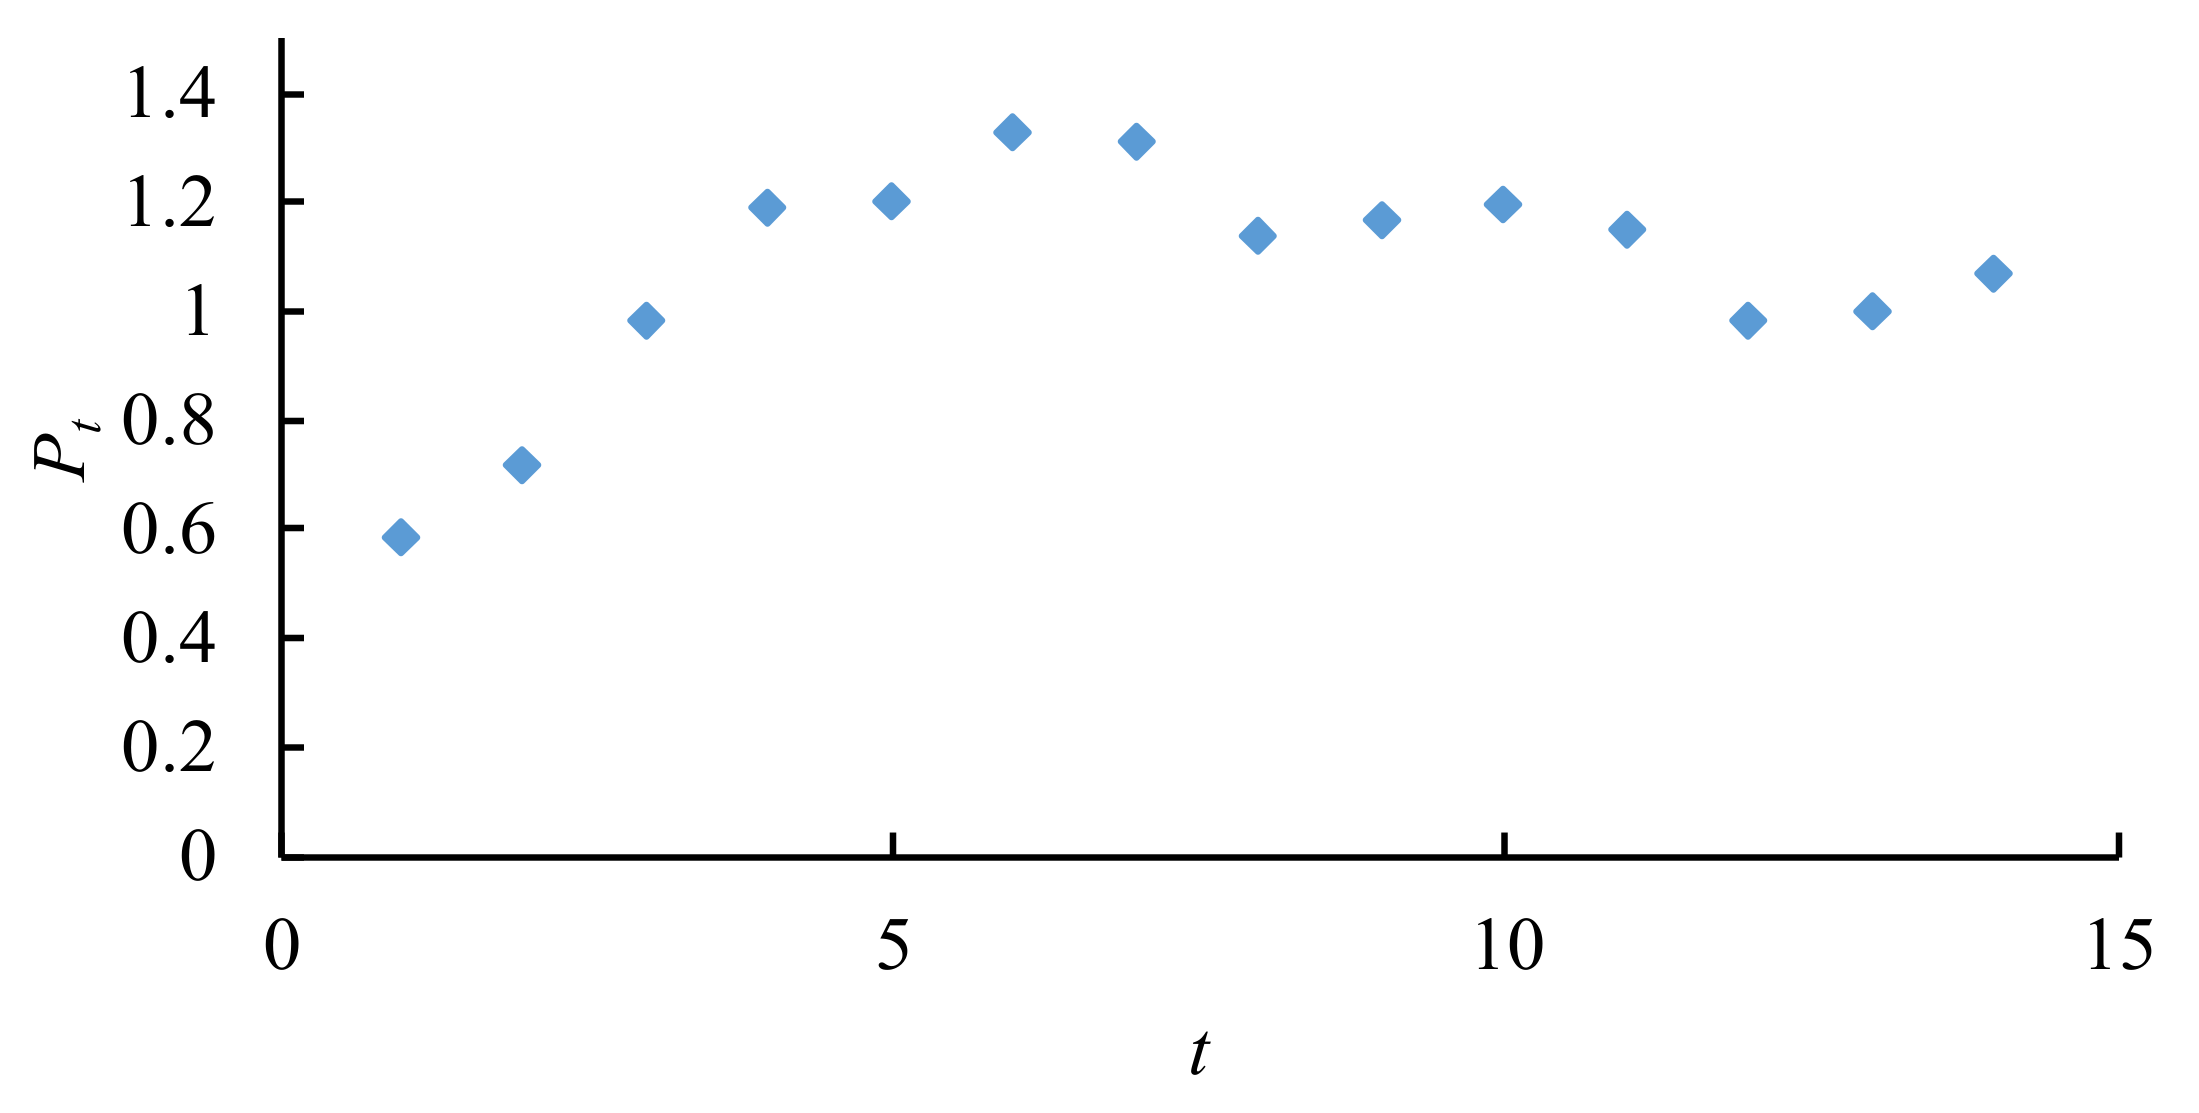
The effectiveness of the proposed methodology was evaluated by applying it for forecasting the productivity of a real dynamic random access memory (DRAM) factory. This case was first investigated by Wang and Chen [19]. In this case, the multi-item productivity of the DRAM factory, which was derived by dividing the monetary value of outputs by that of inputs, was recorded for 14 periods. The recorded data are displayed in Figure 6. Wang and Chen [19] proposed a fuzzy collaborative forecasting approach to forecast the future productivity. For the same purpose, Chen et al. [21] proposed a fuzzy polynomial fitting and mathematical programming approach. The differences between the two approaches and the proposed methodology are summarized in Table 2. The most obvious difference is that only the proposed methodology forecasts productivity with an IFN, thereby differentiating between extreme cases and normal cases to construct a narrow interval of productivity.
The productivity data were divided into two parts, the training data (including the data of the first 10 periods) and test data (including the remaining data). First, to ensure that the collected data followed a learning process, the coefficient of determination (R2) was calculated. R2 was found to be 0.87, which was sufficiently high to ensure that the collected data followed a learning process. Subsequently, the training data were used to build the MBQP model, which was solved using a branch-and-bound algorithm [47,48,49,50] on a personal computer with Intel core i7-7700 CPU @ 3.60 GHz and 8 GB RAM in 10 s. Moreover, α was set to 0.2 so that an 80% inclusion interval was constructed. The satisfaction level s was set to 0.3. The optimal solution was
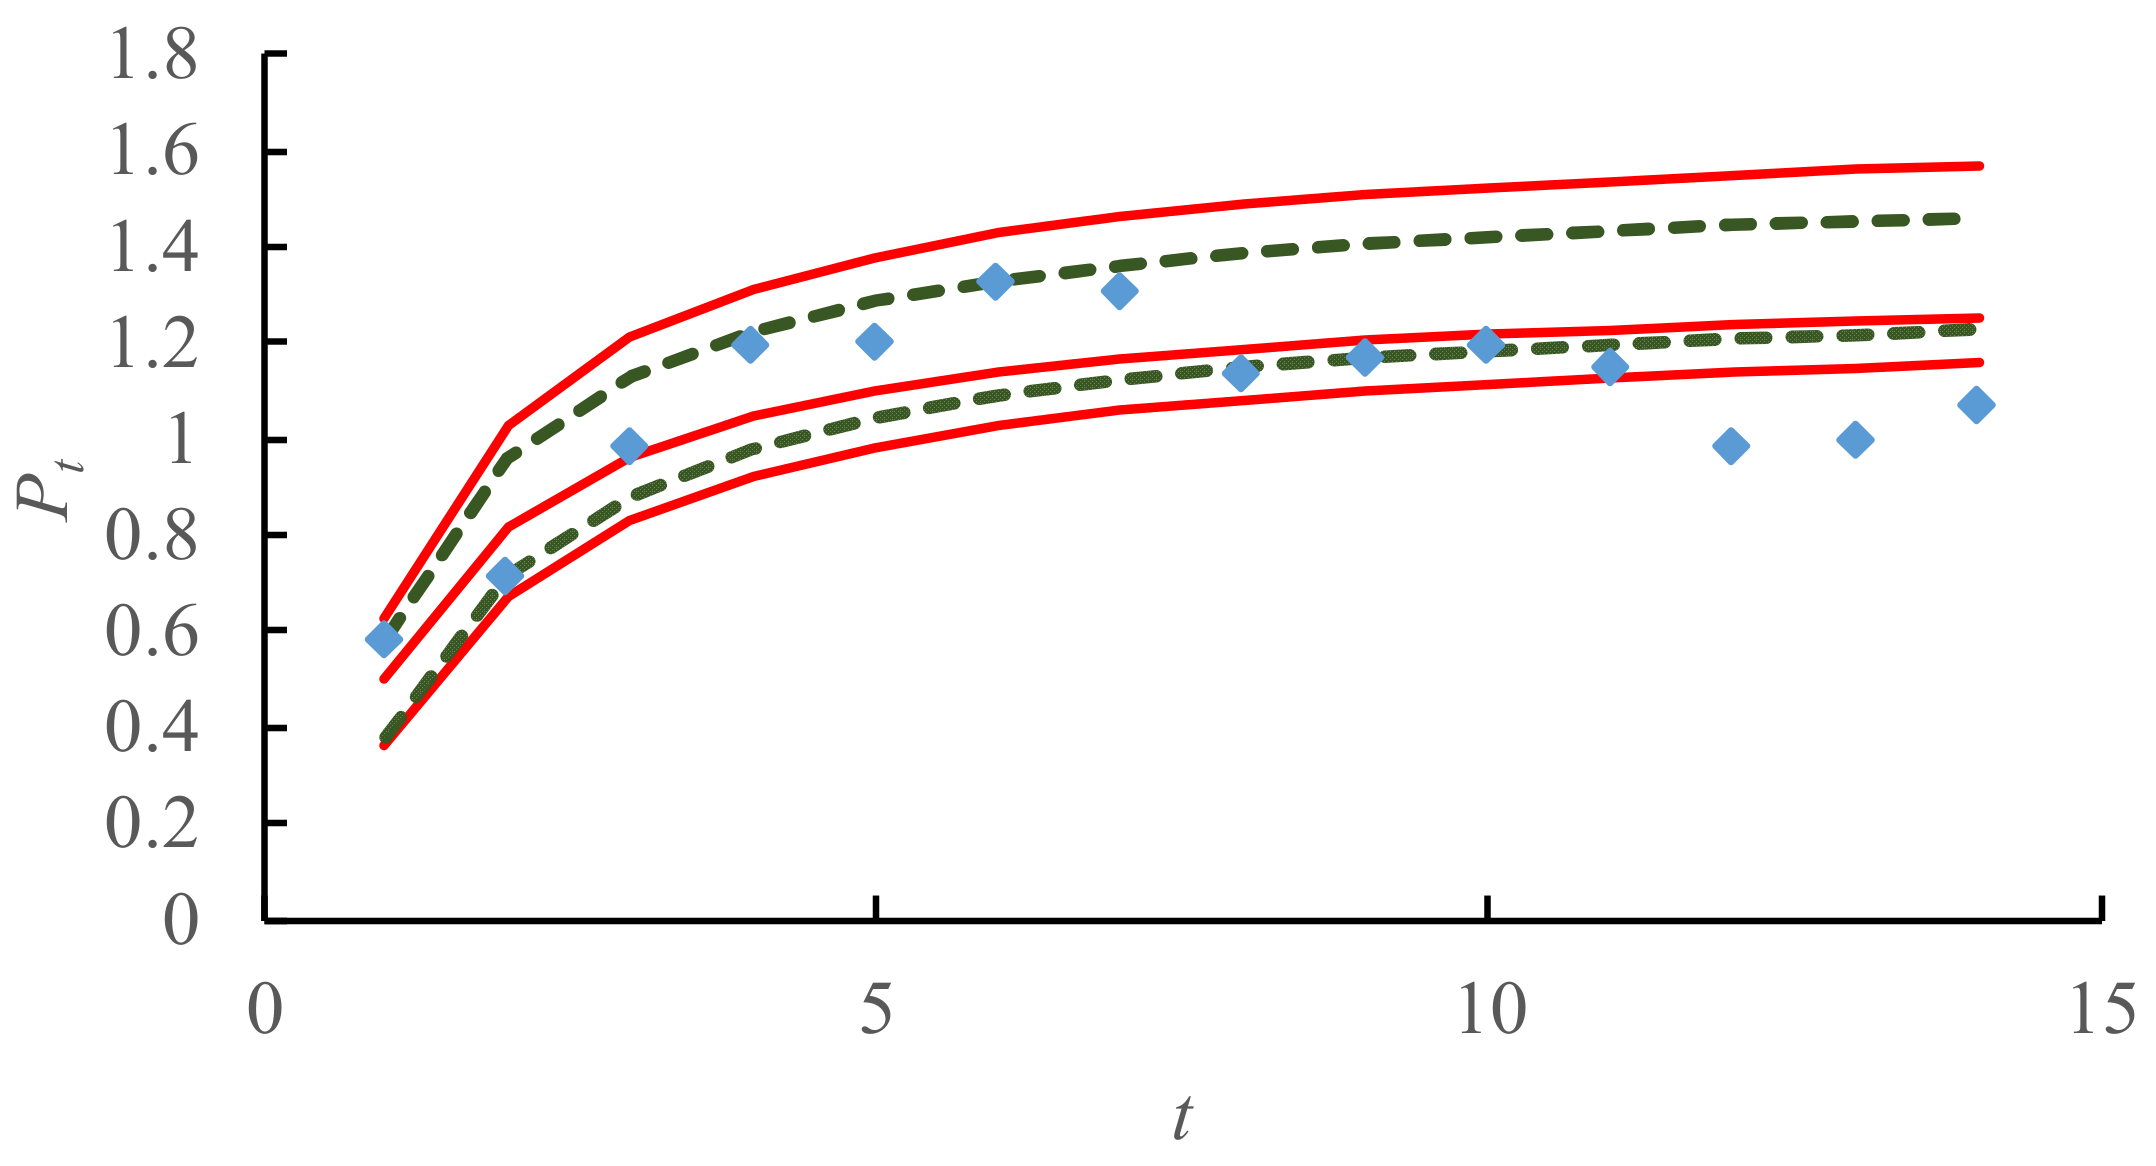
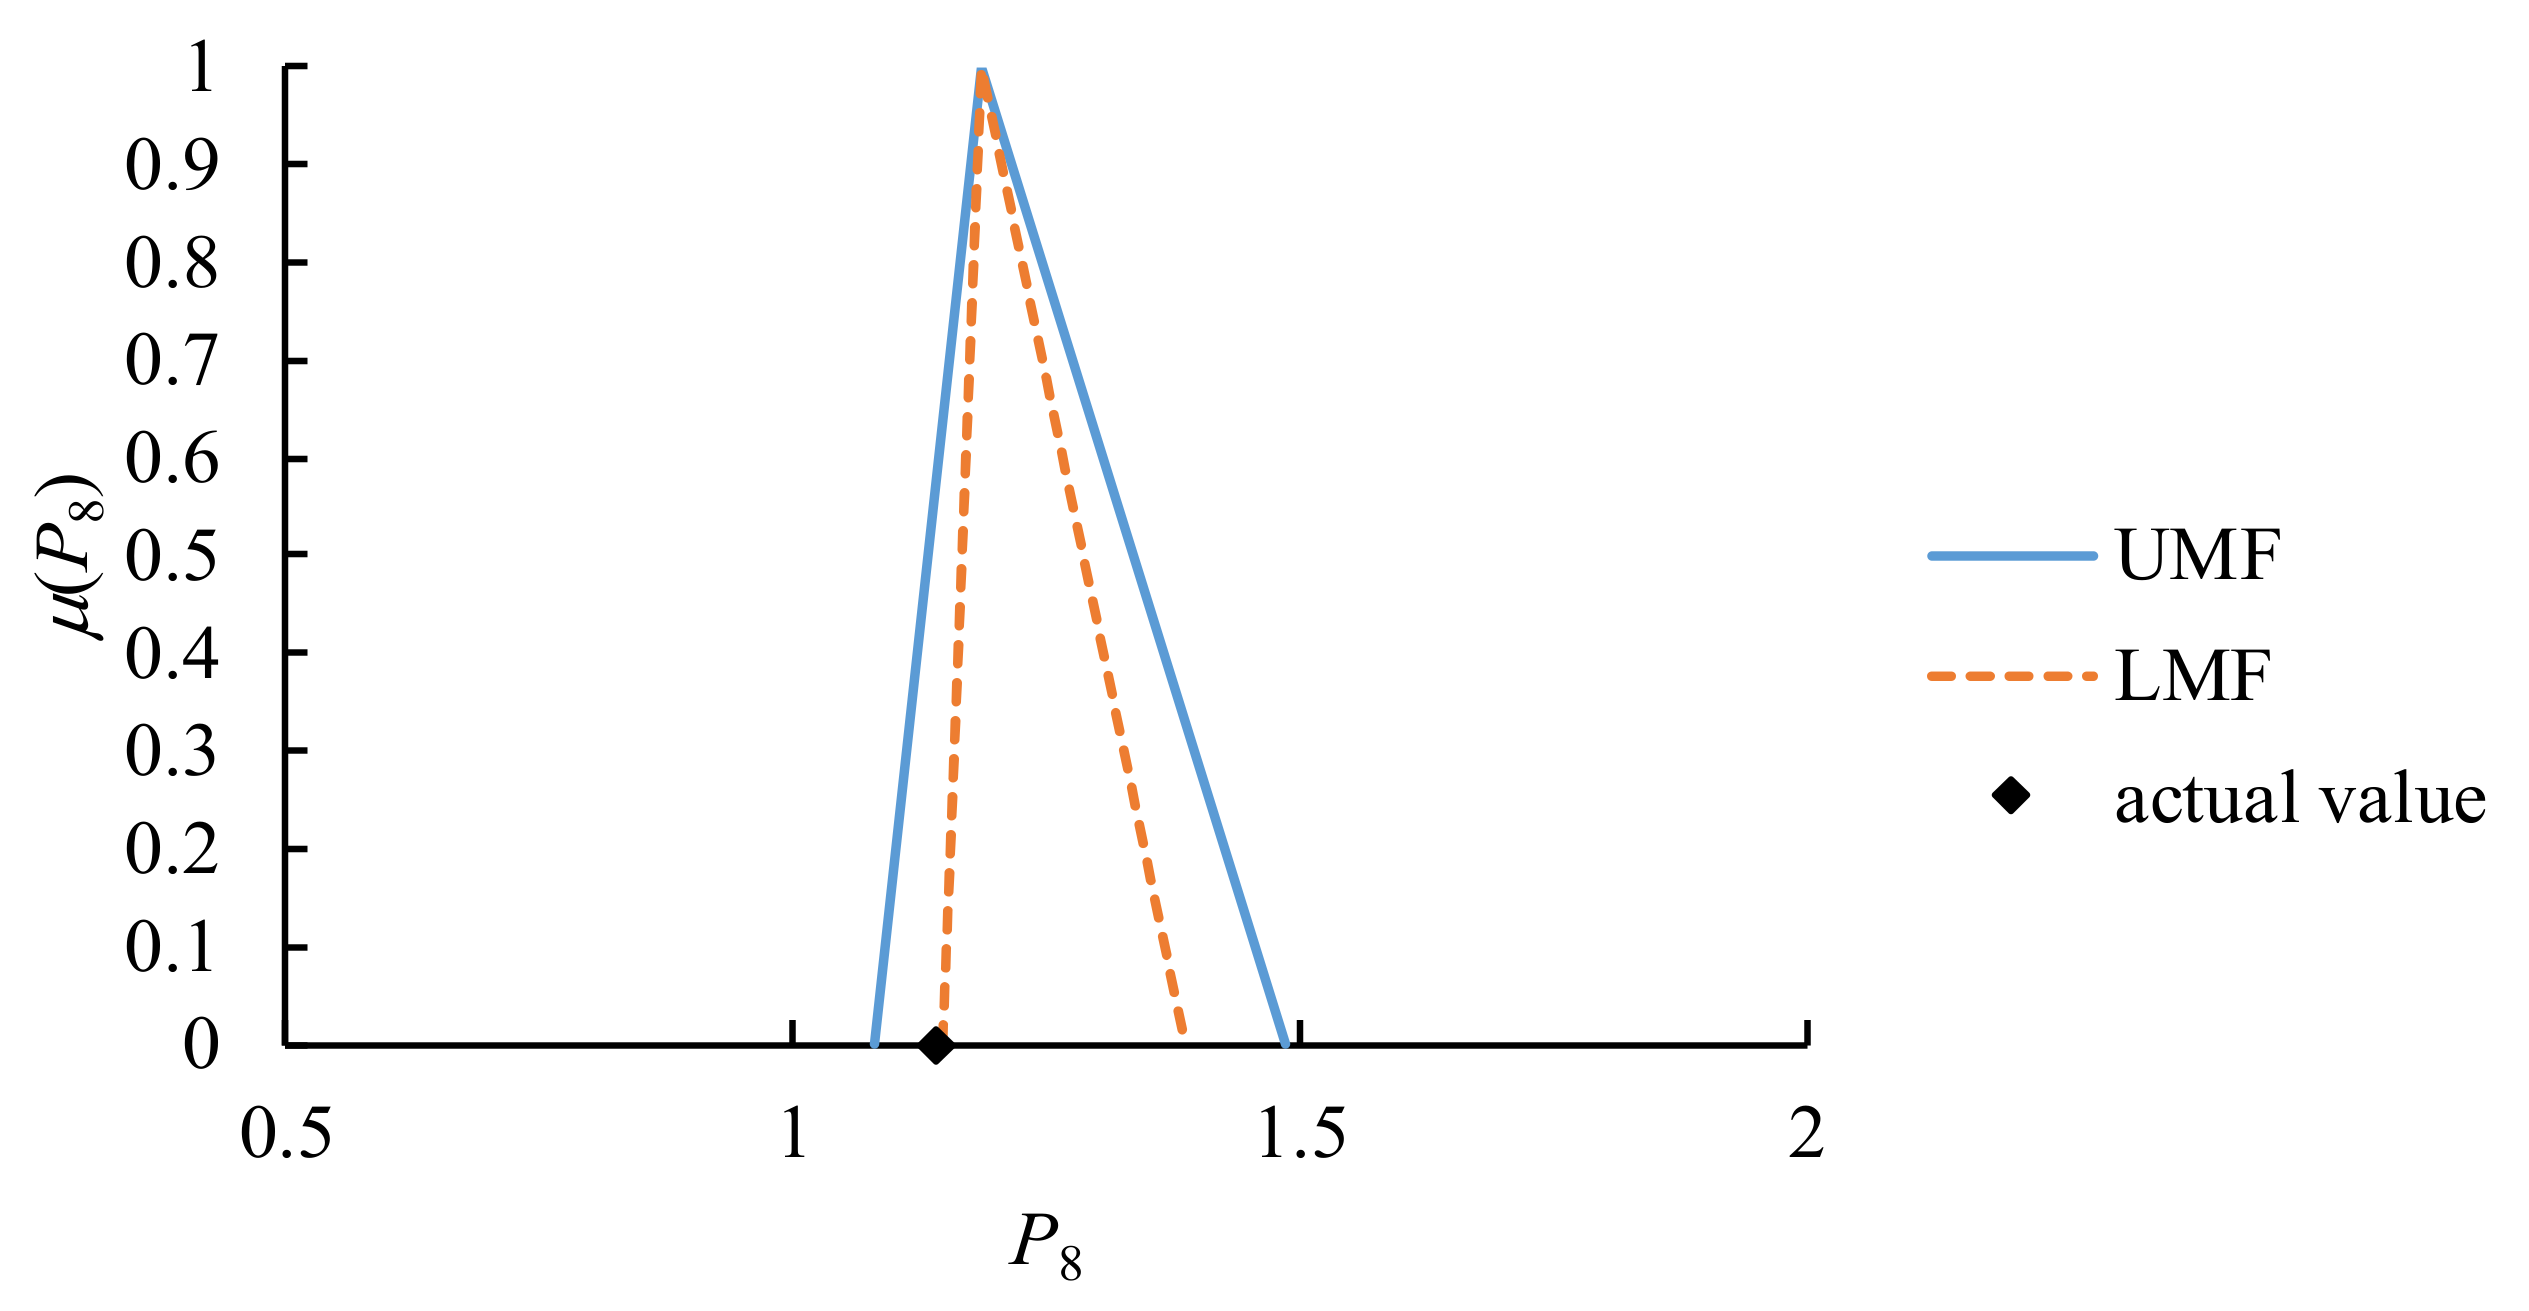
The optimal objective function value was 5.972. The forecasting results are displayed in Figure 7. The average width of the ranges of LMFs was 0.234. As expected, the ranges of LMFs were too narrow to include all actual values. Nevertheless, most actual values could be contained in such narrow ranges, which is very advantageous for practical applications. The productivity at the eighth period was a PTE case (the purple circle in Figure 7) because the actual value was below the LMF curve, as illustrated in Figure 8. By contrast, no BTA case was observed, which implied that the pessimistic or moderately pessimistic strategy may be suitable.
After applying the proposed methodology to test data, the hit rate was 25%. Subsequently, various formulas were applied to defuzzify interval-valued fuzzy productivity forecasts for test data to evaluate the forecasting accuracy of the proposed methodology in terms of mean absolute error (MAE), mean absolute percentage error (MAPE), and root mean square error (RMSE). The results are summarized in Table 3. The defuzzification formula D4 (the moderately pessimistic strategy) exhibited the best performance.
The linear programming (LP) method of Tanaka and Watada [41], quadratic programing (QP) method of Peters [51], QP method of Donoso et al. [52], two NLP models of Chen and Lin [53], artificial neural network (ANN) method of Chen [54], and the PP method of Chen et al. [21] were applied to the real case for comparison. Similar to the proposed methodology, all the aforementioned methods are based on a single expert’s forecast.
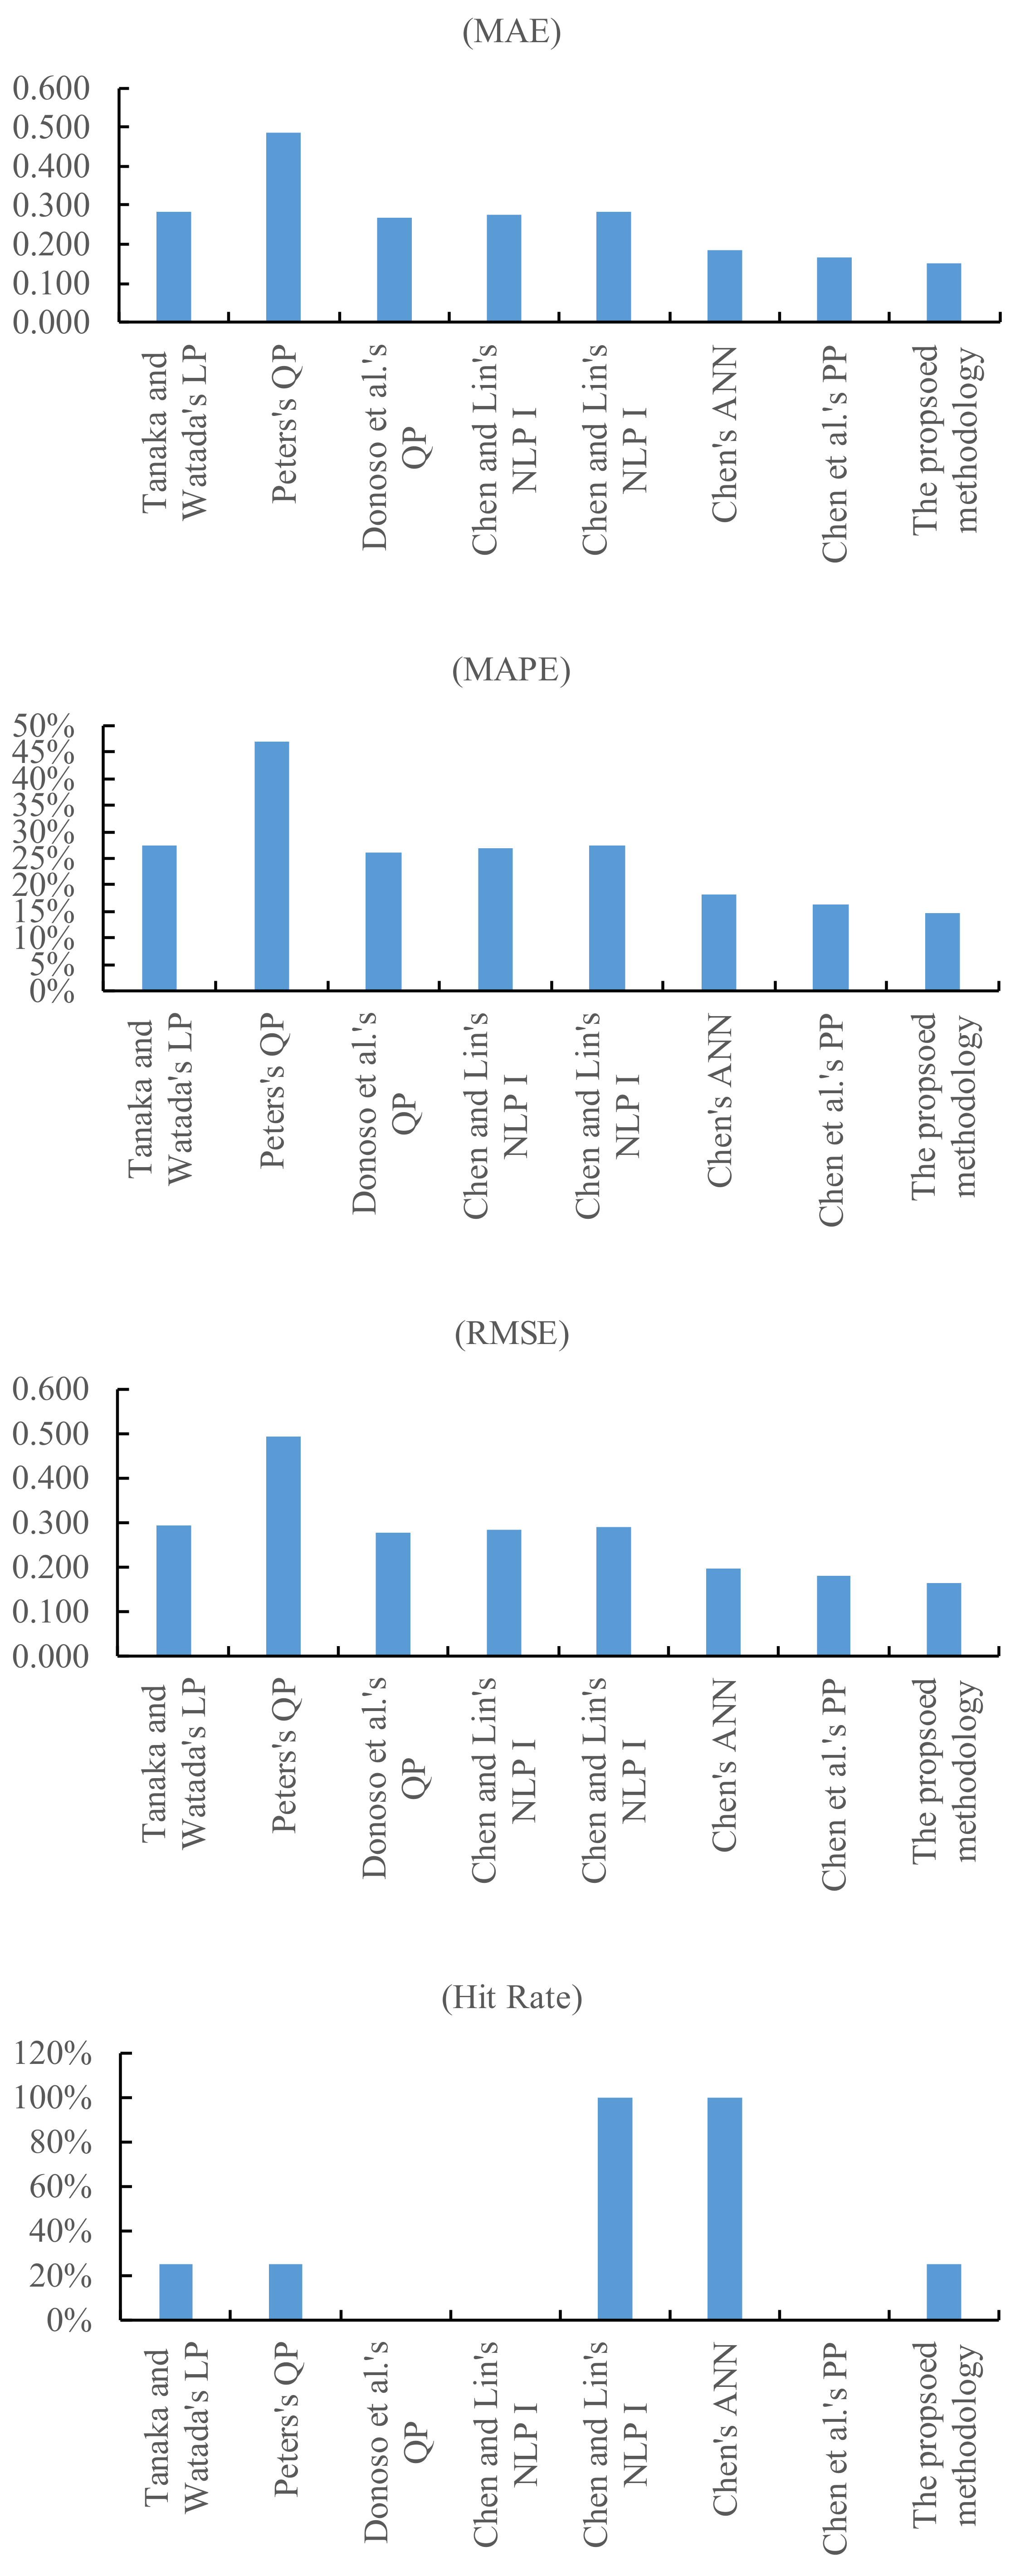
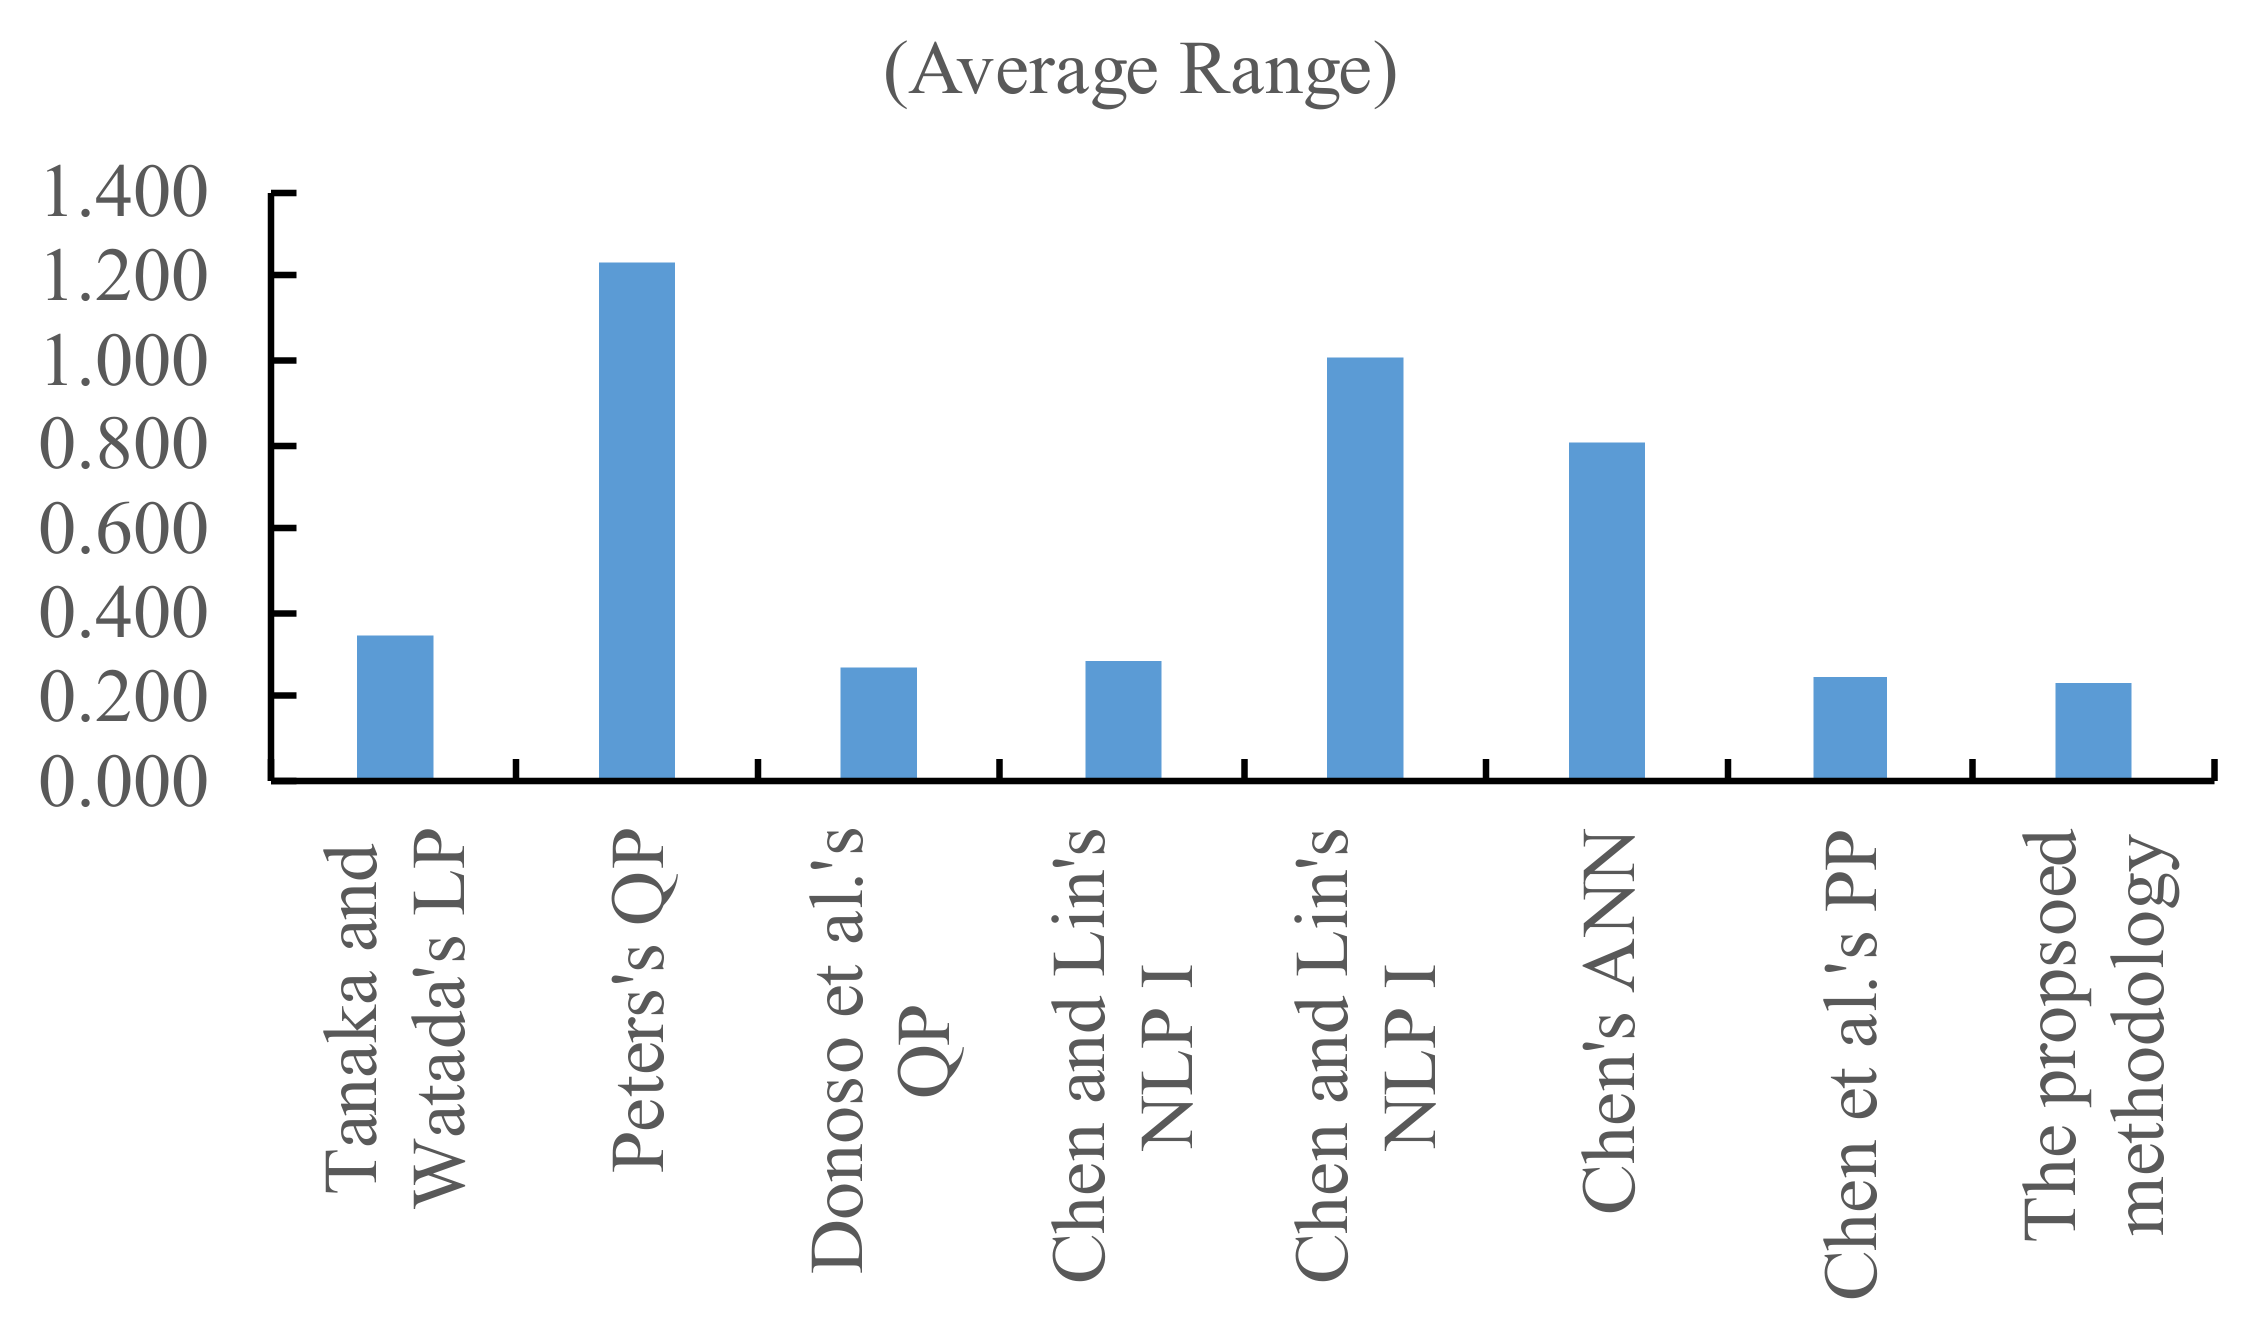
Tanaka and Watada’s LP method minimized the sum of the ranges of fuzzy productivity forecasts. The satisfaction level (s) was set to 0.3 for a fair comparison. By contrast, Peters’ QP method maximized the forecasting accuracy in terms of the average satisfaction level by requesting the average range of fuzzy productivity forecasts to be less than d = 1. To simultaneously optimize the forecasting accuracy and precision, the QP method of Donoso et al. minimized the weighted sum of the squared deviations from the core as well as the squared deviations from the estimated spreads. In this case, the two weights and were set to 0.45 and 0.55, respectively. Chen and Lin’s two NLP models were extensions of Tanaka and Watada’s LP model and Peters’s QP model, respectively. The two NLP methods adopted the following high-order objectives and/or constraints: o = 2, s = 0.15, m = 2, and d = 1.2, where o and m are the orders of the two objective functions, respectively. In Chen’s ANN method, the initial values of the network parameters were set as follows: the connection weight () = (0.10, 0.77, 1.15); the threshold () = (−0.18, −0.12, 0.26); and the learning rate (η) = 0.25. The training of the ANN was completed in 10 epochs. The PP method of Chen et al. overcame the global optimality problem of Chen and Lin’s NLP method by converting the NLP models into PP models, for which the Karush–Kuhn–Tucker conditions were easy to solve. The performance of existing methods is summarized in Table 4. A comparison of the performances of existing methods and the proposed methodology is displayed in Figure 9. The “moderately pessimistic” strategy was adopted in the proposed methodology.
According to the experimental results, the following inferences are obtained:
- (1)
- By excluding extreme (PTE and BTA) cases, the average range of fuzzy productivity forecasts was narrowed by 35%. In other words, the average range was widened by 35% when including a single extreme case.
- (2)
- The proposed methodology outperformed existing methods in terms of MAE, MAPE, and RMSE in evaluating the forecasting accuracy. The detection of PTE and BTA cases enabled the selection of a suitable forecasting strategy, which contributed to the superiority of the proposed methodology over existing methods. The most significant advantage was over the QP method of Peters. The proposed method was up to 69% more effective than the QP method in minimizing MAPE.
- (3)
- Conversely, the proposed methodology optimized the forecasting precision measured in terms of the average range. Despite such a narrow average range, the hit rate achieved using the proposed methodology was also satisfactory.
- (4)
- To ascertain whether the differences between the performances of various methods were statistically significant, the sums of ranks of all methods were compared [55,56,57]. The results are presented in Table 5. For example, the proposed methodology ranked the first among the compared methods in reducing MAE, MAPE, RMSE, and the average range, and ranked the fifth in elevating the hit rate. As a result, the sum of ranks was 9 for the proposed methodology. The ranks of methods that performed equally well were averaged. For example, Donoso et al.’s QP method and Chen and Li’s NLP I method performed equally well in elevating the hit rate and outperformed the other methods. Therefore, both of their ranks were (1 + 2)/2 = 1.5. According to the sums of ranks achieved by these methods, the proposed methodology ranked first, followed by the PP method of Chen et al., the QP method of Donoso et al., and the ANN method of Chen.
- (5)
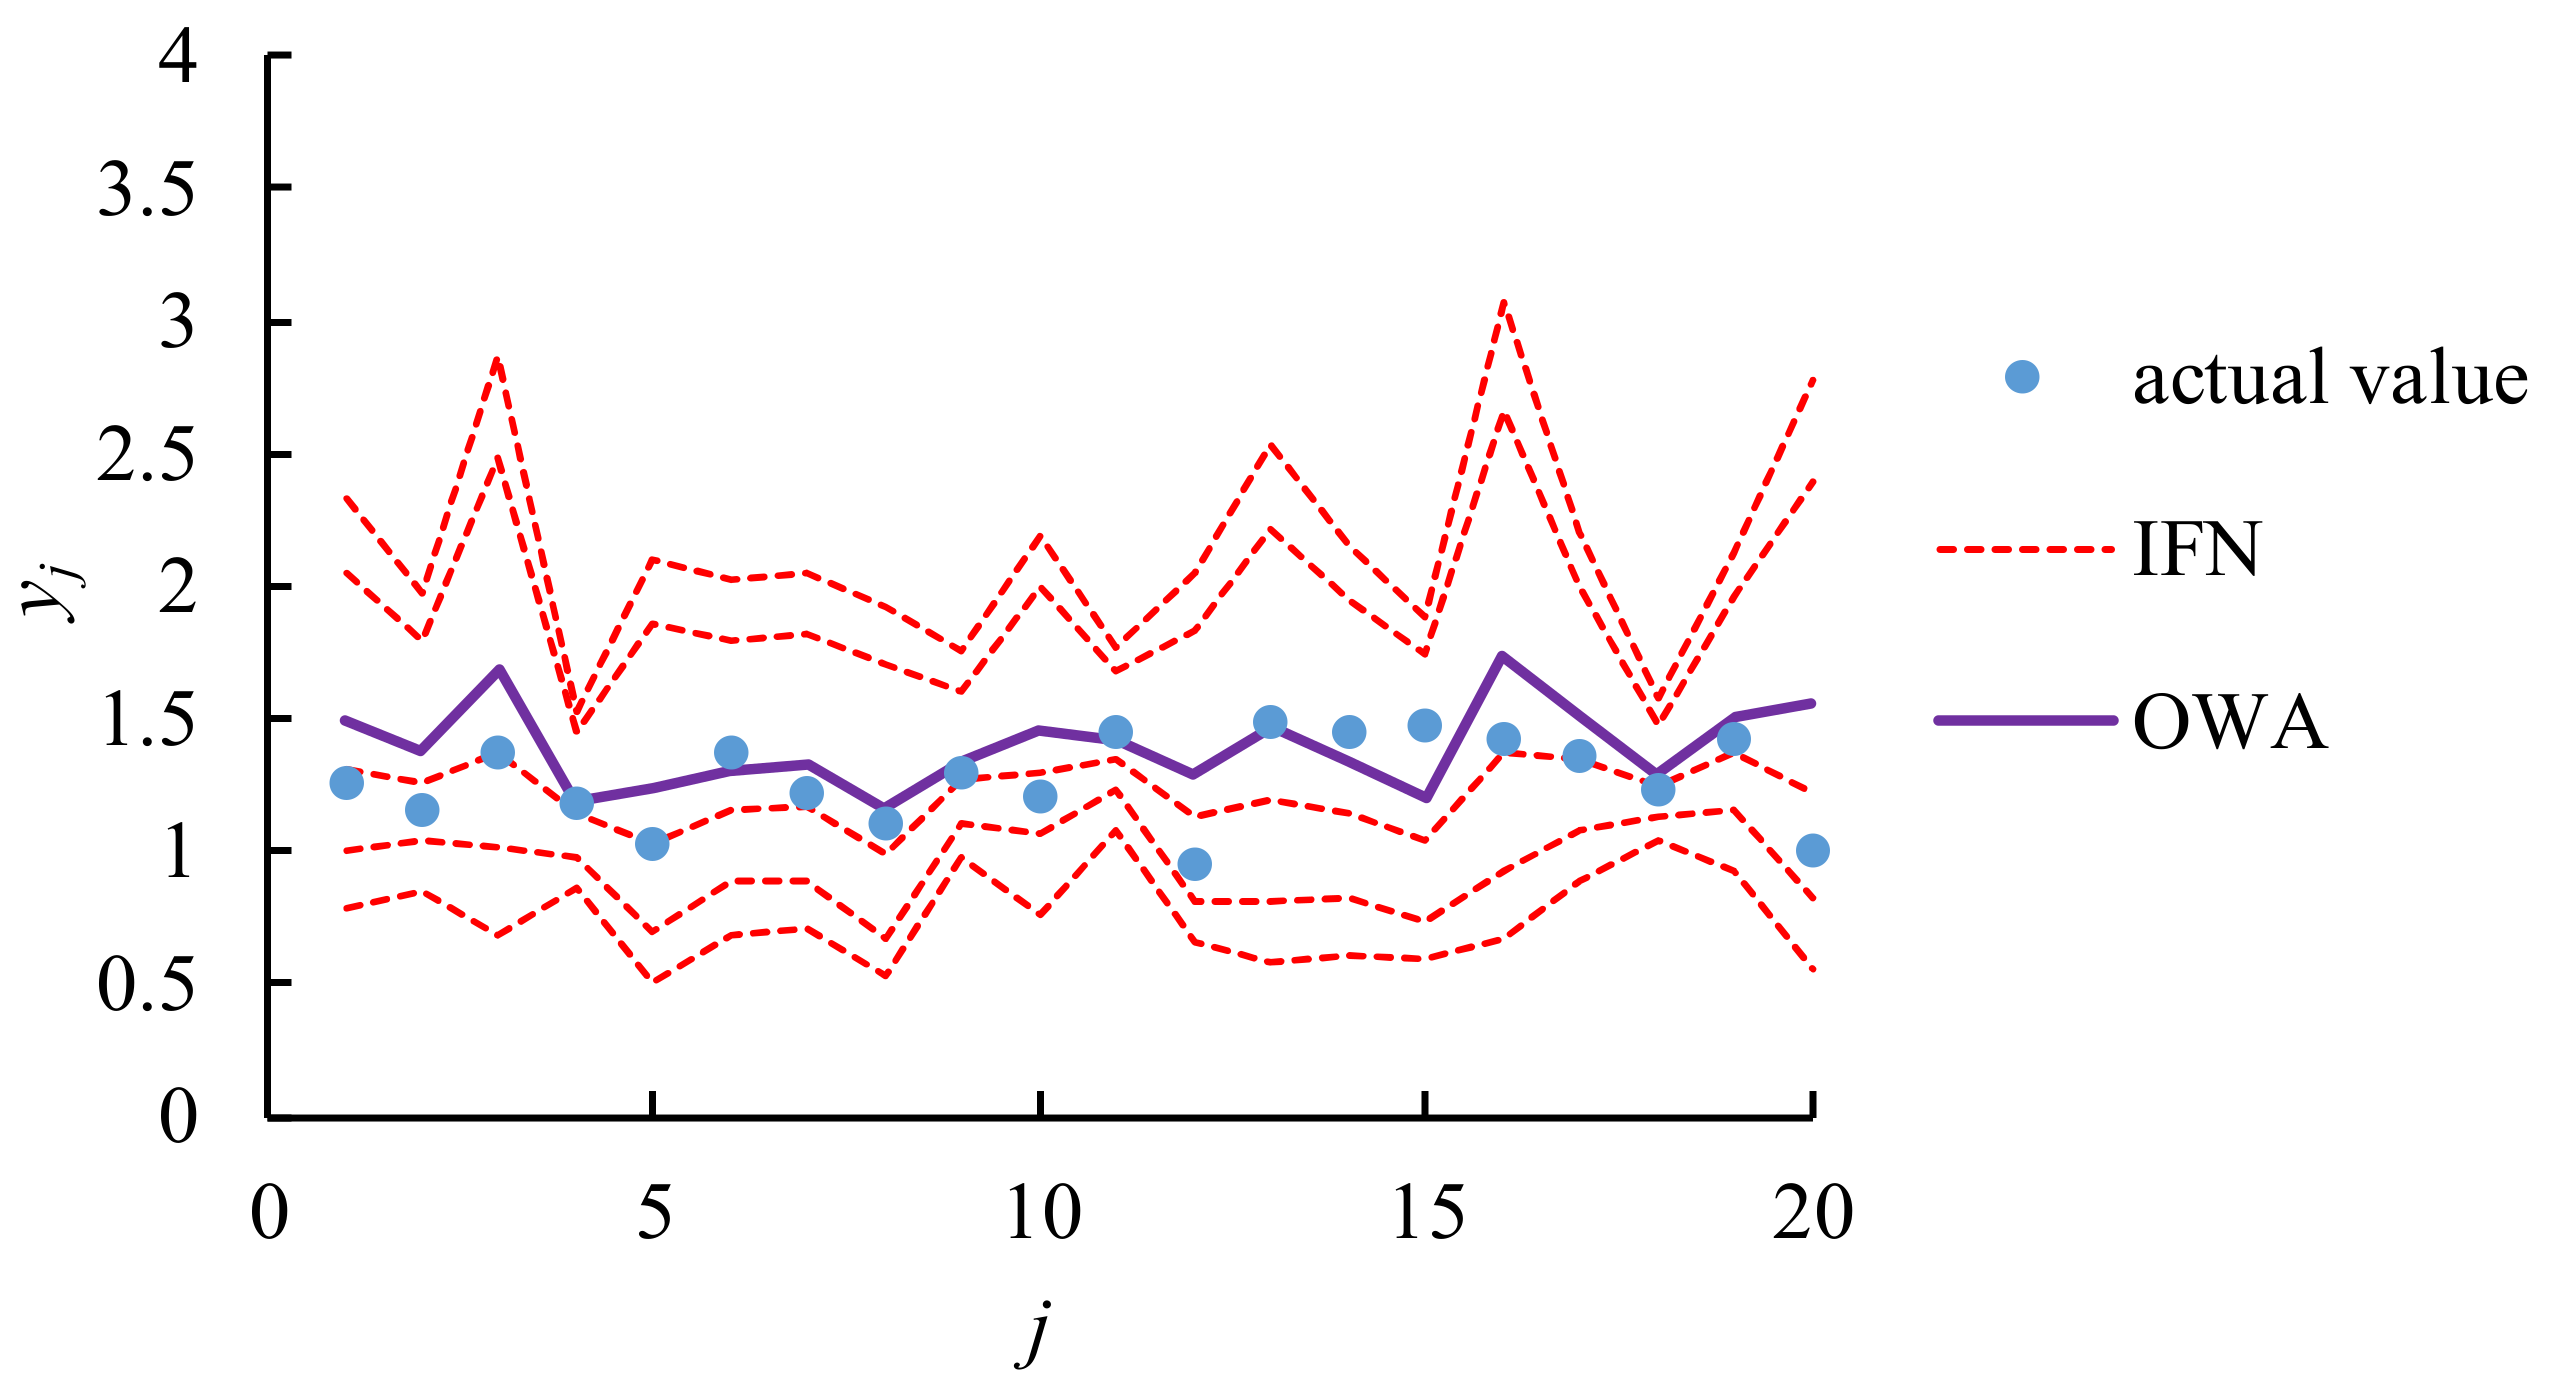
- To further elaborate the effectiveness of the proposed methodology, it has been applied to another case of forecasting the productivity of a factory. This case was first investigated by Akano and Asaolu [58], in which four factors (preventive maintenance time, off-duty time, machine downtime, and power failure time) were considered to be influential to the productivity of a factory. To forecast the productivity, Akano and Asaolu constructed an adaptive network-based fuzzy inference system (ANFIS), which resulted in a MAPE of up to 34%. In this study, an expert applied the IFN-based MBQP–OWA approach to forecast productivity, for which the neutral strategy was adopted. The forecasting results are shown in Figure 10. The forecasting accuracy, in terms of MAPE, was elevated by 19%.
5. Conclusions
An IFN-based MBQP–OWA approach is proposed in this study to model an uncertain productivity learning process. This study aims to resolve a problem of existing methods, that is, a few extreme (PTE and BTA) cases determine the lower and upper bounds on productivity. This problem causes the range of productivity to be unacceptably wide. To solve this problem, the range of productivity is divided into inner and outer sections that correspond to the LMF and UMF of an IFN-based fuzzy productivity forecast, respectively. In this manner, all actual values are included in the outer section, whereas most of the values lie within the inner section. Moreover, a suitable forecasting strategy can be determined according to the percentages of PTE and BTA cases. To derive the values of parameters in the IFN-based fuzzy productivity learning model, an MBQP model is proposed and optimized. Subsequently, the OWA method based on the selected forecasting strategy is applied to defuzzify the fuzzy productivity forecast. The contribution of this study resides in the following:
- (1)
- Using the characteristics of IFNs, a systematic mechanism was established to avoid extreme cases from widening the ranges of fuzzy productivity forecasts.
- (2)
- An innovative idea was proposed to defuzzify an IFN-based fuzzy productivity forecast using OWA.
The IFN-based MBQP–OWA approach has been applied to a real case of a DRAM factory to evaluate its effectiveness. According to the experiment results, the following findings are obtained:
- (1)
- In terms of MAE, MAPE, and RMSE, the accuracy of the forecasted productivity obtained using the proposed methodology was superior to those obtained using several existing methods.
- (2)
- The forecasting precision achieved using the proposed methodology was also satisfactory, especially for minimizing the average range of fuzzy productivity forecasts.
- (3)
- By identifying PTE and BTA cases, an expert was able to select a suitable forecasting strategy, which further enhanced the forecasting precision and accuracy.
The proposed methodology has several advantages, but there are also some drawbacks. For example, extreme cases may affect the range of productivity in different ways in the future. Nevertheless, in future studies, other types of fuzzy numbers, such as interval-valued intuitionistic fuzzy numbers [59], hesitant IFNs [60,61], Pythagorean fuzzy numbers [62], and interval-valued Pythagorean fuzzy numbers [63,64] can be adopted to model uncertain productivity instead. The proposed methodology can also be applied to other learning processes in various fields that are subject to uncertainty, such as unit cost learning [65] and energy efficiency learning [66]. Another interesting topic is how to build the IFN-based fuzzy productivity learning model if the collected productivity data are incomplete [67]. The proposed methodology can also be extended to fulfill a multiple-expert collaborative forecasting task [68,69,70,71,72].
Author Contributions
Data curation, methodology and writing original draft: T.-C.T.C. and M.-C.C.; writing—review and editing: T.-C.T.C., M.-C.C., and K.-W.H. All authors contributed equally to the writing of this paper. All authors read and approved the final manuscript.
Funding
This research received no external funding.
Conflicts of Interest
The authors declare no conflicts of interest.
References
- Stevenson, W.J. Operations Management; McGraw-Hill: New York, NY, USA, 2005. [Google Scholar]
- Chen, T. New fuzzy method for improving the precision of productivity pre-dictions for a factory. Neural Comput. Appl. 2017, 28, 3507–3520. [Google Scholar] [CrossRef]
- Geylani, P.C.; Kapelko, M.; Stefanou, S.E. Dynamic productivity change differences between global and non-global firms: A firm-level application to the US food and beverage industries. Oper. Res. 2019, 1–23. [Google Scholar] [CrossRef]
- Mitropoulos, P. Production and quality performance of healthcare services in EU countries during the economic crisis. Oper. Res. 2019, 1–17. [Google Scholar] [CrossRef]
- Lapré, M.A.; Van Wassenhove, L.N. Creating and transferring knowledge for productivity improvement in factories. Manag. Sci. 2001, 47, 1311–1325. [Google Scholar] [CrossRef] [Green Version]
- Chen, T. A collaborative and artificial intelligence approach for semiconductor cost forecasting. Comput. Ind. Eng. 2013, 66, 476–484. [Google Scholar] [CrossRef]
- Klein, P.; Bergmann, R. Generation of complex data for AI-based predictive maintenance research with a physical factory model. In Proceedings of the 16th International Conference on Informatics in Control Automation and Robotics, Prague, Czech Republic, 29–31 July 2019; pp. 40–50. [Google Scholar]
- Asemi, A.; Safari, A.; Zavareh, A.A. The role of management information system (MIS) and Decision support system (DSS) for manager’s decision making process. Int. J. Bus. Manag. 2011, 6, 164–173. [Google Scholar] [CrossRef]
- Al-Mamary, Y.; Shamsuddin, A.; Hamid, A.; Aziati, N. The role of different types of information systems in business organizations: A review. Int. J. Res. 2014, 1, 1279–1286. [Google Scholar]
- Gerogiannis, V.C.; Fitsilis, P.; Voulgaridou, D.; Kirytopoulos, K.A.; Sachini, E. A case study for project and portfolio management information system selection: A group AHP-scoring model approach. Int. J. Proj. Organ. Manag. 2010, 2, 361–381. [Google Scholar] [CrossRef] [Green Version]
- Gerogiannis, V.C.; Fitsilis, P.; Kameas, A.D. Using a combined intuitionistic fuzzy set-TOPSIS method for evaluating project and portfolio management information systems. In Artificial Intelligence Applications and Innovations; Springer: Berlin/Heidelberg, Germany, 2011; pp. 67–81. [Google Scholar]
- Hashemian, H.M.; Bean, W.C. State-of-the-art predictive maintenance techniques. IEEE Trans. Instrum. Meas. 2011, 60, 3480–3492. [Google Scholar] [CrossRef]
- Brynjolfsson, E.; Rock, D.; Syverson, C. Artificial intelligence and the modern productivity paradox: A clash of expectations and statistics. In The Economics of Artificial Intelligence: An Agenda; University of Chicago Press: Chicago, IL, USA, 2018. [Google Scholar]
- Appelbaum, E. Uncertainty and the measurement of productivity. J. Product. Anal. 1991, 2, 157–170. [Google Scholar] [CrossRef]
- Chen, T.; Romanowski, R. Forecasting the productivity of a virtual enterprise by agent-based fuzzy collaborative intelligence—With Facebook as an example. Appl. Soft Comput. 2014, 24, 511–521. [Google Scholar] [CrossRef]
- Zadeh, L.A. The concept of a linguistic variable and its application to approximate reasoning—II. Inf. Sci. 1975, 8, 301–357. [Google Scholar] [CrossRef]
- Hougaard, J.L. A simple approximation of productivity scores of fuzzy production plans. Fuzzy Sets Syst. 2005, 152, 455–465. [Google Scholar] [CrossRef] [Green Version]
- Emrouznejad, A.; Rostamy-Malkhalifeh, M.; Hatami-Marbini, A.; Tavana, M.; Aghayi, N. An overall profit Malmquist productivity index with fuzzy and interval data. Math. Comput. Model. 2011, 54, 2827–2838. [Google Scholar] [CrossRef]
- Wang, Y.C.; Chen, T. A fuzzy collaborative forecasting approach for forecasting the productivity of a factory. Adv. Mech. Eng. 2013, 5, 234571. [Google Scholar] [CrossRef] [Green Version]
- Chen, T.; Wang, Y.C. Evaluating sustainable advantages in productivity with a systematic procedure. Int. J. Adv. Manuf. Technol. 2016, 87, 1435–1442. [Google Scholar] [CrossRef]
- Chen, T.; Ou, C.; Lin, Y.C. A fuzzy polynomial fitting and mathematical programming approach for enhancing the accuracy and precision of productivity forecasting. Comput. Math. Organ. Theory 2019, 25, 85–107. [Google Scholar] [CrossRef]
- Guijun, W.; Xiaoping, L. The applications of interval-valued fuzzy numbers and interval-distribution numbers. Fuzzy Sets Syst. 1998, 98, 331–335. [Google Scholar] [CrossRef]
- Broumi, S.; Talea, M.; Bakali, A.; Smarandache, F.; Nagarajan, D.; Lathamaheswari, M.; Parimala, M. Shortest path problem in fuzzy, intuitionistic fuzzy and neutrosophic environment: An overview. Complex Intell. Syst. 2019, 5, 371–378. [Google Scholar] [CrossRef] [Green Version]
- Mohamadghasemi, A.; Hadi-Vencheh, A.; Lotfi, F.H.; Khalilzadeh, M. An integrated group FWA-ELECTRE III approach based on interval type-2 fuzzy sets for solving the MCDM problems using limit distance mean. Complex Intell. Syst. 2020, 1–35. [Google Scholar] [CrossRef] [Green Version]
- Muhuri, P.K.; Ashraf, Z.; Lohani, Q.D. Multiobjective reliability redun-dancy allocation problem with interval type-2 fuzzy uncertainty. IEEE Trans. Fuzzy Syst. 2017, 26, 1339–1355. [Google Scholar]
- Wang, Y.J. Combining quality function deployment with simple additive weighting for interval-valued fuzzy multi-criteria decision-making with depend-ent evaluation criteria. Soft Comput. 2019, 1–11. [Google Scholar] [CrossRef]
- Blanco-Mesa, F.; León-Castro, E.; Merigó, J.M.; Xu, Z. Bonferroni means with induced ordered weighted average operators. Int. J. Intell. Syst. 2019, 34, 3–23. [Google Scholar] [CrossRef] [Green Version]
- Hu, J.; Zhang, Y.; Chen, X.; Liu, Y. Multi-criteria decision making method based on possibility degree of interval type-2 fuzzy number. Knowl.-Based Syst. 2013, 43, 21–29. [Google Scholar] [CrossRef]
- Dimuro, G.P. On interval fuzzy numbers. IEEE Workshop-School on Theoretical Computer Science, Pelotas, Brazil, 24–26 August 2011; pp. 3–8. [Google Scholar]
- Baležentis, T.; Zeng, S. Group multi-criteria decision making based upon interval-valued fuzzy numbers: An extension of the MULTIMOORA method. Expert Syst. Appl. 2013, 40, 543–550. [Google Scholar] [CrossRef]
- Lee, C.S.; Chung, C.C.; Lee, H.S.; Gan, G.Y.; Chou, M.T. An intervalvalued fuzzy number approach for supplier selection. J. Mar. Sci. Technol. 2016, 24, 384–389. [Google Scholar]
- Chen, T.; Wang, Y.C. Interval fuzzy number-based approach for modeling an uncertain fuzzy yield learning process. J. Ambient Intell. Humaniz. Comput. 2020, 11, 1213–1223. [Google Scholar] [CrossRef]
- Javanmard, M.; Nehi, H.M. Rankings and operations for interval type-2 fuzzy numbers: A review and some new methods. J. Appl. Math. Comput. 2019, 59, 597–630. [Google Scholar] [CrossRef]
- Mendel, J.M. Type-2 fuzzy sets and systems: An overview. IEEE Comput. Intell. Mag. 2007, 2, 20–29. [Google Scholar] [CrossRef]
- Chen, T.; Lin, C.-W. An innovative yield learning model considering multiple learning sources and learning source interactions. Comput. Ind. Eng. 2019, 131, 455–463. [Google Scholar] [CrossRef]
- Baena, F.; Guarin, A.; Mora, J.; Sauza, J.; Retat, S. Learning factory: The path to industry 4.0. Procedia Manuf. 2017, 9, 73–80. [Google Scholar] [CrossRef]
- Chen, T. An innovative fuzzy and artificial neural network approach for forecasting yield under an uncertain learning environment. J. Ambient Intell. Humaniz. Comput. 2018, 9, 1013–1025. [Google Scholar] [CrossRef]
- Khalilpourazari, S.; Pasandideh, S.H.R.; Ghodratnama, A. Robust possibilistic programming for multi-item EOQ model with defective supply batches: Whale Optimization and Water Cycle Algorithms. Neural Comput. Appl. 2018, in press. [Google Scholar] [CrossRef]
- Das, A.; Bera, U.K.; Maiti, M. A solid transportation problem in uncertain environment involving type-2 fuzzy variable. Neural Comput. Appl. 2019, in press. [Google Scholar] [CrossRef]
- Samanta, S.; Jana, D.K. A multi-item transportation problem with mode of transportation preference by MCDM method in interval type-2 fuzzy environment. Neural Comput. Appl. 2019, 31, 605–617. [Google Scholar] [CrossRef]
- Tanaka, H.; Watada, J. Possibilistic linear systems and their application to the linear regression model. Fuzzy Sets Syst. 1988, 272, 275–289. [Google Scholar] [CrossRef]
- Chen, T. A collaborative fuzzy-neural system for global CO2 concentration forecasting. Int. J. Innov. Comput. Inf. Control 2012, 8, 7679–7696. [Google Scholar]
- Dunham, W. Journey Through Genius: The Great Theorems of Mathematics; Wiley: New York, NY, USA, 1990. [Google Scholar]
- Dahooie, J.H.; Zavadskas, E.K.; Abolhasani, M.; Vanaki, A.; Turskis, Z. A novel approach for evaluation of projects using an intervalvalued fuzzy additive ratio assessment (ARAS) method: A case study of oil and gas well drilling projects. Symmetry 2018, 10, 45. [Google Scholar] [CrossRef] [Green Version]
- Yager, R.R.; Kacprzyk, J. The Ordered Weighted Averaging Operators: Theory and Applications; Springer: New York, NY, USA, 2012. [Google Scholar]
- Blanco-Mesa, F.; Gil-Lafuente, A.M.; Merigó, J.M. Subjective stakeholder dynamics relationships treatment: A methodological approach using fuzzy decision-making. Comput. Math. Organ. Theory 2018, 24, 441–472. [Google Scholar] [CrossRef] [Green Version]
- Lin, Y.C.; Chen, T. A multibelief analytic hierarchy process and nonlinear programming approach for diversifying product designs: Smart backpack design as an example. Proc. Inst. Mech. Eng. Part B J. Eng. Manuf. 2020, 234, 1044–1056. [Google Scholar] [CrossRef]
- Chen, T.; Wang, Y.C. An advanced IoT system for assisting ubiquitous manufacturing with 3D printing. Int. J. Adv. Manuf. Technol. 2019, 103, 1721–1733. [Google Scholar] [CrossRef]
- Tsai, H.R.; Chen, T. Enhancing the sustainability of a location-aware service through optimization. Sustainability 2014, 6, 9441–9455. [Google Scholar] [CrossRef] [Green Version]
- Lin, C.W.; Chen, T. 3D printing technologies for enhancing the sustainability of an aircraft manufacturing or MRO company—A multi-expert partial consensus-FAHP analysis. Int. J. Adv. Manuf. Technol. 2019, 105, 4171–4180. [Google Scholar] [CrossRef]
- Peters, G. Fuzzy linear regression with fuzzy intervals. Fuzzy Sets Syst. 1994, 63, 45–55. [Google Scholar] [CrossRef]
- Donoso, S.; Marin, N.; Vila, M.A. Quadratic programming models for fuzzy regression. In Proceedings of the International Conference on Mathematical and Statistical Modeling in Honor of Enrique Castillo, Ciudad Real, Spain, 28–30 June 2006. [Google Scholar]
- Chen, T.; Lin, Y.C. A fuzzy-neural system incorporating unequally important expert opinions for semiconductor yield forecasting. Int. J. Uncertain. Fuzziness Knowl.-Based Syst. 2008, 16, 35–58. [Google Scholar] [CrossRef]
- Chen, T Fitting an uncertain productivity learning process using an artificial neural network approach. Comput. Math. Organ. Theory 2018, 24, 422–439. [CrossRef]
- Chen, T.; Wang, Y.C. An agent-based fuzzy collaborative intelligence approach for precise and accurate semiconductor yield forecasting. IEEE Trans. Fuzzy Syst. 2013, 22, 201–211. [Google Scholar] [CrossRef]
- de Barros, R.S.M.; Hidalgo, J.I.G.; de Lima Cabral, D.R. Wilcoxon rank sum test drift detector. Neurocomputing 2018, 275, 1954–1963. [Google Scholar] [CrossRef]
- Chen, T.; Wu, H.C.; Wang, Y.C. Fuzzy-neural approaches with example post-classification for estimating job cycle time in a wafer fab. Appl. Soft Comput. 2009, 9, 1225–1231. [Google Scholar] [CrossRef]
- Akano, T.T.; Asaolu, O.S. Productivity forecast of a manufacturing sys-tem through intelligent modelling. Futo J. Ser. 2017, 3, 102–113. [Google Scholar]
- Atanassov, K.; Gargov, G. Interval valued intuitionistic fuzzy sets. Fuzzy Sets Syst. 1989, 31, 343–349. [Google Scholar] [CrossRef]
- Wei, G.; Zhao, X.; Lin, R. Some hesitant interval-valued fuzzy aggregation operators and their applications to multiple attribute decision making. Knowl.-Based Syst. 2013, 46, 43–53. [Google Scholar] [CrossRef]
- Zhang, C.; Wang, C.; Zhang, Z.; Tian, D. A novel technique for multiple attribute group decision making in interval-valued hesitant fuzzy environments with incomplete weight information. J. Ambient Intell. Humaniz. Comput. 2018, in press. [Google Scholar] [CrossRef]
- Garg, H. Confidence levels based Pythagorean fuzzy aggregation operators and its application to decision-making process. Comput. Math. Organ. Theory 2017, 23, 546–571. [Google Scholar] [CrossRef]
- Blancett, R.S. Learning from productivity learning curves. Res. Technol. Manag 2002, 45, 54–58. [Google Scholar] [CrossRef]
- Rahman, K.; Abdullah, S.; Ali, A.; Amin, F. Interval-valued Pythagorean fuzzy Einstein hybrid weighted averaging aggregation operator and their application to group decision making. Complex Intell. Syst. 2019, 5, 41–52. [Google Scholar] [CrossRef]
- Lin, Y.C.; Chen, T. An advanced fuzzy collaborative intelligence approach for fitting the uncertain unit cost learning process. Complex Intell. Syst. 2019, 5, 303–313. [Google Scholar] [CrossRef] [Green Version]
- Jaeger, H.; Haas, H. Harnessing nonlinearity: Predicting chaotic systems and saving energy in wireless communication. Science 2004, 304, 78–80. [Google Scholar] [CrossRef] [Green Version]
- Zeng, J.; Li, Z.; Liu, M.; Liao, S. Information structures in an incomplete interval-valued information system. Int. J. Comput. Intell. Syst. 2019, 12, 809–821. [Google Scholar] [CrossRef]
- Chen, T.; Wang, Y.-C.; Lin, C.-W. A fuzzy collaborative forecasting approach considering experts’ unequal levels of authority. Appl. Soft Comput. 2020, 94, 106455. [Google Scholar] [CrossRef]
- Zhang, X.; Song, H. An integrative framework for collaborative forecasting in tourism supply chains. Int. J. Tour. Res. 2018, 20, 158–171. [Google Scholar] [CrossRef]
- Wang, Y.C.; Chen, T.C.T. A direct-solution fuzzy collaborative intelligence approach for yield forecasting in semiconductor manufacturing. Procedia Manuf. 2018, 17, 110–117. [Google Scholar] [CrossRef]
- Chen, T. Incorporating fuzzy c-means and a back-propagation network ensemble to job completion time prediction in a semiconductor fabrication factory. Fuzzy Sets Syst. 2007, 158, 2153–2168. [Google Scholar] [CrossRef]
- Chen, T.; Lin, Y.C. Feasibility evaluation and optimization of a smart manufacturing system based on 3D printing: A review. Int. J. Intell. Syst. 2017, 32, 394–413. [Google Scholar] [CrossRef]
Figure 1.
Lower and upper bounds determined by extreme cases.

Figure 2.
Narrow interval that contains most of the collected data.

Figure 3.
An ITFN.

Figure 4.
Effects of the objective function.

Figure 5.
Inclusion interval constructed by solving the MBQP problem.

Figure 6.
Real case.

Figure 7.
Forecasting results using the proposed methodology.

Figure 8.
IFN-based fuzzy productivity forecast for t = 8.

Figure 9.
Comparison between the performances of various methods.


Figure 10.
Forecasting results using the IFN-based MBQP–OWA approach.


Table 1.
Defuzzification method based on the forecasting strategy.
| Strategy | |
|---|---|
| Optimistic | |
| Moderately Optimistic | |
| Neutral | |
| Moderately Pessimistic | |
| Pessimistic |
Table 2.
Differences between the two approaches and the proposed methodology.
| Method | Type of Productivity Forecast | Optimization Models | Discriminating Extreme Cases | Number of Experts Required |
|---|---|---|---|---|
| Wang and Chen [19] | Fuzzy number | NLP, QP | No | Multiple |
| Chen et al. [21] | Fuzzy number | PP | No | One |
| The proposed methodology | IFN | MBQP | Yes | One |
Table 3.
Forecasting accuracy achieved using the proposed methodology (for test data).
| Defuzzification Formula | MAE | MAPE | RMSE |
|---|---|---|---|
| D1 | 0.270 | 26.2% | 0.279 |
| D2 (λ = 0.4) | 0.255 | 24.8% | 0.265 |
| D3 | 0.240 | 23.3% | 0.250 |
| D4 (Moderately Optimistic) | 0.402 | 38.9% | 0.409 |
| D4 (Moderately Pessimistic) | 0.150 | 14.7% | 0.166 |
Table 4.
Forecasting performances of existing methods for test data.
| Method | MAE | MAPE | RMSE | Hit Rate | Average Range |
|---|---|---|---|---|---|
| Tanaka and Watada’s LP method | 0.283 | 27.4% | 0.292 | 25% | 0.346 |
| Peters’s QP method | 0.487 | 47.0% | 0.492 | 25% | 1.233 |
| Donoso et al.’s QP method | 0.269 | 26.1% | 0.278 | 0% | 0.273 |
| Chen and Lin’s NLP I model | 0.276 | 26.8% | 0.285 | 0% | 0.288 |
| Chen and Lin’s NLP II model | 0.282 | 27.4% | 0.290 | 100% | 1.006 |
| Chen’s ANN method | 0.185 | 18.1% | 0.198 | 100% | 0.803 |
| Chen et al.’s PP method | 0.168 | 16.4% | 0.181 | 0% | 0.249 |
Table 5.
Comparing the sums of ranks of various methods.
| Method | Rank (MAE) | Rank (MAPE) | Rank (RMSE) | Rank (Hit Rate) | Rank (Average Range) | Sum of Ranks |
|---|---|---|---|---|---|---|
| Tanaka and Watada’s LP | 7 | 7 | 7 | 5 | 5 | 31 |
| Peters’s QP | 8 | 8 | 8 | 5 | 8 | 37 |
| Donoso et al.’s QP | 4 | 4 | 4 | 1.5 | 3 | 16.5 |
| Chen and Lin’s NLP I | 5 | 5 | 5 | 1.5 | 4 | 20.5 |
| Chen and Lin’s NLP I | 6 | 7 | 6 | 7.5 | 7 | 33.5 |
| Chen’s ANN | 3 | 3 | 3 | 7.5 | 6 | 22.5 |
| Chen et al.’s PP | 2 | 2 | 2 | 3 | 2 | 11 |
| The proposed methodology | 1 | 1 | 1 | 5 | 1 | 9 |
© 2020 by the authors. Licensee MDPI, Basel, Switzerland. This article is an open access article distributed under the terms and conditions of the Creative Commons Attribution (CC BY) license (http://creativecommons.org/licenses/by/4.0/).
Share and Cite
MDPI and ACS Style
Chiu, M.-C.; Chen, T.-C.T.; Hsu, K.-W. Modeling an Uncertain Productivity Learning Process Using an Interval Fuzzy Methodology. Mathematics 2020, 8, 998. https://0-doi-org.brum.beds.ac.uk/10.3390/math8060998
AMA Style
Chiu M-C, Chen T-CT, Hsu K-W. Modeling an Uncertain Productivity Learning Process Using an Interval Fuzzy Methodology. Mathematics. 2020; 8(6):998. https://0-doi-org.brum.beds.ac.uk/10.3390/math8060998
Chicago/Turabian StyleChiu, Min-Chi, Tin-Chih Toly Chen, and Keng-Wei Hsu. 2020. "Modeling an Uncertain Productivity Learning Process Using an Interval Fuzzy Methodology" Mathematics 8, no. 6: 998. https://0-doi-org.brum.beds.ac.uk/10.3390/math8060998
Note that from the first issue of 2016, this journal uses article numbers instead of page numbers. See further details here.