AHP-TOPSIS Inspired Shopping Mall Site Selection Problem with Fuzzy Data
by
 , and
, and
Neha Ghorui
1, 
Arijit Ghosh
2,
Ebrahem A. Algehyne
3, 
Sankar Prasad Mondal
4,* and
Apu Kumar Saha
5 1
Department of Mathematics, Prasanta Chandra Mahalanobis Mahavidyalaya, Kolkata 700108, India
2
Department of Mathematics, St. Xavier’s College (Autonomous), Kolkata 700016, India
3
Department of Mathematics, Faculty of Sciences, University of Tabuk, Tabuk-71491, Saudi Arabia
4
Department of Applied Science, Maulana Abul Kalam Azad University of Technology, West Bengal, Haringhata 741249, India
5
Department of Mathematics, National Institute of Technology, Agartala, Jirania 799046, India
*
Author to whom correspondence should be addressed.
Mathematics 2020, 8(8), 1380; https://0-doi-org.brum.beds.ac.uk/10.3390/math8081380
Submission received: 28 July 2020
/
Revised: 11 August 2020
/
Accepted: 11 August 2020
/
Published: 17 August 2020
(This article belongs to the Special Issue Fuzzy Sets, Fuzzy Logic and Their Applications 2020)
Abstract
:In the consumerist world, there is an ever-increasing demand for consumption in urban life. Thus, the demand for shopping malls is growing. For a developer, site selection is an important issue as the optimal selection involves several complex factors and sub-factors for a successful investment venture. Thus, these tangible and intangible factors can be best solved by the Multi Criteria Decision Making (MCDM) models. In this study, optimal site selection has been done out of multiple alternative locations in and around the city of Kolkata, West Bengal, India. The Fuzzy Analytic Hierarchy Process (FAHP) and Fuzzy Technique for Order of Preference by Similarity to Ideal Solution (FTOPSIS) has been applied for shopping mall site selection. The AHP is used to obtain the crispified weight of factors. Imprecise linguistic terms used by the decision-maker are converted to Triangular Fuzzy Numbers (TFNs). This research used integrated sub-factors fuzzy weights using FAHP to FTOPSIS for ranking of the alternatives. Hardly any research is done with the use of sub-factors. In this study, seven factors and seventeen sub-factors are considered, the authors collected data from different locations with the help of municipal authorities and architects. This work further provides useful guidelines for shopping mall selection in different states and countries.
1. Introduction
Shopping malls can be considered as one of the most important growth points for Business strategies. There exist multiple factors which are responsible for a decision-maker (DM) to select the optimal site for shopping mall construction. Detailed study has been conducted to identify all the factors and sub-factors related to site selection. The weights are assigned to each of the factors and sub-factors with the help of an expert decision-maker (DM). The needs for shopping malls are increasing throughout the country. As several factors influence the selection of the best site, it can be considered as an application of Multi Criteria Decision Making (MCDM). MCDM is considered as the most significant branch of Operation Research, as it incorporates complex decisions of people’s lives. There exists multiple MCDM models. The researcher uses MCDM techniques depending on the problem of the decision making. The MCDM model Analytic Hierarchy Process (AHP) introduced by the author of Reference [1] is one of the powerful techniques to obtain the factors’ and sub-factors’ weight. The model is widely used in numerous fields of engineering, economics, and operations management. The factors’ and sub-factors’ importance are calculated by the pair-wise comparison matrix. The pure AHP model lacks the ability to capture uncertainty, thus several researchers have integrated Fuzzy with AHP to capture the impreciseness in decision making. Thus, in the present research, we used FAHP to determine the factors’ and sub-factors’ fuzzy weight.
The Technique of Order Preference by a Similarity to Ideal Solution (TOPSIS) developed by the authors of Reference [2] is a logistic approach to select the best alternatives in real life problems, when several conflicting qualitative and quantitative criteria exist for the evaluation. The idea of this technique is that the best alternative is closest to the positive ideal solution (PIS) and farthest from the negative ideal solution (NIS). Decision making problems with uncertainty nowadays play an important role [3,4,5,6,7,8]. The FTOPSIS, an extension of classical TOPSIS to fuzzy domain, was introduced by the authors of Reference [9] and uses fuzzy numbers instead of crisp values.
The selection of the parameters for the site selection of a shopping mall have originality. Moreover, the discussion of the universal design criteria affecting the criteria and sub-criteria has not been done in any paper before this. The study compares and evaluates the proposed sites for the shopping mall using the MCDM model. During the course of research, it was analyzed by experts and the opinion was taken from the people so as to bring the real customer needs and wants into the picture. Moreover, the study also explains the direct and indirect relation between the factors and sub-factors.
The fuzzy domain is a suitable approach in handling real life composite applications. The present paper focuses on the minute specifications of the sub-factors and applies Triangular Fuzzy Numbers (TFNs) to give proper weightage to factors and sub-factors using Fuzzy AHP. Finally, the best site is assessed using the Fuzzy TOPSIS approach. The use of fuzzy set theory with the MCDM technique enables the decision-making problem to deal with vagueness and uncertainty.
1.1. Background of the Study
In this modern era, the way we perceive shopping mall structures has changed. The shinier the structure, the more global the brand stores situated in it will be. Buying in a shopping mall makes the experience special since there are a lot of choices under a single roof, which adds to the appeal of the shopping experience [10]. Standalone brand stores have a higher possibility of offering more discounts as compared to the stores in the malls since they have less taxes and other overhead charges to pay. It is also seen that people often associate price with quality, and this leads them to have negative views about products in single stores. Since there are a large number of shopping malls with the same products, choosing which one to purchase from has become a trick [11]. This is because the same products might be available via online stores at a discounted price and it might be preferred since it is available sitting in one’s house [12]. Hence, to create a niche for themselves, they must stand out. One of the ways to do so is understanding the target customer group [13,14]. The malls are also being frequently visited by pregnant women, new mothers, children, and people with disabilities, and so the design should be such that it is comfortable for all. If the building is designed in such a way so as to take all these factors into account, then it becomes a part of the universal design of architecture [15]. Universal design is such a design which is accessible by people of all ages [16]. The literature for this is limited since studies have not been done on these specific parts of the society [17,18]. This is because the architects are more often than not people who do not need special help and therefore they usually do not consider this section of the people [19], hence for them to show empathy and design a structure is similar to telling a child to paint a bird when he has never seen it. Therefore, a good understanding of the special needs must be incorporated into building the universal design so that everyone feels at home [20]. Earlier important features like the parking capacity and area size have now been subdued by environmental criterion, design aesthetics, and ergonomics, with studies proving that the latter criteria have a more potent effect on the customer satisfaction [21]. Ergonomic factors and aesthetics such as background and interior design offer more entertainment and comfort to the customers [22]. Environmental criteria like accessing facilities, noise pollution, air pollution, and traffic jams also play a key role in making a mall attractive to its prospective customers. Location selection is an important factor since it has long-term risks and costs associated with the motivation of the work [23,24]. It involves identification, evaluation, and selection among the options available. The process is influenced by qualitative, quantitative criteria such as related and supporting industries, firm strategy and rivalry, proximity to raw materials and markets, infrastructure conditions, market size and demand conditions, investment costs, natural conditions and human resources to name a few [25,26]. Hence, selecting a site for a shopping mall seems to be a major factor which decides the success of the business.
1.2. Background of Fuzzy AHP and Fuzzy TOPSIS
The authors of [27] applied the Fuzzy TOPSIS approach for transshipment site selection in Istanbul, Turkey. The factors’ weights were determined by the AHP methodology. The authors of [28] used hybrid Fuzzy AHP (FAHP) to calculate the weights of varying locations in Vietnam and then TOPSIS was applied for ranking of the alternatives.
The authors of [29] applied an integrated approach of Hesitant Fuzzy Sets (HFSs) to TOPSIS to select the best hospital site in Istanbul. The customers outweigh the cost of travelling with the alternative shopping opportunities and this helps to understand the inter-metropolitan trade areas of shopping centers [30].
The authors of [31] opined that evaluation and determination of negative and positive characteristics of one location to another is a tough job. The authors of [32] used multinomial logit model and principal component analysis to take parking facilities, quality, value, satisfaction, and variety into consideration. The authors of [33] analyzed socialization, functionality, convenience, and recreation using Structural Equation Modeling. The authors of [34] conclude that the selection of a shopping mall site is not an easy task and the closer to reality the solution comes, the better the model. Multi Criteria Decision Making (MCDM) takes this into account by considering all the criteria and determining an optimal result. The authors of Reference [19] did a MCDM study on selection of safety equipment using universal design principles. The authors of Reference [35] solved a landfill selection problem in Canada by using a fuzzy MCDM approach. The authors of Reference [36] used MCDM on hesitant fuzzy linguistic terms for site selection of wind turbines. MCDM was used by the author of [37] in site selection of a GIS-based solar farm. The author of [38] referred to MCDM in the field of information technology and IT management. The authors of [39] used MCDM for the TOPSIS method in the field of operations research. The authors of [40] used MCDM for formulating energy policies. The authors of [41] used MCDM for formulating a technique on renewable energy. The authors of [42] used it for logistic suppliers under supply chain management, the authors of [43] have used it for knowledge management, the authors of [44] have adopted MCDM in the field of tourism management, and the authors of [45] used it for construction management.
MCDM makes the decision on the basis of multiple criteria. The maker of the decision is supposed to choose between the non-quantifiable multiple criteria and quantifiable multiple criteria. The preference of the decision-makers (DMs) are of the foremost importance since the options are very close and their personal preferences plays an important role in finding out the optimal solution. In order to tackle the uncertainties of the data, fuzzy methods can be integrated with the MCDM methods.
1.3. Motivation of the Study
Earlier, several researchers have used fuzzy numbers coupled with AHP and TOPSIS in an uncertain environment of decision making. Basically, for the selection of an optimal site, the researchers have taken factors’ weight to rank the best. Hardly any research has been done with the use of sub-factors for the evaluation of the potential site under fuzzy environment. Here, we integrated two fuzzy MCDM methods to select the best site. At first, fuzzy AHP is applied to figure out the importance of 7 factors. Finally, the sub-factors’ fuzzy weights are calculated for further evaluation. FTOPSIS is used for selection of an optimal site considering the seventeen sub-factors.
1.4. Novelties of the Work
The present study advances in the following way:
- The important factors and sub-factors are studied in a detailed way. These sub-factors capture minute detail considered by developers for new shopping mall site selection. Hardly any other papers have explored all these dimensions.
- Questionnaires were made. The municipal authorities and architects were interviewed to get a clear idea about the uncertain factors such as land cost, population density, and population growth rate.
- The TFN FAHP and TFN FTOPSIS were employed to get the proper weightage and optimal site.
- The linguistic terms assigned by the decision experts were converted to TFN in an effective and efficient process.
- Sensitivity analysis was conducted, and a comparative analysis was done with the proposed problem to illustrate how the ranking fluctuates with the change or elimination of certain factors and sub-factors.
1.5. Structure of the Paper
The remainder of the paper is constructed in the following way: Section 2 reflects the design and methodology of the proposed research. The definitions and algebraic operations of respective Fuzzy sets and Fuzzy numbers are illustrated. The AHP, FAHP, and FTOPSIS methodology are also discussed. Section 3 discusses the application, data source, and numerical problem of the study. A brief discussion of the sub-factors is executed and the final ranking is evaluated. Section 4 briefly describes the importance of shopping malls in the economic growth and discusses the result obtained. Section 5 discusses the sensitivity analysis and numerical simulation. Finally, the conclusion is presented in Section 6.
2. Design of the Proposed Model
Step 1: Identification of the research problem and defining the goal. Determination of factors and sub-factors by interviewing the experts and following literature reviews.
Step 2: Application of FAHP methodology to evaluate the importance of factors’ and sub-factors’ weight. The seven prospective locations in and around the city of Kolkata are chosen.
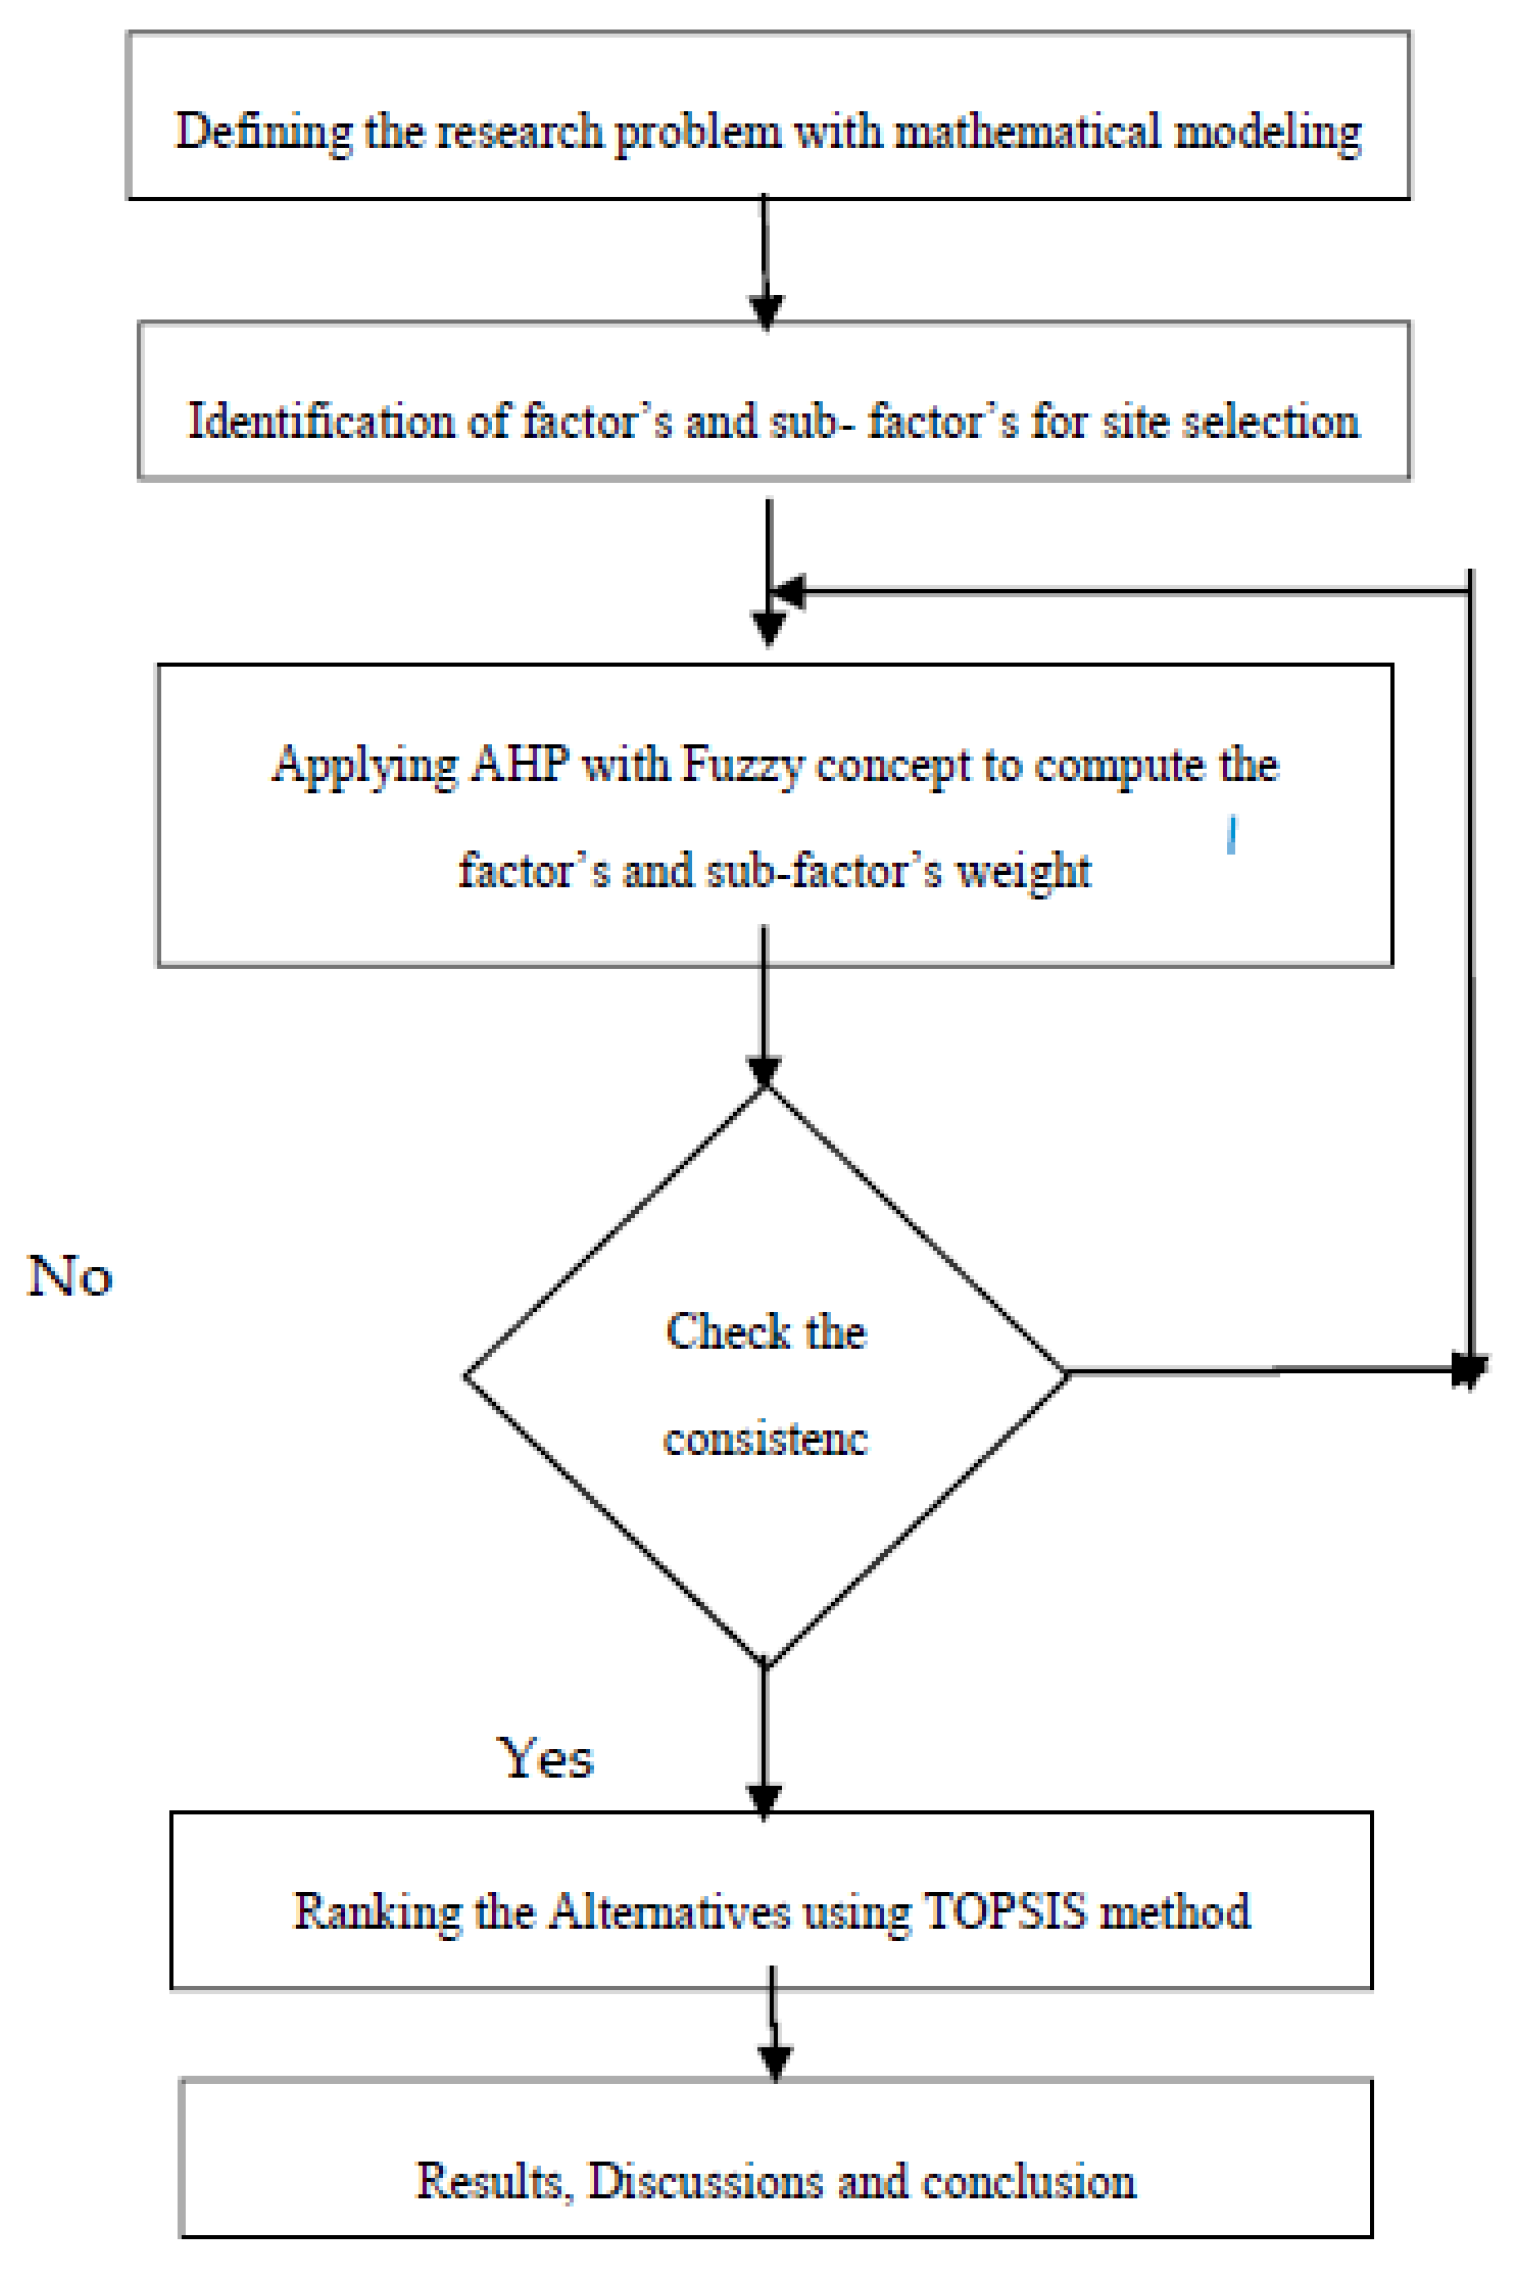
Step 3: The FTOPSIS model is applied for ranking of the best location for shopping mall site selection. The FTOPSIS approach is one of the best MCDM techniques when the problem has several imprecise qualitative and quantitative attributes. The model efficiently addresses the complex decision-making problem of optimal site selection. In Figure 1 we mentioned the steps for the proposed methodology.
2.1. Preliminaries Concepts
2.1.1. Fuzzy Sets
The fuzzy set concept was introduced by the author of Reference [46] to handle the uncertainties prevailing in the real-life problem. A fuzzy set is defined as:
=, where is a subset of the real numbers, R. Here, denotes the membership function. For each there exists a membership which ranges from zero to one. The fuzzy set concept is widely used in real-life problems, where the information is imprecise and vague. There exist different forms of fuzzy numbers such as: Triangular Fuzzy Number (TFN), Trapezoidal Fuzzy Number (TrFN), Intuionistic Fuzzy Number (IFN), etc. The different forms of fuzzy numbers are used depending on the nature of the problem. TFN is widely used for its efficiency to deal with applications where vagueness and uncertainty surrounds the decision making. The hesitancy or fuzziness of the DM’s can be expressed in TFN while constructing a comparison matrix and decision matrix to rank the best alternatives.
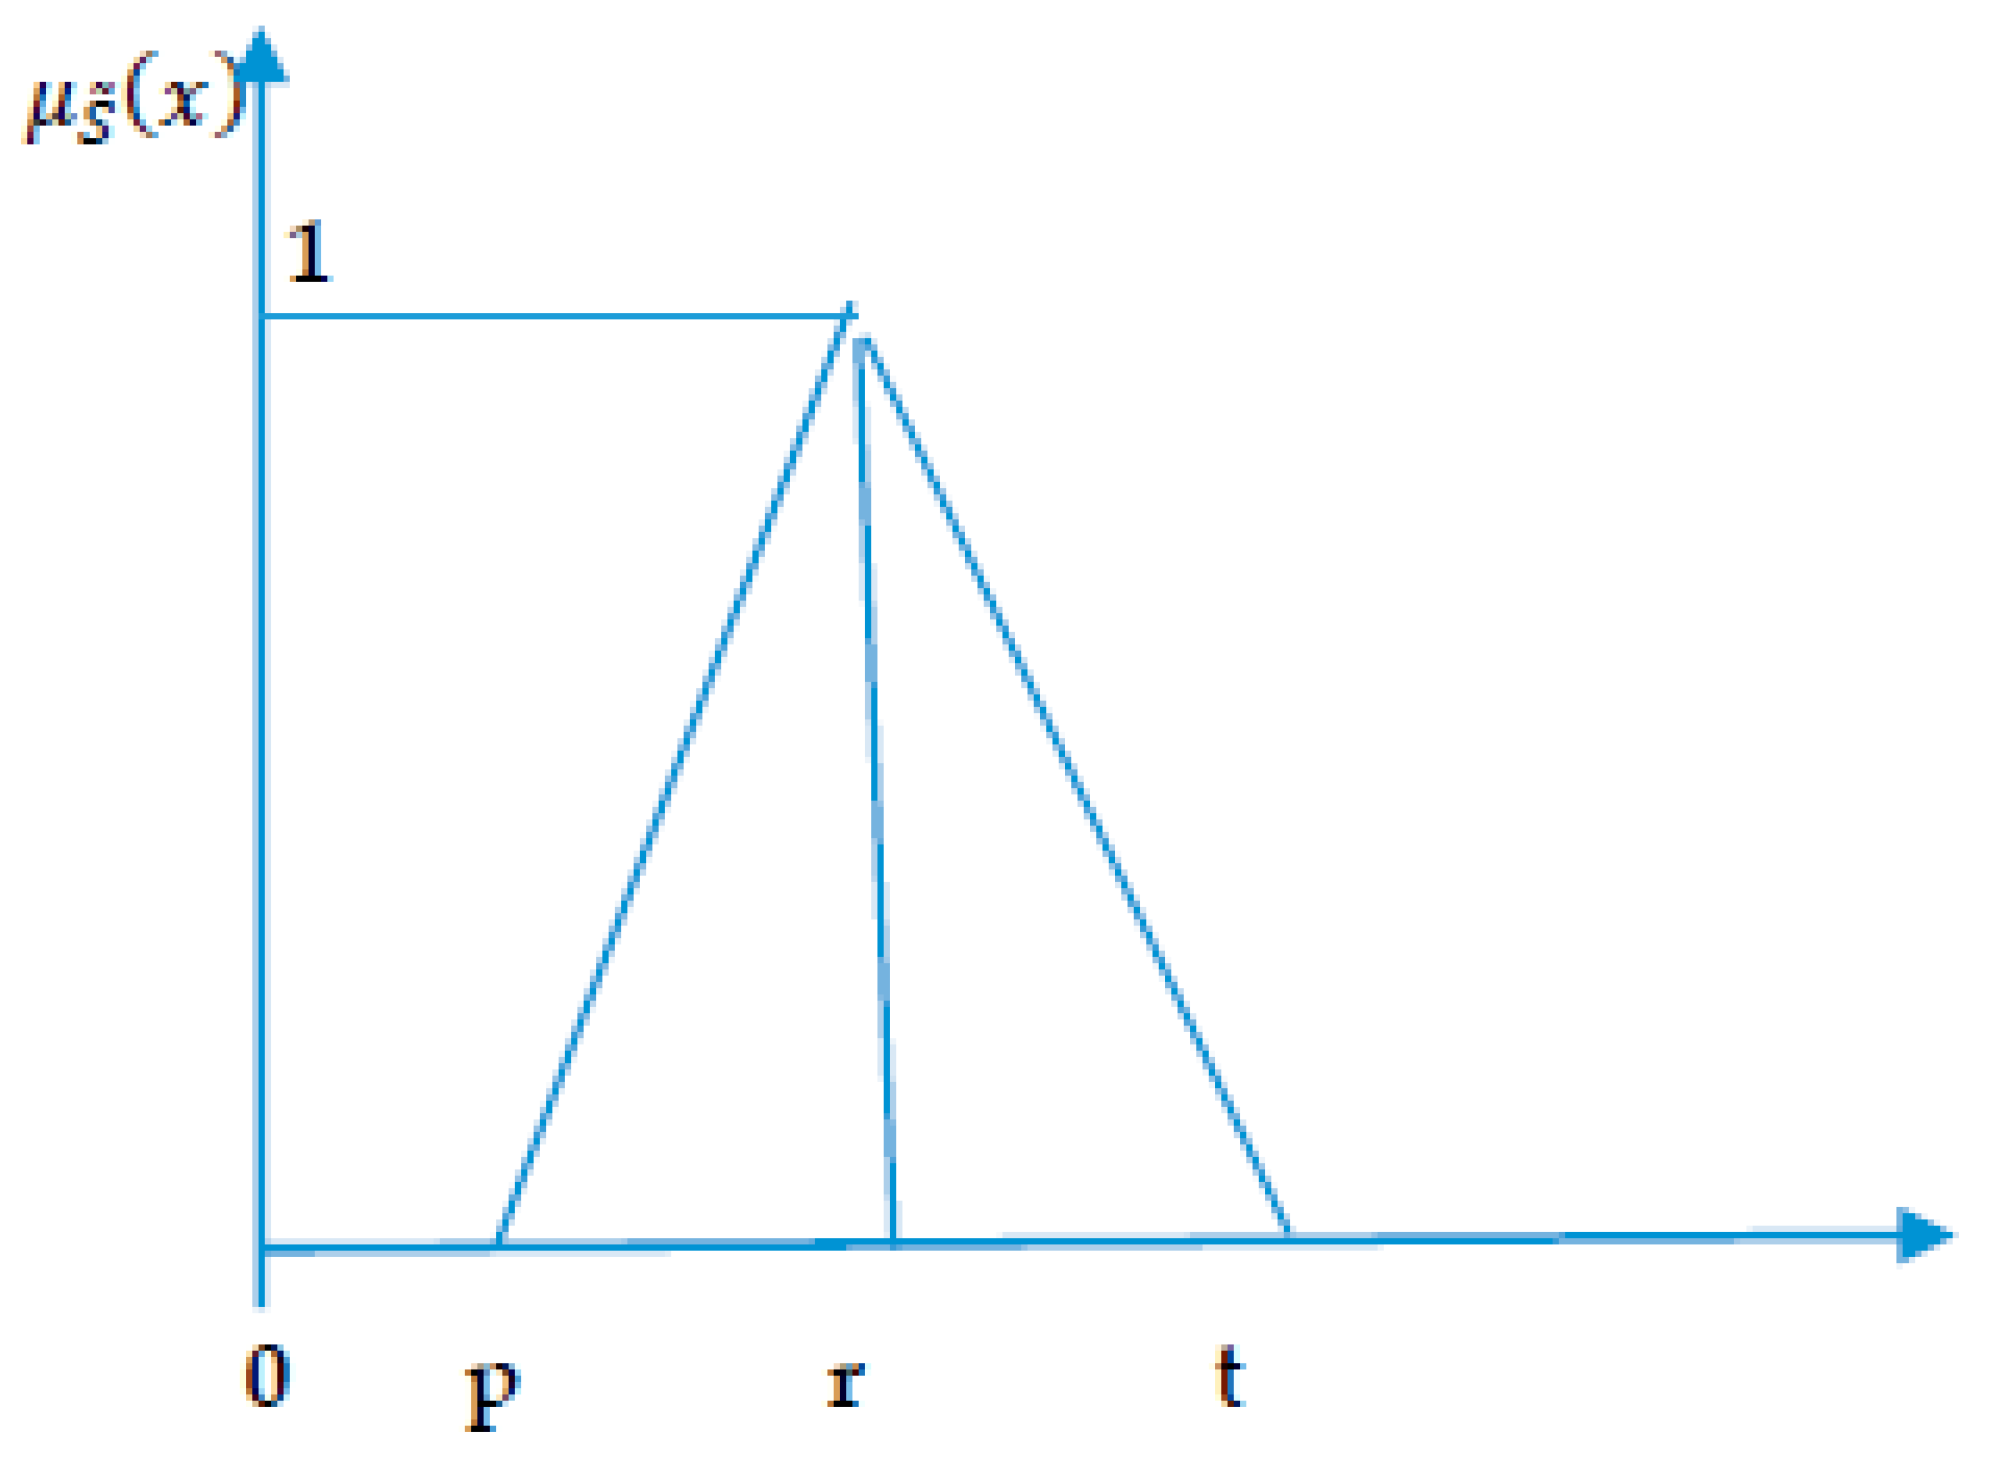
A TFN, denoted as consists of the following membership function:
The Figure 2 represents the pictorial representation of triangular fuzzy number. The variable “r” represents the maximum membership value of 1 and is considered to be the most promising value. The variables “” and “” denote the smallest viable value and the largest viable value, respectively. The triplet which describes the fuzziness of a particular event enables the field of practicable evaluation.
- Note 1:
- 1.
- When , the TFN becomes a crisp value.
- 2.
- TFN can be visualized as a special case of TrFN, as when the two most achievable values become equal, then it is a TFN.
Definition 1.
Letandbe two TFN’s, then the distance between the two can be determined by the vertex method as:
2.1.2. Arithmetic Operations of Fuzzy Numbers
2.1.3. Fuzzy Analytic Hierarchy Process
The Analytic Hierarchy Process (AHP) was first developed by the author of Reference [1], and is a widely used scientific method in Multi Criteria Decision Making (MCDM). AHP helps the decision-makers to solve the complex decisions with heuristic methods. Evaluation of factors’ and sub-factors’ weights are important for ranking the optimal site selection. AHP creates a framework of the problem hierarchy with the construction of comparison matrices to give subjective judgments about the factor’s which are considered highly responsible in ranking the best. In this paper, FAHP is used rather than AHP as the fuzzy environment takes into consideration the uncertainty and impreciseness of the decision experts. The fuzzy AHP methodology is based on the pairwise comparison approach, applied to understand the relative importance of factors and sub-factors. The AHP coupled with fuzzy logic enables the decision-makers a suitable approach in obtaining more realistic results in decision-making problems. The steps of FAHP are described below.
Step 1: Construction of a comparison matrix in terms of TFN by a decision expert or a group of decision experts.
Assume a group of ‘’ decision-makers involved in the pairwise comparison of factors and sub-factors. Thus, ‘’ set of matrices are obtained, :
where expresses the relative preference of factor to factor as decided by the decision expert.
Step 2: Defuzzification of TFN.
A TFN can be defuzzified to a crisp value using the method proposed by the authors of Reference [47]:
where signifies the preference display of the evaluator and signifies the risk factor of the uncertain conditions. The method explicitly express fuzzy logic owing to the uncertainty of the decision makers. The uncertainty is maximum when and stability increases in decision making with increasing . Moreover, can be defined as the risk factor of the decision maker. implies highly pessimistic whereas implies highly optimistic.
denotes the lower bound of -cut for , and denotes the upper bound of -cut for .
Step 3: Construction of a comparison matrix in terms of crisp values.
Generalized representation of defuzzified comparison matrix:
Step 4: Normalization of the defuzzified matrix:
Step 5: Estimation of factors’ and sub-factors’ weights:
Step 6: Checking the Consistence Index of the matrix:
where is the size of the matrix.
Step 7: Calculation of Consistence Ratio (C.R):
where R.I denotes the Random Index, whose value differs with the size of the matrix “n”.
The value of C.R indicates the matrix to be consistent, which implies that no further evaluation is required.
2.1.4. Technique for Order Preference by Similarity to Ideal Solution (TOPSIS) and (FTOPSIS)
The TOPSIS approach is one of the commonly used MCDM techniques, which was first developed by the authors of Reference [2]. The basic formulation of TOPSIS is to rank the alternatives, thus giving an idea as to which alternative is most preferred. The TOPSIS method isclassified as a distance measure method in which the optimal alternative obtained is farthest from the negative ideal solution (NIS) and closest to the positive ideal solution (PIS). The linguistic human decisions can be reflected better with Fuzzy TOPSIS (FTOPSIS). The approach is useful in handling the complexity of the situation involving several factors and their sub-factors. In this research, for the selection of the best site to construct a shopping mall, it is dependent on multiple conflicting factors and sub-factors, thus the MCDM method FTOPSIS introduced by the authors of Reference [9] is one of the most suitable and reliable methods. The fuzzy logic extends our goal to obtain more sensitive results in this regard. The steps of FTOPSIS are described below.
Step 1: Construction of the decision matrix
Step 2: To evaluate the normalized fuzzy decision matrix:
where B and N.B stand for Benefit factors and Non-Benefit factors, respectively.
Step 3: To obtain the weighted fuzzy normalized matrix by multiplying the sub-factors’ fuzzy weights with the normalized fuzzy value:
where
Step 4: Calculate the Fuzzy Positive Ideal Solution (FPIS) and Fuzzy Negative Ideal Solution (FNIS) , where denotes the maximum value of and denotes the minimum value of :
where relates to the benefit factors and relates to the non-benefit factors.
Step 5: Determine the distance of the alternatives from the PIS and NIS. The two Euclidean distances for individual alternatives can be calculated as follows:
where d (.,.) denotes the distance between two fuzzy numbers.
Step 6: Determine the relative closeness to the ideal alternatives:
Step 7: Rank the alternatives:
The alternatives are ranked based on the score obtained by , and the larger value of signifies the better alternatives.
Now, we fix the Linguistic terms and the corresponding TFN in Table 1 as follows:
3. Empirical Study of Shopping Mall Site Selection
Enhanced modern lifestyle has changed the shopping style of people from small independent retail shops to shopping malls. The key importance lies in the fact that shopping malls provide many variations which the population demands. The customer finds comfort while shopping in malls, as under one roof they get exclusive clothing brands, department stores, food courts or restaurants, game section for children, multiplex, family salon and spa, etc. People get attracted towards shopping malls as it benefits the customer with window shopping too. Numerous conflicting factors and sub-factors impact the evaluation of the best site.
The main aim of the proposed research is to find the best location for the construction of a shopping mall from a given set of alternatives. The emerging choice of people over shopping malls builds great interest in investors to invest in shopping mall businesses. Choosing the best site from a set of different locations is tough, as individual locations have the corresponding robustness and flaws. Maximum return is the main aim of an investor, thus selection of the best site requires scientific as well as mathematical modeling in an uncertain and imprecise environment.
Accessibility is one of the major factors of site selection. One of the factors of selecting a shopping mall site is based on how visible it is from the highway and how much road connectivity it has. In case there is already huge traffic on the site, it will become difficult to construct anything new since traffic congestion is not liked by shoppers. In case the shopping mall site is faraway, then in order to increase footfall, a shuttle service, promotions, and reward programs will go a long way. A destination shopping mall is also a good concept since the land price can be optimized. To make it a success, the characteristics of the future customers such as age, income, and brand preferences need to be studied in detail since only then can the shopping mall be made to cater to the retail and leisure offerings alike. Configuration and size are also important factors for site selection since proper use of the catchment area will lead to maximization of resources. Mixed use developments are one of the most liked structures by the developers since the various segments complement each other and a synergy is achieved which helps in appropriate circulation of all asset classes. In the long run, the scope for further expansion must also be kept in mind. The shopping mall should have such an infrastructure which enables maximum utilization of space. Current and future competition, performance of the retail spaces, and the consumption patterns are some of the other factors which influence the site selection.
Considering the above discussed factors and sub-factors, to summing up more, discussion related to the factors and their sub-factors are done in a more elaborative way, as follows.
- Population Density
- (i)
- Population growth rate—The population of a particular place is an important factor [48,49,50] when considering the place as a building site for a shopping mall. The primary reason is that the greater the possibility of consumption in an area, the greater the predicted sales from the shopping mall, which in turn will increase the growth of the area and eventually lead to an increase in the happiness index. In case the area consists of people from the young and middle generations, then there are greater chances of good population growth, which in turn will lead to higher numbers of customers for the mall, thereby leading to a boom in the business.
- (i)
- Proximity to Metro—Having access to the metro will lead to an increase in the footfall in the mall. The reason is that greater connectivity of the mall acts as a catalyst for people who have the money and are looking for places to purchase from. The metro is also one of the most favored forms of transport by the younger generation since it is cost-friendly, has AC, reduces hassle of flagging down buses, and is available in greater numbers. In case the metro is not available, it creates a negative mindset in the customer’s mind as to the mall being in a remote place.
- (ii)
- Proximity to Railway—Railways are still one of the most widely used modes of transportation in India. If the shopping mall is situated near a Railway station, it will help people who have to do emergency buying or last-minute shopping. It also acts as a place of leisure for those who arrive earlier than their scheduled time and wish to roam nearby. This might lead to them suddenly chancing upon a product they would not have bought otherwise and doing an impulse buy. A large number of people doing an impulse buying will lead to a substantial income for the mall.
- (iii)
- Proximity to Highway—Highways are visualized as roads with long roads and trees on both sides. The opening up of a shopping mall on the highway will attract customers who go out for short journeys and wish to shop and relax themselves. It will also act as a boom for those who might suddenly need few things in the midst of their long drive. Further, the inter-district buses that have a drop and pick-up of customers from such places will also provide an influx of customers who might chance upon something fancy before resuming their journey.
- Regional Growth [49]
- (i)
- Administrative offices—Administrative offices are places where people are usually stuck at a 9–5 job. They do not wish to go to different standalone stores at the end of the day in order to purchase their necessities and prefer a shopping mall which has stores of different kinds under its roof. This leads to an increase in their sales since once a preference is formed by the employees of the office, it leads to them being loyal customers for at least as long as they work at that job.
- (ii)
- Business Hub—Shopping malls which are large in size and which have too many kinds of stores in it make the mall a business hub. For example, if the mall has a Café Coffee Day store, then it attracts people who wish to do a business meet or recruitment while sipping coffee. In case it so happens that the mall boasts of having apparels, stationery, grocery, food court, play pen, to name a few, then it leads the businesses to become interdependent, which leads the customer to get all his needs satisfied under one roof, which eventually boosts the business.
- (iii)
- School and college—Having schools and colleges nearby helps the mall receive youngsters in large numbers. Students these days have after school or after college classes which gives them some time to spend outside before going for their class. This time spent in the mall equals to small purchases done by the students which increases the revenue of the mall. Parents often wait outside the schools for their children’s classes to finish. During this time, the prospect of a shopping mall looks extremely appealing to them. Educators also frequently visit malls situated near their institutions since it provides a break-time respite from their schedule.
- (i)
- Land—Cost of the land needs to be such that the revenue earned from the mall can cover it many times over in a few years after its inception. Cost of the land varies in various places since land in an upcoming place will be more in valuation as compared to a land in a suburban place. Similarly, land around a disputed area might be lesser in cost as compared to a land in a non-disputed area. Moreover, it should be remembered that cost of land is a fixed cost and hence it should be recovered accordingly.
- (ii)
- Construction—The construction cost of the land should also be considered as a fixed cost since it is not every day that the mall will be constructed. Renovations, expansion, and extra floors might be added, but it will not be the same as a new construction, it will be considered as add-on’s. The materials chosen for construction should be of high quality so that it can withstand the perils of nature for a long time. Compromising with the construction aspect will bring a heavy cost to the mall later on.
- Attractive design
- (i)
- External design—The external design of the mall should be such that it is attractive, pleasing, and eye-catching at the first glance. The first thing the prospective customer looks at is the external design, which lays down the fact of whether it is a premium mall or a common one. In case the first thought is negative, it leads the customer to form a bad opinion mentally and he may undermine the mall saying that the products he is looking for are surely not available inside.
- (ii)
- Internal design—The internal design should be spacious as well as well-optimized. It means that in case a store needs a larger area and has the scope for an increase in sales, it should be provided with it if space is available, while simultaneously being smart enough to close down the stores which are performing poorly. Proper display of the products should be done so that the customer gets the desire to purchase whether he had a previous intent or not. Proper labeling of the floors and the stores should be done for easy accessibility of the customers.
- Provision for nearby Parking—Proper parking space availability serves as a major determinant for many buyers. In cases where adequate parking space is unavailable, it causes the customer to go and probably never come back. Moreover, the parking lot fee should also be reasonable and in line with the nearby areas so that people are not discouraged from parking in the mall and find their parking space elsewhere, since if such a situation arises, it will lead the customer to spend his money elsewhere.
- (i)
- Noise Pollution—Noise dims the brain cells and makes us move away from the source producing it. If an area has continuous noise pollution, then the people living there have a bad quality of life. In case the shopping mall is situated in such an area, it forms a bad impression on the prospective customers and they might not come for a revisit, which will lead to a loss of customers and revenue.
- (ii)
- Air Pollution—Air is the basic ingredient of human life. From the first breath that a baby takes which marks its arrival in the world to the last breath a person takes which marks his departure, the air quality is something which might make or break a person. Increased exposure to air pollution decreases the life span of an individual and hence, if the shopping mall is built in such a place which has air pollution, it will lead to difficulty in breathing for the customers and employees and will not be a hit for sure.
Now, in Table 2 we represent the factors and sub-factors of the associated problem as follows:
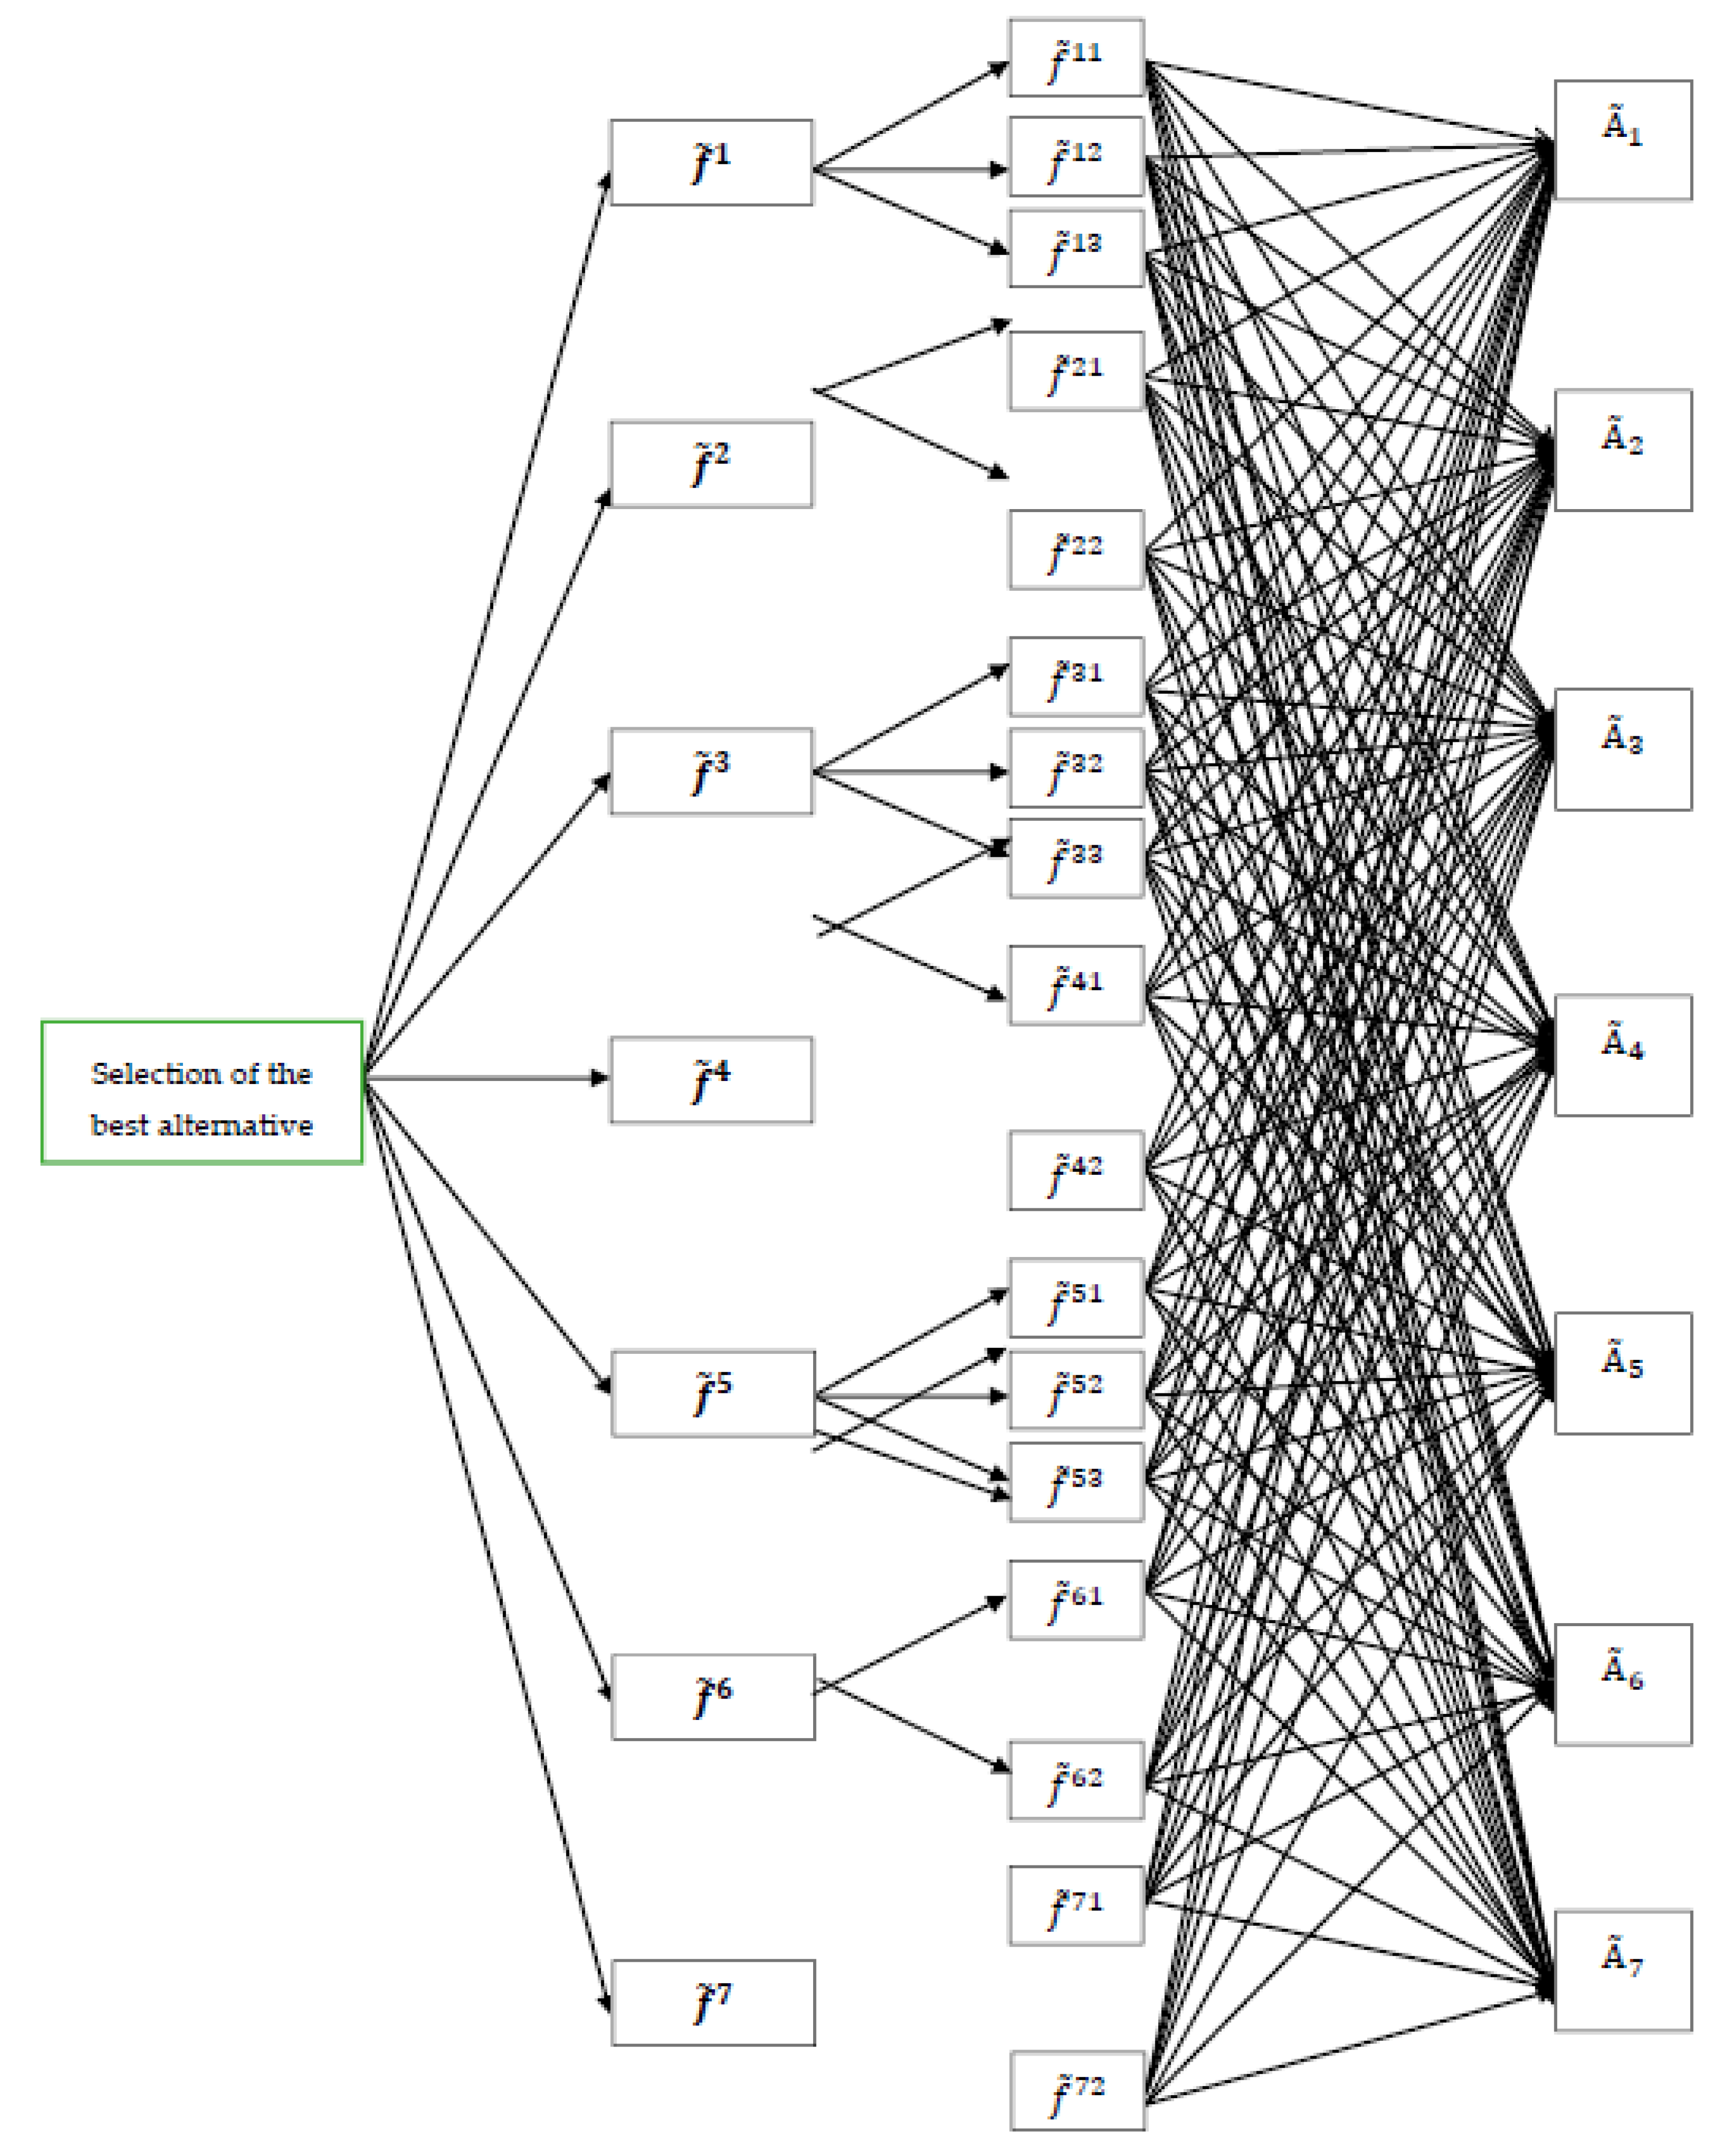
From Figure 3 we observe the relation between alternatives and factors or sub factors.
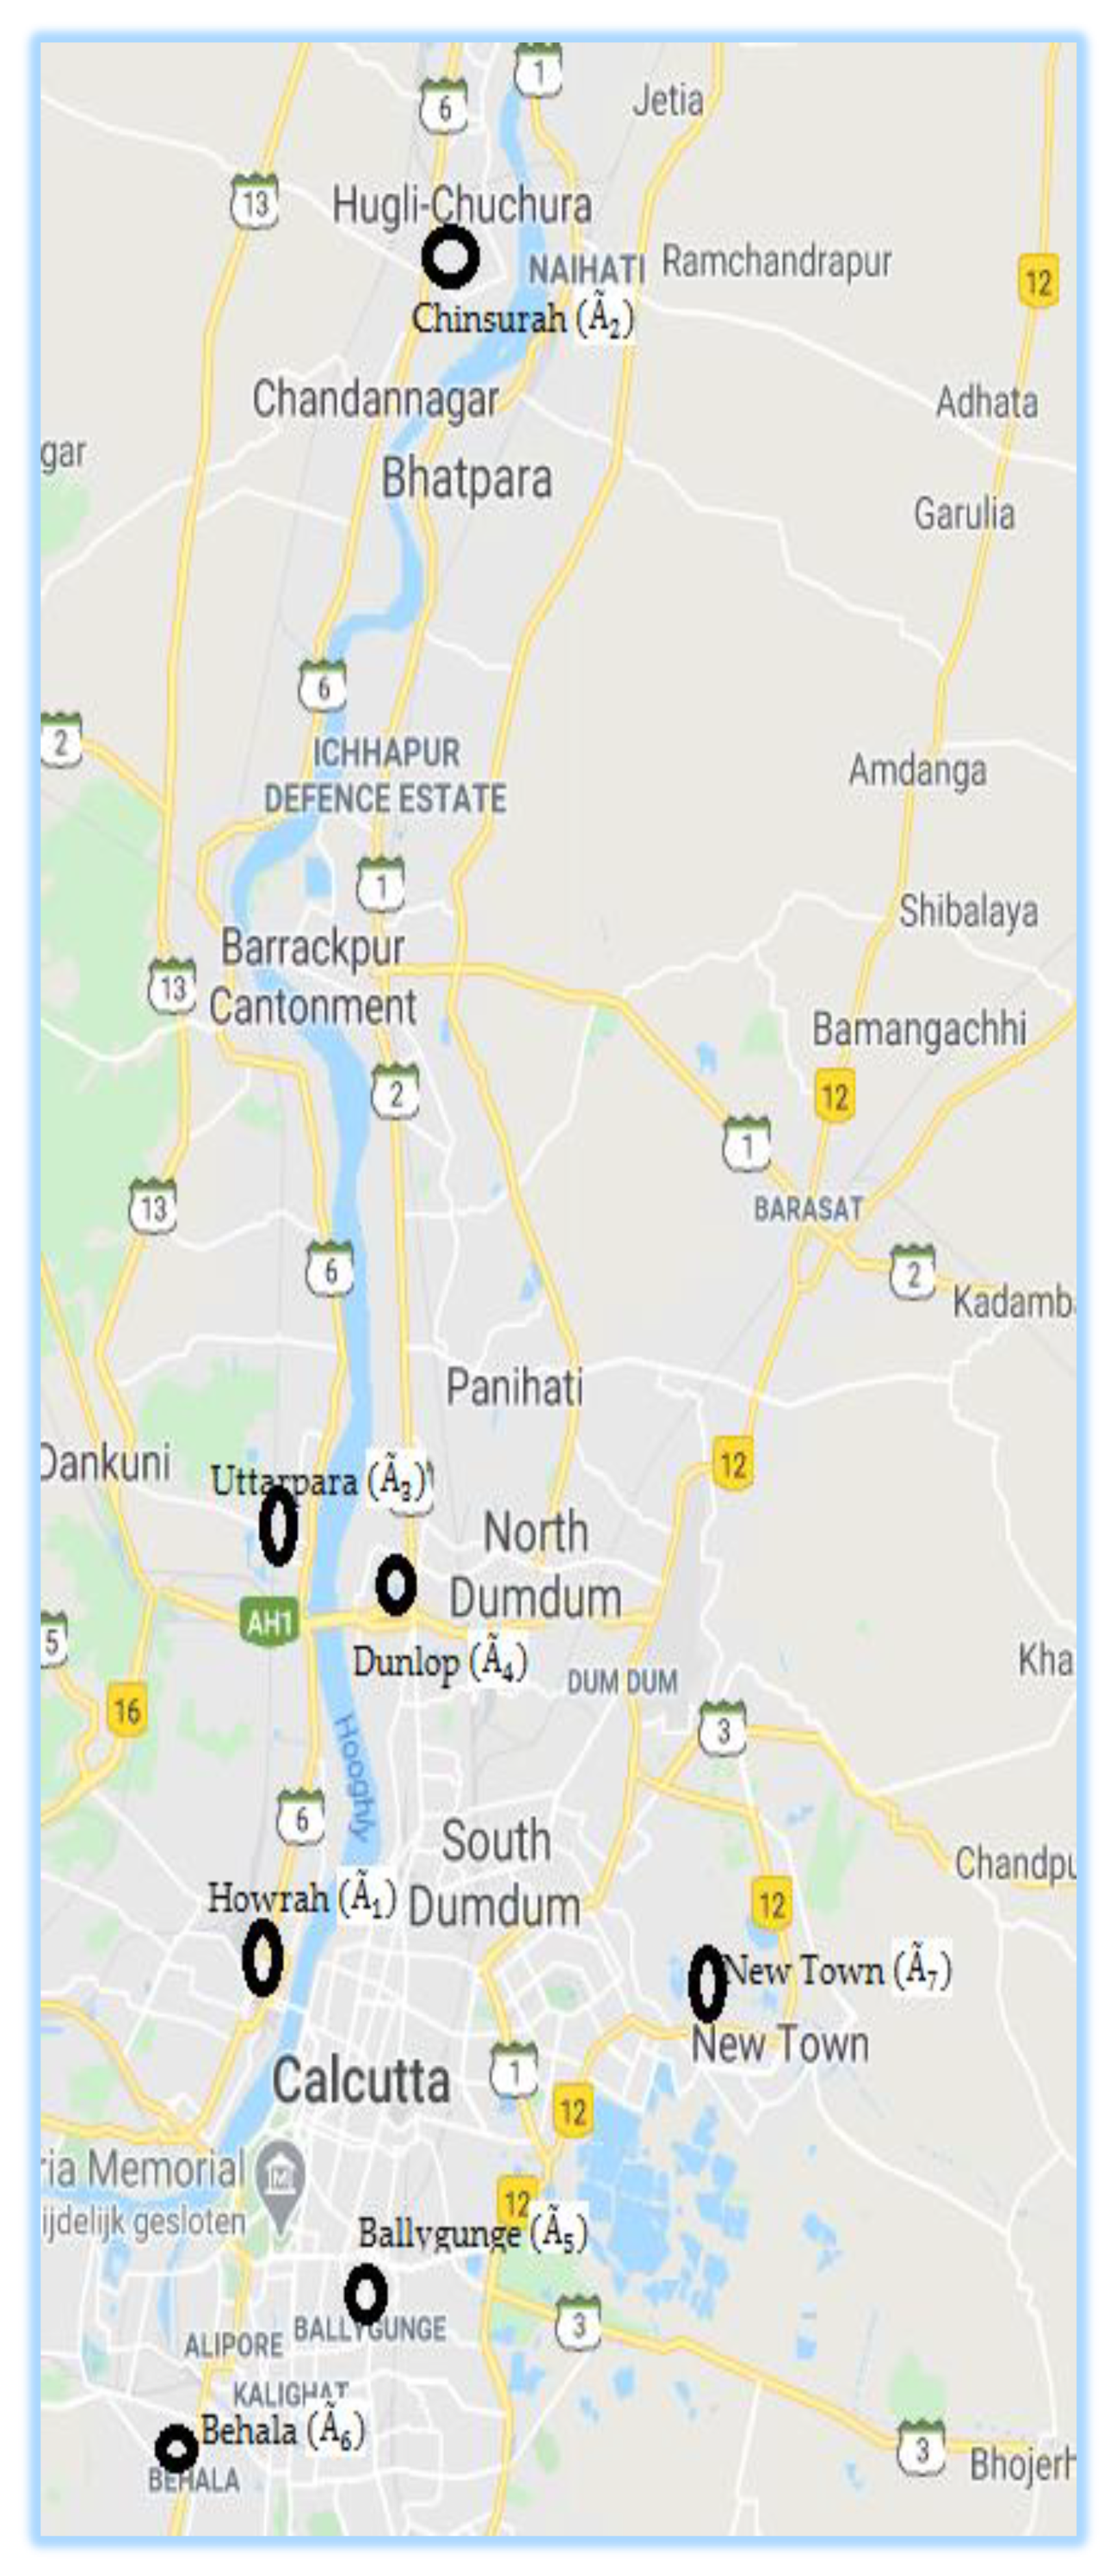
In the present research, different locations in and around Kolkata(Calcutta) are taken as alternatives. The alternatives selected are (the location is mentioned in Google map, presented in Figure 4):
- ➢
- Howrah
- ➢
- Chinsurah
- ➢
- Uttarpara
- ➢
- Dunlop
- ➢
- Ballygunge
- ➢
- Behala
- ➢
- New Town
3.1. Data Source for the Study
The data was collected from the various municipal authorities in the related locations of West Bengal. The municipal representatives were interviewed about the questions related to the factors and sub-factors of the shopping mall site selection problem. They provided information regarding population density and several important factors relevant for this research. The registrar of land, revenue, and expert architects were asked about the prevailing land price as it plays a vital role in site selection.
3.2. NumericalStudy
Step 1: We are now constructing Table 3 based on the comparison matrix with respect to factors using Table 1.
Step 2: Defuzzification of TFN
Here, signifies the preference display of the evaluator and signifies the risk factor of the uncertain conditions. The defuzzification step is performed as follows:
Applying the above-mentioned process, the calculation is conducted for all other elements and the defuzzified matrix is represented in Table 4.
The matrix was normalized using Equation (10) and then the priority weights for the factors were calculated using Equation (11). Finally, the Consistency Ratio(CR) values were obtained to determine the consistency of the matrix. The Table 5 depicts weights of the factors.
The factor “Regional Growth” scored the maximum weight of 0.26, whereas the factor “Provisions of nearby parking” scored the lowest weight.
In the similar order, the sub-factors’ matrices were obtained and their respective fuzzy weights were calculated in the exact process as those above. After obtaining the sub-factor fuzzy weights, global weight was computed by the product of individual sub-factor weight with the respective factor fuzzy weight. The global fuzzy weights obtained are ultimately required for ranking the best alternative using the FTOPSIS method. The Table 6 represents Global Fuzzy weights.
The global fuzzy sub-factors obtained will be used in ranking of the alternatives using TOPSIS. In this article, the factor “Cost”, “Environmental health” and the sub-factor “Parking rate per hour” are non-beneficial attributes, whereas the other factors and sub-factors are beneficial attributes. The steps of numerical FTOPSIS has been executed below.
Step 1: Preference of the alternatives with respect to the sub-factors in linguistic terms using Table 7.
The table constructed using Linguistic preference in terms of TFN of Table 7 is represented in Table 8.
Step 2: Normalizing of the matrix using Equation (14)
Step 3: Computation of weighted normalized matrix using Equation (15)
Keeping in mind the page layout, the Weighted normalized matrix of all the sub-factors has been divided into three tables (Table 9, Table 10 and Table 11).
Step 4: Determination of the Fuzzy Positive Ideal Solution (FPIS) and Fuzzy Negative Ideal Solution (FNIS) , where denotes the maximum value of and denotes the minimum value of .
Due to page layout, the Fuzzy Positive Ideal Solution (FPIS) and Fuzzy Negative Ideal Solution (FNIS) has been divided into three tables (Table 12, Table 13 and Table 14).
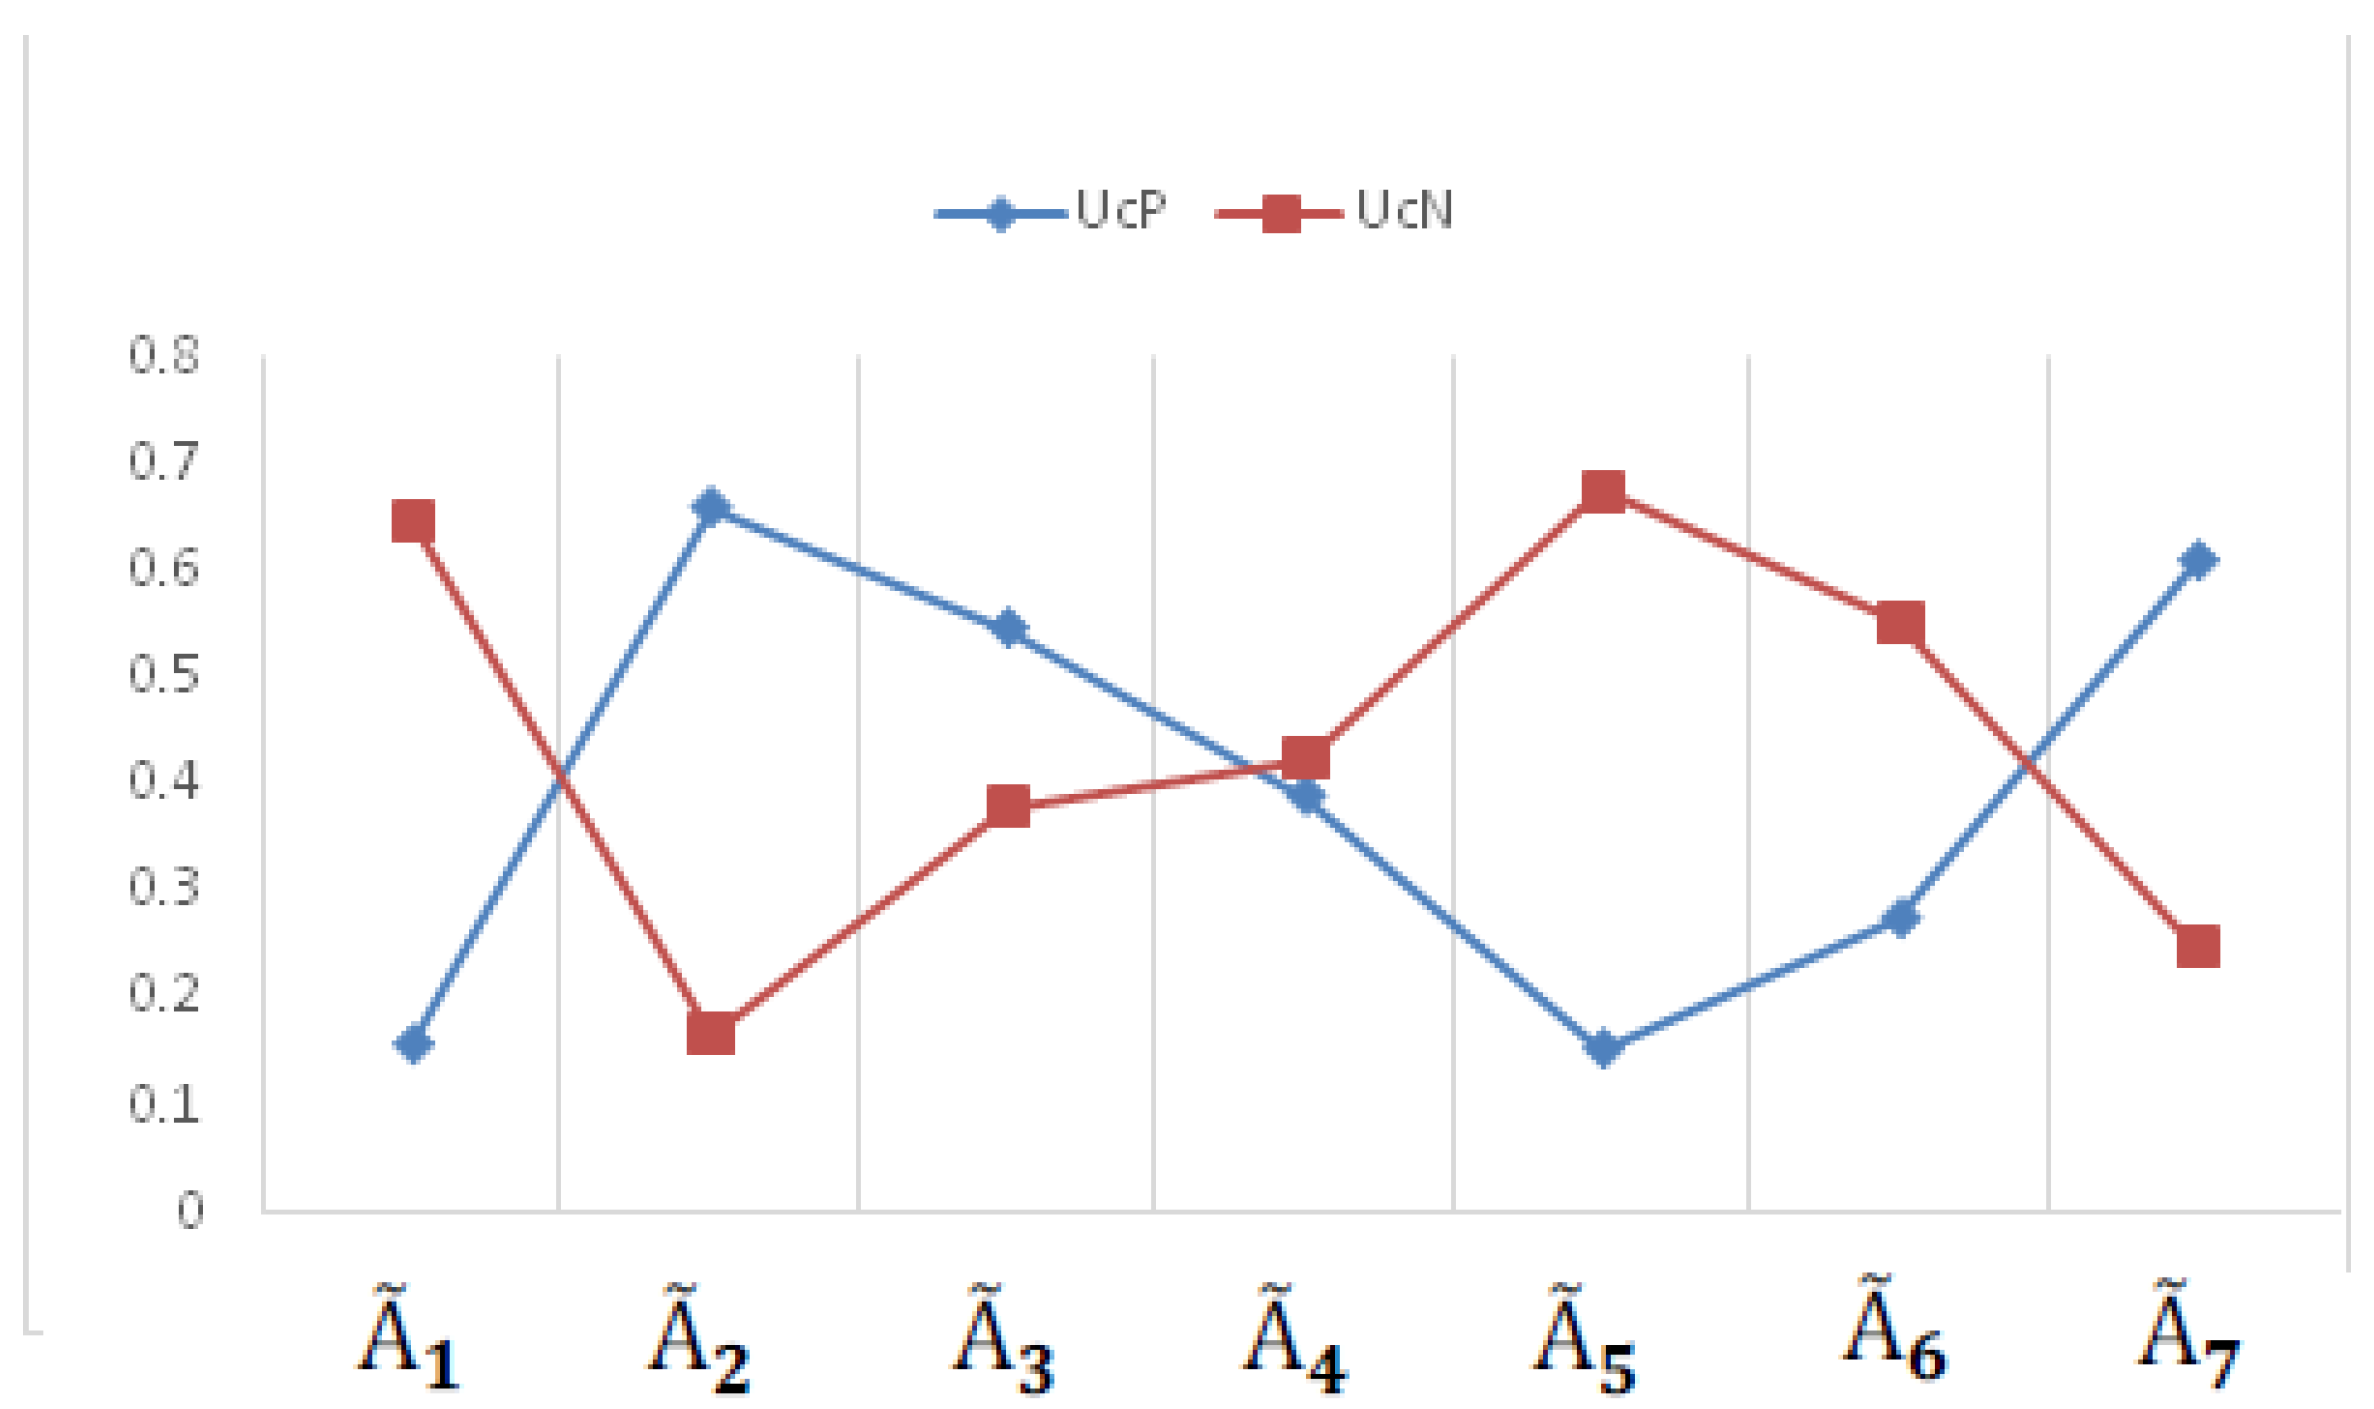
Table 15 describes the distance measure from FPIS, FNIS and relative closeness coefficient, as well as the final ranking.
The Relative Closeness ( depicts the ranking. From the Figure 5 we can see that the larger value of indicates the most preferred alternatives. In this study, the alternative scores the maximum value of 0.815, whereas, the alternative scores the lowest value of 0.203 The ranking is obtained on the basis of surveys conducted and data analysis performed. Further sensitivity analysis is conducted to assess the impact of modified weights for different factors and sub-factors.
4. Sensitivity Analysis and Numerical Simulation
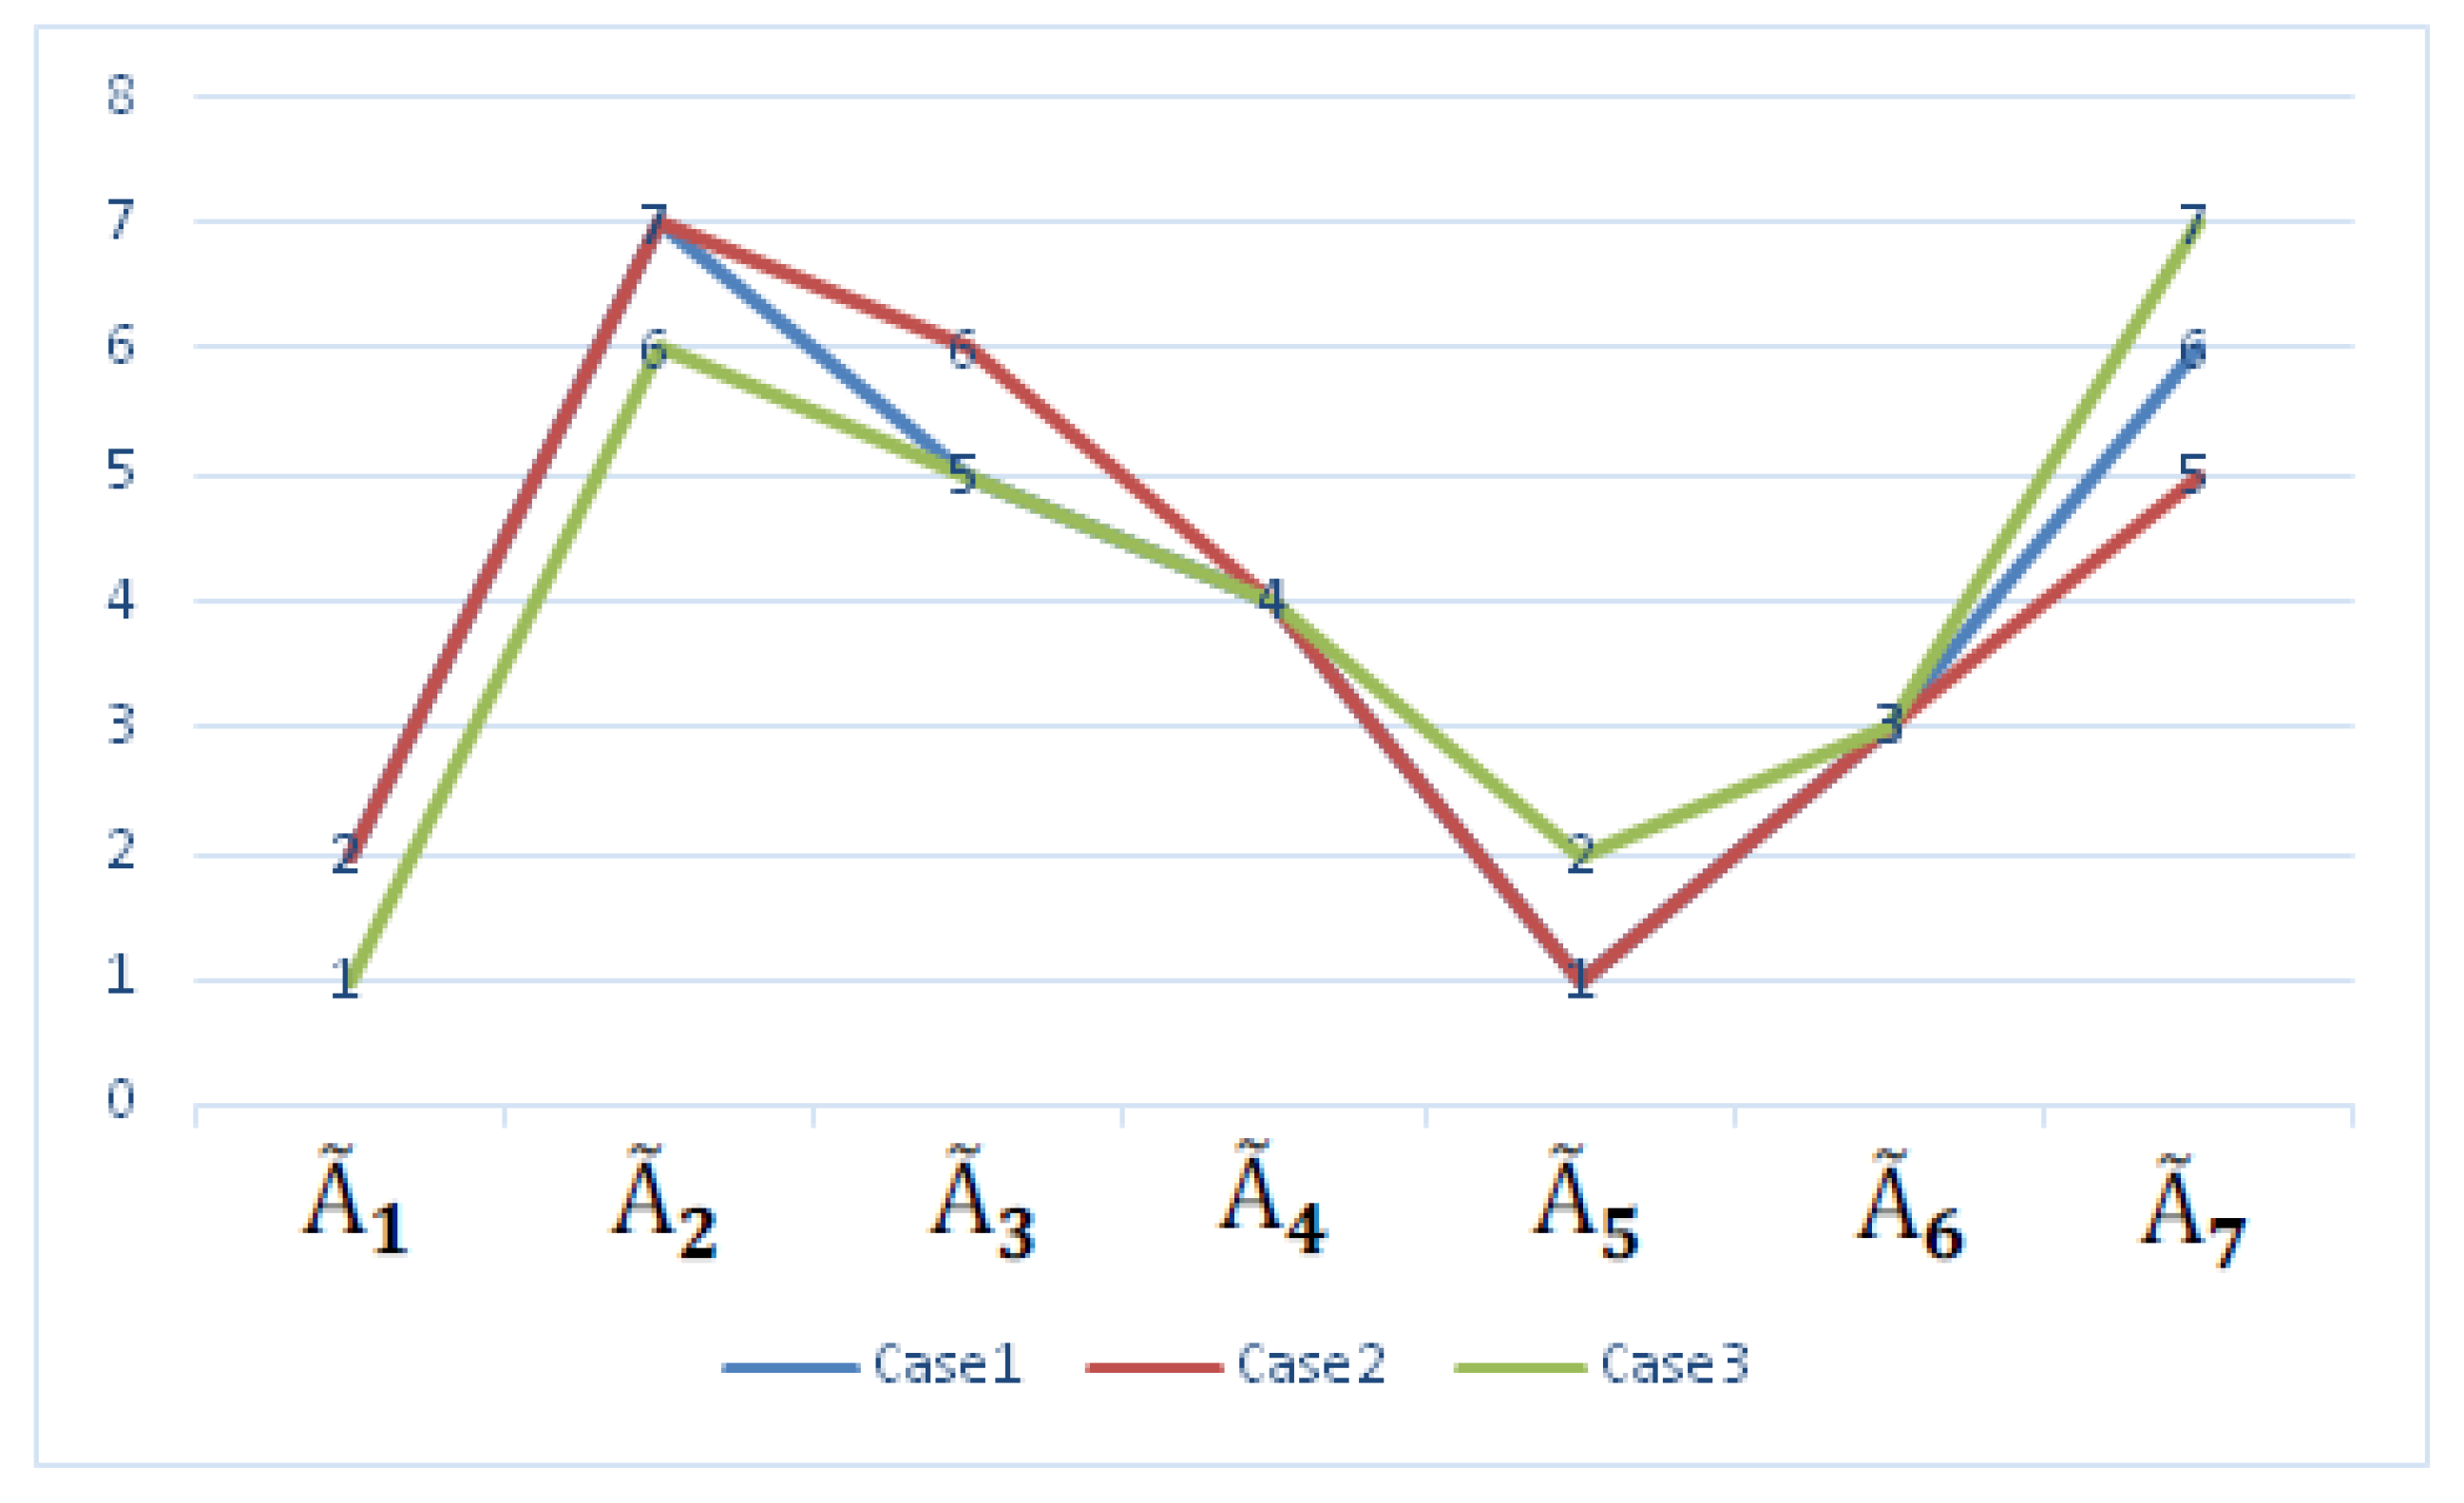
The results of the final ranking are summarized in Table 16. The best shopping mall site selection is . To analyze the impact, due to interchange of sub-factors’ weight or elimination of certain sub-factors, sensitivity analysis was conducted. The different rankings obtained are depicted in Table 16 and Figure 6
In the analysis, three cases are taken:
Case 1: The sub-factors Current population density ( and Administrative offices ( fuzzy weights were interchanged; thus, a different ranking was obtained.
Case 2: The sub-factors Capacity of the parking space and Parking rate per hour were eliminated, as these factors are vital, elimination of these yields different ranking.
Case 3: The sub-factors Noise Pollution ( and Air Pollution ( were eliminated and thus a different ranking was obtained.
Sensitivity analysis shows that different weightages for sub-factors leads to changes in the rankings. These rankings obtained through sensitivity analysis clearly depict the sensitive nature of the optimal ranking based on market dynamics. Change in the environmental factors and socio-economic scenario in the proposed area under consideration leads to changes in the rankings.
5. Discussion
Generation of employment is one of the economic factors of a shopping mall. They create direct as well as indirect employment. Direct employment means the jobs which are directly employed within the establishment and indirect employment are the jobs which are created because of the establishment such as logistics, supplies from local stores, cleaners, and guards, to name a few. Additionally, the income received by these workers are spent on the local shops and services which acts as a multiplier for the economy since the malls lead to income generation for the workers as well as the local businesses, thus uplifting the economy of the area. According to our study, Ballygunge , located on the heart of the city of Kolkata, is the best site for shopping mall construction as it has the maximum relative closeness coefficient, followed by Howrah , Behala , Dunlop , Uttarpara , New Town and Chinsurah .
6. Conclusions
Shopping mall site selection can be identified as a critical phenomenon as it can affect the environmental and social-economic factors. The optimal site selection is a complex complicated process as the decision experts must have a broader view and knowledge about the factors and sub-factors, some are quantitative, and few are imprecise qualitative. The desired site enables the investors to invest as it benefits them with the maximum return. Building a shopping mall involves a huge amount of investment. For a developer, selecting the right site is of paramount importance. Precise site selection will lead to profitability of the investor, otherwise it will be disastrous. Proper site selection will ensure larger footfall; thus, a large population will benefit and the economy of the region will get a boost. An improper selection of site will result in a loss to the investor which will have a cascading negative impact over the economy. A shopping mall built in an improper location will face difficulty in selling their floor areas and the purchasers of the floor areas will face losses due to inadequate tread, leading to an unsustainable existence. The application takes into account more of the sub-factors than the factors. A detailed study was carried out in respect of the attributes. A highly knowledgeable, skilled, experienced expert’s opinion has been taken into consideration regarding factors and sub-factors for the preferential ranking of the alternatives. The MCDM techniques FAHP and FTOPSIS were used to select the best location. The study used sub-factors for ranking of the alternatives. Seven locations around the city of Kolkata (Calcutta), West Bengal, were considered in the study, where conflicting preferences regarding criteria and sub-criteria exist. Thus, these MCDM techniques can be considered as a practical approach to rank the best site, when multiple complex imprecise constraints exist. Sensitivity analysis gives a clear idea regarding influence of market dynamics in the ranking process. The result of FTOPSIS and sensitivity analysis obtained showed that the ‘Ballygunge’ region of Kolkata is the superior alternative for shopping mall site selection. The possible explanation for the best ranking is that ‘Ballygunge’ is one of the most developed regions in Kolkata and excels in a majority of the factors and sub-factors considered in this study. Thus, the rank of ‘Ballygunge’ region scored a spot of 1 with our ranking method and 1 or 2 under sensitivity analysis.
For future research, a group of decision-makers can be used for the evaluation. Depending on the locations, factors can be added or removed. Different MCDM techniques such as Preference Ranking Organization Method for Enrichment Evaluation (PROMETHEE), Vlse Kriterijumska Optimizacija I Kompromisno Resenje (VIKOR), etc., can be applied with fuzzy logic, interval number, hesitant fuzzy sets (HFS), etc. This research can be extended as a practical approach for ranking the alternatives considering various conflicting factors and sub-factors for real-life problems like super-specialty hospital site selection, sports academy site selection, etc.
Author Contributions
Conceptualization, N.G., E.A.A. and S.P.M.; Data curation, A.G.; Formal analysis, A.G. and S.P.M.; Investigation, N.G., E.A.A. and S.P.M.; Methodology, A.G., E.A.A. and S.P.M.; Project administration, S.P.M.; Writing—review & editing, A.K.S. All authors have read and agreed to the published version of the manuscript.
Funding
This research received no external funding.
Acknowledgments
The third author gratefully acknowledge the support of the University of Tabuk, Ministry of Education in Saudi Arabia.
Conflicts of Interest
The authors declare no conflict of interest.
References
- Satty, T.L. The Analytic Hierarchy Process; McGraw-Hill: New York, NY, USA, 1980. [Google Scholar]
- Hwang, C.L.; Yoon, K. Methods for multiple attribute decision making. In Multiple Attribute Decision Making; Springer: Berlin/Heidelberg, Germany, 1981; pp. 58–191. [Google Scholar]
- Garg, H. A new generalized improved score function of interval-valued intuitionistic fuzzy sets and applications in expert systems. Appl. Soft Comput. 2016, 38, 988–999. [Google Scholar] [CrossRef]
- Kumar, K.; Garg, H. TOPSIS method based on the connection number of set pair analysis under interval-valued intuitionistic fuzzy set environment. Comput. Appl. Math. 2018, 37, 1319–1329. [Google Scholar]
- Sarkar, B. An inventory model with reliability in an imperfect production process. Appl. Math. Comput. 2012, 218, 4881–4891. [Google Scholar]
- Sarkar, B.; Sana, S.S.; Chaudhuri, K. An imperfect production process for time varying demand with inflation and time value of money—An EMQ model. Expert Syst. Appl. 2011, 38, 13543–13548. [Google Scholar] [CrossRef]
- Abdel-Basset, M.; Mohamed, M.; Smarandache, F. An extension of neutrosophic AHP–SWOT analysis for strategic planning and decision-making. Symmetry 2018, 10, 116. [Google Scholar] [CrossRef] [Green Version]
- Selvachandran, G.; Quek, S.G.; Smarandache, F.; Broumi, S. An extended technique for order preference by similarity to an ideal solution (TOPSIS) with maximizing deviation method based on integrated weight measure for single-valued neutrosophic sets. Symmetry 2018, 10, 236. [Google Scholar] [CrossRef] [Green Version]
- Sodhi, B.; Prabhakar, T.V. A simplified description of Fuzzy TOPSIS. arXiv 2012, arXiv:1205.5098. [Google Scholar]
- Cheng, E.W.; Li, H.; Yu, L. A GIS approach to shopping mall location selection. Build. Environ. 2007, 42, 884–892. [Google Scholar] [CrossRef]
- Raajpoot, N.A.; Sharma, A.; Chebat, J.C. The role of gender and work status in shopping center patronage. J. Bus. Res. 2008, 61, 825–833. [Google Scholar] [CrossRef]
- DeLisle, J.R. US shopping center classifications: Challenges and opportunities. Res. Rev. 2005, 12, 96–101. [Google Scholar]
- Allard, T.; Babin, B.J.; Chebat, J.C. When income matters: Customers evaluation of shopping malls’ hedonic and utilitarian orientations. J. Retail. Consum. Serv. 2009, 16, 40–49. [Google Scholar] [CrossRef]
- Severin, V.; Louviere, J.J.; Finn, A. The stability of retail shopping choices over time and across countries. J. Retail. 2001, 77, 185–202. [Google Scholar] [CrossRef]
- Connell, B.R. The Principles of Universal Design, Version 2.0; Trade Press Publishing Corporation: Milwaukee, WI, USA, 1997; Available online: http://www.design.Ncsu.edu/cud/univ.design/princoverviewhtml (accessed on 20 July 2020).
- Story, M.F. Maximizing usability: The principles of universal design. Assist. Technol. 1998, 10, 4–12. [Google Scholar] [CrossRef] [PubMed]
- Stephanidis, C.; Savidis, A. Universal access in the information society: Methods, tools, and interaction technologies. Univers. Access Inf. Soc. 2001, 1, 40–55. [Google Scholar] [CrossRef]
- Zajicek, M.; Brewster, S. Design Principles to Support Older Adults; Springer: Berlin/Heidelberg, Germany, 2004. [Google Scholar]
- Yılmaz Kaya, B.; Dağdeviren, M. Selecting occupational safety equipment by MCDM approach considering universal design principles. Hum. Factors Ergon. Manuf. Serv. Ind. 2016, 26, 224–242. [Google Scholar] [CrossRef]
- Darses, F.; Wolff, M. How do designers represent to themselves the users’ needs? Appl. Ergon. 2006, 37, 757–764. [Google Scholar] [CrossRef]
- Vink, P. (Ed.) Comfort and Design: Principles and Good Practice; CRC Press: Boca Raton, FL, USA, 2004. [Google Scholar]
- Ahmed, Z.U.; Ghingold, M.; Dahari, Z. Malaysian shopping mall behavior: An exploratory study. Asia Pac. J. Mark. Logist. 2007, 19, 331–348. [Google Scholar] [CrossRef]
- Aćimović, S.; Mijušković, V. Key logistics location selection factors in retail business. Ekon. Ideje Praksa 2016, 19, 57–70. [Google Scholar]
- Făgărăşan, M.; Cristea, C. Logistics center location: Selection using multicriteria decision making. Ann. Univ. Oradea Fascicle Manag. Technol. Eng. 2015, 24, 157–162. [Google Scholar] [CrossRef]
- Durmuş, A.; Turk, S.S. Factors influencing location selection of warehouses at the intra-urban level: Istanbul case. Eur. Plan. Stud. 2014, 22, 268–292. [Google Scholar] [CrossRef]
- Yang, J.; Lee, H. An AHP decision model for facility location selection. Facilities 1997, 15, 241–254. [Google Scholar] [CrossRef]
- Önüt, S.; Soner, S. Transshipment site selection using the AHP and TOPSIS approaches under fuzzy environment. Waste Manag. 2008, 28, 1552–1559. [Google Scholar] [CrossRef] [PubMed]
- Wang, C.N.; Huang, Y.F.; Chai, Y.C.; Nguyen, V.T. A multi-criteria decision making (MCDM) for renewable energy plants location selection in Vietnam under a fuzzy environment. Appl. Sci. 2018, 8, 2069. [Google Scholar] [CrossRef] [Green Version]
- Senvar, O.; Otay, I.; Bolturk, E. Hospital site selection via hesitant fuzzy TOPSIS. IFAC-PapersOnLine 2016, 49, 1140–1145. [Google Scholar] [CrossRef]
- Suárez-Vega, R.; Santos-Peñate, D.R.; Dorta-González, P. Location models and GIS tools for retail site location. Appl. Geogr. 2012, 35, 12–22. [Google Scholar] [CrossRef]
- Nema, A.K.; Gupta, S.K. Optimization of regional hazardous waste management systems: An improved formulation. Waste Manag. 1999, 19, 441–451. [Google Scholar] [CrossRef]
- Hauser, J.R.; Koppelman, F.S. Alternative perceptual mapping techniques: Relative accuracy and usefulness. J. Mark. Res. 1979, 16, 495–506. [Google Scholar] [CrossRef]
- Terblanché, N.S. The perceived benefits derived from visits to a super regional shopping centre: An exploratory study. S. Afr. J. Bus. Manag. 1999, 30, 141–146. [Google Scholar] [CrossRef]
- Farahani, R.Z.; SteadieSeifi, M.; Asgari, N. Multiple criteria facility location problems: A survey. Appl. Math. Model. 2010, 34, 1689–1709. [Google Scholar] [CrossRef]
- Cheng, S.; Chan, C.W.; Huang, G.H. Using multiple criteria decision analysis for supporting decisions of solid waste management. J. Environ. Sci. Health Part A 2002, 37, 975–990. [Google Scholar] [CrossRef]
- Aktas, A.; Kabak, M. A model proposal for locating wind turbines. Procedia Comput. Sci. 2016, 102, 426–433. [Google Scholar] [CrossRef] [Green Version]
- Uyan, M. GIS-based solar farms site selection using analytic hierarchy process (AHP) in Karapinar region, Konya/Turkey. Renew. Sustain. Energy Rev. 2013, 28, 11–17. [Google Scholar] [CrossRef]
- Oztaysi, B. A decision model for information technology selection using AHP integrated TOPSIS-Grey: The case of content management systems. Knowl. Based Syst. 2014, 70, 44–54. [Google Scholar] [CrossRef]
- Liu, S.; Chan, F.T.; Ran, W. Multi-attribute group decision-making with multi-granularity linguistic assessment information: An improved approach based on deviation and TOPSIS. Appl. Math. Model. 2013, 37, 10129–10140. [Google Scholar] [CrossRef]
- Abid, F.; Bahloul, S. Selected MENA countries’attractiveness to G7 investors. Econ. Model. 2011, 28, 2197–2207. [Google Scholar] [CrossRef] [Green Version]
- Papadopoulos, A.; Karagiannidis, A. Application of the multi-criteria analysis method Electre III for the optimisation of decentralised energy systems. Omega 2008, 36, 766–776. [Google Scholar] [CrossRef]
- Chen, C.T.; Pai, P.F.; Hung, W.Z. An integrated methodology using linguistic PROMETHEE and maximum deviation method for third-party logistics supplier selection. Int. J. Comput. Intell. Syst. 2010, 3, 438–451. [Google Scholar] [CrossRef]
- Li, M.; Jin, L.; Wang, J. A new MCDM method combining QFD with TOPSIS for knowledge management system selection from the user’s perspective in intuitionistic fuzzy environment. Appl. Soft Comput. 2014, 21, 28–37. [Google Scholar] [CrossRef]
- Liu, C.H.; Tzeng, G.H.; Lee, M.H. Improving tourism policy implementation–The use of hybrid MCDM models. Tour. Manag. 2012, 33, 413–426. [Google Scholar] [CrossRef]
- Kanapeckiene, L.; Kaklauskas, A.; Zavadskas, E.K.; Seniut, M. Integrated knowledge management model and system for construction projects. Eng. Appl. Artif. Intell. 2010, 23, 1200–1215. [Google Scholar] [CrossRef]
- Zadeh, L.A. Fuzzy sets. Inf. Control 1965, 8, 338–353. [Google Scholar] [CrossRef] [Green Version]
- Chang, C.W.; Wu, C.R.; Lin, H.L. Applying fuzzy hierarchy multiple attributes to construct an expert decision making process. Expert Syst. Appl. 2009, 36, 7363–7368. [Google Scholar] [CrossRef]
- Cheng, E.W.; Li, H.; Yu, L. The analytic network process (ANP) approach to location selection: A shopping mall illustration. Constr. Innov. 2005, 5, 83–98. [Google Scholar] [CrossRef]
- Erdin, C.; Akbaş, H.E. A comparative analysis of fuzzy topsis and geographic information systems (gis) for the location selection of shopping malls: A case study from turkey. Sustainability 2019, 11, 3837. [Google Scholar] [CrossRef] [Green Version]
- Kazemi, A.; Amiri, M. Selecting Shopping Center Site Using MADM Techniques. In Proceedings of the International Conference on Education, E-Governance, Law and Business, Dubai, UAE, 1–2 January 2017. [Google Scholar]
Figure 1.
Flow chart for the proposed study.

Figure 2.
Diagram representing Triangular Fuzzy Number (TFN), .

Figure 3.
Hierarchical Structure representing the alternatives with factors and sub-factors.

Figure 4.
The symbol ![Mathematics 08 01380 i001]() in Google maps represents different site locations considered in and around the city of Kolkata(Calcutta) for this study.
in Google maps represents different site locations considered in and around the city of Kolkata(Calcutta) for this study.
 in Google maps represents different site locations considered in and around the city of Kolkata(Calcutta) for this study.
Figure 4.
The symbol ![Mathematics 08 01380 i001]() in Google maps represents different site locations considered in and around the city of Kolkata(Calcutta) for this study.
in Google maps represents different site locations considered in and around the city of Kolkata(Calcutta) for this study.
in Google maps represents different site locations considered in and around the city of Kolkata(Calcutta) for this study.
Figure 5.
The geometric distance from FPIS and FNIS using Table 15.
Figure 5.
The geometric distance from FPIS and FNIS using Table 15.

Figure 6.
Ranking of alternate sites as per different cases of Sensitivity Analysis from Table 16.
Figure 6.
Ranking of alternate sites as per different cases of Sensitivity Analysis from Table 16.


Table 1.
Linguistic terms and the corresponding TFN.
| Scale Definition | TFN Scale | TFN Reciprocal Scale |
|---|---|---|
| Just Equal | (1,1,1) | (1,1,1) |
| Equally Important | (1/2,1,3/2) | (2/3,1,2) |
| Fairly Important | (3/2,2,5/2) | (2/5,1/2,2/3) |
| Strongly Important | (5/2,3,7/2) | (2/7,1/3,2/5) |
| Strongly more Important | (7/2,4,9/2) | (2/9,1/4,2/7) |
| Absolutely Important | (5,5,5) | (1/5,1/5,1/5) |
Table 2.
Representing the factors and sub-factors.
|
|
|
|
|
|
|
|
|
|
|
|
|
|
Table 3.
Construction of the comparison matrix with respect to factors using Table 1.
Table 3.
Construction of the comparison matrix with respect to factors using Table 1.
Table 4.
Defuzzified comparison matrix.
Table 5.
The factors’ obtained weights.
| Factors | |||||||
|---|---|---|---|---|---|---|---|
| Priority Weight | 0.141 | 0.15 | 0.26 | 0.115 | 0.063 | 0.15 | 0.125 |
Table 6.
Representing Global Fuzzy weights.
| Factors’ Fuzzy Weight | Sub-Factors’ Fuzzy Weight | Global Fuzzy Weight |
|---|---|---|
Table 7.
Linguistic preference in terms of TFN.
| Linguistic Variable | TFN |
|---|---|
| Excellent (E) | (7,9,9) |
| Good (G) | (5,7,9) |
| Fair (F) | (3,5,7) |
| Poor (P) | (1,3,5) |
| Very Poor (VP) | (1,1,3) |
Table 8.
Construction of decision matrix in terms of linguistic terms using Table 7.
Table 8.
Construction of decision matrix in terms of linguistic terms using Table 7.
Table 9.
Weighted normalized matrix for factor 1 and 2
| 0.007,0.02,0.04 | 0.006,0.03,0.08 | 0.023,0.07,0.16 | 0.023,0.07,0.22 | 0.015,0.07,0.19 | |
| 0.003,0.01,0.03 | 0.006,0.03,0.08 | 0.009,0.04,0.12 | 0.009,0.04,0.17 | 0.01,0.05,0.19 | |
| 0.005,0.015,0.04 | 0.015,0.05,0.11 | 0.009,0.04,0.12 | 0.009,0.04,0.17 | 0.01,0.05,0.19 | |
| 0.007,0.02,0.04 | 0.01,0.04,0.11 | 0.016,0.05,0.12 | 0.023,0.07,0.22 | 0.01,0.05,0.19 | |
| 0.007,0.02,0.04 | 0.015,0.05,0.11 | 0.009,0.04,0.12 | 0.023,0.07,0.22 | 0.015,0.07,0.19 | |
| 0.007,0.02,0.04 | 0.01,0.04,0.11 | 0.023,0.07,0.16 | 0.016,0.05,0.22 | 0.01,0.05,0.19 | |
| 0.001,0.006,0.022 | 0.01,0.04,0.11 | 0.009,0.04,0.12 | 0.009,0.04,0.17 | 0.01,0.05,0.19 |
Table 10.
Weighted normalized matrix for factor 3, 4 and 5
| 0.01, 0.04, 0.09 | 0.03, 0.07, 0.22 | 0.03, 0.09, 0.28 | 0.001, 0.003, 0.008 | 0.02, 0.04, 0.10 | 0.001, 0.004, 0.12 | |
| 0.01, 0.04, 0.09 | 0.02, 0.05, 0.17 | 0.02, 0.06, 0.22 | 0.001, 0.005, 0.01 | 0.02, 0.04, 0.10 | 0.002, 0.005, 0.015 | |
| 0.002, 0.013, 0.05 | 0.005, 0.01, 0.07 | 0.03, 0.09, 0.28 | 0.002, 0.008, 0.01 | 0.02, 0.06, 0.164 | 0.002, 0.005, 0.015 | |
| 0.002, 0.013, 0.05 | 0.02, 0.05, 0.17 | 0.03, 0.09, 0.28 | 0.001, 0.003, 0.008 | 0.02, 0.06, 0.164 | 0.002, 0.005, 0.015 | |
| 0.006, 0.02, 0.07 | 0.02, 0.05, 0.17 | 0.03, 0.09, 0.28 | 0.001, 0.001, 0.003 | 0.02, 0.02, 0.02 | 0.003, 0.007, 0.015 | |
| 0.006, 0.02, 0.07 | 0.02, 0.05, 0.17 | 0.03, 0.09, 0.28 | 0.001, 0.003, 0.008 | 0.02, 0.04, 0.10 | 0.002, 0.005, 0.015 | |
| 0.002, 0.013, 0.05 | 0.02, 0.05, 0.17 | 0.005, 0.04, 0.154 | 0.001, 0.005, 0.01 | 0.02, 0.06, 0.164 | 0.001, 0.004, 0.12 |
Table 11.
Weighted normalized matrix for factor 5, 6 and 7.
| 0.007, 0.01, 0.051 | 0.001, 0.009, 0.04 | 0.001, 0.003, 0.02 | 0.008, 0.024, 0.08 | 0.002, 0.007, 0.03 | 0.002, 0.007, 0.02 | |
| 0.004, 0.011, 0.04 | 0.001, 0.009, 0.04 | 0.001, 0.003, 0.02 | 0.01, 0.04, 0.234 | 0.004, 0.02, 0.212 | 0.006, 0.06, 0.184 | |
| 0.004, 0.011, 0.04 | 0.005, 0.016, 0.05 | 0.001, 0.01, 0.03 | 0.008, 0.024, 0.08 | 0.004, 0.02, 0.212 | 0.003, 0.01, 0.06 | |
| 0.004, 0.011, 0.04 | 0.007, 0.02, 0.066 | 0.008, 0.02, 0.057 | 0.01, 0.04, 0.234 | 0.002, 0.007, 0.03 | 0.002, 0.007, 0.02 | |
| 0.009, 0.02, 0.051 | 0.007, 0.02, 0.066 | 0.01, 0.03, 0.057 | 0.006, 0.01, 0.03 | 0.002, 0.008, 0.04 | 0.002, 0.008, 0.04 | |
| 0.007, 0.01, 0.051 | 0.005, 0.016, 0.05 | 0.001, 0.01, 0.03 | 0.006, 0.02, 0.05 | 0.003, 0.012, 0.07 | 0.002, 0.008, 0.04 | |
| 0.009, 0.02, 0.051 | 0.01, 0.029, 0.066 | 0.01, 0.03, 0.057 | 0.008, 0.024, 0.08 | 0.007, 0.06, 0.212 | 0.006, 0.06, 0.184 |
Table 12.
First part of Fuzzy Positive Ideal Solution (FPIS) and Fuzzy Negative Ideal Solution (FNIS).
Table 12.
First part of Fuzzy Positive Ideal Solution (FPIS) and Fuzzy Negative Ideal Solution (FNIS).
| 0.007, 0.02, 0.04 | 0.015, 0.05, 0.11 | 0.023, 0.07, 0.16 | 0.023, 0.07, 0.22 | 0.015, 0.07, 0.19 | 0.01, 0.04, 0.09 | |
| 0.001, 0.006,0.022 | 0.006, 0.03, 0.08 | 0.009, 0.04, 0.12 | 0.009, 0.04, 0.17 | 0.01, 0.05, 0.19 | 0.002, 0.013, 0.05 |
Table 13.
Second part of FPIS and FNIS.
| 0.03, 0.07, 0.22 | 0.03, 0.09, 0.28 | 0.001, 0.001, 0.003 | 0.02, 0.02, 0.02 | 0.003, 0.007, 0.12 | 0.009, 0.02, 0.051 | |
| 0.005, 0.01, 0.07 | 0.005, 0.04, 0.154 | 0.002, 0.008, 0.01 | 0.02, 0.06, 0.164 | 0.001, 0.004, 0.015 | 0.004, 0.01, 0.04 |
Table 14.
Third part of FPIS and FNIS.
| 0.01, 0.029, 0.066 | 0.01, 0.03, 0.057 | 0.006, 0.01, 0.03 | 0.002, 0.007, 0.03 | 0.002, 0.007, 0.02 | |
| 0.001, 0.009, 0.04 | 0.001, 0.003, 0.02 | 0.01, 0.04, 0.234 | 0.007, 0.06, 0.212 | 0.006, 0.06, 0.184 |
Table 15.
Calculation of Relative Closeness Coefficient (Final Ranking).
| Alternatives | Rank | |||
|---|---|---|---|---|
| 0.157 | 0.65 | 0.805 | 2 | |
| 0.66 | 0.168 | 0.203 | 7 | |
| 0.547 | 0.38 | 0.410 | 5 | |
| 0.39 | 0.425 | 0.521 | 4 | |
| 0.153 | 0.675 | 0.815 | 1 | |
| 0.275 | 0.553 | 0.668 | 3 | |
| 0.610 | 0.251 | 0.291 | 6 |
Table 16.
Different Rankings obtained under different cases.
| Alternatives | Case1 | Case2 | Case3 |
|---|---|---|---|
| 2 | 2 | 1 | |
| 7 | 7 | 6 | |
| 5 | 6 | 5 | |
| 4 | 4 | 4 | |
| 1 | 1 | 2 | |
| 3 | 3 | 3 | |
| 6 | 5 | 7 |
© 2020 by the authors. Licensee MDPI, Basel, Switzerland. This article is an open access article distributed under the terms and conditions of the Creative Commons Attribution (CC BY) license (http://creativecommons.org/licenses/by/4.0/).
Share and Cite
MDPI and ACS Style
Ghorui, N.; Ghosh, A.; Algehyne, E.A.; Mondal, S.P.; Saha, A.K. AHP-TOPSIS Inspired Shopping Mall Site Selection Problem with Fuzzy Data. Mathematics 2020, 8, 1380. https://0-doi-org.brum.beds.ac.uk/10.3390/math8081380
AMA Style
Ghorui N, Ghosh A, Algehyne EA, Mondal SP, Saha AK. AHP-TOPSIS Inspired Shopping Mall Site Selection Problem with Fuzzy Data. Mathematics. 2020; 8(8):1380. https://0-doi-org.brum.beds.ac.uk/10.3390/math8081380
Chicago/Turabian StyleGhorui, Neha, Arijit Ghosh, Ebrahem A. Algehyne, Sankar Prasad Mondal, and Apu Kumar Saha. 2020. "AHP-TOPSIS Inspired Shopping Mall Site Selection Problem with Fuzzy Data" Mathematics 8, no. 8: 1380. https://0-doi-org.brum.beds.ac.uk/10.3390/math8081380
Note that from the first issue of 2016, this journal uses article numbers instead of page numbers. See further details here.