MINE: Identifying Top-k Vital Nodes in Complex Networks via Maximum Influential Neighbors Expansion


Software College, Northeastern University, Shenyang 110169, China
*
Author to whom correspondence should be addressed.
Mathematics 2020, 8(9), 1449; https://0-doi-org.brum.beds.ac.uk/10.3390/math8091449
Submission received: 14 August 2020
/
Revised: 26 August 2020
/
Accepted: 27 August 2020
/
Published: 29 August 2020
(This article belongs to the Special Issue Artificial Intelligence and Big Data Computing)
Abstract
:Identifying vital nodes in complex networks is of paramount importance in understanding and controlling the spreading dynamics. Currently, this study is facing great challenges in dealing with big data in many real-life applications. With the deepening of the research, scholars began to realize that the analysis on traditional graph model is insufficient because many nodes in a multilayer network share connections among different layers. To address this problem both efficiently and effectively, a novel algorithm for identifying vital nodes in both monolayer and multilayer networks is proposed in this paper. Firstly, a node influence measure is employed to determine the initial leader of a local community. Subsequently, the community structures are revealed via the Maximum Influential Neighbors Expansion (MINE) strategy. Afterward, the communities are regarded as super-nodes for an iteratively folding process till convergence, in order to identify influencers hierarchically. Numerical experiments on 32 real-world datasets are conducted to verify the performance of the proposed algorithm, which shows superiority to the competitors. Furthermore, we apply the proposed algorithm in the graph of adjacencies derived from the maps of China and USA. The comparison and analysis of the identified provinces (or states) suggest that the proposed algorithm is feasible and reasonable on real-life applications.
1. Introduction
The rapid development of information technology has witnessed a blossom of network science in the last decade. Network theory is an important tool for representing and analyzing the structures and functions of real-world complex systems such as social networks, power grids, transportation networks, economical networks, biological networks and so on [1,2]. For the enormous data scale, most studies merely focus on a small group of important nodes rather than the whole network, which has attracted great focus on the promising topic, i.e., vital nodes identification. Identifying vital nodes in complex networks is crucial in understanding and controlling the spreading dynamics, and it can be further split into two processes: (1) ranking of vital nodes and (2) identification of a small group of nodes that are able to maximize the influence. Similar research topics include node ranking [3], influence maximization [4], node centrality [5] and so on. Inherently, all these topics are focusing on finding vital nodes that exert maximum influence in the network. During the past decades, it has brought fruitful applications such as maximizing the influential scope in viral marketing [6], controlling the outbreak of epidemic diseases [7], preventing cascading failures in power grids [8] and so on [9].
We have entered the era of “big data”, in which an obvious feature is that the data are being ubiquitously generated and continuously expanded [10]. Big data has brought us great challenges in identifying the vital notes within complex networks, summarized as the following: (1) “Volume”, the huge data scale has become prohibitive in tracking with the full data set, which may require the power of high-performance computing or distributed processing; (2) “Variety”, many real-life complex systems are naturally heterogeneous networks, i.e., a more complicated structure that includes multiple interactions among various channels, which may lead to traditional research on a single channel insufficient to get integrated results; (3) “Velocity”, the dynamic changes of networks force an efficient analysis to satisfy the real-time graph mining; (4) “Value”, the big data implies great practical application value and requires an outstanding performance for the proposed algorithms.
With the in-depth study, more and more researchers come to realize that the traditional graph model is insufficient to evaluate node importance in many real-world scenarios [11], e.g., the individuals interact with each other across multiple social platforms, which shows the reasonability in modeling with a multiplex social network. The negligence of the multiple relationships between social actors may lead to incorrect or inaccurate results of the most versatile users [12]. Hence, the study on multilayer networks [13,14] has been introduced to find influential spreaders to get more accurate results. Specifically, many real-life complex systems are naturally hierarchical networks, which suggests the reasonability of graph mining with different levels.
In this paper, we design a novel algorithm for identifying top-k vital nodes in complex networks hierarchically. Firstly, a node influence measure is employed for ranking influential nodes that may be the initial leaders of local communities. Subsequently, the community structures are revealed via the Maximum Influential Neighbors Expansion (MINE) strategy. Afterward, the community structures are regarded as super-nodes for an iteratively folding process till convergence, in order to identify influencers hierarchically. The purpose of the proposed MINE algorithm is to accurately detect nodes that are able to exert strong influence over both the monolayer and multilayer networks. The main contributions of this paper are listed as follows:
- (1)
- A novel algorithm for identifying vital nodes hierarchically is proposed in this paper, in which community structures derived by maximum influential neighbors expansion strategy are regarded as higher-level nodes.
- (2)
- Based on the simulations on percolation theory and the epidemic model, 32 real-world datasets (16 monolayer networks and 16 multilayer networks) are employed to verify the performance of the proposed algorithm. Experimental results suggest its feasibility and superiority.
- (3)
- The proposed algorithm is applied in the graph of adjacencies derived from the maps of China and USA, respectively, which exhibits the significance in real-life applications.
The rest of this paper is organized as follows. Section 2 summarized the related works, which is further classified into centrality measures, influence maximization in multilayer networks and application areas. Section 3 introduces the definition of the research problem and presents the mathematical models for both monolayer and multilayer networks, and subsequently, the algorithm process for identifying top-k vital nodes is introduced in detail. Section 4 exhibits the experiments and analysis, including comparison experiments on 32 real-world datasets, which verify the feasibility and veracity of the proposed algorithm. Moreover, the application in the graph of adjacencies derived from the maps of China and USA is analyzed. Section 5 summarizes the whole paper and provides concluding remarks.
2. Related Works
The identification of top-k vital nodes can be resolved into Influence Maximization Problem (IMP), which was first proposed by Domingos and Richardson [15], and later proved by Kempe et al. [16] that it was an NP-hard (i.e., non-deterministic polynomial-time hardness) problem [17]. A plethora of methods for IMP are proposed in the last decades [18,19], which can be mainly classified into centrality measures, link topological ranking measures, entropy measures, and node embedding measures [20,21]. We hereby introduce several typical representative methods in the following subsections.
2.1. Representative Centrality Measures
The simplest way to measure the node influence is by degree centrality [22] (DC), i.e., a focal node with more neighbors implies greater influence. However, several vital nodes, which are holding a lower degree but lying in a “bridge-like” position may exert enormous influence in the information diffusion process [23]. Analogously, closeness centrality [24] (CC) emphasizes the shortest path length of a focal node to all the others in the whole network, which suggests an optimal location is crucial for resource allocation in complex networks. However, both of the betweenness and closeness centralities are holding relatively high computational complexity, which becomes prohibitive in applying for large-scale networks. Some other classical measures such as eigenvector centrality [25] (EC), PageRank [26] (PR), H-index [27] and k-shell decomposition [28] are successful in many real-life scenarios, but are criticized by some certain limitations. Inspired by the gravity formula in physics, Ma et al. propose a gravity model [29] (GR) which considers the gravity between two nodes is proportional to the product of k-core, and inversely proportional to the power of the distance between them. Afterward, the node importance is measured by the gravity accumulation of the neighbors within three steps of a focal node. However, the computing of k-shell decomposition is time-consuming in large-scale networks. To improve the efficiency of GR, Li et al. propose a Local-Gravity [30] (LGR) model by replacing k-core with degree centrality and merely consider the neighbors within R steps. The parameter R can be further determined by half of the network diameter, approximately. Numerical experiments on fourteen datasets suggest its superiority, while the determination of parameter R requires calculating the shortest distance between all pairs of nodes, which also becomes prohibitive in large-scale networks [31]. Fan et al. [32] define two cycle-based node characteristics, i.e., cycle number and cycle ratio, which can be used to measure a node’s importance. The research opens a new direction of understanding network structures, while the improvements in computational complexity are expected for further applications. INF [33] is a novel centrality measure that merely considers the local neighboring information of a focal node and can be further applied to multilayer networks. Extensive experiments on real-world datasets suggest its capability in identifying influencers in social networks. Several typical representative measures are summarized and compared, as shown in Table 1.
2.2. Influence Maximization in Multilayer Networks
Until now, great endeavors have been made to addressing the influence maximization problem in multilayer networks [35,36,37,38,39]. Wang et al. [12] propose a centrality measure (EDCPTD) to identify essential nodes based on tensor decomposition, which incorporates the intralayer edges and interlayer edges simultaneously to measure the node importance in multilayer networks. Tidke et al. [40] propose a consensus-based aggregation method to identify top-k influential nodes in online social networks, where a Twitter dataset covering two topics (Politics and Economy) is employed. The authors exploit heterogeneous surface learning features to rank the nodes with low computational complexity (). Li et al. [41] propose a novel approach to identify the influential nodes in network of networks (NON, a special case of multilayer network) [42], where the influence of each node in different layers is integrated by combination rules of evidence theory. Experimental results on China transport networks show its feasibility in identifying vital cities. Pedroche et al. [43] propose an eigenvector centrality for multiplex networks, which is adapted according to the idea behind the two-layer approach PageRank. Wang et al. [44] design an extended independent cascade (IC) model to simulate the influence diffusion process in multiplex networks, which aims at identifying influential nodes across all the network layers. Notably, modern complex systems tend to have more complicated structures than ever, which brings difficulties to the research on influence maximization problem via a traditional graph model. Hence, identifying vital nodes in multilayer networks is still an open issue.
Recently, hierarchical analysis on large-scale networks has received continuous focus in scientific society [45,46,47]. A typical k-shell method decomposes a network into hierarchically ordered shells by recursively pruning the nodes with degree being less than the current shell index. Ye et al. [48] apply this measure into time-varying networks, and propose a temporal k-shell decomposition method to identify vital nodes in temporal networks. Extensive experiments on real-world datasets suggest that the superiority of the proposed method. Chen et al. [49] propose a fusion index named as spreading influence related centrality to identify the influence of nodes by extracting and synthesizing topology feature information of traditional centrality indices and spreading influence. Zareie et al. [50] present a hierarchical method (HKS) for the specification of the topological locations of nodes. Experimental results on real-world and artificial datasets suggest that the proposed HKS method is superior to similar approaches and has an acceptable run time. In short, the above-mentioned approaches provide a hierarchical view on vital nodes identification, which suggests a promising field for further studies.
2.3. Application Areas
During the past decades, the identification of vital nodes in complex networks yields fruitful applications in real-life scenarios, such as viral marketing [6], epidemic outbreak [7], cascading failures [8], public safety networks [51] and so on.
Huang et al. [52] propose a community-based influence maximization method for viral marketing, which enables consumers to spread information about a product to other people, much in the same way that a virus spreads from one to another. Experimental results indicate that the community structures benefit in improving the performance of influence maximization. Hu et al. [53] devise a mitigation strategy against cascades in power grids. Different from vital nodes identification, in this work, the vulnerable transmission lines are identified and then strengthened to prevent cascades in power grids. The simulations on the IEEE-39 bus system and the IEEE 118 bus system suggest the feasibility of the proposed method in reducing the power blackout risks. Nikolaou et al. [54] propose an epidemiological model to identify critical airports for controlling global infectious disease outbreak through European airports’ systems. Experimental results indicate the effectiveness of European airports and controlling measures should be taken in order to break the chain of infections. Fragkos et al. [55] introduce a novel evacuation-planning mechanism to support the distributed and autonomous evacuation process within the operation of a public safety system. Simulations under several scenarios exhibit the superiority of the proposed framework. In short, vital nodes identification in complex networks is of paramount importance in a variety of applications and that’s our purpose of this writing.
3. Model and Method
The influence maximization problem in complex networks can be roughly explained as finding a group of nodes (regarded as seeds) that can bring the maximum influence on the network dynamics, described as
where A is a subset of node set V that are identified as seeds, denotes the final influenced node set. This problem is simplified as top-k vital nodes identification by setting , which has recently received great attention [40,56,57,58]. In this paper, both monolayer and multilayer network models are under consideration for addressing the influence maximization problem, as introduced in the following subsection.
3.1. Mathematical Models
The monolayer network model for vital nodes identification in this paper can be represented by
where V is the node set and is the edge set. The multilayer network model [14] that we utilized in this paper is described as
where represents a series of monolayer networks with depict the monolayer network at layer , where and represent the nodes and intralayer edges at layer , respectively. is the interlayer edges between the nodes of any two different layers, described as
where represents the interlayers edges between the nodes at layer and layer , and represent the node set at layer and layer , respectively. Specifically, we utilize the supra-adjacency matrix to model the a multilayer network, described as
where the diagonal elements represent the adjacency matrix (i.e., intralayer edges) of layer , respectively. The non-diagonal elements represent all interlayer edges, which can be represented by , where represents the interlayer edges between layer and layer . is the set of real numbers, is the total number of the nodes.
We employ the Susceptible–Infected–Recovered (SIR) epidemic model [59] for analyzing influence maximization problem. It has three possible states:
- Susceptible (S) state, where a node is vulnerable to infection.
- Infectious (I) state, where a node is infected and tries to infect its susceptible neighbors.
- Recovered (R) state, where a node has recovered (or isolated) and can no longer infect others.
In a network, two nodes are considered to have “contact” if they are connected by an edge in the network. Within these two nodes, if one is infected with a certain epidemic, then the other is in “susceptible” state and maybe later infected [60]. A node is considered to be recovered if it is isolated or immune to the epidemic. In detail, to check the spreading ability of a focal node, we set this node as an infected seed to infect its neighbors. At each time step, an infected node can infect its neighbors with infection probability , and then the infected nodes are recovered from the epidemic with probability . The differential equations are given as
3.2. Algorithm Description
We employ the INF indicator [33] to measure the initial leader of communities and then design a MINE algorithm to identify the vital nodes hierarchically. Suppose k is the number of nodes to be identified, the process of MINE is described as the following steps.
- Step 1:
- Load the network G and calculate the INF indicator for each node;
- Step 2:
- Divide communities by identifying influential nodes and neighbors;
- (a)
- Select the node i with maximum INF and mark it as the initial core of a community ;
- (b)
- Select a neighbor j that has the maximum INF among the neighbors of node i, and set j’s community label as i if is satisfied according to Equation (7);
- (c)
- Repeat Step 2(b) until all the neighbors of node i are divided;
- (d)
- Repeat Step 2(a) to (c), assign the undivided nodes with community labels according to Equation (8) until all the nodes are marked with community labels;
- Step 3:
- Identify vital nodes by folding communities hierarchically;
- (a)
- Regard a community as a node in the new folded network ;
- (b)
- (c)
- Repeat Step 3(a) and (b) until the size of the folded network is stable;
- (d)
- Traverse the nodes in the folded network and replace the INF of node i in the initial network G as the INF of node in the final folded network;
- Step 4:
- Sort the nodes by influence in descending order and obtain the top-k nodes as the seeds.
The proposed MINE algorithm first identifies several influential nodes as the initial core of local communities, and then divides the neighbors of these core nodes into a reasonable community. To improve the reasonability of the division process, we define an evaluation function for the contribution of each neighbor j, given as
where j is a neighbor of node i, denotes the neighbors of node j, and denote the community labels of node i and node k, respectively. if i and k are with the same community label (i.e., ), and otherwise.
Inspired by the label propagation algorithm [61], we define a rule for an undivided node j to be with a community label as
where and denote the community labels of node j and node k, respectively, denotes the neighbors of node j, represents the amount of .
In the folding process from network G to , the INF of a node in is defined as the accumulated INF of members in the community in G, described as
where denotes a community in network G, m is a member of the community . The weight of an edge in is defined as
where represents the weight of an edge in the folded network , and represent two communities in network G, is the weight of an edge in network G.
The pseudo-code of the above process is shown as Algorithm 1, with illustration on real-world datasets presented in Figure 1.
3.3. Complexity Analysis
Aiming at addressing the problem of influence maximization, the proposed MINE algorithm firstly ranks the nodes by employing the INF measure and identifies several top-ranking nodes as an initial leader of local communities. Subsequently, the communities are divided by the maximum influential nodes expansion strategy. The community structures are formed by numerous local communities which are further regarded as super-nodes in the folding process till convergence. Suppose m and n are the numbers of edges and nodes, respectively, the average degree of nodes is k. At each folding process, approximate communities are obtained, the network size is shrinking exponentially, described as , and the number of edges is reducing as , i.e., . Thus, the folding process with maximum influential neighbors expansion strategy can be converged quickly.
A step-by-step analysis on time complexity is listed as follows: In Step 1, the calculation of INF for all the nodes requires the complexity of ; In Step 2, the sort of influential nodes requires , and ranking the neighbors of the initial core of local communities requires . The operation of contribution function (i.e., Equation (7)) for all the leaders’ neighbors requires complexity less than , and the assignment of undivided nodes (i.e., Equation (8)) requires ; In Step 3, the folding process converges quickly, which requires time complexity of ; In Step 4, the sorting of vital nodes requires . Thus, the total time complexity of the proposed MINE algorithm is . As k is usually far less than n, therefore, the total time complexity can be simplified as . Overall, the complexity of the proposed method is acceptable, which holds a lower computational complexity than BC or CC ().
The storage of a network requires the space complexity of , the storage of node influence and community labels requires . In the folding process, suppose the MINE algorithm converges in l times, this process requires extra space complexity. As l is commonly far less than n, thereby the total space complexity for MINE algorithm can be simplified as .
| Algorithm 1 MINE |
 |
4. Experiments and Analysis
The proposed algorithm is implemented in Python 3.8.3, with relevant libraries NetworkX 2.4 and MultinetX. The operating system is 64 bit Windows 10, with configuration of Intel (R) Core (TM) i7-7700 CPU @ 3.60 GHz (8 CPUs), 3.6 GHz and 16 GB ram installed. The goal of the experiments is to compare the performance of the proposed MINE algorithm with competitors.
4.1. Experimental Datasets
In this paper, 32 real-world datasets are employed to verify the performance of the proposed algorithm, which are classified into two groups: monolayer networks and multilayer networks. The statistics of the two groups of datasets are shown in Table 2 and Table 3, respectively. All the datasets are available at https://www.neusncp.com/user/file?id=311&code=mine.
4.2. Experimental Contents
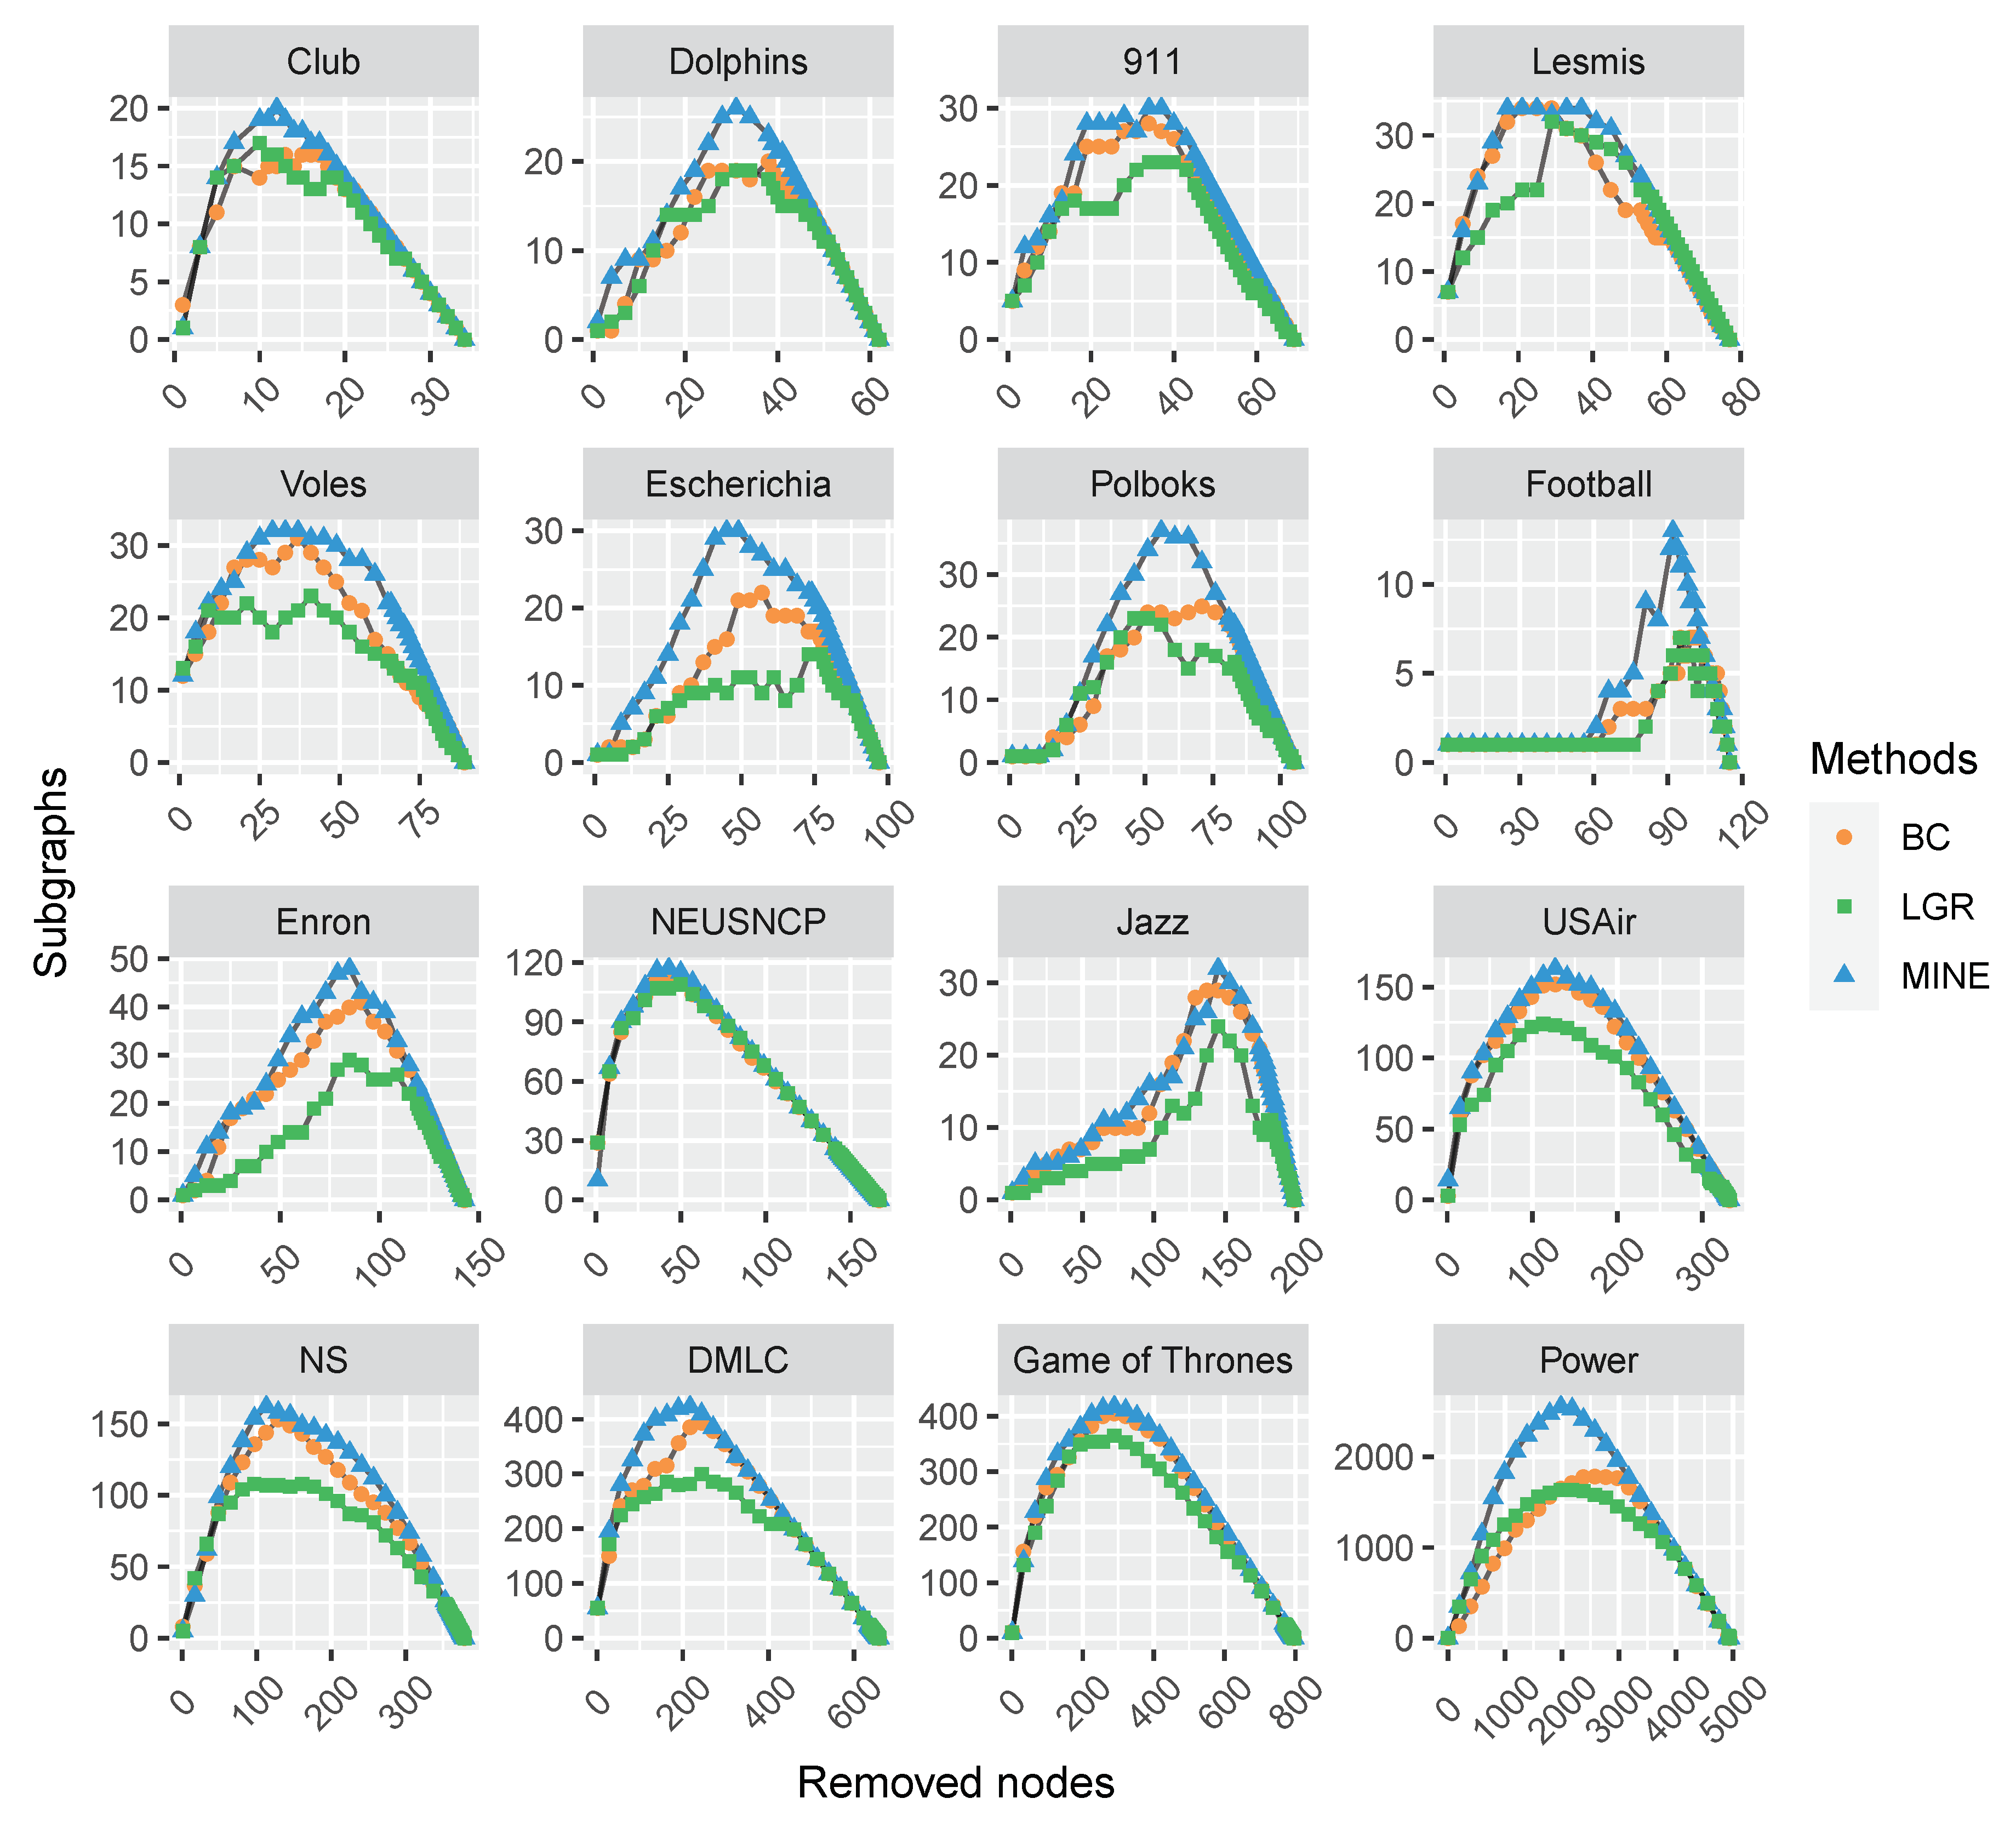
To verify the performance of the proposed MINE algorithm, comparison experiments are conducted on the above-mentioned monolayer and multilayer networks, respectively. Firstly, a sequence of ranked nodes is calculated by each measure. Subsequently, the vital nodes are removed in turn by the ranking in each sequence, which may result in the network being broken into several subgraphs. We record the number of subgraphs at each removal and make a comparison on all the competitors. This process repeats until all the nodes are removed. Hence, the variation tendency of the subgraphs’ number exhibits the influence of a focal centrality measure. The experimental results are plotted in Figure 2 and Figure 3.
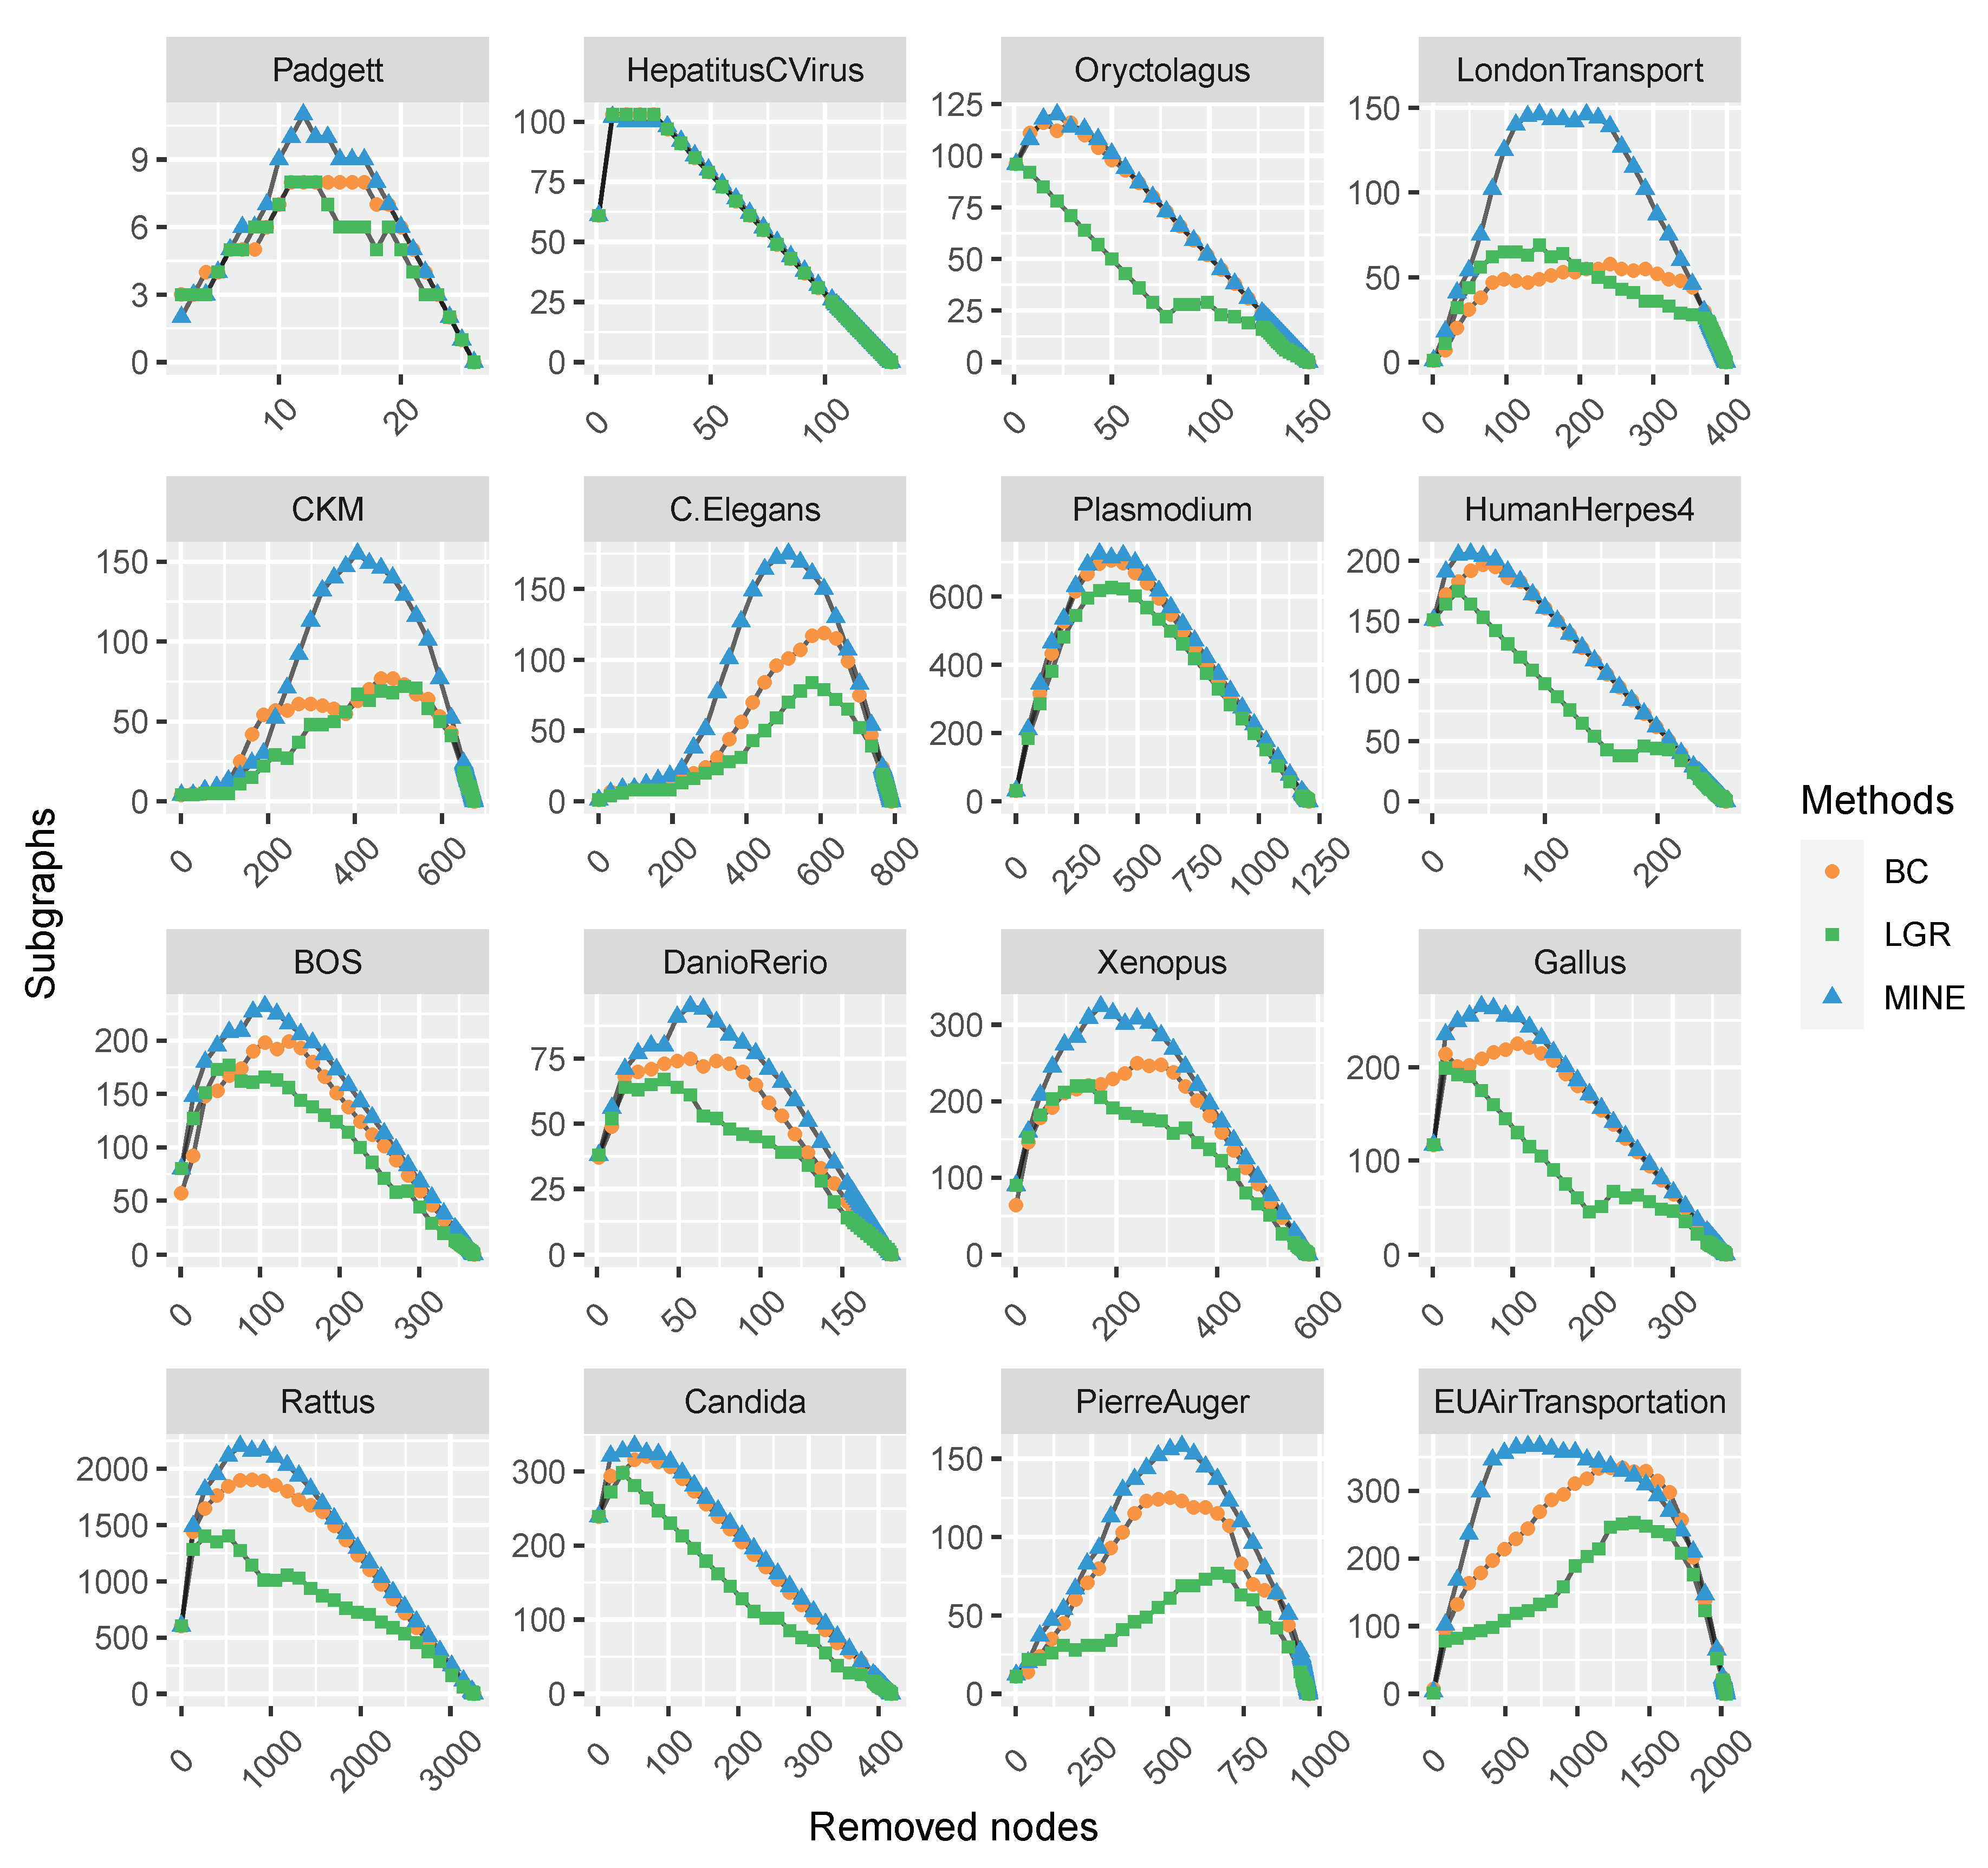
As shown in Figure 2 and Figure 3, with the removal of vital nodes (in descending order) computed by each measure, the number of derived subgraphs is increasing and reaches a maximum when the network is totally broken up (i.e., there are no edges). Afterward, the number of subgraphs is reducing, and finally reaches zero when all the nodes are removed. Hence, we compare the maximum numbers of subgraphs obtained by each measure, and find that the proposed MINE algorithm (as marked with blue triangles) is able to get greater values than the competitors on all the datasets except HepatitusCVirus, which suggests the superiority of MINE to the competitors. Furthermore, the maximum number of subgraphs by the proposed MINE algorithm on the HepatitusCVirus dataset is very close to the optimal result (i.e., obtained by LGR, as marked with green squares) and following the same trend, which suggests the feasibility of the proposed MINE algorithm.
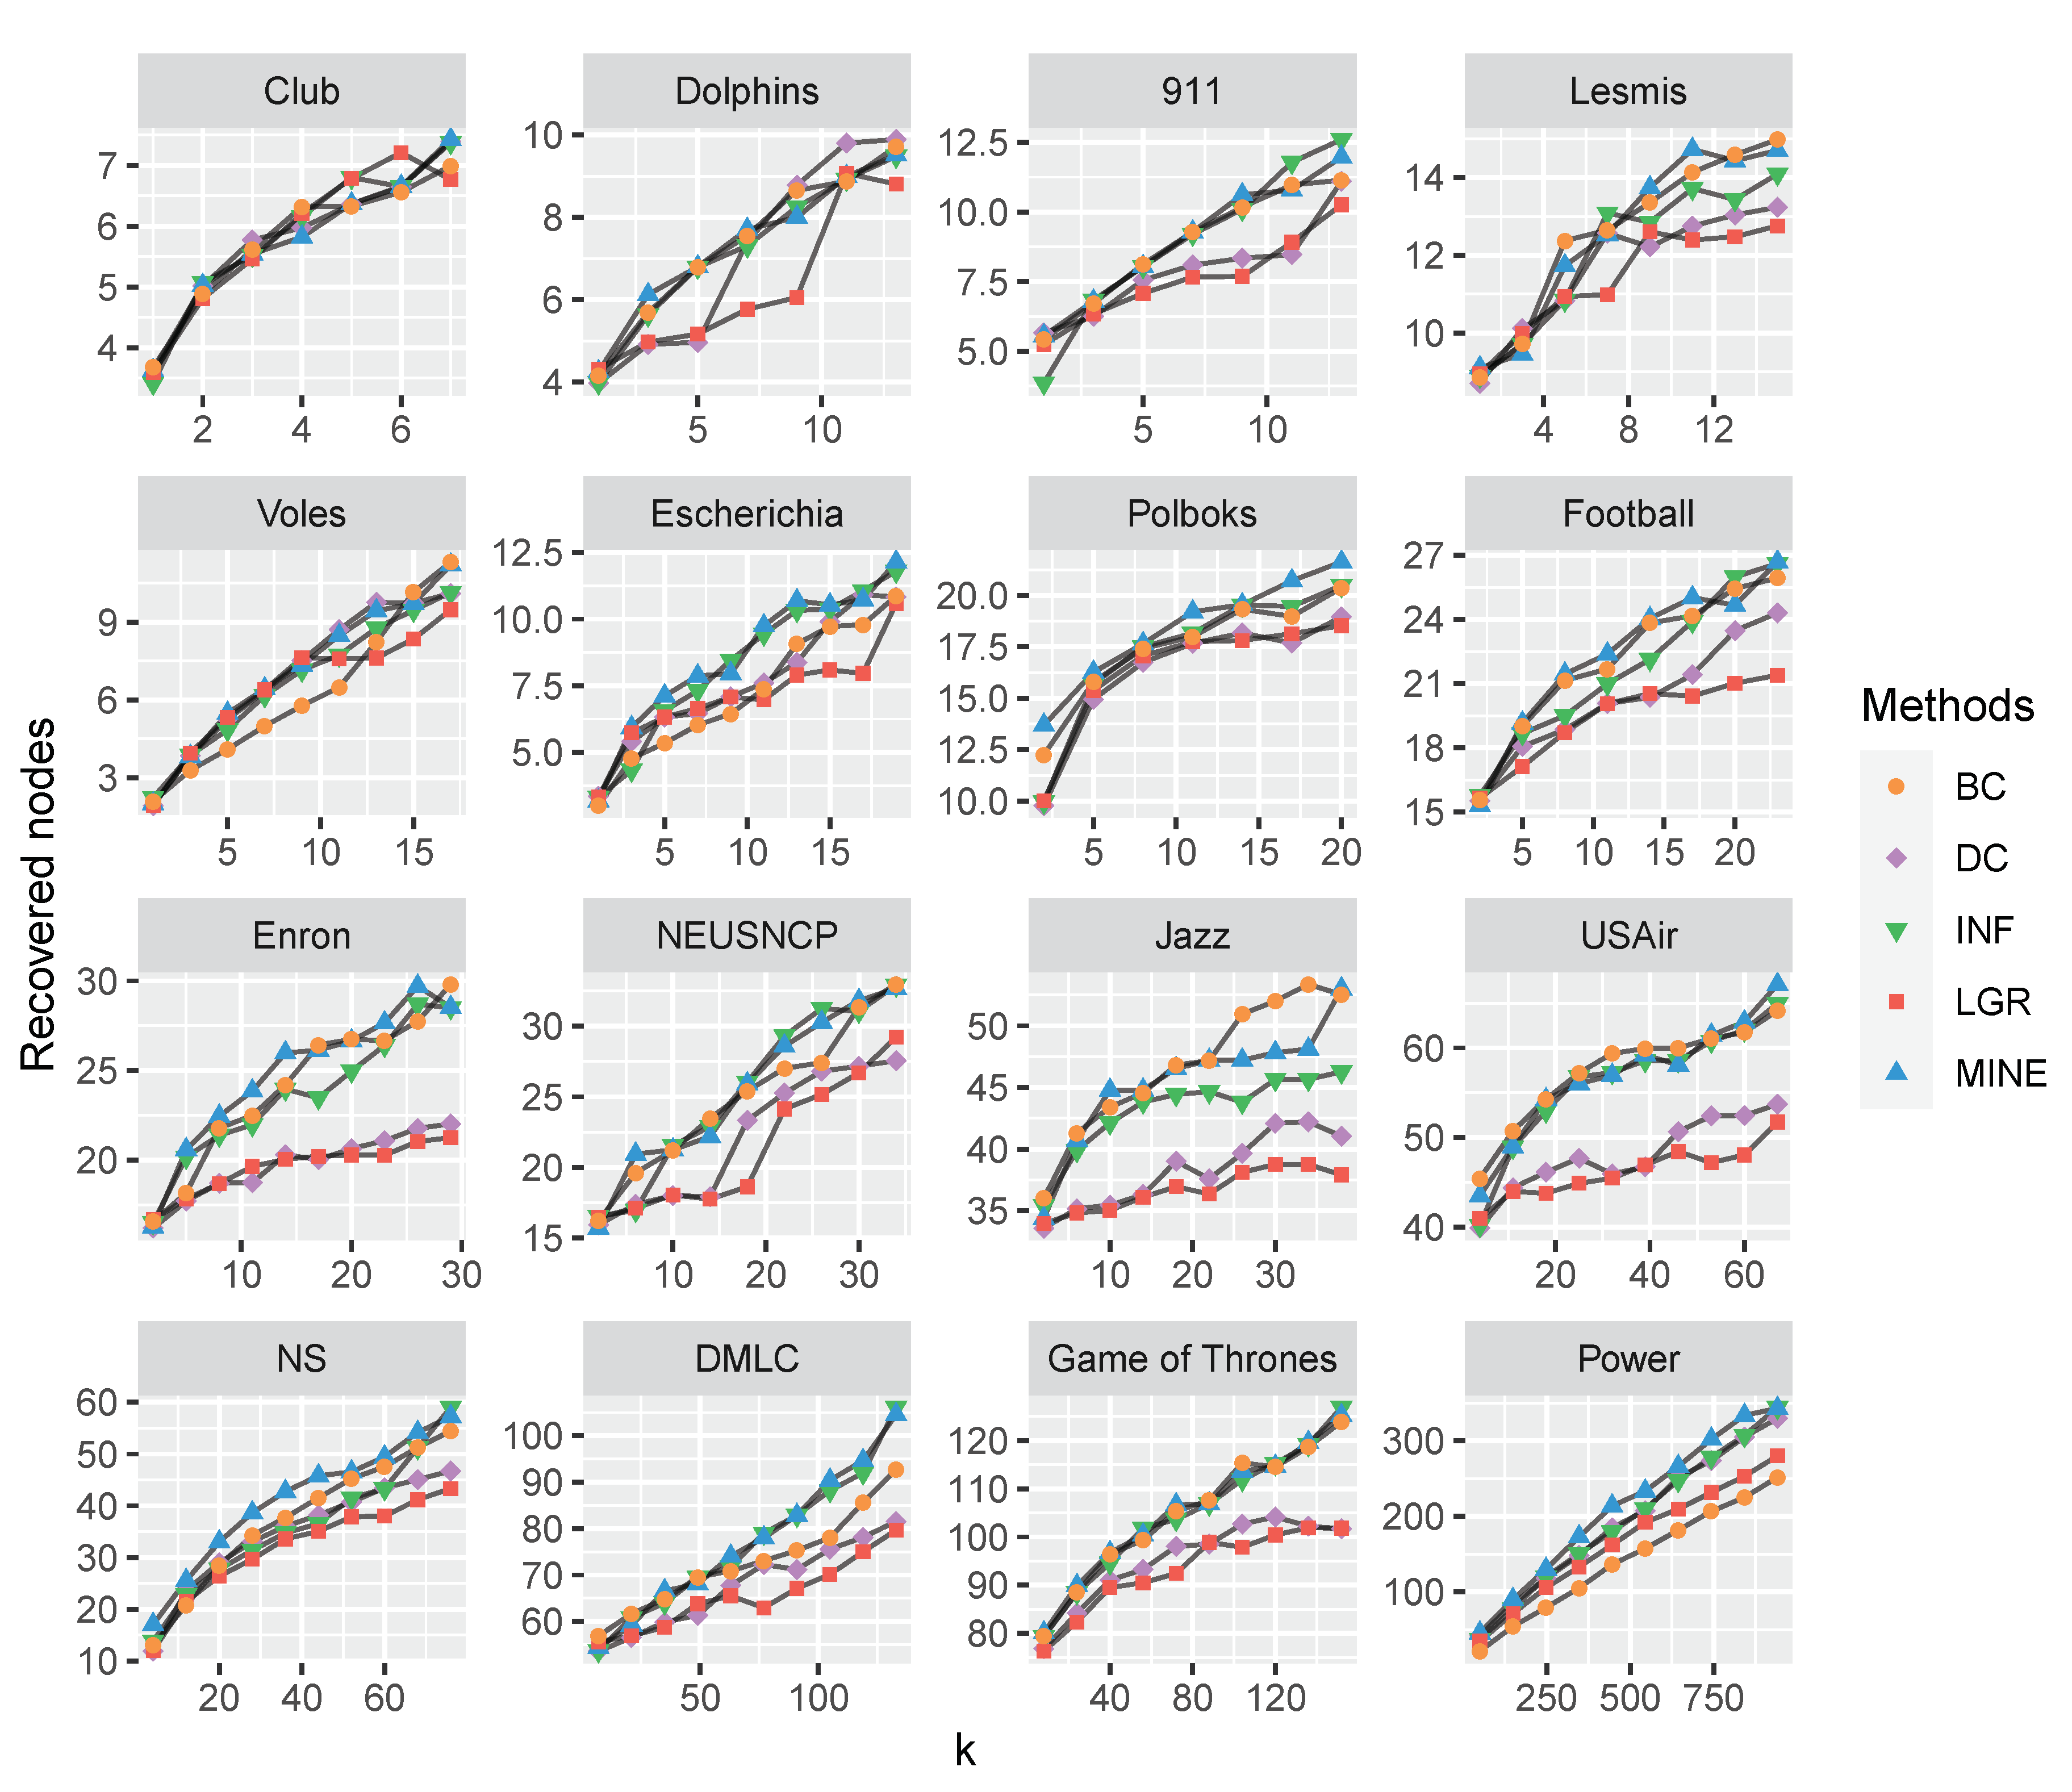
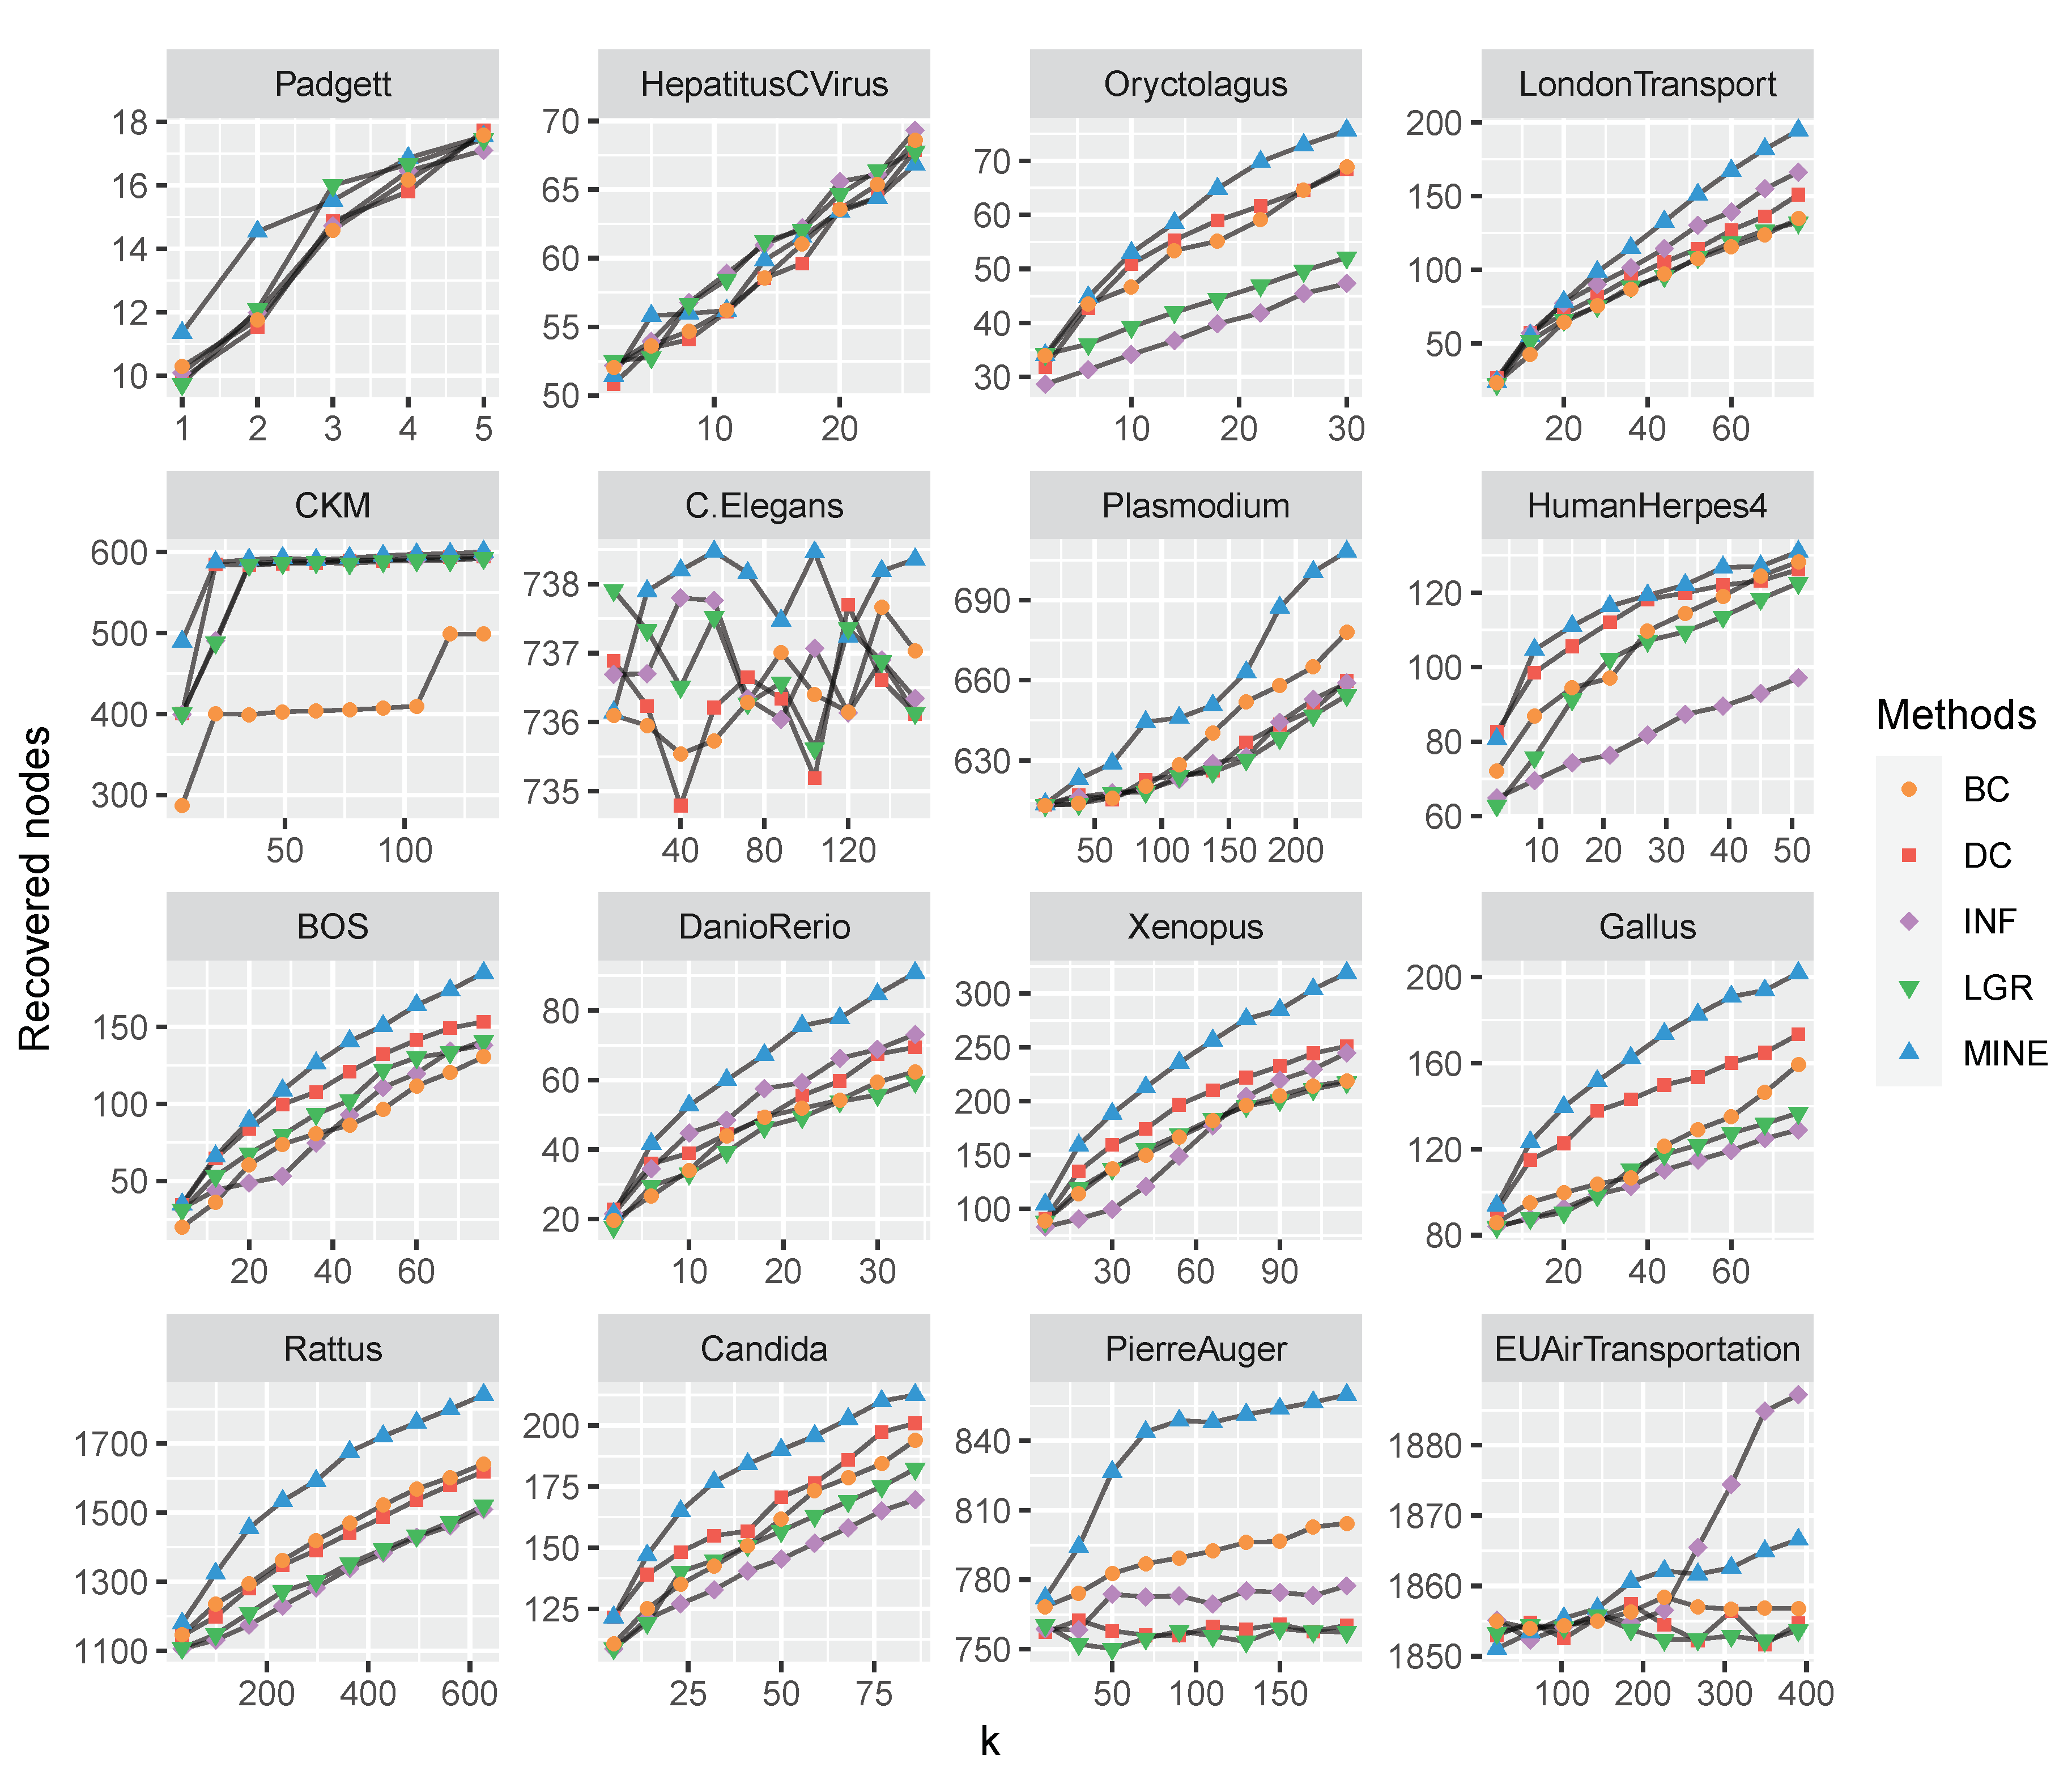
We apply the SIR model to compare the performance of competitive measures for further study on the influence maximization problem. Initially, k nodes are set as infected seeds to infect neighboring nodes with probability . Afterward, the infected nodes are recovered and never be infected again with probability . This spreading process repeats until there are no more infected nodes in the network and the number of final recovered nodes are utilized to evaluate the effect of a focal measure. To analyze the varying parameter k with the recovered nodes, we conducted experiments on the above-mentioned 32 datasets and set the ratio as and . Specifically, the range of k is set in according to Pareto Distributions [84], where N is the total number of nodes for each dataset. We implement 1000 independent runs to eliminate accident errors and the comparison results are plotted in Figure 4 and Figure 5.
The performance of each measure is evaluated by the height of each curve. As shown in Figure 4 and Figure 5, with the increasing of k, the recovered nodes are increasing likewise. In most cases, the proposed MINE algorithm shows superiority to the competitors, by obtaining relatively more recovered nodes with the increasing of “infected” nodes.
To compare the efficiency of the proposed MINE algorithm with competitors, we record the execution time (in seconds) for each measure on the 32 datasets, respectively, and make a brief comparison as presented in Table 4.
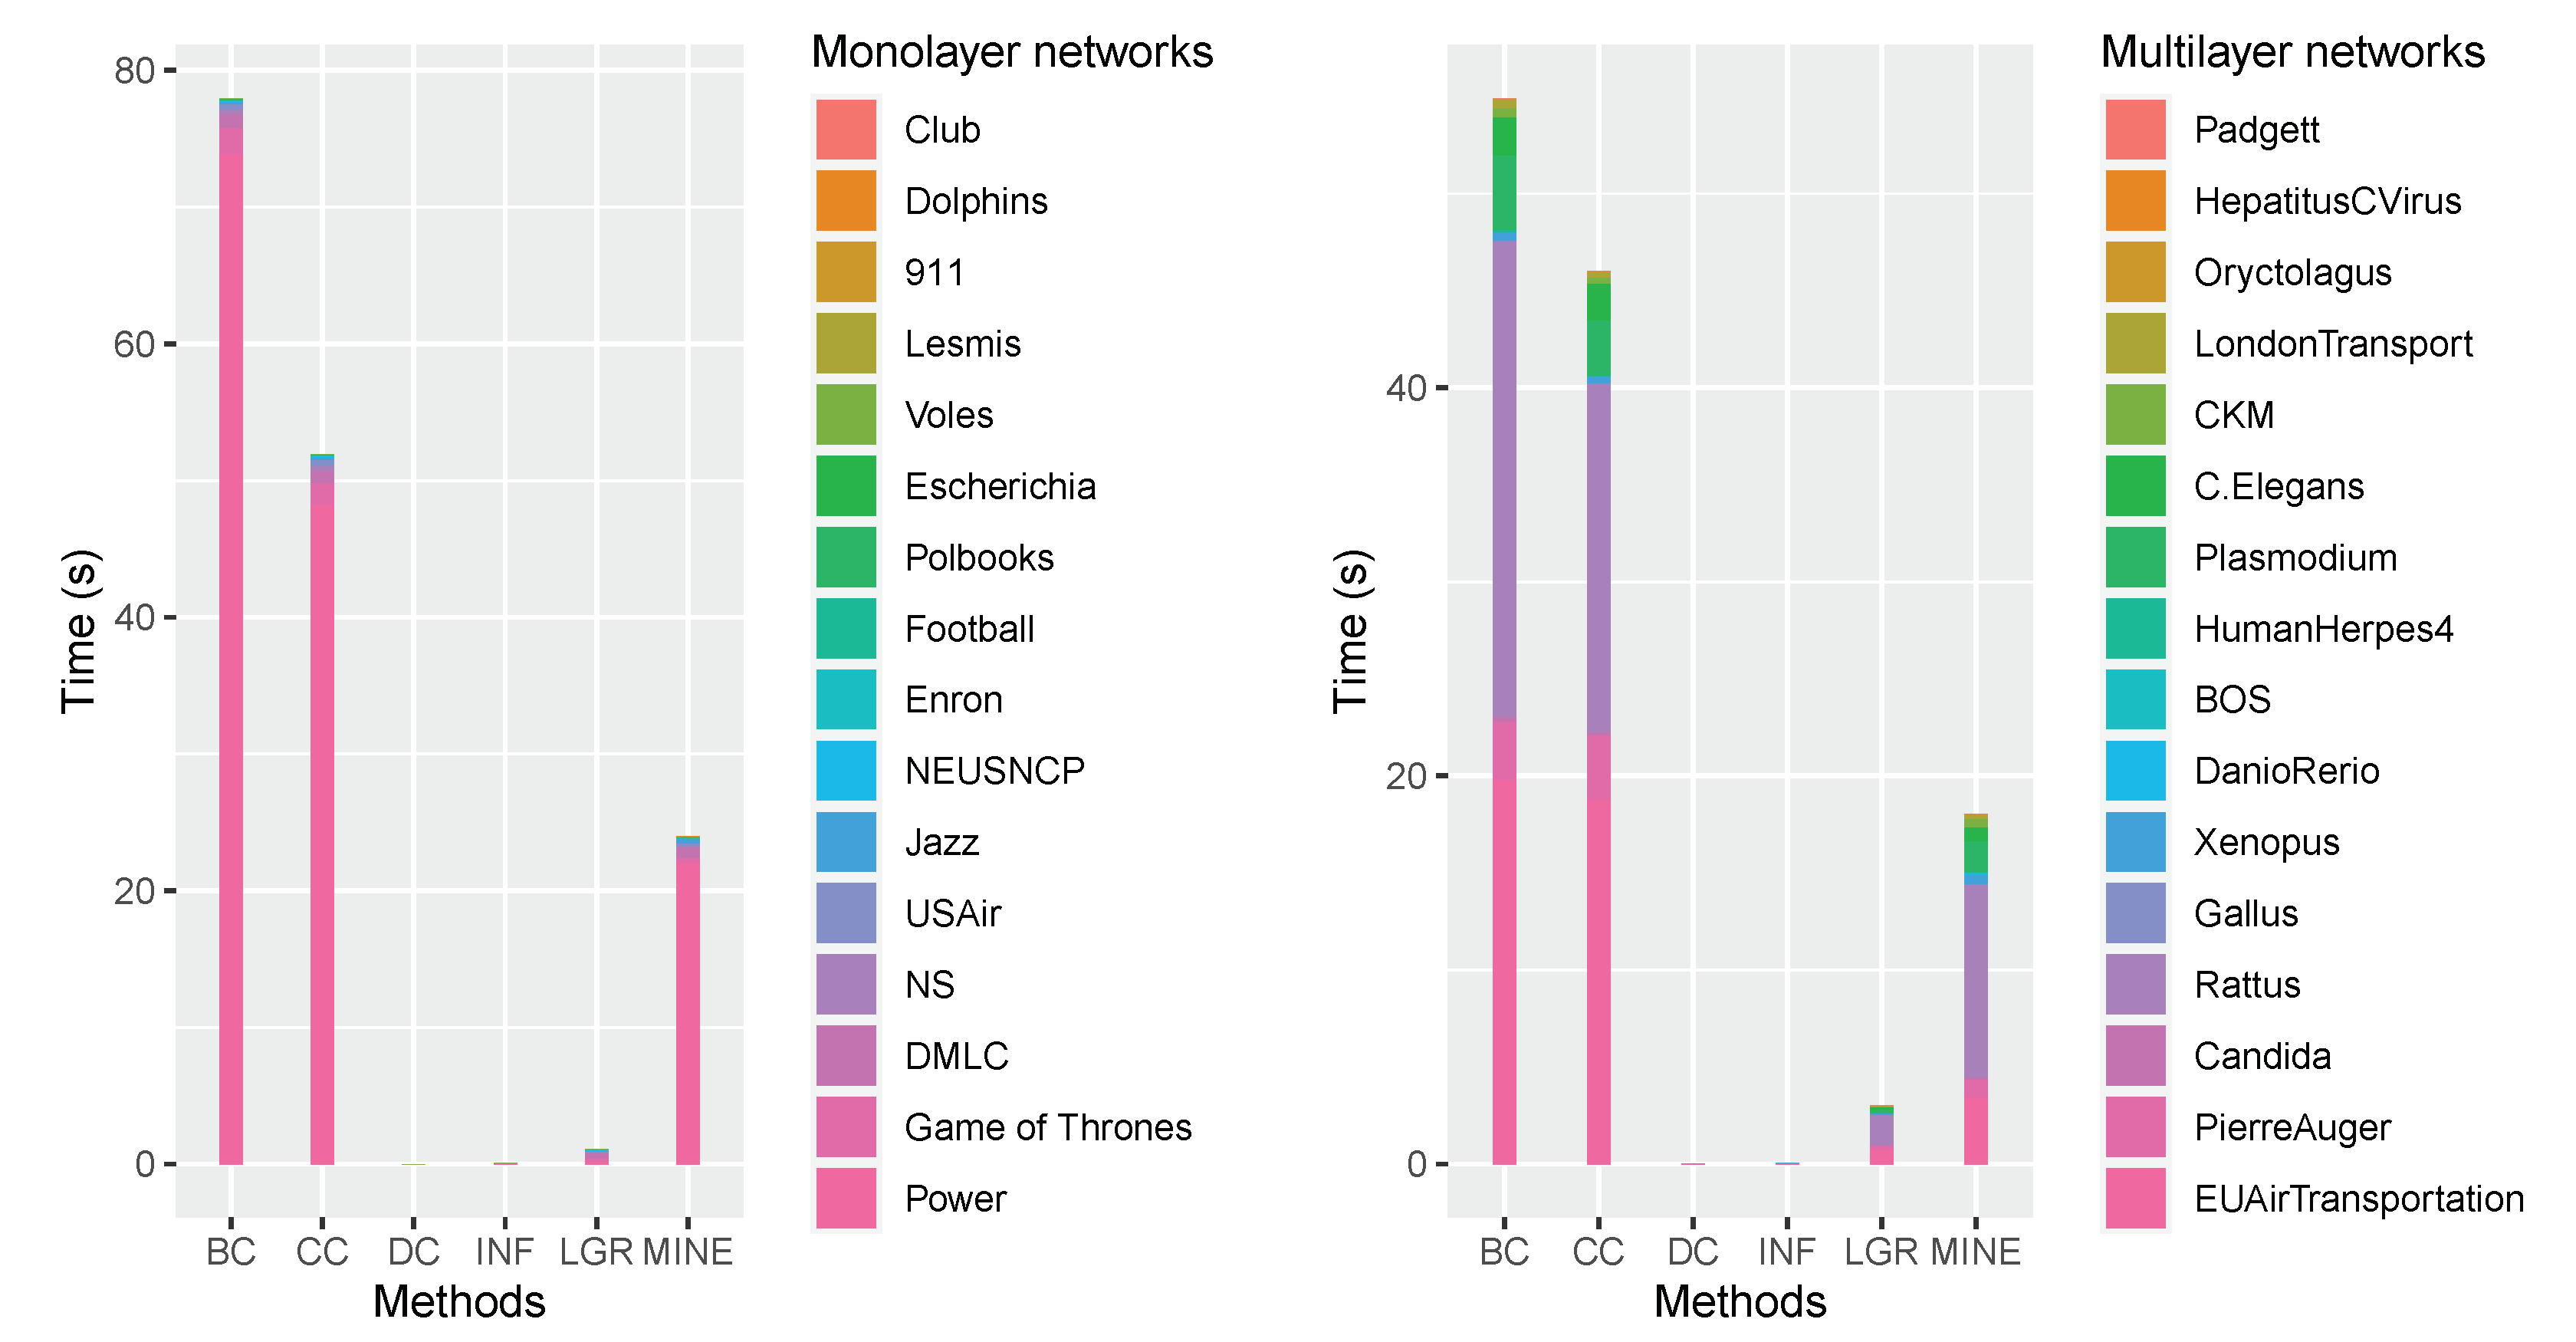
As shown in Table 4, DC holds the minimum runtime on almost all the datasets and BC holds maximum runtime in the majority of the experimental datasets. To compare the total runtime comprehensively, we accumulated the runtime of each measure on all the datasets, and make an intuitional comparison as shown in Figure 6.
As shown in Figure 6, the left panel exhibits the accumulated execution time by performing DC, CC, DC, INF, LGR and MINE measure on 16 monolayer networks, and analogously, the execution time on 16 multilayer networks is presented in the right panel. The accumulated execution time for the competitive measures can be roughly sorted as DC, INF, LGR, MINE, CC and BC (in ascending order). Although inferior to DC, INF and LGR measures on the accumulated execution time, the proposed MINE algorithm is acceptable for common applications with its performance in influence maximization and superiority to BC and CC on efficiency.
4.3. Discussion
Influence Maximization is a research hotspot of complex networks with a variety of applications in very different fields, such as information diffusion, social network analysis, viral marketing, epidemic control and so on. Degree centrality [22], as the simplest measure, mainly considers a focal node is crucial if it has large amounts of neighbors. However, it is probably to ignore some “bridge-like” nodes (i.e., nodes that connect different components) if they have few neighbors. To overcome this shortcoming, betweenness [23] and closeness [24] centralities are proposed which are able to identify vital nodes from a global perspective. These two measures seem to be more reasonable, however, they are also criticized by high computational complexity, which become prohibitive in large-scale networks. Local gravity [30] is a balanced measure, however, the determination of parameter R requires computing network diameter, which is also a time-consuming process. INF performs well in ranking nodes but lacks nodes selecting strategy, which is insufficient to exert maximum influence. Thus, the MINE algorithm is proposed in this paper, which firstly computes the local neighboring information of a focal node, and then considers the community structures hierarchically by a folding process. The proposed MINE algorithm is capable of identifying vital nodes dispersedly and exerting strong influence. Experimental results on 32 real-world datasets indicate the feasibility and efficiency of the proposed algorithm.
Firstly, the experiments of comparing subgraphs with the removal of vital nodes exhibit the superiority of the proposed algorithm, i.e., the vital nodes identified by the MINE algorithm are easier to exert strong influence than the competitors. By comparing the maximum number of subgraphs when removing the nodes according to the MINE algorithm, the networks are more easily broken up, as shown in Figure 2 and Figure 3. Secondly, we apply the SIR model to evaluate influence maximization effect for each measure (as shown in Figure 4 and Figure 5), with the increasing of infected seeds, the MINE algorithm can obtain relatively more recovered nodes, which suggests that the proposed algorithm is superior to the competitors in both monolayer and multilayer networks. Although inferior to BC on the Jazz dataset and INF on the EUAirTransportation dataset, it is also quite competitive. By analyzing the structures of these two networks, we find that the nodes in Jazz network are densely connected (i.e., the average degree of 27.6970), and most of the nodes are holding the same number of neighbors (approximately 28 neighbors), which brings difficulties to identify vital nodes to exert strong influence. The EUAirTransportation network has 37 layers, and the clustering efficiency is relatively lower (1.6187) than that of other multilayer networks. The proposed MINE algorithm is capable of identifying influencers hierarchically, while the EUAirTransportation network is composed of airlines that fail to form a “tree-like” structure in the folding process. However, the INF indicator considers the local neighboring information of a focal node, which is more capable of identifying vital nodes in the EUAirTransportation network. Nonetheless, the MINE algorithm outperforms other competitors (i.e., BC, CC, DC, and LGR) except INF. Finally, we compare the running time of each indicator on the 32 real-world datasets. Experimental results show the efficiency of the proposed measure.
4.4. Application
Inspired by the graph of adjacencies (i.e., the network of shared borders between countries, states, or provinces) [85], we collect the adjacencies of provinces in China, where each province is represented as a node and there is an edge between any two nodes if the corresponding provinces are geographically adjacent (i.e., share a border). By performing with the proposed MINE algorithm, the vital provinces are plotted in dark blue, as shown in Figure 7, and the full comparisons of provinces by different centrality measures are given in Table 5.
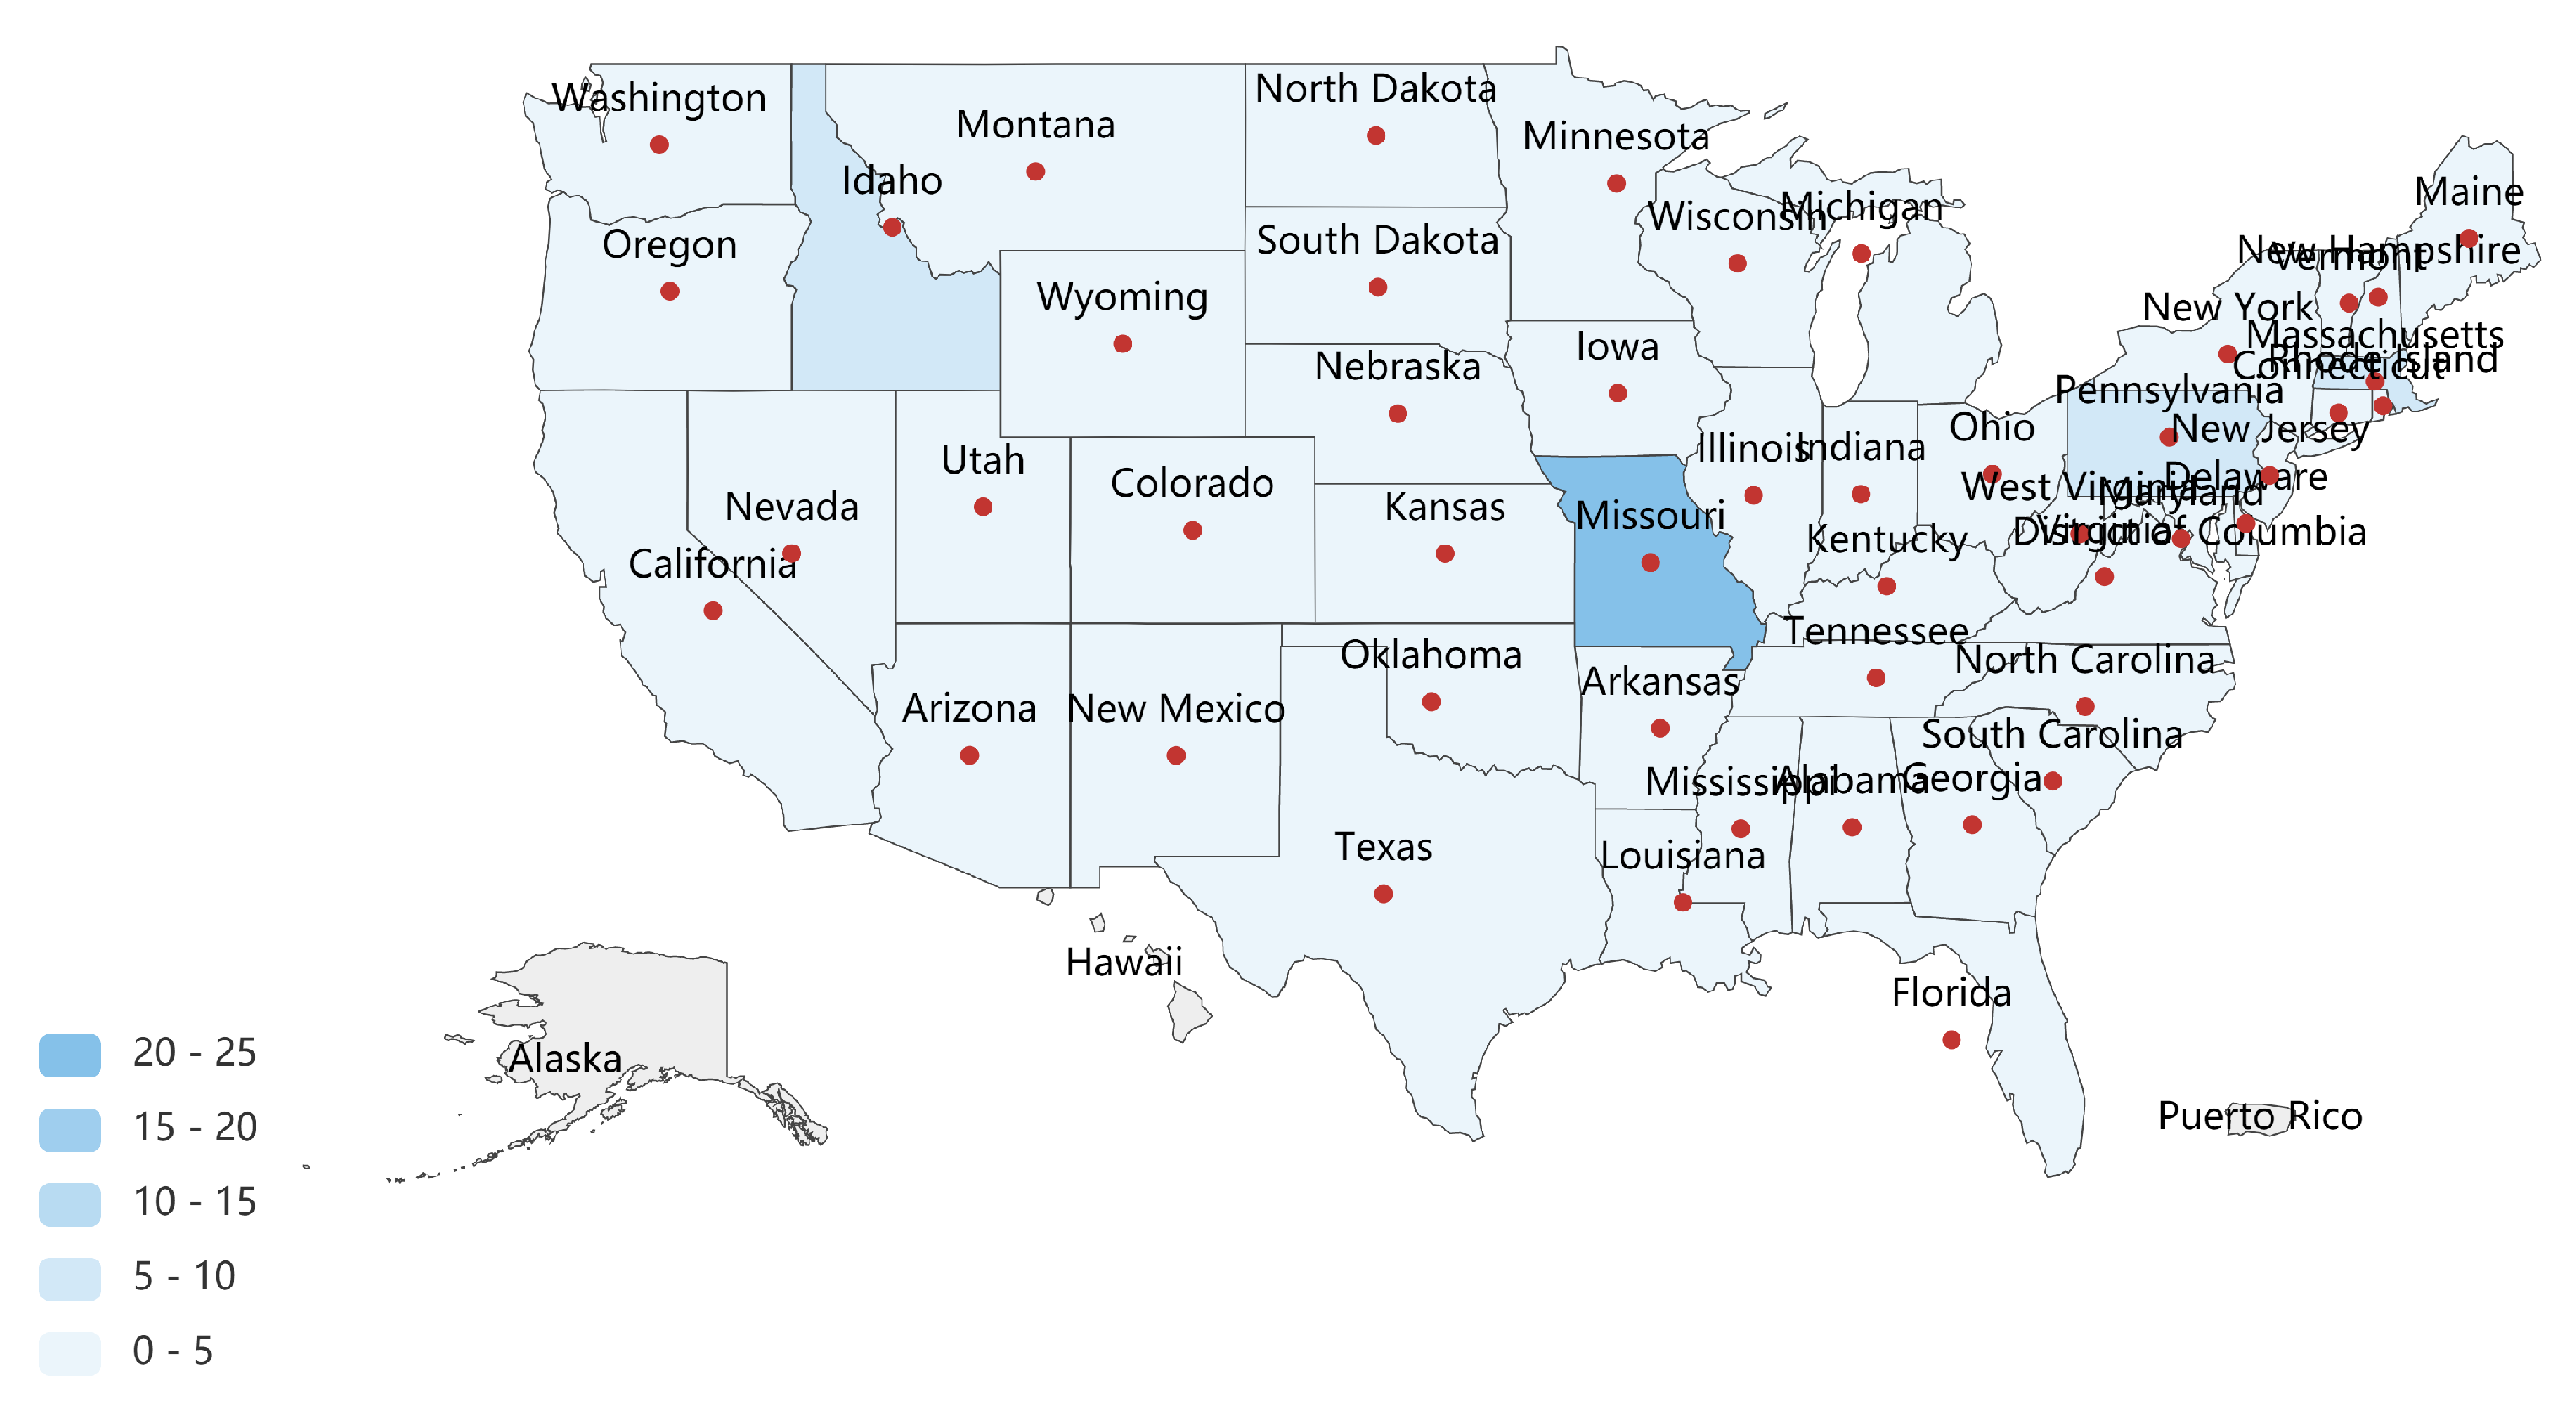
Meghanathan [86] proposes a normalization-based approach to obtain a comprehensive centrality ranking of the states in the graph of adjacencies from the map of USA. As concluded in his research, (i) the state of Missouri is the top-ranked node concerning all the commonly studied centrality measures, (ii) the state of Idaho has the lowest non-zero local clustering coefficient, indicating that the state is the most critical state with respect to facilitating communication between its neighboring states, (iii) the vital states measured by a single centrality is likely to be insufficient to exert strong influence on the whole network. Likewise, the vital nodes (marked in dark blue) identified by the proposed MINE algorithm in the graph of adjacencies related to the lower 48 United States are presented in Figure 8, and the full comparisons are shown in Table 6.
By respectively comparing the vital provinces (or states) in China and the USA, we are able to deduce that the proposed MINE algorithm is capable of identifying vital nodes dispersedly, which may benefit the information diffusion process and exert a positive effect in influence maximization.
5. Conclusions
Aiming at solving the influence maximization problem in complex networks, this paper proposes a novel MINE algorithm based on the folding of community structures hierarchically. Specifically, the complexity of MINE is , which suggests its feasibility in large-scale networks. Extensive experiments on 32 real-world datasets are conducted, including 16 monolayer networks and 16 multilayer networks, respectively. The experimental results suggest that the proposed algorithm outperforms competitors in most cases. Afterward, the runtime comparison of the proposed method with competitors verifies the efficiency of the proposed MINE algorithm. The applications in the graph of adjacencies of provinces (states) in China and USA also exhibit its value in real-life scenarios. Overall, the proposed MINE algorithm is capable of identifying vital nodes in complex networks and is of paramount significance in the influence maximization problem. The contribution of this work is likely to benefit many real-world applications, such as promoting network evolutions, preventing the spreading of rumors, etc.
As part of future works, the improvement of identifying community structures can be further studied (e.g., the complexity of or may provide significant runtime savings). The simplification of the folding process in MINE algorithm is also expected. In a word, we hope the findings in this work will help to improve the research in this promising field.
Author Contributions
X.H. designed the algorithm and wrote the original draft; D.C. revised the manuscript; T.R. and D.W. checked the manuscript and made some modifications. All authors have read and agreed to the published version of the manuscript.
Funding
This work was partially supported by Liaoning Natural Science Foundation under Grant No. 20170540320, the Doctoral Scientific Research Foundation of Liaoning Province under Grant No. 20170520358, the National Natural Science Foundation of China under Grant No. 61473073, and the Fundamental Research Funds for the Central Universities under Grant Nos. N161702001, N2017010 and N172410005-2.
Acknowledgments
We would like to thank the anonymous reviewers for their careful reading and useful comments that helped us to improve the final version of this paper.
Conflicts of Interest
The authors declare that there are no conflict of interest regarding the publication of this paper.
References
- Lü, L.; Chen, D.; Ren, X.L.; Zhang, Q.M.; Zhang, Y.C.; Zhou, T. Vital nodes identification in complex networks. Phys. Rep. 2016, 650, 1–63. [Google Scholar] [CrossRef] [Green Version]
- Basaras, P.; Iosifidis, G.; Katsaros, D.; Tassiulas, L. Identifying influential spreaders in complex multilayer networks: A centrality perspective. IEEE Trans. Netw. Sci. Eng. 2017, 6, 31–45. [Google Scholar] [CrossRef]
- Ren, X. Review of ranking nodes in complex networks. Chin. Sci. Bull. 2014, 59, 1175–1197. [Google Scholar] [CrossRef]
- Morone, F.; Makse, H.A. Influence maximization in complex networks through optimal percolation. Nature 2015, 524, 65–68. [Google Scholar] [CrossRef] [Green Version]
- Opsahl, T.; Agneessens, F.; Skvoretz, J. Node centrality in weighted networks: Generalizing degree and shortest paths. Soc. Netw. 2010, 32, 245–251. [Google Scholar] [CrossRef]
- Richardson, M.; Domingos, P. Mining knowledge-sharing sites for viral marketing. In Proceedings of the Eighth ACM SIGKDD International Conference on Knowledge Discovery and Data Mining, Edmonton, AB, Canada, 23–26 July 2002; pp. 61–70. [Google Scholar]
- Pastor-Satorras, R.; Vespignani, A. Immunization of complex networks. Phys. Rev. E 2002, 65, 036104. [Google Scholar] [CrossRef] [PubMed] [Green Version]
- Albert, R.; Albert, I.; Nakarado, G.L. Structural vulnerability of the North American power grid. Phys. Rev. E 2004, 69, 025103. [Google Scholar] [CrossRef] [Green Version]
- Salavati, C.; Abdollahpouri, A.; Manbari, Z. BridgeRank: A novel fast centrality measure based on local structure of the network. Phys. A Stat. Mech. Its Appl. 2018, 496, 635–653. [Google Scholar] [CrossRef]
- Thai, M.T.; Wu, W.; Xiong, H. Big Data in Complex and Social Networks; CRC Press: Boca Raton, FL, USA, 2016. [Google Scholar]
- Liu, W.; Suzumura, T.; Ji, H.; Hu, G. Finding overlapping communities in multilayer networks. PLoS ONE 2018, 13, e0188747. [Google Scholar] [CrossRef]
- Wang, D.; Wang, H.; Zou, X. Identifying key nodes in multilayer networks based on tensor decomposition. Chaos Interdiscip. J. Nonlinear Sci. 2017, 27, 063108. [Google Scholar] [CrossRef] [Green Version]
- Kivelä, M.; Arenas, A.; Barthelemy, M.; Gleeson, J.P.; Moreno, Y.; Porter, M.A. Multilayer networks. J. Complex Netw. 2014, 2, 203–271. [Google Scholar] [CrossRef] [Green Version]
- Boccaletti, S.; Bianconi, G.; Criado, R.; Del Genio, C.I.; Gómez-Gardenes, J.; Romance, M.; Sendina-Nadal, I.; Wang, Z.; Zanin, M. The structure and dynamics of multilayer networks. Phys. Rep. 2014, 544, 1–122. [Google Scholar] [CrossRef] [PubMed] [Green Version]
- Domingos, P.; Richardson, M. Mining the network value of customers. In Proceedings of the Seventh ACM SIGKDD International Conference on Knowledge Discovery and Data Mining, San Francisco, CA, USA, 26–29 August 2001; pp. 57–66. [Google Scholar]
- Kempe, D.; Kleinberg, J.; Tardos, É. Maximizing the spread of influence through a social network. In Proceedings of the Ninth ACM SIGKDD International Conference on Knowledge Discovery and Data Mining, Washington, DC, USA, 24–27 August 2003; pp. 137–146. [Google Scholar]
- Li, X.; Zhang, X.; Zhao, C.; Yi, D.; Li, G. Identifying highly influential nodes in multilayer networks based on global propagation. Chaos Interdiscip. J. Nonlinear Sci. 2020, 30, 061107. [Google Scholar] [CrossRef] [PubMed]
- Ford, L.R.; Fulkerson, D.R. Maximal flow through a network. In Classic Papers in Combinatorics; Springer: Berlin/Heidelberg, Germany, 2009; pp. 243–248. [Google Scholar]
- Corley, H., Jr.; Chang, H. Finding the n most vital nodes in a flow network. Manag. Sci. 1974, 21, 362–364. [Google Scholar] [CrossRef]
- Peng, S.; Zhou, Y.; Cao, L.; Yu, S.; Niu, J.; Jia, W. Influence analysis in social networks: A survey. J. Netw. Comput. Appl. 2018, 106, 17–32. [Google Scholar] [CrossRef]
- Grover, A.; Leskovec, J. node2vec: Scalable feature learning for networks. In Proceedings of the 22nd ACM SIGKDD International Conference on Knowledge Discovery and Data Mining, San Francisco, CA, USA, 13–17 August 2016; pp. 855–864. [Google Scholar]
- Bonacich, P. Factoring and weighting approaches to status scores and clique identification. J. Math. Sociol. 1972, 2, 113–120. [Google Scholar] [CrossRef]
- Freeman, L.C. A set of measures of centrality based on betweenness. Sociometry 1977, 40, 35–41. [Google Scholar] [CrossRef]
- Freeman, L.C. Centrality in social networks conceptual clarification. Soc. Netw. 1978, 1, 215–239. [Google Scholar] [CrossRef] [Green Version]
- Bonacich, P. Power and centrality: A family of measures. Am. J. Sociol. 1987, 92, 1170–1182. [Google Scholar] [CrossRef]
- Brin, S.; Page, L. The anatomy of a large-scale hypertextual web search engine. Comput. Netw. ISDN Syst. 1998, 30, 107–117. [Google Scholar] [CrossRef]
- Hirsch, J.E. An index to quantify an individual’s scientific research output. Proc. Natl. Acad. Sci. USA 2005, 102, 16569–16572. [Google Scholar] [CrossRef] [PubMed] [Green Version]
- Kitsak, M.; Gallos, L.K.; Havlin, S.; Liljeros, F.; Muchnik, L.; Stanley, H.E.; Makse, H.A. Identification of influential spreaders in complex networks. Nat. Phys. 2010, 6, 888. [Google Scholar] [CrossRef] [Green Version]
- Ma, L.L.; Ma, C.; Zhang, H.F.; Wang, B.H. Identifying influential spreaders in complex networks based on gravity formula. Phys. A Stat. Mech. Its Appl. 2016, 451, 205–212. [Google Scholar] [CrossRef] [Green Version]
- Li, Z.; Ren, T.; Ma, X.; Liu, S.; Zhang, Y.; Zhou, T. Identifying influential spreaders by gravity model. Sci. Rep. 2019, 9, 8387. [Google Scholar] [CrossRef] [PubMed] [Green Version]
- Maji, G.; Mandal, S.; Sen, S. A systematic survey on influential spreaders identification in complex networks with a focus on K-shell based techniques. Expert Syst. Appl. 2020, 161, 113681. [Google Scholar] [CrossRef]
- Fan, T.; Lü, L.; Shi, D. Towards the cycle structures in complex network: A new perspective. arXiv 2019, arXiv:1903.01397. [Google Scholar]
- Huang, X.; Chen, D.; Wang, D.; Ren, T. Identifying Influencers in Social Networks. Entropy 2020, 22, 450. [Google Scholar] [CrossRef]
- Lü, L.; Zhang, Y.C.; Yeung, C.H.; Zhou, T. Leaders in social networks, the delicious case. PLoS ONE 2011, 6, e21202. [Google Scholar] [CrossRef] [Green Version]
- Al-Garadi, M.A.; Varathan, K.D.; Ravana, S.D.; Ahmed, E.; Chang, V. Identifying the influential spreaders in multilayer interactions of online social networks. J. Intell. Fuzzy Syst. 2016, 31, 2721–2735. [Google Scholar] [CrossRef] [Green Version]
- Singh, S.S.; Singh, K.; Kumar, A.; Biswas, B. MIM2: Multiple influence maximization across multiple social networks. Phys. A Stat. Mech. Its Appl. 2019, 526, 120902. [Google Scholar] [CrossRef]
- Chen, X.; Zhou, J.; Liao, Z.; Liu, S.; Zhang, Y. A Novel Method to Rank Influential Nodes in Complex Networks Based on Tsallis Entropy. Entropy 2020, 22, 848. [Google Scholar] [CrossRef]
- Molaei, S.; Farahbakhsh, R.; Salehi, M.; Crespi, N. Identifying Influential Nodes in Heterogeneous Networks. Expert Syst. Appl. 2020, 160, 113580. [Google Scholar] [CrossRef]
- Hosni, A.I.E.; Li, K.; Ahmad, S. Minimizing rumor influence in multiplex online social networks based on human individual and social behaviors. Inf. Sci. 2020, 512, 1458–1480. [Google Scholar] [CrossRef]
- Tidke, B.; Mehta, R.; Dhanani, J. Consensus-based aggregation for identification and ranking of top-k influential nodes. Neural Comput. Appl. 2019, 32, 1–27. [Google Scholar] [CrossRef]
- Li, M.; Zhang, Q.; Deng, Y. Evidential identification of influential nodes in network of networks. Chaos Solitons Fractals 2018, 117, 283–296. [Google Scholar] [CrossRef]
- Battiston, F.; Nicosia, V.; Latora, V. Structural measures for multiplex networks. Phys. Rev. E 2014, 89, 032804. [Google Scholar] [CrossRef] [Green Version]
- Pedroche, F.; Tortosa, L.; Vicent, J.F. An eigenvector centrality for multiplex networks with data. Symmetry 2019, 11, 763. [Google Scholar] [CrossRef] [Green Version]
- Wang, S.; Liu, J.; Jin, Y. Finding influential nodes in multiplex networks using a memetic algorithm. IEEE Trans. Cybern. 2019. [Google Scholar] [CrossRef]
- Xie, W.B.; Lee, Y.L.; Wang, C.; Chen, D.B.; Zhou, T. Hierarchical clustering supported by reciprocal nearest neighbors. Inf. Sci. 2020, 527, 279–292. [Google Scholar] [CrossRef] [Green Version]
- Fu, G.; Hou, C.; Yao, X. Learning topological representation for networks via hierarchical sampling. In Proceedings of the IEEE 2019 International Joint Conference on Neural Networks (IJCNN), Budapest, Hungary, 14–19 July 2019; pp. 1–8. [Google Scholar]
- Chen, H.; Perozzi, B.; Hu, Y.; Skiena, S. Harp: Hierarchical representation learning for networks. In Proceedings of the Thirty-Second AAAI Conference on Artificial Intelligence, New Orleans, LA, USA, 2–7 February 2018. [Google Scholar]
- Ye, Z.; Zhan, X.; Zhou, Y.; Liu, C.; Zhang, Z.K. Identifying vital nodes on temporal networks: An edge-based K-Shell decomposition. In Proceedings of the IEEE 2017 36th Chinese Control Conference (CCC), Dalian, China, 26–28 July 2017; pp. 1402–1407. [Google Scholar]
- Chen, X.; Tan, M.; Zhao, J.; Yang, T.; Wu, D.; Zhao, R. Identifying influential nodes in complex networks based on a spreading influence related centrality. Phys. A Stat. Mech. Its Appl. 2019, 536, 122481. [Google Scholar] [CrossRef]
- Zareie, A.; Sheikhahmadi, A. A hierarchical approach for influential node ranking in complex social networks. Expert Syst. Appl. 2018, 93, 200–211. [Google Scholar] [CrossRef]
- Tsiropoulou, E.; Koukas, K.; Papavassiliou, S. A socio-physical and mobility-aware coalition formation mechanism in public safety networks. EAI Endorsed Trans. Future Internet 2018, 4, 154176. [Google Scholar] [CrossRef]
- Huang, H.; Shen, H.; Meng, Z.; Chang, H.; He, H. Community-based influence maximization for viral marketing. Appl. Intell. 2019, 49, 2137–2150. [Google Scholar] [CrossRef]
- Hu, P.; Fan, W.L. Mitigation strategy against cascading failures considering vulnerable transmission line in power grid. Phys. A Stat. Mech. Its Appl. 2020, 540, 123230. [Google Scholar] [CrossRef]
- Nikolaou, P.; Dimitriou, L. Identification of critical airports for controlling global infectious disease outbreaks: Stress-tests focusing in Europe. J. Air Transp. Manag. 2020, 85, 101819. [Google Scholar] [CrossRef] [PubMed]
- Fragkos, G.; Apostolopoulos, P.A.; Tsiropoulou, E.E. ESCAPE: Evacuation strategy through clustering and autonomous operation in public safety systems. Future Internet 2019, 11, 20. [Google Scholar] [CrossRef] [Green Version]
- Peng, B.; Chen, W. Adaptive influence maximization with myopic feedback. In Proceedings of the Advances in Neural Information Processing Systems, Vancouver, BC, Canada, 13 December 2019; pp. 5574–5583. [Google Scholar]
- Guo, C.; Yang, L.; Chen, X.; Chen, D.; Gao, H.; Ma, J. Influential Nodes Identification in Complex Networks via Information Entropy. Entropy 2020, 22, 242. [Google Scholar] [CrossRef] [Green Version]
- Tidke, B.; Mehta, R.; Dhanani, J. Multimodal ensemble approach to identify and rank top-k influential nodes of scholarly literature using Twitter network. J. Inf. Sci. 2020, 46, 437–458. [Google Scholar] [CrossRef]
- Hethcote, H.W. The mathematics of infectious diseases. SIAM Rev. 2000, 42, 599–653. [Google Scholar] [CrossRef] [Green Version]
- Guan-Rong, C.; Xiao-Fan, W.; Xiang, L. Introduction to Complex Networks: Models, Structures and Dynamics; Higher Education Press: Beijing, China, 2012. [Google Scholar]
- Raghavan, U.N.; Albert, R.; Kumara, S. Near linear time algorithm to detect community structures in large-scale networks. Phys. Rev. E 2007, 76, 036106. [Google Scholar] [CrossRef] [Green Version]
- Zachary, W.W. An information flow model for conflict and fission in small groups. J. Anthropol. Res. 1977, 33, 452–473. [Google Scholar] [CrossRef] [Green Version]
- Rossi, R.; Ahmed, N. The network data repository with interactive graph analytics and visualization. In Proceedings of the Twenty-Ninth AAAI Conference on Artificial Intelligence, Austin, TX, USA, 25–30 January 2015. [Google Scholar]
- Girvan, M.; Newman, M.E. Community structure in social and biological networks. Proc. Natl. Acad. Sci. USA 2002, 99, 7821–7826. [Google Scholar] [CrossRef] [PubMed] [Green Version]
- Lusseau, D.; Schneider, K.; Boisseau, O.J.; Haase, P.; Slooten, E.; Dawson, S.M. The bottlenose dolphin community of Doubtful Sound features a large proportion of long-lasting associations. Behav. Ecol. Sociobiol. 2003, 54, 396–405. [Google Scholar] [CrossRef]
- Tsvetovat, M.; Kouznetsov, A. Social Network Analysis for Startups: Finding Connections on the Social Web; OŔeilly Media, Inc.: Newton, MA, USA, 2011. [Google Scholar]
- Knuth, D.E. The Stanford GraphBase: A platform for combinatorial algorithms. In Proceedings of the SODA, Austin, TX, USA, 25–27 January 1993; Volume 93, pp. 41–43. [Google Scholar]
- Shen-Orr, S.S.; Milo, R.; Mangan, S.; Alon, U. Network motifs in the transcriptional regulation network of Escherichia coli. Nat. Genet. 2002, 31, 64–68. [Google Scholar] [CrossRef]
- Watts, D.J.; Strogatz, S.H. Collective dynamics of ‘small-world’ networks. Nature 1998, 393, 440. [Google Scholar] [CrossRef] [PubMed]
- Huang, X.; Chen, D.; Ren, T. Social network coalescence based on multilayer network model. J. Nonlinear Convex Anal. 2019, 20, 1465–1474. [Google Scholar]
- Gleiser, P.M.; Danon, L. Community structure in jazz. Adv. Complex Syst. 2003, 6, 565–573. [Google Scholar] [CrossRef] [Green Version]
- Colizza, V.; Pastor-Satorras, R.; Vespignani, A. Reaction–diffusion processes and metapopulation models in heterogeneous networks. Nat. Phys. 2007, 3, 276–282. [Google Scholar] [CrossRef] [Green Version]
- Newman, M.E. Modularity and community structure in networks. Proc. Natl. Acad. Sci. USA 2006, 103, 8577–8582. [Google Scholar] [CrossRef] [Green Version]
- Cho, A.; Shin, J.; Hwang, S.; Kim, C.; Shim, H.; Kim, H.; Kim, H.; Lee, I. WormNet v3: A network-assisted hypothesis-generating server for Caenorhabditis elegans. Nucleic Acids Res. 2014, 42, W76–W82. [Google Scholar] [CrossRef] [Green Version]
- Beveridge, A.; Shan, J. Network of thrones. Math Horizons 2016, 23, 18–22. [Google Scholar] [CrossRef]
- Action, R. the Rise of the Medici. Am. J. Sociol. 1993, 98, 1259–1319. [Google Scholar]
- Stark, C.; Breitkreutz, B.J.; Reguly, T.; Boucher, L.; Breitkreutz, A.; Tyers, M. BioGRID: A general repository for interaction datasets. Nucleic Acids Res. 2006, 34, D535–D539. [Google Scholar] [CrossRef] [PubMed] [Green Version]
- De Domenico, M.; Solé-Ribalta, A.; Gómez, S.; Arenas, A. Navigability of interconnected networks under random failures. Proc. Natl. Acad. Sci. USA 2014, 111, 8351–8356. [Google Scholar] [CrossRef] [PubMed] [Green Version]
- Coleman, J.; Katz, E.; Menzel, H. The diffusion of an innovation among physicians. Sociometry 1957, 20, 253–270. [Google Scholar] [CrossRef]
- Chen, B.L.; Hall, D.H.; Chklovskii, D.B. Wiring optimization can relate neuronal structure and function. Proc. Natl. Acad. Sci. USA 2006, 103, 4723–4728. [Google Scholar] [CrossRef] [Green Version]
- De Domenico, M.; Nicosia, V.; Arenas, A.; Latora, V. Structural reducibility of multilayer networks. Nat. Commun. 2015, 6, 1–9. [Google Scholar] [CrossRef] [Green Version]
- De Domenico, M.; Lancichinetti, A.; Arenas, A.; Rosvall, M. Identifying modular flows on multilayer networks reveals highly overlapping organization in interconnected systems. Phys. Rev. X 2015, 5, 011027. [Google Scholar] [CrossRef] [Green Version]
- Cardillo, A.; Gómez-Gardenes, J.; Zanin, M.; Romance, M.; Papo, D.; Del Pozo, F.; Boccaletti, S. Emergence of network features from multiplexity. Sci. Rep. 2013, 3, 1344. [Google Scholar] [CrossRef] [Green Version]
- Newman, M.E. Power laws, Pareto distributions and Zipf’s law. Contemp. Phys. 2005, 46, 323–351. [Google Scholar] [CrossRef] [Green Version]
- Newman, M. Networks; Oxford University Press: Oxford, UK, 2018. [Google Scholar]
- Meghanathan, N. Complex Network Analysis of the Contiguous United States Graph. Comput. Inf. Sci. 2017, 10, 54–76. [Google Scholar] [CrossRef] [Green Version]
Figure 1.
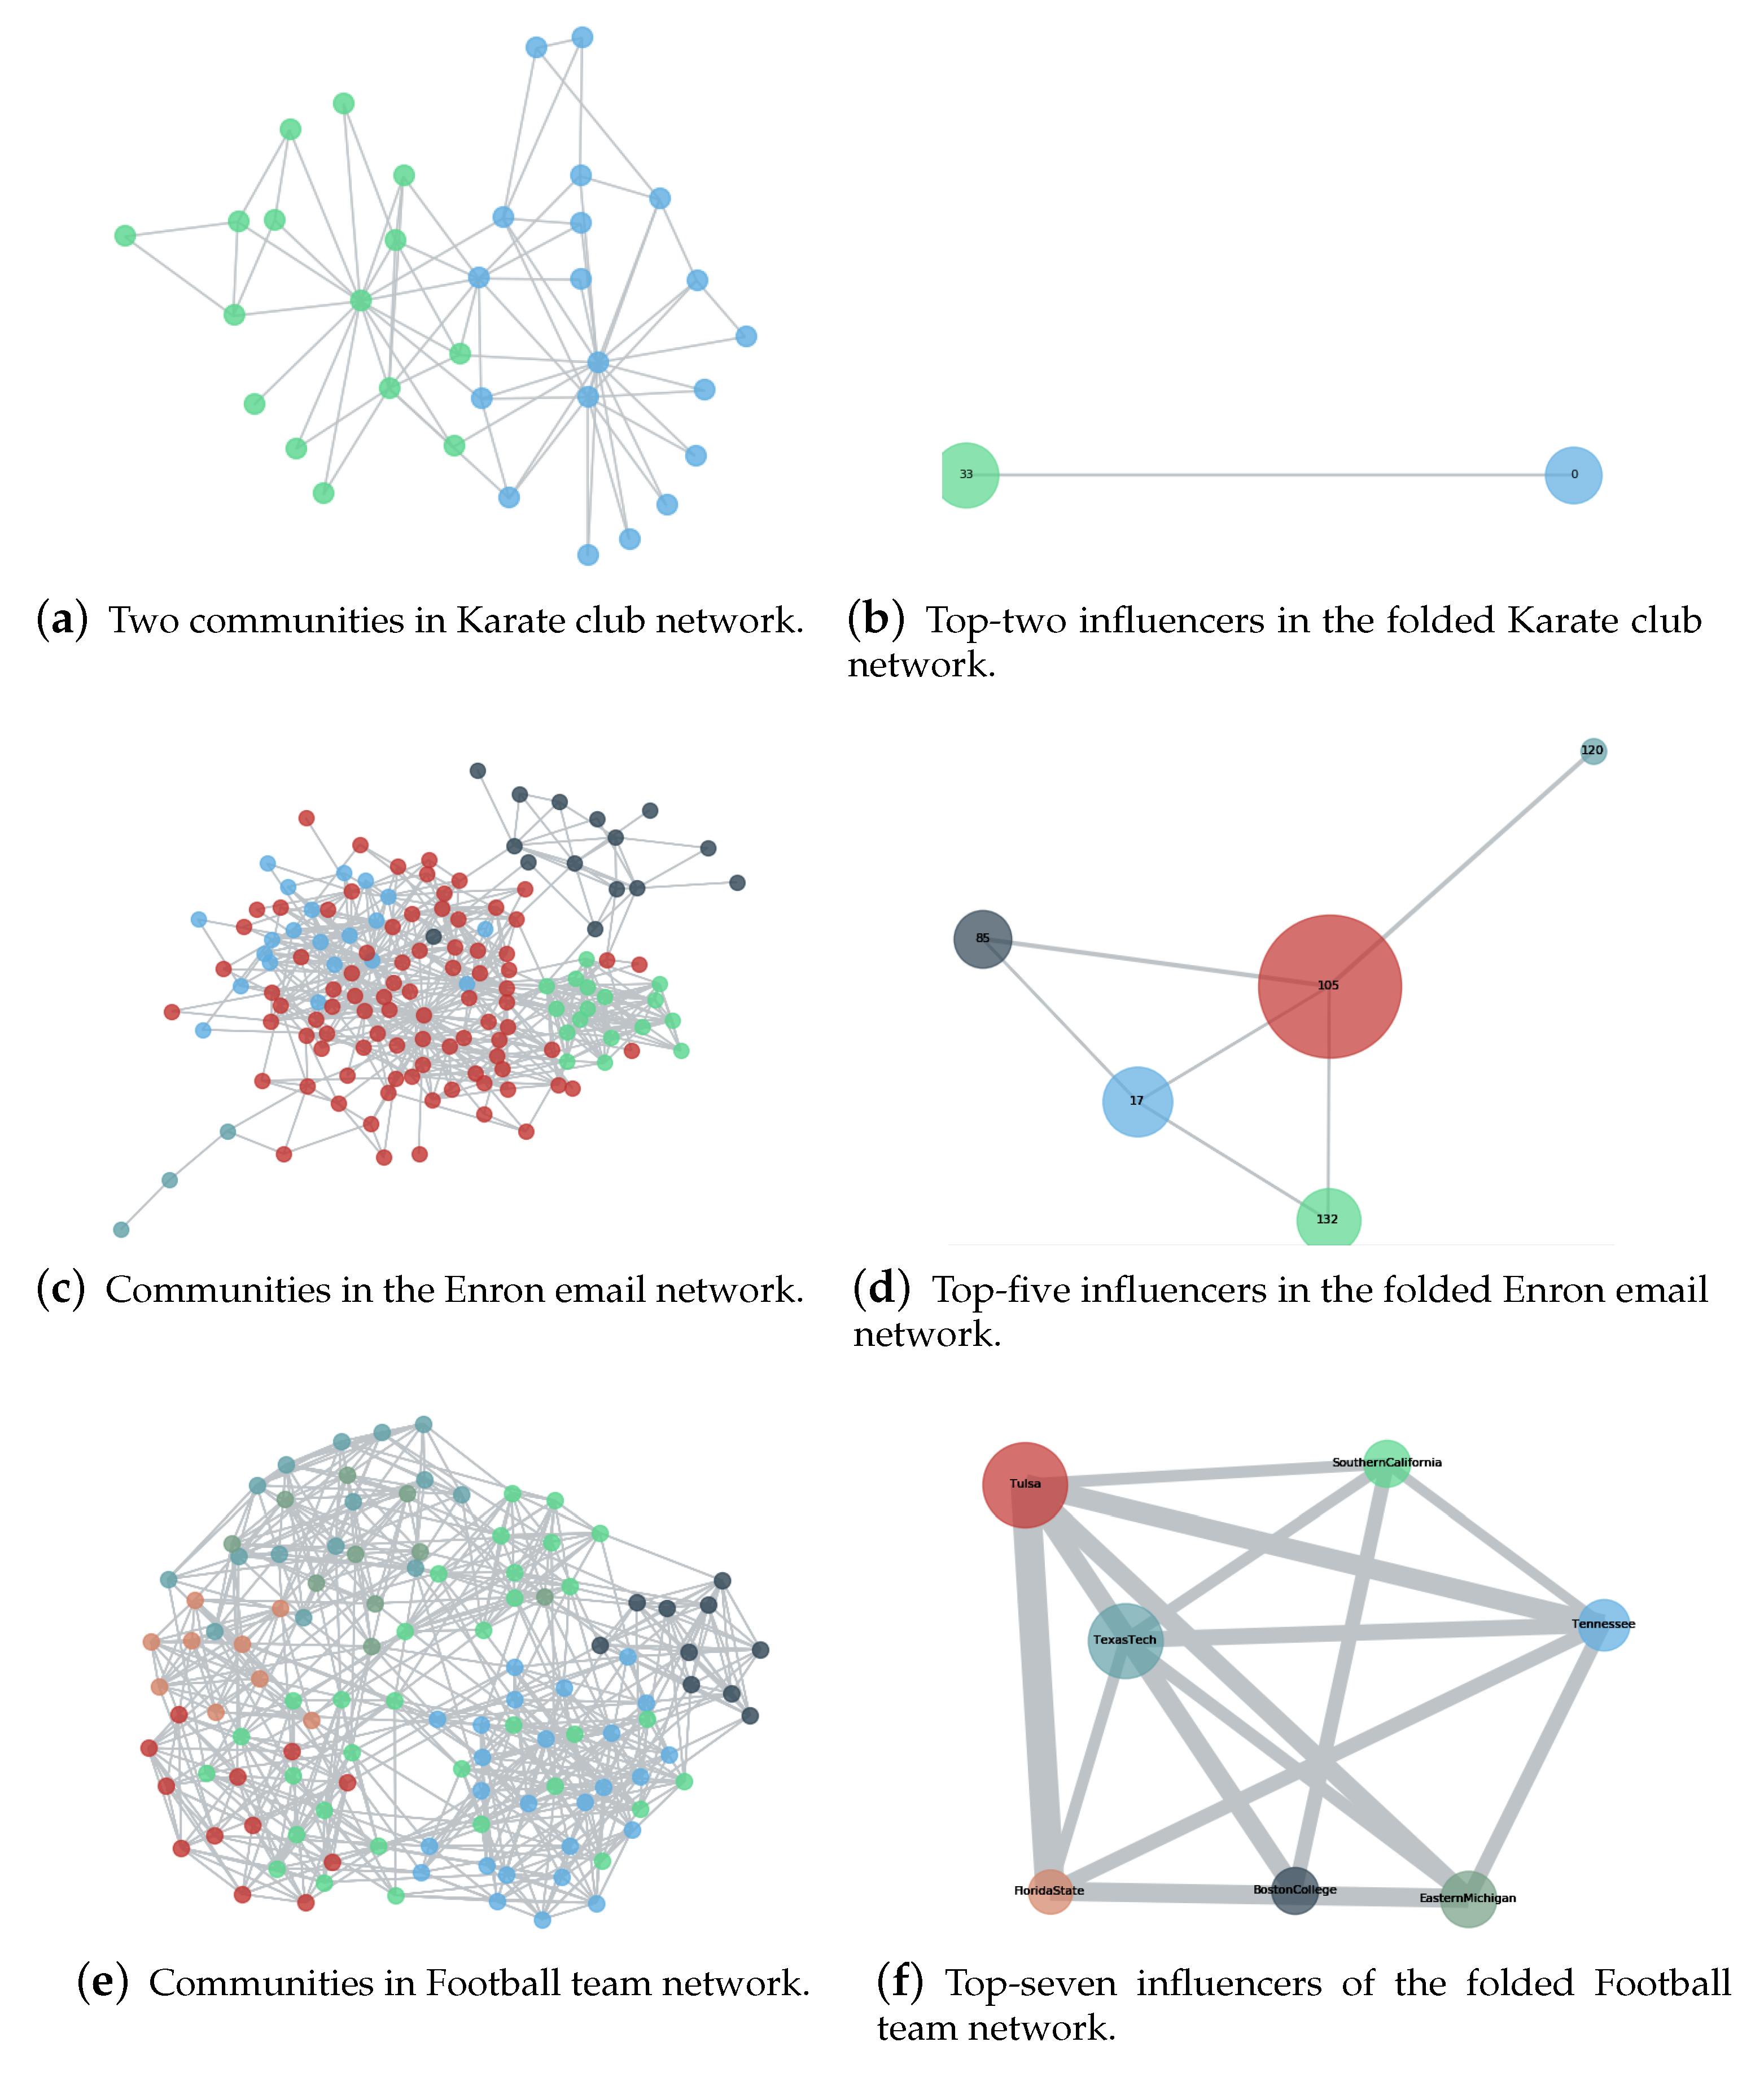
Illustration of the proposed Maximum Influential Neighbors Expansion (MINE) algorithm. Communities in three real-world networks (i.e., Karate Club network [62], Enron email network [63] and College Football Team network [64]) are presented in the left three panels the and top-ranking nodes are highlighted in the right three panels, which suggests that the MINE algorithm aims to identifying vital nodes hierarchically.
Figure 1.
Illustration of the proposed Maximum Influential Neighbors Expansion (MINE) algorithm. Communities in three real-world networks (i.e., Karate Club network [62], Enron email network [63] and College Football Team network [64]) are presented in the left three panels the and top-ranking nodes are highlighted in the right three panels, which suggests that the MINE algorithm aims to identifying vital nodes hierarchically.

Figure 2.
The comparison of varying subgraphs with the removal of the most influential nodes repeatedly with each centrality method on 16 monolayer networks. The proposed MINE algorithm (marked with blue triangles) shows superiority to the BC and LGR methods by obtaining more subgraphs in the removal process.

Figure 3.
The comparison of varying subgraphs with the removal of the most influential nodes repeatedly with each centrality method on 16 multilayer networks. The proposed MINE algorithm (marked with blue triangles) shows superiority to the BC and LGR methods on the majority of datasets except for HepatitusCVirus, while it is close to the performance of the LGR method (marked with green squares).

Figure 4.
The comparison of recovered nodes with varying k (from 0 to 20 percent of total nodes) on 16 monolayer networks. The proposed MINE algorithm (marked with blue triangles) shows superiority to the competitors on Polbooks, Enron, NS, DMLC, Game of Thrones and Power datasets. While on the Jazz dataset, the MINE algorithm is second to BC (marked with orange circles) when k is in the range of , while MINE achieves more recovered nodes (averaged 52.9888) than that of BC (averaged 52.5331) when k is set as 38 (i.e., twenty percent of the number of nodes in the Jazz dataset).

Figure 5.
The comparison of recovered nodes with varying k (from 0 to 20 percent of total nodes) on 16 multilayer networks. The proposed MINE algorithm (marked with blue triangles) shows superiority to the competitors on BOS, Candida, C.Elegans, DanioRerio, Gallus, HumanHerpes4, LondonTransport, Oryctolagus, Plasmodium, PierreAuger, Rattus and Xenopus datasets, while on the EUAirTransportation dataset, the MINE algorithm is second to INF (marked with purple diamonds).

Figure 6.
Comparisons of accumulated execution time by performing the competitive measures on the grouped datasets.
Figure 6.
Comparisons of accumulated execution time by performing the competitive measures on the grouped datasets.

Figure 7.
The vital provinces of China measured by the proposed MINE algorithm, where Inner Mongolia, Sichuan, Zhejiang and Guangdong hold more importance in the graph of the adjacencies (formed by 34 vertices and 73 edges). By performing with the proposed MINE algorithm, we can find that Inner Mongolia holds the maximum importance in the derived network model, which may result from its huge span in longitude () and adjacencies to eight other provinces, i.e., Gansu, Ningxia, Shaanxi, Shanxi, Hebei, Liaoning, Jilin and Heilongjiang. Zhejiang is the second influential province measured by the MINE algorithm, which suggests its vital position in the southeast of China.

Figure 8.
The influence of the lower 48 United States is measured by the proposed MINE algorithm based on the graph of adjacencies (formed by 48 vertices and 104 edges). By performing with MINE algorithm, Missouri (with maximum importance which is same to the conclusion of Meghanathan’s research), following by Massachusetts and Idaho (also pointed out by Meghanathan as a vital state) are identified as the top-3 vital states, which are respectively located in the middle, east and west of the lower 48 United States. By activating the top-3 nodes and their neighbors in the graph of adjacencies, we are able to get a maximum collection of activated states that covers the majority of the United States, which are probably to exert strong influence.


Table 1.
A brief comparison of node centrality measures.
| Metric | Equation | Topology | Complexity |
|---|---|---|---|
| DC [22] | Local | ||
| BC [23] | Global | ||
| CC [24] | Global | ||
| EC [25] | Global | ||
| PR [26] | Global | ||
| H-index [27] | Semi-local | ||
| k-core [28] | s.t. | Global | |
| LR [34] | Global | ||
| GR, GR+ [29] | , | Global | |
| LGR [30] | Semi-local | ||
| INF [33] | Local |
Note:n denotes the number of nodes, denotes the neighbors of node i, k denotes the averaging degree, denotes the element at the i-th row and j-column of the adjacency matrix A; denotes the set of natural numbers; is the shortest path length from node i to node j; in BC (i.e., betweenness centrality) is the total number of shortest paths, is the shortest path between s and t that passes through node i; in eigenvector centrality (EC), depicts the eigenvalue at the stable state; in PageRank (PR), , is the number of edges from node j to i; in k-core, represents the node set after removing nodes with degree less or equal to k, likewise, represents the node set after removing nodes with degree less or equal to ; in LR (i.e., LeaderRank), denotes the score of node i at time t, denotes the score of the ground node at steady state; in GR denotes the neighbors whose distance to node i is less than or equal to 3; R in Local-Gravity (LGR) denotes the truncation radius, i.e., only nodes within R steps are under consideration; in INF (i.e., the node influence) denotes the weight of edge in a weighted network.
Table 2.
Statistics of 16 monolayer network datasets that are utilized in this paper.
| Dataset Name | |E| | <k> | <d> | <C> | r | |H| | ||
|---|---|---|---|---|---|---|---|---|
| Club [62] | 34 | 78 | 4.5882 | 2.4082 | 0.5706 | –0.4756 | 1.6933 | 0.1477 |
| Dolphins [65] | 62 | 159 | 5.1290 | 3.3570 | 0.2590 | –0.0436 | 1.3268 | 0.1723 |
| 911 [66] | 69 | 159 | 4.6087 | 2.4672 | 0.4698 | –0.0380 | 1.7304 | 0.1434 |
| Lesmis [67] | 77 | 254 | 6.5974 | 2.6411 | 0.5731 | –0.1652 | 1.8273 | 0.0905 |
| Voles [63] | 89 | 143 | 3.2135 | 0.5610 | 0.6083 | 0.2877 | 1.3340 | 0.3043 |
| Escherichia [68] | 97 | 212 | 4.3711 | 5.5369 | 0.3675 | 0.4116 | 1.2367 | 0.2270 |
| Polbooks [69] | 105 | 441 | 8.4000 | 3.0788 | 0.4875 | –0.1279 | 1.4207 | 0.0915 |
| Football [64] | 115 | 613 | 10.6609 | 2.5082 | 0.4032 | 0.1624 | 1.0069 | 0.1027 |
| Enron [63] | 143 | 623 | 8.7133 | 2.9670 | 0.4339 | –0.0195 | 1.4829 | 0.0839 |
| NEUSNCP [70] | 167 | 465 | 5.5689 | 2.8810 | 0.3122 | –0.3619 | 3.3624 | 0.0564 |
| Jazz [71] | 198 | 2742 | 27.6970 | 2.2350 | 0.6175 | 0.0202 | 1.3951 | 0.0266 |
| USAir [72] | 332 | 2126 | 12.8072 | 2.7381 | 0.6252 | –0.2079 | 3.4639 | 0.0231 |
| NS [73] | 379 | 914 | 4.8232 | 6.0419 | 0.7412 | –0.0817 | 1.6630 | 0.1424 |
| DMLC [74] | 659 | 1570 | 4.7648 | 2.6370 | 0.3279 | –0.1914 | 14.8897 | 0.0143 |
| Game of Thrones [75] | 796 | 2823 | 7.0930 | 3.4162 | 0.4859 | –0.1154 | 4.1941 | 0.0348 |
| Power [69] | 4941 | 6594 | 2.6691 | 18.9892 | 0.0801 | 0.0035 | 1.4504 | 0.3483 |
Note: and depict the number of nodes and edges, respectively. <k> denotes the average degree; <d> is the average shortest path; <C> is the average clustering index; r is the assortativity coefficient; is the degree heterogeneity and represents the epidemic threshold of the Susceptible-Infected-Recovered (SIR) model; Club represents a graph constructing from W.W. Zachary’s investigation on the karate club of a university in USA in 1970-72, which contains 34 nodes and 78 edges based on the observation on the relationship of club members; Dolphins contains an undirected social network of frequent associations between 62 dolphins in a community living off Doubtful Sound, New Zealand, as compiled by Lusseau et al. in 2003; 911 represents the social relationships of terrorists at Hamburg Cell (which started the planning for 9/11 and ultimately participated in the attack); Lesmis is the coappearance network of characters in the novel “Les Miserables”; Voles is an animal interaction network where the nodes represent voles and there will be an edge between two voles if they have ever been caught in at least one common trap; Escherichia is transcriptional regulation networks in cells orchestrate gene expression, where nodes represent operons, and each edge is directed from an operon that encodes a transcription factor to an operon that it directly regulates; Polbooks is a network of books about US politics published around the time of the 2004 presidential election and sold by Amazon, where nodes represent books and there will be an edge between two books if they are frequent co-purchased by the same buyers; Football describes the network of American football games between Division IA colleges during regular season Fall 2000; Enron is an email network collected from Enron company, where nodes represents; NEUSNCP collects the relationships of members in a social platform; Jazz represents the network derived from the collaboration patterns of jazz musicians; USAir is an undirected, weighted network representing US airports, where the nodes represent airports and the edges represent air travel connections among them; NS represents the largest component of coauthorships between scientists working on network theory and experiment; Game of Thrones represents the relationships of characters in the first five volumes of the novel “A Song of Ice and Fire”; DMLC represents the inferred links by small/medium-scale protein-protein interactions; Power is an undirected, unweighted network representing the topology of the Western States Power Grid of the USA.
Table 3.
Statistics of 16 multilayer datasets that are utilized in this paper.
| Dataset Name | |E| | || | || | <k> | <d> | <C> | |||
|---|---|---|---|---|---|---|---|---|---|
| Padgett [76] | 2 | 26 | 46 | 35 | 11 | 3.5385 | 2.6923 | 1.1550 | 0.3239 |
| HepatitusCVirus [77] | 3 | 129 | 152 | 125 | 27 | 2.3566 | 2.3582 | 12.4008 | 0.0354 |
| Oryctolagus [77] | 3 | 151 | 145 | 138 | 7 | 1.9205 | 0.5642 | 11.7317 | 0.0464 |
| LondonTransport [78] | 3 | 399 | 472 | 441 | 31 | 2.3659 | 14.2989 | 1.1597 | 0.5735 |
| CKM [79] | 3 | 674 | 2005 | 1370 | 635 | 5.9496 | 1.1677 | 1.1879 | 0.1648 |
| C.Elegans [80] | 3 | 791 | 3857 | 3108 | 749 | 9.7522 | 3.5346 | 1.6895 | 0.0646 |
| Plasmodium [81] | 3 | 1206 | 2489 | 2486 | 3 | 4.1277 | 3.9403 | 2.9832 | 0.0884 |
| HumanHerpes4 [77] | 4 | 261 | 299 | 241 | 58 | 2.2912 | 2.9561 | 18.5515 | 0.0241 |
| BOS [81] | 4 | 369 | 360 | 311 | 49 | 1.9512 | 0.4116 | 2.0429 | 0.3349 |
| DanioRerio [77] | 5 | 180 | 206 | 173 | 33 | 2.2889 | 0.3325 | 1.6161 | 0.3705 |
| Xenopus [77] | 5 | 582 | 710 | 568 | 142 | 2.4399 | 2.8018 | 2.0464 | 0.2504 |
| Gallus [81] | 6 | 367 | 411 | 348 | 63 | 2.2398 | 1.277 | 12.5034 | 0.0370 |
| Rattus [81] | 6 | 3263 | 4670 | 3956 | 714 | 2.8624 | 3.9011 | 30.0001 | 0.0118 |
| Candida [81] | 7 | 418 | 446 | 386 | 60 | 2.1340 | 2.1034 | 28.0935 | 0.0170 |
| PierreAuger [82] | 16 | 965 | 8022 | 7153 | 869 | 16.6259 | 4.8105 | 2.8617 | 0.0215 |
| EUAirTransportation [83] | 37 | 2034 | 15199 | 3588 | 11611 | 14.9449 | 3.5087 | 1.6187 | 0.0431 |
Note: represents the number of layers; and are the number of nodes and edges, respectively; and are the number of intralayer edges and interlayer edges, respectively; <k> depicts the average degree; <d> depicts the average shortest path; <C> represents the average clustering coefficient and represents the epidemic threshold of the SIR model; Padgett is a two-layered network consists of 2 layers (marriage alliances and business relationships) describing florentine families in the Renaissance; HepatitusCVirus represents the multiplex genetic and protein interactions network of the Hepatitus C virus; Oryctolagus represents the multiplex genetic and protein interactions network of the Oryctolagus Cuniculus, also known as European rabbit; LondonTransport is collected from the official website of Transport for London (https://www.tfl.gov.uk/), where the nodes represent train stations in London and edges represent existing routes between stations; CKM is collected by Coleman, Katz and Menzel (CKM, for short) on medical innovation, considering physicians in four towns in Illinois, Peoria, Bloomington, Quincy and Galesburg; C.Elegans represents the edges of the metabolic network of Caenorhabditis elegans; Plasmodium represents the protein interactions network of the Plasmodium Falciparum; HumanHerpes4 represents the multiplex genetic and protein interactions network of the Epstein-Barr virus, i.e., human herpes-virus 4 (HHV-4); BOS represents the multiplex genetic and protein interactions network of the Bos Linnaeus; DanioRerio represents the multiplex genetic and protein interactions network of the Danio Rerio (zebrafish), a tropical freshwater fish, composed of the following five layers: association, suppressive genetic interaction defined by inequality, direct interaction, additive genetic interaction defined by inequality and physical association; Xenopus represents the multiplex genetic and protein interactions network of the Xenopus Laevis, a species of African aquatic frog of the Pipidae family; Gallus represents the interactions among Gullus with six layers: direct interaction, physical association, synthetic genetic interaction defined by inequality colocalization, colocalization, additive genetic interaction defined by inequality, and association; Rattus and Candida represent the multiplex genetic and protein interactions network of the Rattus Norvegicus and Candida Albicans, respectively; PierreAuger represents the multiplex coauthorship network in the internal report repository of the Pierre Auger Collaboration (http://www.auger.org/), the largest team of scientists working about ultra-high energy cosmic rays; EUAirTransportation represents the air transportation network in Europe composed of thirty-seven different layers, where each one is corresponding to a different airline operating.
Table 4.
Runtime comparison of DC, BC, CC, LGR, INF and MINE on 32 real-world datasets.
| Network | DC | BC | CC | LGR | INF | MINE |
|---|---|---|---|---|---|---|
| Club | < | < | < | < | < | < |
| Dolphins | < | < | 0.0156 | 0.0156 | < | 0.0156 |
| 911 | < | 0.0156 | < | < | < | 0.0156 |
| Lesmis | < | 0.0156 | 0.0156 | < | < | 0.0156 |
| Voles | < | < | < | < | 0.0156 | 0.0156 |
| Escherichia | < | 0.0312 | 0.0156 | < | < | 0.0156 |
| Polbooks | < | 0.0469 | 0.0312 | < | 0.0156 | 0.0156 |
| Football | < | 0.0469 | 0.0469 | < | 0.0312 | 0.0312 |
| Enron | < | 0.0625 | 0.0469 | < | 0.0156 | 0.0312 |
| NEUSNCP | < | 0.0938 | 0.0625 | < | 0.0312 | 0.0156 |
| Jazz | < | 0.1719 | 0.2188 | < | 0.0781 | 0.3750 |
| USAir | < | 0.3594 | 0.4531 | 0.0156 | 0.0938 | 0.2188 |
| NS | < | 0.3438 | 0.3438 | 0.0156 | 0.0156 | 0.0625 |
| DMLC | < | 1.0312 | 0.9219 | < | 0.4219 | 0.7656 |
| Game of Thrones | < | 1.8750 | 1.5312 | 0.0156 | 0.2344 | 0.4219 |
| Power | < | 73.8594 | 48.2344 | 0.0156 | 0.1562 | 21.9531 |
| Padgett | < | < | < | < | < | < |
| HepatitusCVirus | < | 0.0312 | 0.0312 | < | 0.0156 | 0.0156 |
| Oryctolagus | < | 0.0156 | < | < | 0.0156 | 0.0156 |
| LondonTransport | < | 0.4219 | 0.2969 | < | < | 0.2031 |
| CKM | < | 0.4844 | 0.3281 | < | 0.0469 | 0.4219 |
| C.Elegans | < | 2.0000 | 1.9219 | 0.0156 | 0.1406 | 0.7500 |
| Plasmodium | < | 3.8281 | 2.7812 | < | 0.1562 | 1.5625 |
| HumanHerpes4 | < | 0.0938 | 0.0781 | < | 0.0469 | 0.0312 |
| BOS | < | 0.0469 | 0.0156 | < | 0.0156 | 0.1094 |
| DanioRerio | < | 0.0156 | 0.0156 | < | < | 0.0312 |
| Xenopus | < | 0.3750 | 0.2969 | < | 0.0156 | 0.4375 |
| Gallus | < | 0.1094 | 0.0938 | < | 0.0469 | 0.1094 |
| Rattus | 0.0156 | 24.4375 | 17.9062 | < | 1.5000 | 9.8750 |
| Candida | < | 0.2500 | 0.1719 | < | 0.0938 | 0.1250 |
| PierreAuger | < | 3.0312 | 3.3438 | 0.0156 | 0.1719 | 0.9375 |
| EUAirTransportation | < | 19.7656 | 18.7344 | 0.0312 | 0.7500 | 3.4062 |
Note: The maximum values of each row are in bold. < in the cell represents the runtime (recorded in seconds) is less than s. With the increasing of data size, the runtime of BC and CC are increasing dramatically, while the proposed MINE algorithm is acceptable.
Table 5.
Comparison of provinces of China, measured by DC, BC, CC, LGR, INF and MINE.
| Province | DC | BC | CC | LGR | INF | MINE |
|---|---|---|---|---|---|---|
| Inner Mongolia | 0.2424 | 0.1823 | 0.3793 | 366.0000 | 2.1845 | 11.2417 |
| Shaanxi | 0.2424 | 0.2438 | 0.4400 | 474.0000 | 1.5512 | 1.5512 |
| Hebei | 0.2121 | 0.1733 | 0.3626 | 269.5000 | 2.1250 | 2.1250 |
| Sichuan | 0.2121 | 0.1170 | 0.3708 | 322.0000 | 1.4417 | 7.8988 |
| Guangdong | 0.2121 | 0.2065 | 0.3474 | 231.0000 | 2.8333 | 4.2619 |
| Gansu | 0.1818 | 0.0914 | 0.3667 | 271.5000 | 1.3095 | 1.3095 |
| Henan | 0.1818 | 0.1291 | 0.4177 | 295.5000 | 1.1012 | 1.1012 |
| Hubei | 0.1818 | 0.1856 | 0.4459 | 324.0000 | 0.9917 | 0.9917 |
| Anhui | 0.1818 | 0.1112 | 0.3882 | 250.5000 | 1.2000 | 1.2000 |
| Jiangxi | 0.1818 | 0.1658 | 0.3976 | 270.0000 | 1.0929 | 1.0929 |
| Hunan | 0.1818 | 0.1204 | 0.3976 | 265.5000 | 1.1262 | 1.1262 |
| Chongqing | 0.1515 | 0.0611 | 0.4074 | 237.5000 | 0.8012 | 0.8012 |
| Guizhou | 0.1515 | 0.0326 | 0.3511 | 181.2500 | 1.0095 | 1.0095 |
| Zhejiang | 0.1515 | 0.0589 | 0.3267 | 147.5000 | 1.3333 | 10.5976 |
| Shanxi | 0.1212 | 0.0119 | 0.3626 | 165.0000 | 0.5595 | 0.5595 |
| Shandong | 0.1212 | 0.0665 | 0.3626 | 138.0000 | 0.7262 | 0.7262 |
| Qinghai | 0.1212 | 0.0059 | 0.3028 | 113.0000 | 0.8929 | 0.8929 |
| Jiangsu | 0.1212 | 0.0342 | 0.3173 | 97.0000 | 1.1167 | 1.1167 |
| Yunnan | 0.1212 | 0.0431 | 0.3300 | 119.0000 | 0.8429 | 0.8429 |
| Tibet | 0.1212 | 0.0195 | 0.3000 | 100.0000 | 0.9762 | 0.9762 |
| Fujian | 0.1212 | 0.0737 | 0.3204 | 109.0000 | 1.5095 | 1.5095 |
| Guangxi | 0.1212 | 0.0588 | 0.3333 | 125.0000 | 0.7595 | 0.7595 |
| Jilin | 0.0909 | 0.0009 | 0.2821 | 60.0000 | 0.9583 | 0.9583 |
| Liaoning | 0.0909 | 0.0073 | 0.3028 | 81.7500 | 0.6012 | 0.6012 |
| Ningxia | 0.0909 | 0.0000 | 0.3402 | 103.5000 | 0.4167 | 0.4167 |
| Xinjiang | 0.0909 | 0.0039 | 0.2920 | 64.5000 | 0.6667 | 0.6667 |
| Heilongjiang | 0.0606 | 0.0000 | 0.2797 | 37.5000 | 0.4583 | 0.4583 |
| Beijing | 0.0606 | 0.0000 | 0.2705 | 30.5000 | 0.6429 | 0.6429 |
| Tianjin | 0.0606 | 0.0000 | 0.2705 | 30.5000 | 0.6429 | 0.6429 |
| Shanghai | 0.0606 | 0.0000 | 0.2661 | 28.0000 | 0.4500 | 0.4500 |
| Hangkong | 0.0606 | 0.0000 | 0.2619 | 28.5000 | 0.6429 | 0.6429 |
| Macao | 0.0606 | 0.0000 | 0.2619 | 28.5000 | 0.6429 | 0.6429 |
| Taiwan | 0.0303 | 0.0000 | 0.2444 | 8.5000 | 0.2500 | 0.2500 |
| Hainan | 0.0303 | 0.0000 | 0.2598 | 13.0000 | 0.1429 | 0.1429 |
Note: The maximum values of each column are in bold, and the second maximum values of each column are underlined. By comparing the vital provinces measured by these centrality measures, we can infer that the proposed MINE algorithm is able to identify influential nodes dispersedly, which may benefit the influence maximization effect.
Table 6.
Comparison of the lower 48 United States, measured by DC, BC, CC, LGR, INF and MINE.
| State | DC | BC | CC | LGR | INF | MINE |
|---|---|---|---|---|---|---|
| Missouri | 0.1702 | 0.3703 | 0.3561 | 520.0000 | 1.4024 | 24.9286 |
| Kentucky | 0.1489 | 0.3437 | 0.3431 | 374.5000 | 1.3679 | 1.3679 |
| Tennessee | 0.1489 | 0.1862 | 0.3219 | 364.0000 | 1.3845 | 1.3845 |
| Idaho | 0.1277 | 0.0886 | 0.2271 | 198.0000 | 1.5667 | 7.0167 |
| Wyoming | 0.1277 | 0.1268 | 0.2717 | 273.0000 | 1.1167 | 1.1167 |
| Colorado | 0.1277 | 0.0658 | 0.2717 | 259.5000 | 1.2000 | 1.2000 |
| Nebraska | 0.1277 | 0.1606 | 0.3133 | 307.5000 | 1.0417 | 1.0417 |
| South Dakota | 0.1277 | 0.0590 | 0.2655 | 231.0000 | 1.3333 | 1.3333 |
| Oklahoma | 0.1277 | 0.1147 | 0.3032 | 271.5000 | 1.2083 | 1.2083 |
| Iowa | 0.1277 | 0.0820 | 0.3013 | 282.0000 | 1.1583 | 1.1583 |
| Arkansas | 0.1277 | 0.0733 | 0.2956 | 268.5000 | 1.2679 | 1.2679 |
| Pennsylvania | 0.1277 | 0.3018 | 0.2655 | 193.5000 | 1.5167 | 5.7690 |
| Nevada | 0.1064 | 0.0119 | 0.1992 | 137.5000 | 1.2000 | 1.2000 |
| Utah | 0.1064 | 0.0385 | 0.2327 | 183.7500 | 0.9500 | 0.9500 |
| Illinois | 0.1064 | 0.0451 | 0.3092 | 215.0000 | 0.9345 | 0.9345 |
| Ohio | 0.1064 | 0.1772 | 0.3032 | 178.7500 | 1.0929 | 1.0929 |
| West Virginia | 0.1064 | 0.1446 | 0.3013 | 182.5000 | 1.0095 | 1.0095 |
| Georgia | 0.1064 | 0.0380 | 0.2568 | 131.2500 | 1.6429 | 3.1857 |
| New York | 0.1064 | 0.2280 | 0.2238 | 127.5000 | 1.3667 | 1.3667 |
| Massachusetts | 0.1064 | 0.0634 | 0.1895 | 92.5000 | 1.7000 | 7.1000 |
| Oregon | 0.0851 | 0.0056 | 0.1918 | 83.0000 | 1.2000 | 1.2000 |
| Montana | 0.0851 | 0.0184 | 0.2293 | 122.0000 | 0.8333 | 0.8333 |
| Arizona | 0.0851 | 0.0481 | 0.2227 | 100.0000 | 0.9833 | 0.9833 |
| Kansas | 0.0851 | 0.0160 | 0.2956 | 160.0000 | 0.6250 | 0.6250 |
| New Mexico | 0.0851 | 0.0752 | 0.2582 | 126.0000 | 0.8333 | 0.8333 |
| Minnesota | 0.0851 | 0.0296 | 0.2655 | 108.0000 | 0.9167 | 0.9167 |
| Texas | 0.0851 | 0.0205 | 0.2527 | 109.0000 | 0.9167 | 0.9167 |
| Wisconsin | 0.0851 | 0.0475 | 0.2765 | 111.0000 | 0.9500 | 0.9500 |
| Mississippi | 0.0851 | 0.0148 | 0.2626 | 116.0000 | 0.8929 | 0.8929 |
| Indiana | 0.0851 | 0.0142 | 0.2883 | 120.0000 | 0.8762 | 0.8762 |
| Virginia | 0.0851 | 0.0581 | 0.2883 | 125.0000 | 0.8429 | 0.8429 |
| Alabama | 0.0851 | 0.0202 | 0.2527 | 102.0000 | 1.0929 | 1.0929 |
| North Carolina | 0.0851 | 0.0451 | 0.2733 | 112.0000 | 1.0929 | 1.0929 |
| Maryland | 0.0851 | 0.0334 | 0.2527 | 96.0000 | 0.9500 | 0.9500 |
| California | 0.0638 | 0.0031 | 0.1888 | 51.7500 | 0.7000 | 0.7000 |
| North Dakota | 0.0638 | 0.0046 | 0.2315 | 63.0000 | 0.6667 | 0.6667 |
| Louisiana | 0.0638 | 0.0032 | 0.2398 | 63.7500 | 0.6667 | 0.6667 |
| Michigan | 0.0638 | 0.0397 | 0.2626 | 63.7500 | 0.7000 | 0.7000 |
| Delaware | 0.0638 | 0.0017 | 0.2176 | 53.2500 | 0.7500 | 0.7500 |
| New Jersey | 0.0638 | 0.0032 | 0.2186 | 60.7500 | 0.7000 | 0.7000 |
| Vermont | 0.0638 | 0.0389 | 0.1880 | 50.2500 | 0.7333 | 0.7333 |
| Connecticut | 0.0638 | 0.0194 | 0.1873 | 47.2500 | 0.9000 | 0.9000 |
| New Hampshire | 0.0638 | 0.0426 | 0.1615 | 34.5000 | 1.5333 | 1.5333 |
| Washington | 0.0426 | 0.0000 | 0.1873 | 31.5000 | 0.4167 | 0.4167 |
| Florida | 0.0426 | 0.0000 | 0.2080 | 26.5000 | 0.4500 | 0.4500 |
| South Carolina | 0.0426 | 0.0000 | 0.2186 | 26.5000 | 0.4500 | 0.4500 |
| Rhode Island | 0.0426 | 0.0000 | 0.1604 | 21.5000 | 0.5333 | 0.5333 |
| Maine | 0.0213 | 0.0000 | 0.1395 | 5.0000 | 0.3333 | 0.3333 |
Note: The maximum values of each column are in bold, and second maximum values of each column are underlined. As identified by DC, BC, CC, LGR, Missouri seems to be the most vital states and Kentucky is next most important one. However, Kentucky is close to Missouri in geography, which limits the scope of influence expansion. By performing with INF measure, Massachusetts and Georgia are identified as the top-2 vital states, which are located in the east of the lower 48 United States and limited to the local areas. The proposed MINE algorithm identifies Missouri (44.9286), Massachusetts (7.1000) and Idaho (7.0167) as top-3 vital states, which are located dispersedly and are easy to exert strong influence.
© 2020 by the authors. Licensee MDPI, Basel, Switzerland. This article is an open access article distributed under the terms and conditions of the Creative Commons Attribution (CC BY) license (http://creativecommons.org/licenses/by/4.0/).
Share and Cite
MDPI and ACS Style
Huang, X.; Chen, D.; Wang, D.; Ren, T. MINE: Identifying Top-k Vital Nodes in Complex Networks via Maximum Influential Neighbors Expansion. Mathematics 2020, 8, 1449. https://0-doi-org.brum.beds.ac.uk/10.3390/math8091449
AMA Style
Huang X, Chen D, Wang D, Ren T. MINE: Identifying Top-k Vital Nodes in Complex Networks via Maximum Influential Neighbors Expansion. Mathematics. 2020; 8(9):1449. https://0-doi-org.brum.beds.ac.uk/10.3390/math8091449
Chicago/Turabian StyleHuang, Xinyu, Dongming Chen, Dongqi Wang, and Tao Ren. 2020. "MINE: Identifying Top-k Vital Nodes in Complex Networks via Maximum Influential Neighbors Expansion" Mathematics 8, no. 9: 1449. https://0-doi-org.brum.beds.ac.uk/10.3390/math8091449
Note that from the first issue of 2016, this journal uses article numbers instead of page numbers. See further details here.