Article

Using Higher-Order Constructs to Estimate Health-Disease Status: The Effect of Health System Performance and Sustainability

by
Alicia Ramírez-Orellana
*,
María del Carmen Valls Martínez
and
Mayra Soledad Grasso
Department of Economics and Business, University of Almería, 04120 Almeria, Spain
*
Author to whom correspondence should be addressed.
Submission received: 26 March 2021 / Revised: 20 May 2021 / Accepted: 25 May 2021 / Published: 27 May 2021

Abstract

:
This article aims to provide information to public agencies and policymakers on the determinants of health systems and their relationships that influence citizens’ health–disease status. A total of 61 indicators for each of 17 Spanish autonomous communities were collected from the Spanish Ministry of Health, Social Services, and Equality between 2008 and 2017. The applied technique was partial least squares structural equation modeling (PLS-SEM). Concerning health–disease status, an influence of sustainability and performance on the health system was hypothesized. The findings revealed that health system sustainability had a negative effect on health–disease status, measured in terms of disease incidence. However, the relationship between health system performance and health–disease status is positive. Furthermore, health system performance mediates the relationship between sustainability and health–disease status. According to our study, if we consider the opposite poles that make up the definition of health–disease status (well-being and disease), this concept is defined more by the incidence of the negative aspect.

1. Introduction

All countries seek to grow economically. Undoubtedly, this is reflected in improvements in the standard of the population’s living. For its part, the population’s health plays a fundamental role in its economic prosperity [1]. Health has a direct impact on the economy and economic growth [2]. Both the prevention of diseases and their treatment are necessary to reduce disease burden [3]. These activities will be directed by a health system for which the government is responsible [4]. The government will need tools to continuously evaluate and monitor the health system if its objective is for it to work properly [4,5]. Inadequate or inefficient health expenditure could slow down the economic growth of the entire country [1]. Having quality information when making decisions about health policies improves health, well-being, and patient satisfaction [5]. At the organizational level, one of the inputs for improving the health care system’s efficiency, effectiveness, and equity is the health information systems. The use of health information systems leads to the achievement of administrative efficiency, maximizing the value of resources as an outcome [6]. Managing all the data that health workers routinely record enables gathering information on vital statistics, public health programs, reportable diseases, and mortality. The purpose of the health information system is to promote the development of an information culture where those responsible for health use information operatively for optimal planning and decision making to provide health services based on knowledge [7].
According to the World Health Organization (WHO), “Health is a state of complete physical, mental and social well-being, and not only the absence of diseases or illnesses” [8]. The measurement of health–disease status can be performed from the perspective of diagnostic morbidity (based on empirical data on diseases in the population) or from the perceived morbidity’s perspective (based on self-perception of health–disease status [9]). Self-perception of the state of health is not the same in both sexes.
All health systems aim to improve citizens’ health [10,11,12,13,14,15], respond to patient expectations, and equitably distribute the financial burden [12,16,17]. It is essential to know the needs in each region of the country and allocate resources accordingly in order to improve health–disease status [9]. For its part, responsiveness is a crucial element in patient satisfaction [15] and includes several concepts, such as confidentiality, autonomy, prompt attention, and access to social support networks, among others [6,16]. Finally, when discussing an equitable distribution of the financial burden, we refer to the fact that each household should pay the health system somewhat based, to a certain degree, on their income [4,18]. We can also refer to equity in terms of provision of the service, which aims to benefit each user based on their particular needs [6,19].
A quality health system will provide an excellent service when and where patients require it [20]. If the system malfunctions (poorly managed, poorly structured, ineffective, or poorly structured financially), it will not deliver its full potential, its costs will rise, and health outcomes will worsen [6]. In other words, it will not be able to fulfill its ultimate goal. For this reason, it is vitally important to manage these systems and evaluate their performance [21]. Periodically carrying out an efficiency analysis is a productive tool to investigate the potential for improvement in a hospital’s resource use [22,23]. Nevertheless, the contemporary approach to measuring performance includes a cost analysis of services, quality, and patient satisfaction [24].
For its part, the measurement and evaluation of patient satisfaction are considered key points to work on if what is intended is the continuous improvement of the health system and its consequent excellence [20,21]. Patients’ opinions are among of the main elements with which satisfaction is measured [22]. This feedback will serve as the basis for analyzing the health system and working towards its improvement [23,25,26]. Maintaining an excellent healthcare system has never been cheap. Furthermore, updating based on continuous technological advances nowadays requires even more effort than ensuring the system works efficiently. Managing quality will improve the quality of the services provided and reduce costs [10,26].
Today, companies worldwide are concerned with reporting on their sustainability. Through sustainability reports, corporations explain their planning in its economic, environmental, and social aspects [27]. When we speak of health system sustainability, we refer to the management of resources and expenses that are carried out, and the degree to which the health system’s use is capable of meeting current needs without compromising the satisfaction of future needs [13,28]. It will be necessary to maintain the best possible cost-effectiveness ratio to meet this criterion. In other words, resources should be allocated to those interventions that provide the maximum improvement in health per monetary unit [3,22]. Additionally, for the organization to be sustainable over time, quality of service must exist [29]. The difficulty in measuring quality, in these terms, is that we have to look to the future and design a service that meets the needs of tomorrow [29].
On many occasions, health indicators are used to strategically direct resources and expenses [5]. When these indicators are comparable between countries, relevant and significant data can be extracted to improve them and identify good and bad practices [30]. Public health indicators contribute to transparency and good governance [31]. For example, in Europe, the ECHI (European Community Heath Indicator) is used, which functions as a hub of information and notifications on health at the European level [5].
The WHO established that governments have to guarantee the availability of health services to their citizens [6] in order to improve health status, meet patient expectations, and comply with the financial equity criteria [12]. One of the factors that most influence patient satisfaction is the health system’s ability to comply with clinical requirements. The latter depend on the facilities’ ability, for example, to provide laboratory reports on time, and to maintain the availability of required blood groups [26].
As we have already indicated, improving health is the main objective of the entire health system, but this should not be limited to physical diseases or symptoms. It is crucial that we extend ourselves to evaluating and treating depressive symptoms [31]. Moreover, those responsible should not be limited solely to the clinical aspects. For example, good management and administration of the health system will also improve society’s health [32].
Previous research has studied the performance and sustainability of the health system. However, it is not common to find studies on its effect on the population’s health as a complete health system, designed in the form of a nomological network and integrated by different explanatory subsystems of the health–disease status of citizens. Some studies use individual variables as isolated pieces with influence on a single non-latent dependent variable [33]. In this vein, we have not found investigations that use higher-order complex latent variables defined by several dimensions. Our study contributes to defining the boundaries of the health system, and highlighting the importance of the sustainability and performance subsystems as drivers of the levels of well-being, morbidity, and mortality of the population, that is, of the health–disease status. Moreover, we provide those responsible for managing the health system with information on the efficient and effective use of resources that does not compromise future needs and affect the population’s health–disease status. In addition, our model offers policymakers information on the determining variables of the health system and the correlations between them to serve as an instrument for effective decision making. The rest of the article is structured as follows: First, we carry out the literature review and pose the hypotheses. Secondly, we describe the research methodology, and, after, the results are gathered and presented. Finally, we discuss the principal findings of the research and the conclusions.

Literature Background and Hypotheses

The economic development of a country depends on many factors, and one of them is the health of its inhabitants. A healthy population will always be more productive. To achieve this, it will be essential that the country has an effective and efficient health system [30,34]. Thus, countries should develop programs and policies to protect and improve the population’s health [35] and reduce inequalities in health access [5]. In this sense, studying the quality-to-price ratio is increasingly crucial [18]. In Europe, health systems face increasing costs, as the population is aging and, therefore, making greater use of them [14,30]. The elderly are using the health care system more frequently, and the medical treatments they use are more expensive [36]. Innovations in health are imminent to ensure a healthy life [14,37]. Nevertheless, this is also costly and complex due to the system’s dynamism [14].
The ultimate goal should be to promote and improve the population’s quality of life [14], minimizing the risk of mortality [14,38]. Then, the health system’s improvement will increase the population’s quality of life and, therefore, reduce the mortality rate [39,40]. Mortality and morbidity ratios are used to measure the health–disease status of the population [12]. Both are associated with physical and psychological states [38,41]. The mortality rate is lower in women, which generates a higher incidence of morbidity [3,36]. A study on Spanish citizens’ health status determined that neither in-hospital mortality nor morbidity are significant factors in establishing perceived health status [9]. The life expectancy of women is higher than that of men [3,42]. The difference in life expectancy between men and women can be influenced by male sex exposure to risk factors or occupational risk, or other risky behaviors [3]. Otherwise, people who suffer from a chronic illness have a negative self-perception of their health [43]. Furthermore, it is the female sex who is prone to chronic diseases [42]. Women tend to self-perceive worse than men [9].
The expected result of good health system management is the long-term well-being of the patient. However, these results depend not only on the provision of a good-quality health service, but also the characteristics of the patient [44]. For example, maternity in adolescence increases morbidity and mortality in women and their children, since they are usually born with medical complications [45].
It is expected that the government will take the necessary measures to offer the population quality and sustainable health services. How health services are provided will affect the health status of the population [30,46]. On the one hand, quality can be measured according to different pillars, such as safety, patient satisfaction, effectiveness, and pertinence. On the other hand, sustainability can be studied according to the health system’s level of use, allocations of resources, and volume of expenses.
A safe health system manages risks to minimize incidents [34,47], for example, evaluating the effectiveness of new medical treatments and medicines [33]. These factors can be measured by the number of hospital infections and the rate of adverse drug reactions. One of the dimensions of healthcare quality is safety [37,48,49], which is related to efficiency, since fewer interventions are less expensive. The literature indicates that safe care can be provided with minimal waste of resources [34]. Regarding this issue, the WHO emphasizes the need to understand healthcare complexity to ensure patients’ safety [13]. The characteristics of the patient directly influence safety. The higher the complications, the lower the security. The factors that influence risk exposure are age, disease burden, and gender [34].
A patient satisfied with the medical attention received will pay more attention to the treatments and recommendations that the health personnel indicate, and consequently, they will have better health results [50,51]. On the contrary, a dissatisfied patient will not adhere to the recommendations of health professionals. Hence, resources will be wasted, medical care productivity will decrease, and morbidity and mortality rates will increase [52]. From another perspective, we could say that the patient’s satisfaction affects their life expectancy, and this relationship is strong [10]. Today, people are more demanding about the services they receive. To achieve their satisfaction, it will be necessary for healthcare to be “patient-oriented”, that is, depending on the individual needs of each patient [51,53]. Additionally, previous studies indicate that when patients are allowed to participate in medical treatment decisions, they are more satisfied [20,54,55]. Other factors that influence a patient’s satisfaction are confidence in the health system’s professionals [23,26,29,55,56], the physician’s behavior [26,29,32,55,56], and the degree of patient follow-up [29,57]. In their study, Ricci-Cabello et al. found that those patients who had a pleasant experience in medical care reported better self-perceived health [51].
The health system’s ineffectiveness can be measured by the readmission rate to hospitals, which causes higher costs for the system and more anguish to the patient [58]. Repeated hospitalization could signal a failure in the quality of the health system [48]. There must be a balance between a hasty medical discharge and a prolonged hospital stay due to not yet solving the patient’s problem. This could increase the probability of contracting other diseases as a result of staying in the hospital, such as nosocomial diseases, infections, and pressure ulcers [59]. Low self-perceived health states are associated with a higher risk of readmission [58]. Moreover, when patients are depressed during hospitalization, the risk of being readmitted increases [38]. Previous research found that hospitals with a longer average length of stay are less efficient [18,48].
Pertinence could be associated with equity in the provision of services. Equity in providing services means that each patient is cared for according to their needs at the right time [6]. When the health system can provide adequate care at the right time, this prevents an increase in the severity of diseases and saves possible future expenses [34].
Some previous studies indicate that higher-income countries show better efficiency rates, while others reach ambiguous conclusions [30]. Higher per capita health spending is directly reflected in the efficiency of health systems [18]. Healthcare effectiveness can be defined as the health system’s ability to achieve maximum expected results without increasing unexpected results [30].
Previously, the term “sustainability” referred only to environmental factors. Today, it is studied with a multidimensional approach. In the area of health, the health system will be sustainable when it takes care of the well-being of patients, health professionals, and the entire community, preserving resources [28]. In other words, we must provide the best possible health service to improve the patient’s health status, with the lowest waste of resources possible [13,34]. Budget cuts in health matters are increasingly frequent [14,55,56], so it is increasingly important to focus on sustainability, that is, to offer services of excellence while being efficient in the use of resources and the application of expenses [30,35,60].
A sustainable health system must focus on prevention [35]. In the European Union, the leading cause of death is cardiovascular diseases whose risk factors (smoking, high body mass index, lack of physical activity, and blood pressure) are highly preventable [61]. When people do not take preventive measures (low cost/high value), they will only rely on emergency services (high price/less effective results) [46]. Previous research found that countries with higher healthcare expenditure per capita have more efficient hospitals [18]. On the other hand, others indicate that efficiency is not defined by the volume of resources assigned to health [2,14].
This research’s principal objective is to examine the influence of the health system performance and health system sustainability on health–disease status. After a careful review of the literature, we formulated the following hypotheses:
Hypothesis 1 (H1).
Health system sustainability influences health–disease status.
Hypothesis 2 (H2).
Health system performance influences health–disease status.
Hypothesis 3 (H3).
Health system sustainability influences health system performance.
Hypothesis 4 (H4).
Health system performance mediates the relationship between health system sustainability and health–disease status.
The theoretical model that we propose in Figure 1 relates the following three latent variables or constructs:
  • Health system sustainability
  • Health system performance
  • Health–disease status

2. Research Methodology

In this section, we present the results of applying the algorithm of partial structural equations of higher-order constructs as an efficient solution for evaluating the health–disease status model in Spain.

2.1. PLS-SEM Analysis

PLS-SEM analysis come from two statistical traditions: linear regression and factor analysis. PLS-SEM models use theoretical concepts in the form of constructs or latent variables, such as unobserved variables, which are measured through indicators, data, or manifest variables [62]. Wold [63] was the author and developer of the PLS-SEM algorithm whose objective is to minimize the residual variances of the endogenous variable to be explained [64]. The basic PLS algorithm applies a two-stage method. In the first stage, the constructs’ scores are iteratively estimated through a four-step procedure. The second stage computes the final estimates of coefficients (outer weights, loadings, and path coefficients) using the ordinary least squares method for each partial regression model [65].
The evaluation of a traditional PLS-SEM model requires firstly specifying the measurement model and secondly evaluating the structural model where the hypotheses are tested. In our case, there were two types of measurement relationships between indicators/items and constructs: reflective and formative [66]. Depending on the direction of the causal relationship between the latent variable and its indicators, a series of different criteria were verified according to the reflective or formative model (for more details, see [67,68,69]). Thus, in the case of reflective models, the causal relationship goes from the latent variable to the indicators, and in formative models the opposite. Reflective or A-mode models were assessed using four criteria: individual item reliability, construct reliability, convergent validity, and discriminant validity; formative or B-mode models were evaluated using the criteria of multicollinearity between items. With the specification of the measurement scale, it was possible to verify that the relationships among indicators and their constructs were valid and reliable, regardless of the measurement mode used. Once it was determined that the measure was valid and reliable, the structural analysis of the model was carried out. PLS-SEM used various criteria for structural validation, such as coefficients of determination (R2), size of effects (f2), and predictive validity (Q2). The analysis of composites in PLS-SEM allows the calculation of latent variable scores as an exact linear combination of the indicators, which can be used to aggregate higher-order constructs [64,70]. Apart from being able to estimate mediation and moderation effects with multiple latent variables, PLS-SEM analysis allows analyzing of models with lower-order constructs (LOC) and higher-order constructs (HOC).
When using PLS composites, we consider the LOC as a mediator or aggregator between the indicators or dimensions, that is, the latent variable scores of the LOCs that constitute the HOC [71,72]. Therefore, we can build more parsimonious models [73] by grouping the relationships of sets of variables that make joint theoretical sense [74] and can be interpreted as a unit without losing the effect of each one of them separately. This is especially relevant as the number of variables increases, and the correlation between them and/or the sample size decreases. In such circumstances, multiple regression models without SEM can be strongly affected by net suppression conditions between variables with a high correlation between them [75]. In our particular case, the constructs that we wanted to examine were fairly complex and different from those first-order components in which constructs located on the same plane or level are considered. In this sense, constructs can be designed according to higher-order components (HOC). This type of model frequently requires higher-order structures to be examined, including various levels of components [68,76]. For example, the health system’s quality represented by the health system performance construct in our model can be specified based on multiple abstraction grades. Mainly, quality can be constituted by various first-order components that separately identify numerous quality features. These may include safety and patient satisfaction through patient opinions, effectiveness, or relevance in the healthcare context. These first-order components or lower order components (LOC) make up the second-order component or higher-order components (HOC) of the quality of the system (health system performance), which presents a greater degree of abstraction.
Rather than modeling quality attributes as drivers of overall respondent quality in a unique level latent variable (see Figure 2), the higher-order model entails combining the lower order constructs into a single multidimensional construct. This modeling procedure is conducive to greater theoretical parsimoniousness and decreases the model’s complexity, as shown in Figure 3.
Researchers can choose between different approaches to identify the higher-order construct, with alternative approaches to repeated and two-step indicators being the most commonly used in the literature [77]. This work chose the two-step disjoint approach because it shows a better recovery of path parameters [78]. The disjointed approach was initially only based on evaluating the lower-order components’ measurement model. These were directly related to all other constructs with which the higher-order construct is theoretically related (see Figure 2). That is, in this first step, we verified compliance with the criteria related to the measurement model of the PLS-SEM algorithm for the lower-order constructs. Thus, in the case of constructs in mode A, the criteria tested were individual item reliability, construct reliability, convergent validity, and discriminant validity; while for B-mode constructs, multicollinearity was verified [67]. During these checks, those eliminations of items that did not meet the criteria were made, subsequently providing the scores of the lower-order constructs. The scores’ construct values were then saved, but only those of the lower-order constructs—in our case, the scores of the LOC effectiveness, safety, opinions, and pertinence to build the HOC health system’s performance; resources, utilization, and expenses to form the HOC health system’s sustainability; and the LOC well-being, mortality, and morbidity for the HOC health–disease status. In stage two, these scores are used as indicators to measure the corresponding higher-order construct. Therefore, we apply the PLS-SEM algorithm again in this second step, but exclusively for higher-order constructs with their lower-order dimensions as indicators. In this second step, the PLS-SEM algorithm was fully developed to evaluate both the measurement model and the structural model [78]. The criteria applied to verify the structural model were the inner model variance inflation factor, path coefficients, coefficient of determination, effect sizes, and predictive relevance.
According to Law et al. [79], a construct is higher-order or multidimensional when it refers to a set of different but related dimensions that must be treated as a single theoretical concept. This construct should not be confused with the one-dimensional construct or those multiple variables that manifest a relationship with each other but correspond to more than one theoretical concept. Consequently, a multidimensional construct is conceptualized based on its dimensions and, therefore, does not exist separately. Higher-order constructs constitute a holistic representation of a very complex reality, and their modeling increases the variance explained by the proposed model [80]. In addition, they reduce the number of relationships of the path model, as we can see in Figure 3, achieving greater model parsimony.

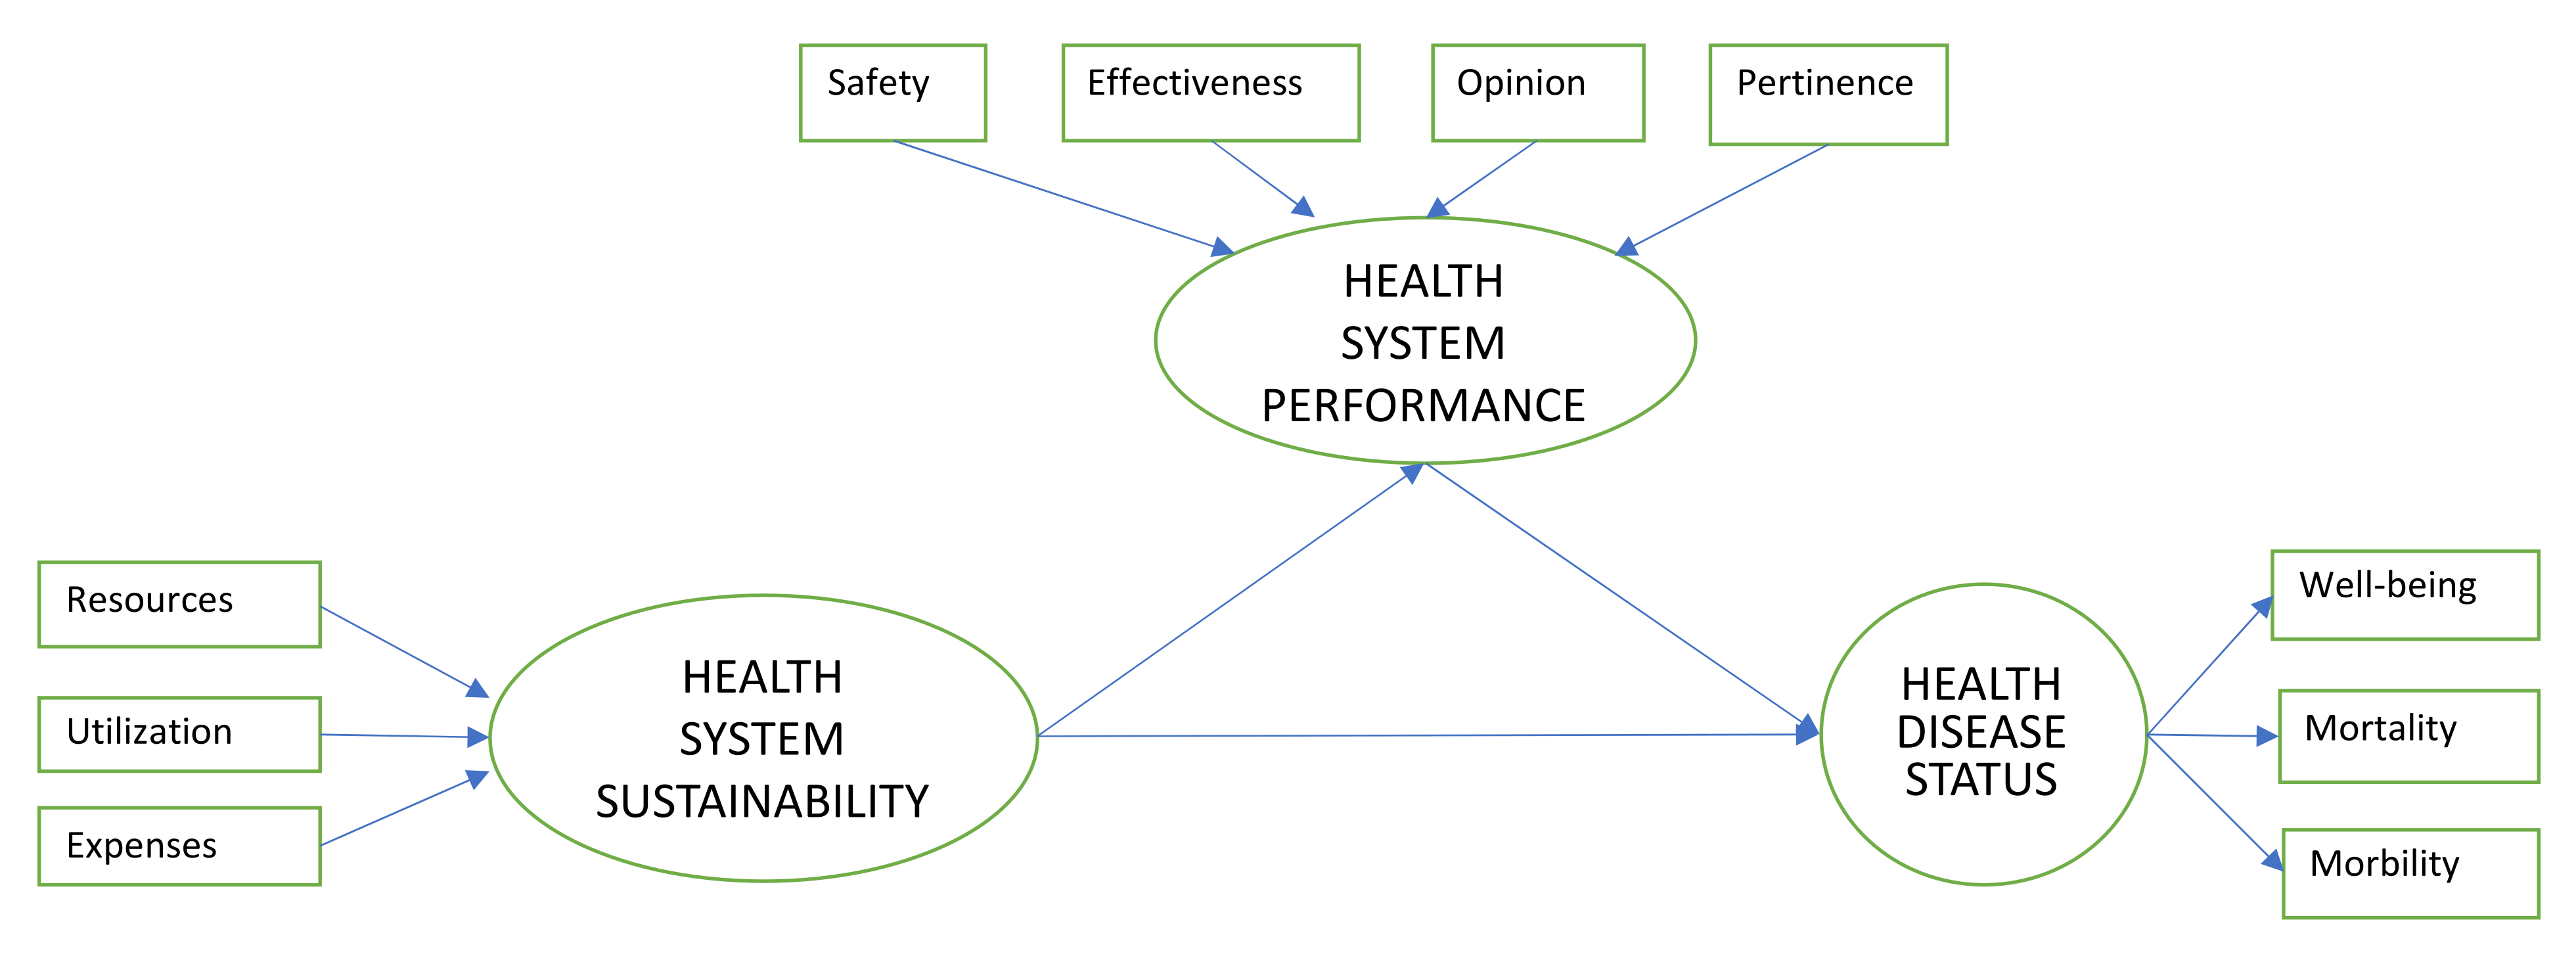
2.2. Specification of PLS-SEM Model

The specification of the higher-order model on Spanish health–disease status required defining the set of HOC constructs and the set of indicators related to the lower-order constructs. In this vein, the dimensions included in the health system performance’s higher-order construct were the following:
Effectiveness (LOC): Effectiveness in health care refers to the degree to which an intervention—service, process, procedure, diagnostic test, or treatment—produces the desired result. It includes the following indicators: “birth of children from less-than-20-year-old women for every 100 births”, “incidence of tetanus per 100,000 inhabitants”, “incidence of hepatitis B per 100,000 inhabitants”, and “incidence of mumps per 100,000 inhabitants”.
Safety (LOC): This dimension refers to how the health system provides safe care and care to the patient. This involves minimizing the unnecessary risk of harm to the patient, which manifests itself in the absence of accidental injuries attributable to the provision of care or medical errors. Healthcare that promotes patient safety in the provision of care involves risk management; recording, analysis, and monitoring of incidents; and implementing solutions to minimize recurrence risk. This includes the following indicators: “reporting rate of suspected serious adverse reactions to medicines”, “intrahospital mortality post-infarction per 100 highs from a heart attack”, and “lower member amputation rate in diabetic people”. In fact, incident reporting and monitoring are measured with these three indicators.
Opinion or Patient Satisfaction (LOC): One of the critical components of quality is the system’s responsiveness to patient preferences, attitudes, and expectations. Patient-centered care is defined as one that establishes a good interrelationship between professionals and patients to ensure that decisions made regarding patients’ care process take into account their needs, desires, and preferences, ensuring that these patients have the necessary training and support for effective participation. In a health system whose social legitimacy rests on reliability, satisfaction, and trust, this is understood as a significant quality component to generate a positive experience for patients and the population in contact with services. This includes indicators such as “degree of satisfaction of citizens with the functioning of the public health system”.
Pertinence (LOC): The degree to which users receive the care they need, with the best use of resources according to available scientific evidence and side effects, is less than the potential benefits. This includes the following indicators: “laparoscopic cholecystectomy”, “conservative breast cancer surgery”, and “hip fracture patients with surgery in the first 48 h”.
On the other hand, the dimensions included in the health system sustainability’s higher-order construct were the following:
Expenses (LOC): Disbursement of goods and services intended to preserve, maintain, recover, or improve the population’s health level. This includes indicators such as “percentage of health expenditure on primary care”, “percentage of pharmacy expenditure”, and “percentage of expenditure in specialized care”, among others.
Utilization (LOC): Citizens take advantage of health services. This includes, among others, indicators such as “frequentation in specialized care inquiries (% SNS)” or “rates of surgical interventions (% SNS)”.
Resources (LOC): High-quality healthcare requires the availability of sufficient resources to meet individual and population needs. The system’s capacity refers to economic resources, infrastructure, equipment, human resources, medical devices, medicines, and health service technologies, including information and communication technologies. This includes, among others, indicators such as “medical staff in specialized care per 1000 inhabitants (% SNS)”, “nursing staff in specialized care per 1000 inhabitants (% SNS)”, “hospital beds in operation (% SNS)”, and “posts in day hospitals per 1000 inhabitants (% SNS)”.
Finally, the dimensions included in the health–disease status higher-order construct (HOC) were the following:
Well-being (LOC): Health well-being is measured through life expectancy, which is the average number of years a given absolute or total population lives in a certain period. This includes, among others, indicators such as “life expectancy at birth” and “life expectancy at 65 years”.
Mortality (LOC): This is the proportion of people who die from the total population over a period of time, usually expressed as the proportion per one hundred thousand per year. This includes, among others, indicators such as “age-adjusted mortality rate from ischemic heart disease per 100,000 inhabitants”, “age-adjusted mortality rate from cerebrovascular disease per 100,000 inhabitants”, and “age-adjusted mortality rate from cancer per 100,000 inhabitants”.
Morbidity (LOC): Morbidity is a sick state, disability, or poor health due to any cause. The term can refer to any form of disease or to the extent that a health condition affects the patient. This includes, among others, indicators such as “incidence of tuberculosis per 100,000 inhabitants”, “incidence of new HIV diagnoses”, and “adjusted hospitalization rate for acute myocardial infarction per 10,000 inhabitants (SNS).”
Likewise, the definitions of the individual indicators with their corresponding lower-order constructs and their modes of measurement are shown in Table 1 below.

2.3. Data and Sample

In the sample configuration, data from key indicators of Spain’s national health system from 2008 to 2017 were used. The model was tested with a secondary dataset and used repeated cross-sectional data [81]. The Spanish Ministry of Health, Social Services, and Equality (MHSE) has a statistical portal with information about each autonomous community’s average national health system key indicators. Of the total of 19 autonomous communities existing in Spain, the lack of data from two of them (Ceuta and Melilla) led to them being excluded, leaving the sample composed of 17 autonomous communities. Faul, Erdfelder, Buchner, and Lang [82] explain the minimum sample size required when we set an effect size f2 of 0.15 and a significance level of 0.05, using the statistical program G * Power. Our results show a minimum size of 103 observations for a statistical power of 0.8. Therefore, the minimum sample size required of 103 observations is less than the 165 used.
The selection of sets of indicators is a procedure used by different supra- and international organizations that are beginning to use said sets of indicators or are in the process of preparing them. Among them, the European Commission works to obtain comparable information on health, the habits of the population related to health and diseases, and health systems. The objective of the commission is to have an integrated system of indicators, common at the European level, whose work scheme is based on the ECHI (European Community Health Indicators) project. At the Spanish level, the country has significantly developed its health information systems in order to obtain executive and multidimensional information. In Spain, this is known under the generic name of “key indicators of the SNS”, which also serve as the basis for submitting the information to the ECHI project of the European Commission. The conceptual model of the European Core Health Indicators (ECHI) was adapted to the Spanish national health system’s characteristics, which determined the relationships between the constructs. In this sense, Table 1 presents a summary of all the variables and indicators included in the model, their acronyms, and the data sources used.
The series of indicators used are grouped around their meaning, and some indicators are both secondary and primary care and/or exclusive to one of the two types, depending on the case. For example, the indicator “EX2—Percentage of health expenditure in pharmacy” includes the pharmaceutical expenses of both hospitals and primary health centers. However, for example, the indicator “EX1—Percentage of health expenditure in primary care” is exclusive to primary care centers, while the indicator “U2—Hospitalizations (% NHS)” is exclusive to secondary care centers, that is, hospitals. This means that the key indicators of the SNS used in this work include both information from secondary care data and information from primary care data.
Concerning the higher-order construct (see Table 2) health–disease status, 24 items were used grouped into three theoretical dimensions: mortality, morbidity, and well-being [12]. To measure quality or health system performance (HS performance), we follow Cinaroglu and Baser’s [10] recommendations. A scale of 13 items initially grouped into four dimensions was used: effectiveness, opinion, safety, and pertinence. Finally, health system sustainability (HS sustainability) was measured with the scale proposed by Valls Martínez and Ramírez-Orellana [47], consisting of 24 items grouped into three dimensions: utilization, resources, and expenses. The second-order HS performance and health–disease status constructs were mixed type [76], and according to the results of confirmatory tetrad analysis, we considered the formative-formative type for HS sustainability.

3. Assessing PLS-SEM Results

This section presents the results of applying the disjoint two-step method to our higher-order component model. Initially, at the first step, the PLS algorithm was performed to evaluate the lower-order composites’ measurement model. The second step evaluated both the measurement model and the structural model of the higher-order composites. The evaluation of the measurement model allowed us to check the validity and reliability of the proposed scales, before proceeding to evaluate the structural model (see Figure 3).

3.1. Evaluation of LOC Measurement Model

The lower-order composites measurement model was evaluated concerning the four criteria identified to meet the models’ reliability and validity: individual item reliability, construct reliability, convergent validity, and discriminant validity.

3.1.1. Reflective Measurement Model

  • Individual item reliability LOC
According to the latent variables’ specifications (see Table 1), only the opinion and well-being constructs were measured in mode A. Therefore, we refined those items with load values lower than the reference value of 0.707 [83]. According to this criterion, the second item of the opinion composite (level of satisfaction of citizens with their historical knowledge and monitoring of their health status by the family doctor and pediatrician) was eliminated due to not exceeding the reference threshold.
  • Construct Reliability LOC
The Cronbach alpha coefficient (α), the Dijkstra–Henseler (ρA) index, and the composite reliability statistics were calculated to check the construct reliability criterion [78]:
C r o n b a c h s   α = N c ¯ 1 + ( N 1 ) c ¯ ρ A : = ( w ^ w ^ ) 2 w ^ S d i a g ( S ) w ^ w ^ w ^ w ^ d i a g ( w ^ w ^ ) w ^ ρ C = i = 1 N l i 2 i = 1 N l i 2 + i = 1 N var ( e i ) ,
where N is the number of lower-order components ( i = 1 , 2 , , N ); c ¯ is the average correlation between the lower-order components; w ^ ′ is the higher-order constructs‘ estimated weight vector, and the number of lower-order constructs is the dimension of w ^ ; S is the empirical covariance matrix of the lower-order components; l i is the loading of the lower-order component i in a particular higher-order construct; and var ( e i ) is the measurement error’s variance of the lower-order component i.
All three indicators share the same benchmark threshold of 0.7 [84,85], and this was met for the sample data (see Table 3).
  • Convergent validity LOC
The convergent validity of the model’s constructs was verified by analyzing the average variance extracted (AVE) [78]:
AVE = 1 N i = 1 N l i 2 .
The AVE values in this study were 0.793 for opinion and 0.672 for well-being. These results are adequate as the values should be above 0.5, according to Hair et al. [67].
  • Discriminant validity LOC
To close the LOC measurement analysis in mode A, the discriminant validity was verified through the HTMT ratio of the higher-order constructs Yi and Yj developed by Henseler, Ringle, and Sarstedt [86]:
HTMT = 1 K i K j g = 1 K i h = 1 K j r i g , j h 2 K i ( K i 1 ) g = 1 K i 1 h = g + 1 K i r i g , j h 2 K j ( K j 1 ) g = 1 K j 1 h = g + 1 K j r j g , j h
where Ki (respectively Kj) is the number of lower-order constructs considered as indicators of the higher-order construct Yi (respectively Yj); and r i g , j h is the correlations of the lower-order constructs within and across the higher-order constructs Yi and Yj. Observe that the numerator represents the average heterotrait–heteromethod correlation, and the denominator is the geometric mean of the average monotrait–heteromethod correlation of construct Yi and the average monotrait–heteromethod correlation of construct Yj.
The ratio should not exceed the threshold value of 0.85 or 0.90 [87]. In this study, the HTMT ratio had a value of 0.409, thus reaching discriminant validity.
The Fornell and Larcker [88] criterion was also used to measure discriminatory validity. This criterion explains that the amount of variance that a construct captures from its indicators (AVE) should be greater than the variance that such as construct shares with other constructs in the model (the squared correlation between the two constructs). To facilitate this assessment, the root square of the AVE of each latent variable should be greater than the correlations it has with the other latent variables in the model.
The values indicating that there is an adequate discriminatory validity according to the Fornell and Larcker criterion are shown in bold on the diagonal (see Table 4).

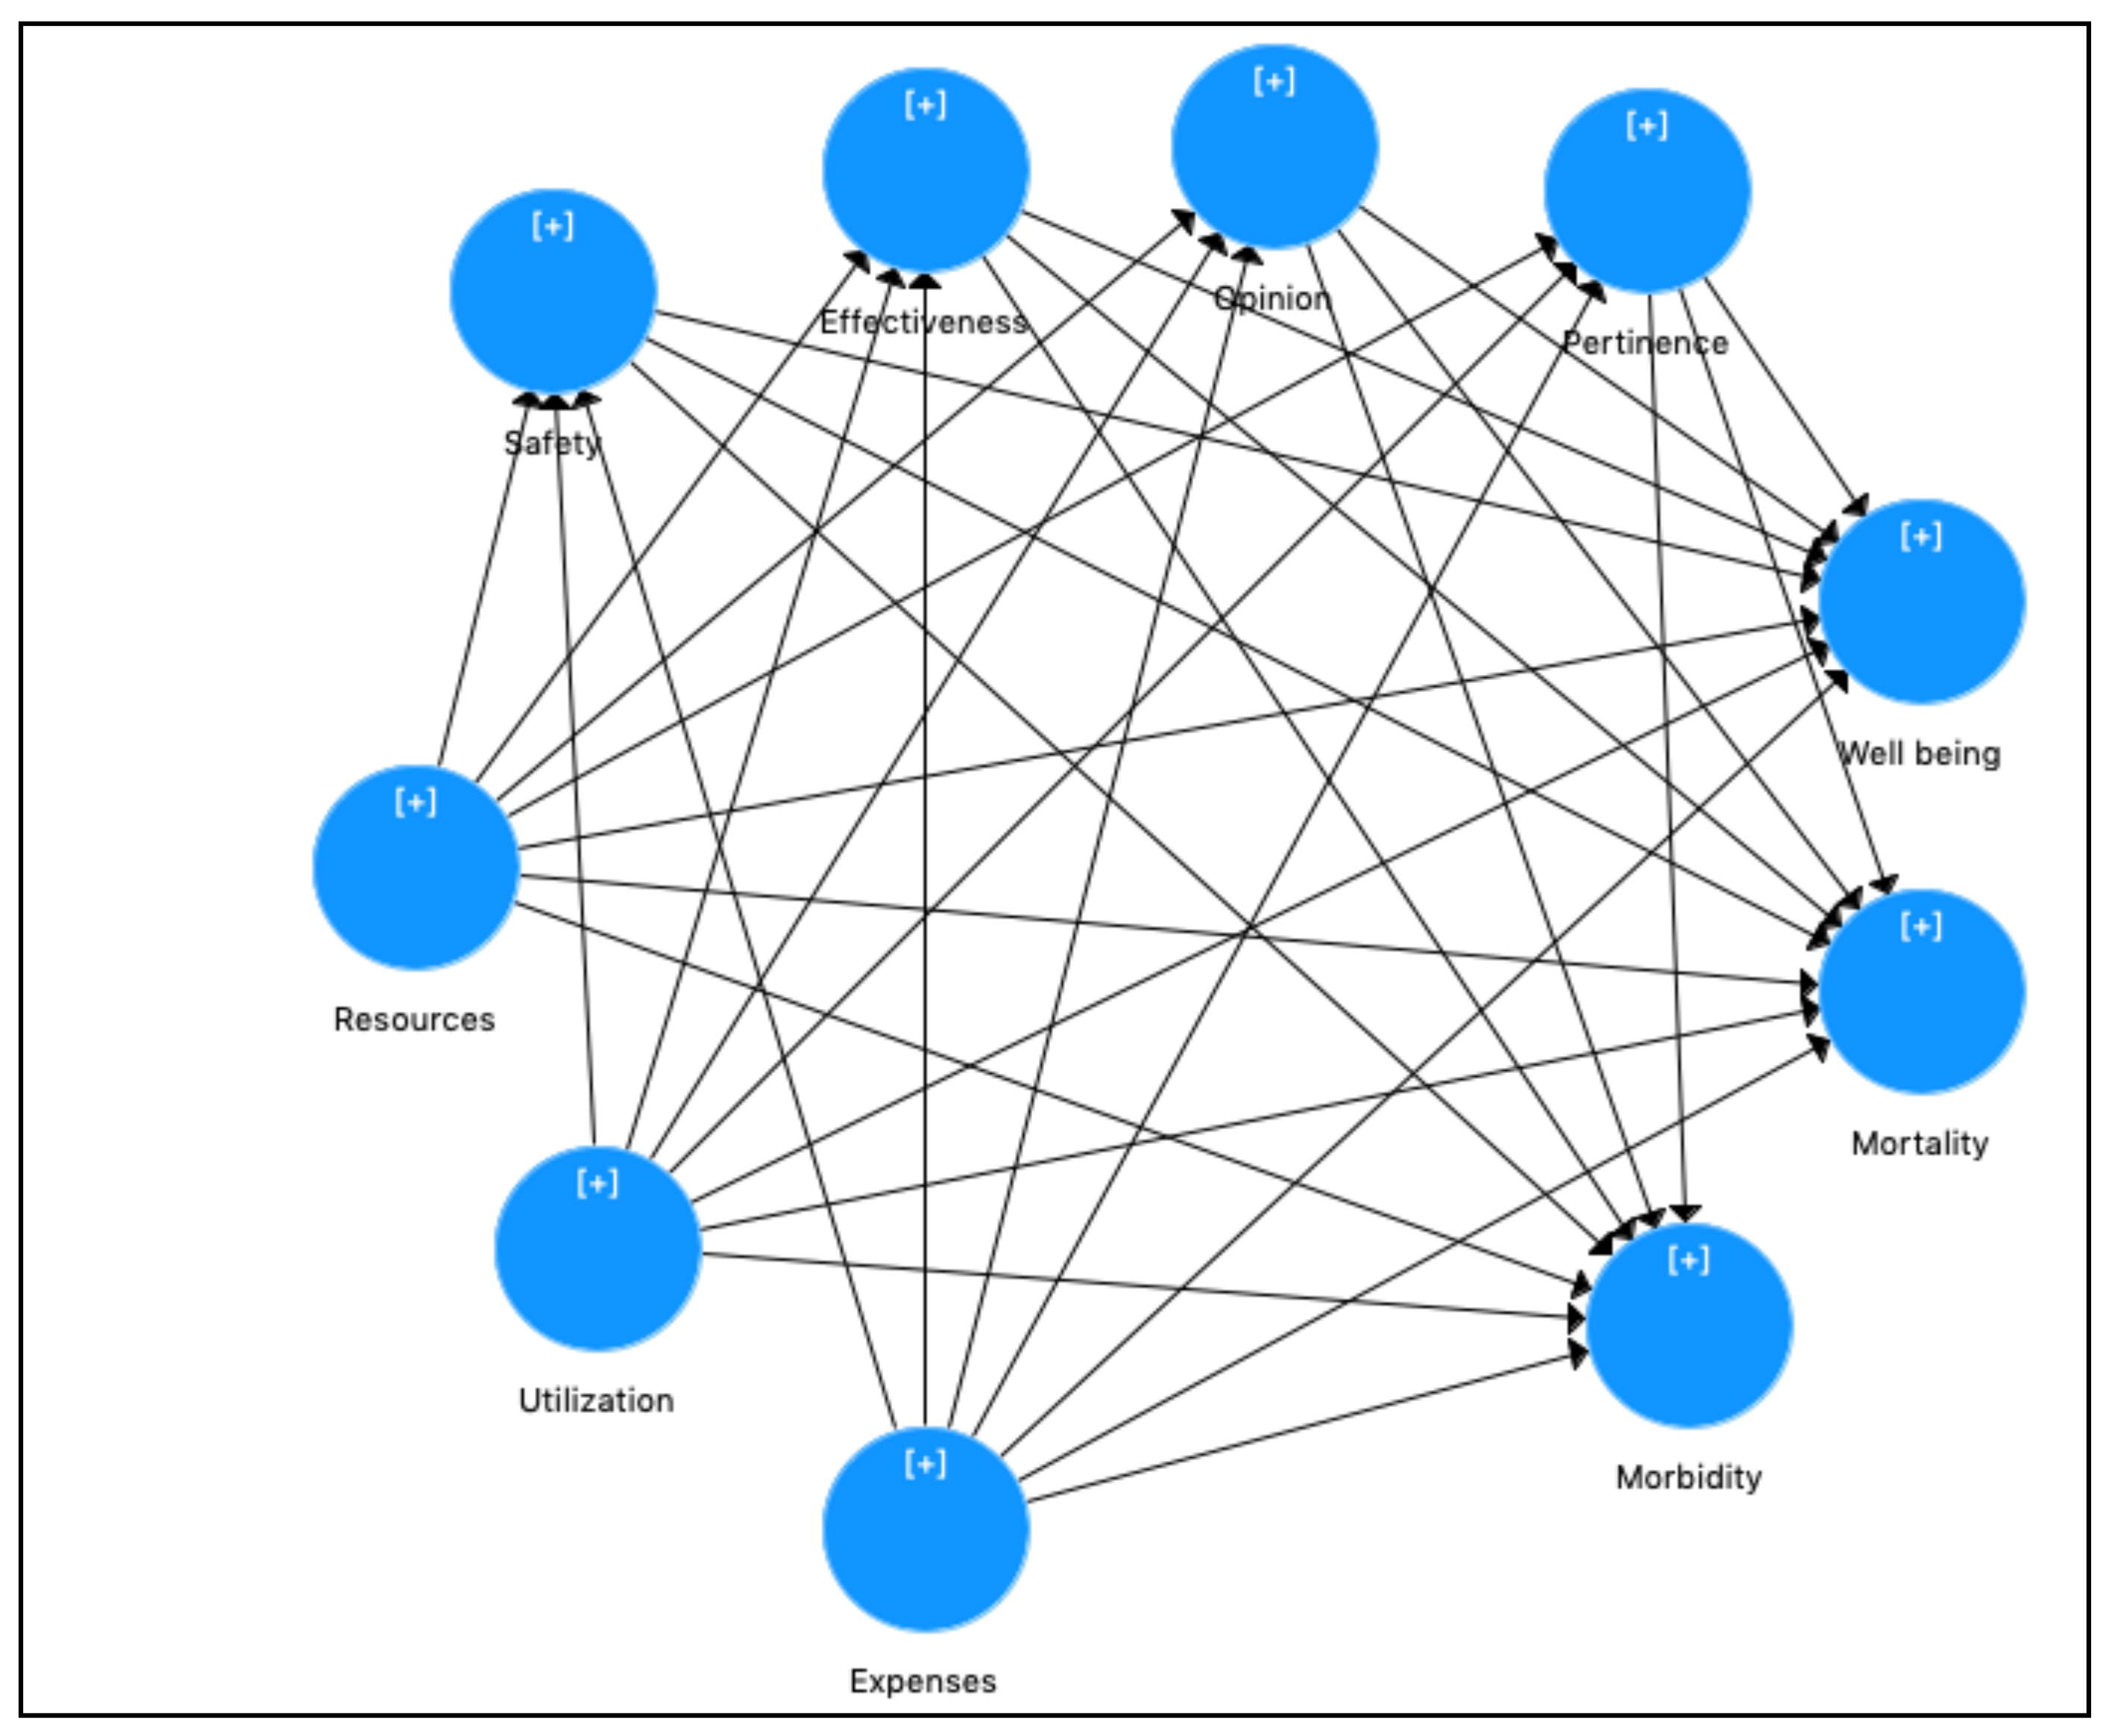
3.1.2. Formative Measurement Model

  • Collinearity of mode B indicators’ LOC
As the measurement mode A models have been evaluated in the previous subsections, it is now necessary to assess the formative measurement models, or mode B. To do this, within the two-step method in higher-order models, we examine the degree of collinearity of the indicators in mode B. If there is multicollinearity, we proceed to eliminate these items. For items EX4, EX7, U2, U4, U5, RE2, RE5, RE7, MT1, and MT6 (see Table 2), variance inflation factor (VIF) values equal to or greater than 5 were found, which indicated a multicollinearity problem, and they were eliminated from the model. The VIF of the k-th indicator is calculated as follows:
VIF k = 1 1 R k 2 ,
where R k 2 is the explained variance of the k-th regression. A high value of R k 2 denotes that the variance of the k-th indicator can be explained by other items of the construct.
  • Compute the LOC scores
Finally, the disjoint two-stage approach does not interpret the model estimates. According to the PLS algorithm, it proceeds to compute the lower-order constructs scores to use as new variables to measure the higher-order construct in stage two. The lower order components are linked to all other constructs that the higher-order construct is theoretically related to, as shown in Figure 2. In evaluating the HOC model, these scores are used as indicators of the higher-order construct [78].

3.2. Evaluation of HOC Measurement Model

3.2.1. Reflective Measurement Model

  • Individual item reliability HOC
The reflective indicators’ individual reliability is valued by examining the factorial loads (λ) or simple correlations of the measures or indicators with their respective construct. The indicators are reliable if λ ≥ 0.707 [83]. Several researchers argue that this heuristic rule should not be as rigid in the early stages of scale development [64] or when scales apply to different contexts [89].
In the model, the values for loads conform to what is recommended (see Table 5); however, the health–disease status construct has a negative value for the well-being dimension (−0.860). This value means that the condition is satisfied, since the squared value of −0.86 is 0.74, so the variance is explained in 74%; therefore, it must maintain the well-being item.
  • Construct Reliability HOC
The measurements are the Cronbach alpha coefficient (α), the ρA index, and composite reliability.
Composite reliability is more appropriate than Cronbach alpha for PLS, as it does not assume that all indicators receive the same weight [84]. The value of 0.7 is suggested as an appropriate level for “modest” reliability in the early stages of research, and a stricter 0.8 or 0.9 for more advanced research stages. Dijkstra–Henseler index (ρA) was also evaluated and is considered to be a measure of consistent reliability [85].
As shown in Table 6, the Dijkstra–Henseler index (ρA) value meets the recommended threshold to conform with our evaluation. Dijkstra and Henseler [85] presented their index ρA as an exact and consistent measure of construct reliability, since Cronbach’s alpha is conservative in excess and composite reliability the opposite.
  • Convergent validity HOC
Convergent validity implies that a set of indicators represents a single underlying construct, demonstrated by its one-dimensionality [90]. For average variance extracted (AVE) values, it is recommended that their values be equal to or greater than 0.50. In this case, the health–disease status with a 0.845 value of AVE is given validity.
  • Discriminant validity HOC
Discriminant validity indicates the extent to which a given construct is different from other constructs. We measure it through the Fornell and Larcker criterion.
The values indicating that there is an adequate discriminatory validity according to the Fornell and Larcker criterion are shown in bold on the diagonal (see Table 7).

3.2.2. Formative Measurement Model

The measurement model for mode B composites (HS performance and HS sustainability) was evaluated in terms of collinearity between indicators, significance, and relevance of external weights.
First, discarding indicators was carried out when the indicator exceeded the variance impact factor (VIF > 5). As a result of this process, all the HOC indicators remained without collinearity.
Second, the relevance of weights was analyzed. Figure 3 shows the relevance of indicators within their construction.
Thus, for the latent higher-order HS performance, the most positively relevant dimensions were effectiveness and safety. Additionally, opinion has negative relevance, while pertinence lacked weight within the system’s quality with a weight of 0.05, very close to zero.
For the HS sustainability higher-order variable measured through its dimensions, it was established that expenses are the most weighted dimension, followed by resources and, finally, utilization. All three dimensions bring positive relevance to the construct.
Finally, to evaluate the significance, we can start bootstrapping with 10,000 subsamples to check if the external weights are significantly different from zero, that is, the minimum recommended by Hair, Ringle, and Sarstedt [91]. Since weights provide information on their contribution, they can be classified according to their respective composition [64]. Indicators with a non-significant weight but with significant loads of 0.50 or more were considered relevant [64]. Our results show that all the indicators’ weights were significant, except pertinence (Table 8).

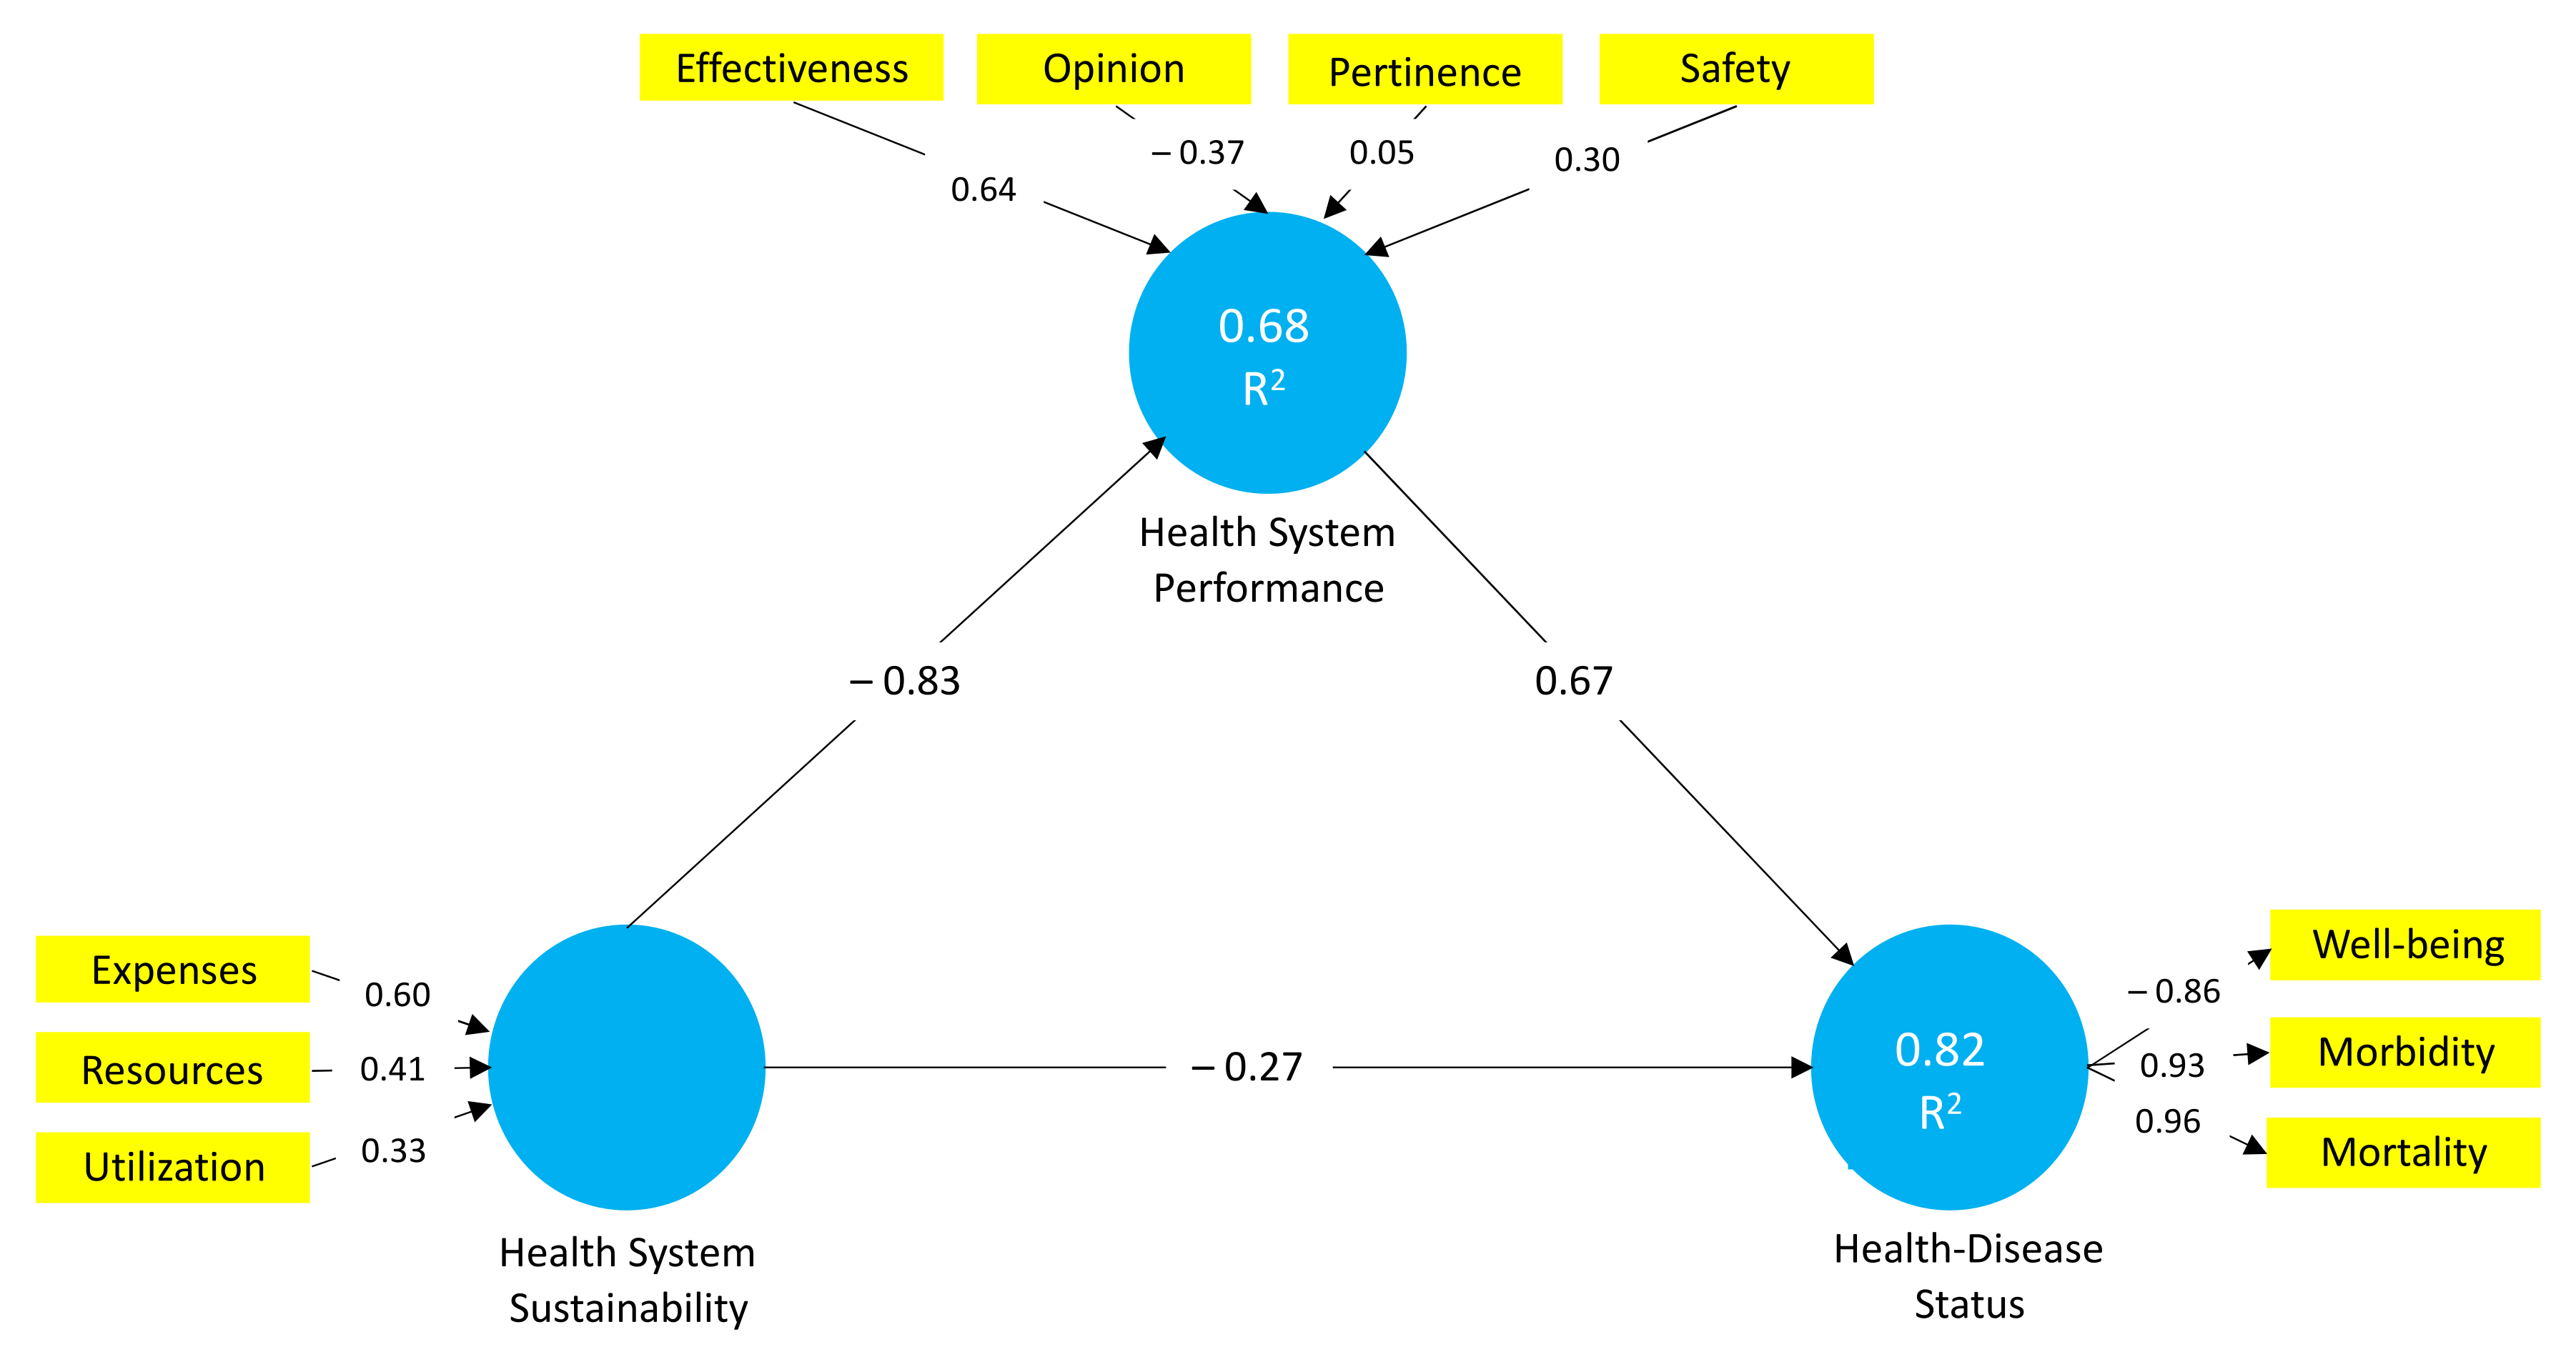
3.3. Evaluation of HOC Structural Model

Once the measures of the constructs were verified to be appropriate, the structural model was assessed.

3.3.1. Evaluation of Path Coefficients

Path coefficients and their significance are reported in Table 9 and Figure 3, with their 10,000 bootstrap resampling levels. In addition, Table 9 shows that the VIF of the constructs ranged from 1.000 to 3.152, suggesting that collinearity is not a problem. This study also evaluated quality by verifying that the Q2 value is greater than 0.5, which shows a situation of high predictive relevance [67]. This suggests a good fit in model prediction.
Our results suggest that HS performance has a positive and significant impact on health–disease status at a level of 5%; the higher the quality of the system, the higher the health–disease status. Additionally, HS sustainability has a significant but negative impact on health–disease level, suggesting that the health system’s higher sustainability lowers the rate of morbidity and mortality. Likewise, HS sustainability’s influence on HS performance is negative and significant. In short, all model hypotheses that relate latent variables to each other are accepted (H1, H2, and H3).
We analyzed the mediation (H4) hypothesis, resulting in the indirect effects being significant [92]. The indirect effect of HS sustainability on health–disease status through HS performance was positive and significant (p-value 0.000), supporting H4 (Table 9). The direct effect was also significant, which indicated that the mediation effect was partial [93]; HS sustainability directly influenced health–disease status (H1), and indirectly influenced it through HS performance. The value of the variance accounted for (VAF) indicated that the mediated ratio was 67.31% of HS sustainability’s total effect on health–disease status (see the indirect effect in Table 9):
VAF = indirect   effect total   effect .

3.3.2. Assessment of the Coefficient of Determination (R2)

The coefficient of determination (R2) represents a measure of predictive power. It indicates the amount of variance of a construct explained by the predictor variables of that endogenous construct in the model. R2 values range from 0 to 1; the higher the value, the more predictive capacity the model has for that variable.
The values of R2 should be high enough for the model to reach a minimum level of explanatory power. Falk and Miller [94] suggest at least ≥ 0.10; Chin [64] states that 0.67 is substantial, 0.33 is moderate, and 0.19 is weak.
The health–disease status construct’s predictive level, with a value of 0.842, can be considered more than substantial (see Table 9). The HS performance constructs with a value equal to 0.680 are also more than substantial because they exceed 67% and are close to 1 (see Table 9).

3.3.3. Review of Effect Sizes (f2)

The effect sizes (f2) value the degree to which an exogenous construct helps explain a certain endogenous construct in terms of R2 [95]:
f 2 = R included 2 R excluded 2 1 R included 2 ,
where R 2 is calculated including and excluding a specific predictor construct in the model.
A Cohen [95] heuristic rule for evaluating f2 holds that 0.02 ≤ f2 < 0.15 is a small effect; 0.15 ≤ f2 < 0.35 is a moderate effect; and f2 ≥ 0.35 is a large effect.
The results in Table 10 show that the effect between the exogenous construct HS sustainability and its contribution to the endogenous construct health–disease status (0.125) was small and significant, while HS performance (2.152) had a large effect. In contrast, the HS performance construct with health–disease status, with a value of 0.766, had a significant and large effect.

4. Discussion

The results of this study have important implications for hospital managers and policymakers. Healthcare officials and managers will have one more tool with which to establish the determinant factors for achieving their objective: to improve the population’s health and quality of life. The findings revealed that health system sustainability had a negative effect on health–disease status, measured in terms of mortality and morbidity rates. However, the relationship between health system performance and health–disease status is positive.
We analyzed 61 indicators belonging to lower-order components that define three higher-order components. Data were obtained from the Spanish Ministry of Health Social Services, and Equality for the entire Spanish territory, except Ceuta and Melilla, for the period between 2008 and 2017. The applied technique was partial least squares structural equation modeling (PLS-SEM).
The health–disease status construct, composed of three lower-order components, was reflected in two components of disease incidence and mortality with loads in a positive sense, presenting the well-being dimension’s inverse correlation with the value of the construct. Therefore, the model was further delimited by mortality and morbidity. In other words, the latent variable health–disease status was defined more by incidences of diseases than by health status in a positive sense. For example, a previous study discovered that the mortality rate increases when the person suffers from heart disease or cancer and, on the other hand, when the patient is hospitalized through an emergency unit [60]. A previous study indicated that injured people have a higher Charlson Comorbidity Index (CCI) than non-injured people, that is, pre-injury morbidity was higher [96].
A positive relationship between the constructs of health system performance and health–disease status was confirmed. The most relevant dimensions were effectiveness and safety, in this order, and lastly, pertinence with a non-significant influence. One of the most investigated components of effectiveness is the quality of the system, which, for example, can materialize in annual tests of hemoglobin A1C in diabetic patients and the use of aspirin in cases of myocardial infarction [6]. Moreover, opinion had a negative effect on performance. This clearly confirmed patient satisfaction as an indicator of quality care [97]. Despite this, the patient being in a state of discomfort might not be the best criterion when evaluating the health system [98].
Moreover, health system sustainability negatively influenced health–disease status, which shows that increases in expenditures, resources, and extent of use in the healthcare system improve the population’s health, reducing mortality and morbidity or increasing well-being. The three dimensions analyzed have a positive influence on the formative construct. The weights inform us about the contribution of the indicators to the construct. The indicator with the most weight was expenses, followed by the allocation of resources, and lastly, the use and exploitation of health services by citizens. When public agencies provide an adequate allocation of resources according to the patients’ needs, not only are effective, safe, and timely results offered—the efficiency of the system is improved [34]. It would be interesting for health systems to also invest their resources in prevention. For example, cardiovascular diseases, in many cases, and especially in young patients, are driven by behaviors that can be avoided, such as a sedentary lifestyle, smoking, poor diet, and alcohol consumption [99]. In another way, the literature shows that between 25% and 40% of cardiovascular diseases are attributable to work-related stress. For this reason, health systems policymakers should also address issues related to occupational health psychology, not only for mental morbidity, but also for other diseases that include the risk of death [41]. However, a study revealed that depression is a common factor in hospitalized patients, and when it is present, the risk of death after myocardial infarctions is higher [38]. On the other hand, hospital readmission is higher when it comes to cardiac patients [58].
Our research indicated that the health system’s better performance would be reflected as a better health–disease status of the population, which is consistent with the bibliography, which considers that with greater effectiveness and safety in the health system, the patient will obtain the desired results in a safe way [30]. Moreover, according to another study, we can observe that efficiency showed a negative relationship with mortality rates because the treatment’s efficiency allows better clinical results to be obtained [60]. Effectiveness is one of the health system’s performance indicators and reflects the effect that its treatment and interventions have on the health–disease status of the population [10]. A study carried out with exclusive data from hospitals revealed that the most competent and efficient hospitals have lower mortality rates [60].
Maintaining a sustainable health system is the basis for improving people’s health [2,28,34]. Hospitals that do not allocate their resources properly are more insecure, which means that they are more likely to have unwanted clinical events [34]. In that sense, the authorities must improve the services’ quality and deliver services effectively and professionally [32]. The results showed an inverse relationship between sustainability and health–disease status. In other words, better spending, resource allocation, and use of the health system lowers the incidence of diseases and improves health, which also explains the negative influence of sustainability on performance, since adequate management of resources and expenses will lead to a better-quality system. Tumors are the second leading cause of death in women worldwide. In this sense, the health system must promote and be able to attend on time the periodic controls that are required [42]. A previous study found that when it comes to diseases such as diabetes or lung conditions, patients adhere less to treatments. Therefore, the health system administration should direct its efforts to persuade the population by communicating with and educating them about the need to control these diseases [52]. The direct and indirect effects of sustainability on health–disease status were confirmed. The mediating effect, through the performance construct, was 32.09% of the total effect.
A favorable health–disease status of the population will require decision making by public authorities regarding the right laws of health in accordance with the WHO. This will imply implementing an efficient financing system with sufficient budgetary allocation to stimulate the system’s performance [18,19]. Thus, for example, spending on primary and specialized medicine are basic pillars, passing through the distribution of facilities that allow accessibility and use of the resources invested in the national health system [47]. All the budgetary allocation to cover expenses and resources must be done with balance, regardless of whether the healthcare offer is public and/or public–private arrangements, as is the case in some Spanish regions, hence the necessary regulation of the private–public provider mix. Regarding health system performance, the authorities must effectively attend to the composition of essential services packages to reduce health incidents. Another important factor in performance is having a good management and information system that allows data to be available at an opportune moment to make decisions that may affect the health system [6].
In this empirical study, the created model predicts the population’s health–disease status as 84.2%, which is considered more than substantial. On the other hand, the performance construct explained 68% of the variance.
Although our research model uses the Spanish Ministry of Health, Social Service, and Equality data to verify our hypotheses, there remain some limitations. One limitation was due to the phenomenon of the invisibility of data [1] related to social care arrangements. In addition, our results are based solely on the Spanish territory, which opens up the possibility that the findings are specific only to this country. Future research should be focused on other countries. Furthermore, differences in the patient’s gender, educational level, socioeconomic level, and other characteristics could yield interesting results in the future. Otherwise, future research could try to compare the performance of different secondary care centers, that is, hospitals, within the national territory, in order to verify if there are differences between autonomous communities (since in Spain it is the autonomous communities who have health competence).

5. Conclusions

Using the structural equation modeling approach, we developed a health–disease status model. The research reveals that a health system’s administrators and government must pay their attention to continuously improving health system performance and health system sustainability to fulfill their ultimate goal, which is to enhance citizens’ health–disease status.
The study’s findings showed that patient health improves when the health system’s performance is excellent, effective, and safe. Furthermore, patient health improves when the health system is sustainable over time, which implies that expenses, resources, and the use made of medical services are consistent with the needs of patients and do not compromise their future needs. Furthermore, health system performance mediates the relationship between sustainability and health–disease status. In other words, sustainability has a double effect (direct and indirect) on health–disease status.

Author Contributions

Conceptualization, A.R.-O.; methodology, A.R.-O.; validation, A.R.-O. and M.d.C.V.M.; formal analysis, A.R.-O. and M.S.G.; writing—original draft preparation, A.R.-O. and M.S.G.; writing—review and editing, A.R.-O., M.d.C.V.M., and M.S.G.; supervision, A.R.-O. and M.d.C.V.M. All authors have read and agreed to the published version of the manuscript.

Funding

This research received no external funding.

Institutional Review Board Statement

Not applicable.

Informed Consent Statement

Not applicable.

Data Availability Statement

Data publicly available from the Spanish Ministry of Health.

Conflicts of Interest

The authors declare no conflict of interest.

References

  1. Blouin, G.G. Data Performativity and Health: The Politics of Health Data Practices in Europe. Sci. Technol. Hum. Values 2020, 45, 317–341. [Google Scholar] [CrossRef]
  2. Hejduková, P.; Kureková, L. National Health Systems’ Performance: Evaluation WHO Indicators. Procedia Soc. Behav. Sci. 2016, 230, 240–248. [Google Scholar] [CrossRef] [Green Version]
  3. Hanson, K. La Medición Del Estado de la Salud: Género, Carga de Morbilidad Y Establecimiento de Prioridades en el Sector Salud. OPS Publ. Occas. 2000, 5. [Google Scholar]
  4. Kramers, P.G.N. The ECHI project. Eur. J. Public Health 2003, 13, 101–106. [Google Scholar] [CrossRef]
  5. Verschuuren, M.; Gissler, M.; Kilpeläinen, K.; Tuomi-Nikula, A.; Sihvonen, A.-P.; Thelen, J.; Gaidelyte, R.; Ghirini, S.; Kirsch, N.; Prochorskas, R.; et al. Public health indicators for the EU: The joint action for ECHIM (European Community Health Indicators & Monitoring). Arch. Public Health 2013, 71, 12. [Google Scholar] [CrossRef] [Green Version]
  6. Kruk, M.E.; Freedman, L.P. Assessing health system performance in developing countries: A review of the literature. Health Policy 2008, 85, 263–276. [Google Scholar] [CrossRef]
  7. Cuggia, M.; Toubiana, L. Health Information Systems. Yearb Med. Inform. 2013, 22, 114–116. [Google Scholar] [CrossRef] [Green Version]
  8. World Health Oragnization. 2020. Available online: https://www.who.int/es/about/who-we-are/constitution (accessed on 1 May 2021).
  9. Castro-Vázquez, Á.; Espinosa-Gutiérrez, I.; Rodríguez-Contreras, P.; Santos-Iglesias, P. Relación entre el estado de salud percibido e indicadores de salud en la población española. Int. J. Clin. Health Psychol. 2007, 7, 883–898. [Google Scholar]
  10. Cinaroglu, S.; Baser, O. Understanding the relationship between effectiveness and outcome indicators to improve quality in healthcare. Total. Qual. Manag. Bus. Excel. 2018, 29, 1294–1311. [Google Scholar] [CrossRef]
  11. Murray, C.J.L.; Frenk, J. A framework for assessing the performance of health systems. Bull. World Health Organ. 2000, 78, 717–731. [Google Scholar]
  12. Anderson, G.; Hussey, P.S. Comparing Health System Performance in OECD Countries. Health Aff. 2001, 20, 219–232. [Google Scholar] [CrossRef]
  13. Faezipour, M.; Ferreira, S. A System Dynamics Perspective of Patient Satisfaction in Healthcare. Procedia Comput. Sci. 2013, 16, 148–156. [Google Scholar] [CrossRef] [Green Version]
  14. Puertas, R.; Marti, L.; Guaita-Martinez, J.M. Innovation, lifestyle, policy and socioeconomic factors: An analysis of European quality of life. Technol. Forecast. Soc. Chang. 2020, 160, 120209. [Google Scholar] [CrossRef]
  15. García-Alfranca, F.; Puig, A.; Galup, C.; Aguado, H.; Cerdá, I.; Guilabert, M.; Pérez-Jover, V.; Carrillo, I.; Mira, J.J. Patient Satisfaction with Pre-Hospital Emergency Services. A Qualitative Study Comparing Professionals’ and Patients’ Views. Int. J. Environ. Res. Public Health 2018, 15, 233. [Google Scholar] [CrossRef] [Green Version]
  16. Rosenbusch, J.; Ismail, I.R.; Ringle, C.M. The agony of choice for medical tourists: A patient satisfaction index model. J. Hosp. Tour. Technol. 2018, 9, 267–279. [Google Scholar] [CrossRef]
  17. Vogus, T.J.; McClelland, L.E. When the customer is the patient: Lessons from healthcare research on patient satisfaction and service quality ratings. Hum. Resour. Manag. Rev. 2016, 26, 37–49. [Google Scholar] [CrossRef]
  18. Varabyova, Y.; Müller, J.-M. The efficiency of health care production in OECD countries: A systematic review and meta-analysis of cross-country comparisons. Health Policy 2016, 120, 252–263. [Google Scholar] [CrossRef]
  19. Garcia-Lacalle, J.; Martin, E. Rural vs urban hospital performance in a ‘competitive’ public health service. Soc. Sci. Med. 2010, 71, 1131–1140. [Google Scholar] [CrossRef]
  20. Chang, C.-W.; Tseng, T.-H.; Woodside, A.G. Configural algorithms of patient satisfaction, participation in diagnostics, and treatment decisions ’ influences on hospital loyalty. J. Serv. Mark. 2013, 27, 91–103. [Google Scholar] [CrossRef] [Green Version]
  21. Ferreira, P.L.; Raposo, V.; Tavares, A.I. Primary health care patient satisfaction: Explanatory factors and geographic characteristics. Int. J. Qual. Health Care 2020, 32, 93–98. [Google Scholar] [CrossRef]
  22. Manzoor, F.; Wei, L.; Hussain, A.; Asif, M.; Shah, S.I.A. Patient Satisfaction with Health Care Services; An Application of Physician’s Behavior as a Moderator. Int. J. Environ. Res. Public Health 2019, 16, 3318. [Google Scholar] [CrossRef] [Green Version]
  23. Aiken, L.H.; Sloane, D.M.; Ball, J.; Bruyneel, L.; Rafferty, A.M.; Griffiths, P. Patient satisfaction with hospital care and nurses in England: An observational study. BMJ Open 2021, 8, e019189. [Google Scholar] [CrossRef]
  24. Pérez-Romero, S.; Gascón-Cánovas, J.J.; Salmerón-Martínez, D.; Parra-Hidalgo, P.; Monteagudo-Piqueras, O. Relevancia del contexto socioeconómico y sanitario en la satisfacción del paciente. Gac. Sanit. 2017, 31, 416–422. [Google Scholar] [CrossRef]
  25. Draper, M.; Cohen, P.; Buchan, H. Seeking consumer views: What use are results of hospital patient satisfaction surveys? Int. J. Qual. Health Care 2001, 13, 463–468. [Google Scholar] [CrossRef]
  26. Kamra, V.; Singh, H.; De, K.K. Factors affecting patient satisfaction: An exploratory study for quality management in the health-care sector. Total. Qual. Manag. Bus. Excel. 2016, 27, 1013–1027. [Google Scholar] [CrossRef]
  27. Evangelinos, K.; Fotiadis, S.; Skouloudis, A.; Khan, N.; Konstandakopoulou, F.; Nikolaou, I.; Lundy, S. Occupational health and safety disclosures in sustainability reports: An overview of trends among corporate leaders. Corp. Soc. Responsib. Environ. Manag. 2018, 25, 961–970. [Google Scholar] [CrossRef]
  28. Molero, A.; Calabrò, M.; Vignes, M.; Gouget, B.; Gruson, A.D. Sustainability in Healthcare: Perspectives and Reflections Regarding Laboratory Medicine. Ann. Lab. Med. 2021, 41, 139–144. [Google Scholar] [CrossRef]
  29. Handayani, P.W.; Hidayanto, A.N.; Sandhyaduhita, P.I.; Kasiyah; Ayuningtyas, D. Strategic hospital services quality analysis in Indonesia. Expert Syst. Appl. 2015, 42, 3067–3078. [Google Scholar] [CrossRef]
  30. lo Storto, C.; Goncharuk, A.G. Efficiency vs effectiveness: A benchmarking study on European healthcare systems. Econ. Sociol. 2017, 10, 102–115. [Google Scholar] [CrossRef] [Green Version]
  31. Ruo, B.; Rumsfeld, J.S.; Hlatky, M.A.; Liu, H.; Browner, W.S.; Whooley, M.A. Depressive Symptoms and Health-Related Quality of Life. JAMA 2003, 290, 215–221. [Google Scholar] [CrossRef]
  32. Hussain, A.; Asif, M.; Jameel, A.; Hwang, J.; Sahito, N.; Kanwel, S. Promoting OPD Patient Satisfaction through Different Healthcare Determinants: A Study of Public Sector Hospitals. Int. J. Environ. Res. Public Health 2019, 16, 3719. [Google Scholar] [CrossRef] [PubMed] [Green Version]
  33. European Observatory on Health Systems and Policies. State of Health in the EU-Spain: Country Health Profile 2019. Available online: https://ec.europa.eu/health/sites/health/files/state/docs/2019_chp_es_english.pdf (accessed on 12 March 2021).
  34. Ferreira, D.C.; Nunes, A.M.; Marques, R.C. Operational efficiency vs clinical safety, care appropriateness, timeliness, and access to health care. J. Prod. Anal. 2020, 53, 355–375. [Google Scholar] [CrossRef]
  35. Rabar, D.; Fabić, M.G.; Petrlić, A. Financial performance–efficiency nexus in public health services: A nonparametric evidence-based approach. Econ. Res. Ekonomska Istraživanja 2020, 33, 3334–3355. [Google Scholar] [CrossRef]
  36. Gutierrez-Robredo, L. Morbilidad en la poblacion mayor. El proceso de la transición epidemiológica. Demos 2001, 14, 8–9. [Google Scholar]
  37. Díaz, R. Satisfacción del paciente: Principal motor y centro de los servicios sanitarios. Rev. Calid. Asist. 2002, 17, 22–29. [Google Scholar] [CrossRef]
  38. Pederson, J.L.; Warkentin, L.M.; Majumdar, S.R.; McAlister, F.A. Depressive symptoms are associated with higher rates of readmission or mortality after medical hospitalization: A systematic review and meta-analysis. J. Hosp. Med. 2016, 11, 373–380. [Google Scholar] [CrossRef] [Green Version]
  39. Purcărea, V.L.; Gheorghe, I.R.; Petrescu, C.M. The Assessment of Perceived Service Quality of Public Health Care Services in Romania Using the SERVQUAL Scale. Procedia Econ. Financ. 2013, 6, 573–585. [Google Scholar] [CrossRef] [Green Version]
  40. Yang, H.; Guo, X.; Wu, T. Exploring the influence of the online physician service delivery process on patient satisfaction. Decis. Support Syst. 2015, 78, 113–121. [Google Scholar] [CrossRef]
  41. Vieco-Gómez, G.F.; Abello Llanos, R. Psychosocial factors at work, stress and morbidity around the world. Psicol. Desde Caribe 2014, 31, 354–385. [Google Scholar] [CrossRef]
  42. Llobet, C.V.; Banqué, M.; Fuentes, M.; Ojuel, J. Morbilidad diferencial entre mujeres y hombres. Anuario Psicol. 2008, 39, 9–22. [Google Scholar]
  43. Carreras, M.; Puig, G.; Sánchez-Pérez, I.; Inoriza, J.M.; Coderch, J.; Gispert, R. Morbidity and self-perception of health, two different approaches to health status. Gac. Sanit. 2020, 34, 601–607. [Google Scholar] [CrossRef]
  44. Berta, P.; Ingrassia, S.; Punzo, A.; Vittadini, G. Multilevel cluster-weighted models for the evaluation of hospitals. Metron 2016, 74, 275–292. [Google Scholar] [CrossRef]
  45. Mendoza, L.A.; Arias, M.; Mendoza, L.I. Hijo de madre adolescente: Riesgos, morbilidad y mortalidad neonatal. Rev. Chil. Obstet. Ginecol. 2012, 77, 375–382. [Google Scholar] [CrossRef] [Green Version]
  46. Kashian, R.; Lovett, N.; Xue, Y. Has the affordable care act affected health care efficiency? J. Regul. Econ. 2020, 58, 193–233. [Google Scholar] [CrossRef]
  47. Martínez, M.D.C.V.; Ramírez-Orellana, A. Patient Satisfaction in the Spanish National Health Service: Partial Least Squares Structural Equation Modeling. Int. J. Environ. Res. Public Health 2019, 16, 4886. [Google Scholar] [CrossRef] [Green Version]
  48. Horvat, A.; Filipovic, J. Healthcare system quality indicators: The complexity perspective. Total. Qual. Manag. Bus. Excel. 2020, 31, 161–177. [Google Scholar] [CrossRef]
  49. Amin, M.; Nasharuddin, S.Z. Hospital service quality and its effects on patient satisfaction and behavioural intention. Clin. Gov. Int. J. 2013, 18, 238–254. [Google Scholar] [CrossRef] [Green Version]
  50. Huynh, H.P.; Sweeny, K.; Miller, T. Transformational leadership in primary care: Clinicians’ patterned approaches to care predict patient satisfaction and health expectations. J. Health Psychol. 2018, 23, 743–753. [Google Scholar] [CrossRef] [Green Version]
  51. Ricci-Cabello, I.; Stevens, S.; Dalton, A.R.H.; Griffiths, R.I.; Campbell, J.L.; Valderas, J.M. Identifying Primary Care Pathways from Quality of Care to Outcomes and Satisfaction Using Structural Equation Modeling. Health Serv. Res. 2018, 53, 430–449. [Google Scholar] [CrossRef] [Green Version]
  52. DiMatteo, M. Variations in patients’ adherence to medical recommendations: A quantitative review of 50 years of research. Med. Care 2004, 42, 200–209. [Google Scholar] [CrossRef]
  53. Hunter-Jones, P.; Line, N.; Zhang, J.J.; Malthouse, E.C.; Witell, L.; Hollis, B. Visioning a hospitality-oriented patient experience (HOPE) framework in health care. J. Serv. Manag. 2020, 31, 869–888. [Google Scholar] [CrossRef]
  54. Macrae, H. “It’s my body, my future”: Older women’s views of their interactions with physicians. J. Women Aging 2016, 28, 211–224. [Google Scholar] [CrossRef] [PubMed]
  55. Gulías, E.; Díez, N.; Pereira, M. Los componentes de la satisfacción de los pacientes y su utilidad para la gestión hospitalaria. Rev. Española Cienc. Política 2013, 32, 161–181. [Google Scholar]
  56. Fernández-Pérez, Á.; Sánchez, Á. Improving People’s Self-Reported Experience with the Health Services: The Role of Non-Clinical Factors. Int. J. Environ. Res. Public Health 2020, 17, 178. [Google Scholar] [CrossRef] [Green Version]
  57. Bible, J.E.; Shau, D.N.; Kay, H.F.; Cheng, J.S.; Aaronson, O.S.; Devin, C.J. Are Low Patient Satisfaction Scores Always Due to the Provider? Spine 2018, 43, 58–64. [Google Scholar] [CrossRef]
  58. Vámosi, M.; Lauberg, A.; Borregaard, B.; Christensen, A.V.; Thrysoee, L.; Rasmussen, T.B.; Ekholm, O.; Juel, K.; Berg, S.K. Patient-reported outcomes predict high readmission rates among patients with cardiac diagnoses. Findings from the DenHeart study. Int. J. Cardiol. 2020, 300, 268–275. [Google Scholar] [CrossRef]
  59. Ferreira, D.; Marques, R.C. Do quality and access to hospital services impact on their technical efficiency? Omega 2019, 86, 218–236. [Google Scholar] [CrossRef]
  60. Martini, G.; Berta, P.; Mullahy, J.; Vittadini, G. The effectiveness–efficiency trade-off in health care: The case of hospitals in Lombardy, Italy. Reg. Sci. Urban Econ. 2014, 49, 217–231. [Google Scholar] [CrossRef]
  61. Kilpeläinen, K.; Tuomi-Nikula, A.; Thelen, J.; Gissler, M.; Sihvonen, A.-P.; Kramers, P.; Aromaa, A. Health indicators in Europe: Availability and data needs. Eur. J. Public Health 2012, 22, 716–721. [Google Scholar] [CrossRef] [Green Version]
  62. Williams, L.J.; Vandenberg, R.J.; Edwards, J.R. 12 Structural Equation Modeling in Management Research: A Guide for Improved Analysis. Acad. Manag. Ann. 2009, 3, 543–604. [Google Scholar] [CrossRef]
  63. Wold, H. Soft modelling: Intermediate between traditional model building and data analysis. Banach Cent. Publ. 1980, 6, 333–346. [Google Scholar] [CrossRef] [Green Version]
  64. Chin, W.W. The partial least squares approach to structural equation modeling. In Modern Methods for Business Research; Marcoulides, G., Ed.; Lawrence Erlbaum Associates: Mahwah, NJ, USA, 1998; pp. 295–336. [Google Scholar]
  65. Roldán, J.; Sánchez-Franco, M. Variance-based structural equation modeling: Guidelines for using partial least squares in information systems research. In Research Methodologies, Innovations and Philosophies in Software Systems Engineering and Information Systems; Mora, M., Steenkamp, A., Johnston, L., Gamon, J., Eds.; IGI Global: Hershey, PA, USA, 2012; pp. 193–221. [Google Scholar]
  66. Henseler, J.; Ringle, C.M.; Sarstedt, M. Testing measurement invariance of composites using partial least squares. Int. Mark. Rev. 2016, 33, 405–431. [Google Scholar] [CrossRef]
  67. Hair, J.F.; Risher, J.J.; Sarstedt, M.; Ringle, C.M. When to use and how to report the results of PLS-SEM. Eur. Bus. Rev. 2019, 31, 2–24. [Google Scholar] [CrossRef]
  68. Wetzels, M.; Odekerken-Schröder, G.; Van Oppen, C. Using PLS Path Modeling for Assessing Hierarchical Construct Models: Guidelines and Empirical Illustration. MIS Q. 2009, 33, 177–195. [Google Scholar] [CrossRef]
  69. Chin, W.W. How to Write Up and Report PLS Analyses. In Handbook of Partial Least Squares; Esposito, V.V., Chin, W.W., Henseler, J., Wang, H., Eds.; Springer: Berlin/Heidelberg, Germany, 2009; pp. 655–690. [Google Scholar]
  70. Richter, N.F.; Cepeda, G.; Roldán, J.L.; Ringle, C.M. European management research using partial least squares structural equation modeling (PLS-SEM). Eur. Manag. J. 2016, 34, 589–597. [Google Scholar] [CrossRef]
  71. Bollen, K.A.; Bauldry, S. Three Cs in measurement models: Causal indicators, composite indicators, and covariates. Psychol. Methods 2011, 16, 265–284. [Google Scholar] [CrossRef] [Green Version]
  72. Müller, T.; Schuberth, F.; Henseler, J. PLS path modeling—A confirmatory approach to study tourism technology and tourist behavior. J. Hosp. Tour. Technol. 2018, 9, 249–266. [Google Scholar] [CrossRef] [Green Version]
  73. Ringle, C.M.; Sarstedt, M.; Mitchell, R.; Gudergan, S.P. Partial least squares structural equation modeling in HRM research. Int. J. Hum. Resour. Manag. 2020, 31, 1617–1643. [Google Scholar] [CrossRef]
  74. Grace, J.B.; Bollen, K.A. Representing general theoretical concepts in structural equation models: The role of composite variables. Environ. Ecol. Stat. 2008, 15, 191–213. [Google Scholar] [CrossRef]
  75. Alfalla-Luque, R.; Machuca, J.A.; Marin-Garcia, J.A. Triple-A and competitive advantage in supply chains: Empirical research in developed countries. Int. J. Prod. Econ. 2018, 203, 48–61. [Google Scholar] [CrossRef]
  76. Polites, G.L.; Roberts, N.; Thatcher, J. Conceptualizing models using multidimensional constructs: A review and guidelines for their use. Eur. J. Inf. Syst. 2012, 21, 22–48. [Google Scholar] [CrossRef]
  77. Hair, J.F.; Hult, G.; Ringle, C.; Sarstedt, M. A Primer on Partial Least Squares Structural Equation Modeling (Pls-SeM), 2nd ed.; Sage Publications: Thousand Oaks, CA, USA, 2017. [Google Scholar]
  78. Sarstedt, M.; Hair, J.F.; Cheah, J.-H.; Becker, J.-M.; Ringle, C.M. How to Specify, Estimate, and Validate Higher-Order Constructs in PLS-SEM. Australas. Mark. J. 2019, 27, 197–211. [Google Scholar] [CrossRef]
  79. Law, K.S.; Wong, C.-S.; Mobley, W.H. Toward a Taxonomy of Multidimensional Constructs. Acad. Manag. Rev. 1998, 23, 741. [Google Scholar] [CrossRef]
  80. Edwards, J.R. Multidimensional Constructs in Organizational Behavior Research: An Integrative Analytical Framework. Organ. Res. Methods 2001, 4, 144–192. [Google Scholar] [CrossRef]
  81. Roemer, E. A tutorial on the use of PLS path modeling in longitudinal studies. Ind. Manag. Data Syst. 2016, 116, 1901–1921. [Google Scholar] [CrossRef]
  82. Faul, F.; Erdfelder, E.; Buchner, A.; Lang, A.-G. Statistical power analyses using G*Power 3.1: Tests for correlation and regression analyses. Behav. Res. Methods 2009, 41, 1149–1160. [Google Scholar] [CrossRef] [PubMed] [Green Version]
  83. Carmines, E.; Zeller, R. Reliability and Validity Assessment; SAGE Publications Inc.: London, UK, 1979. [Google Scholar]
  84. Garson, G. Partial Least Squares: Regression & Structural Equation Models; Statistical Publishing Associates: Asheboro, NC, USA, 2016; pp. 1–262. [Google Scholar]
  85. Dijkstra, T.K.; Henseler, J. Consistent partial least squares path modeling. MIS Q. 2015, 39, 297–316. [Google Scholar] [CrossRef]
  86. Henseler, J.; Ringle, C.M.; Sarstedt, M. A new criterion for assessing discriminant validity in variance-based structural equation modeling. J. Acad. Mark. Sci. 2015, 43, 115–135. [Google Scholar] [CrossRef] [Green Version]
  87. Franke, G.; Sarstedt, M. Heuristics versus statistics in discriminant validity testing: A comparison of four procedures. Internet Res. 2019, 29, 430–447. [Google Scholar] [CrossRef]
  88. Fornell, C.; Larcker, D.F. Evaluating Structural Equation Models with Unobservable Variables and Measurement Error. J. Mark. Res. 1981, 18, 39–50. [Google Scholar] [CrossRef]
  89. Barclay, D.; Higgins, C.; Thomson, R. The partial least squares approach to causal modeling personal computer adoption and use as an illustration. Technol. Stud. 1995, 2, 285–309. [Google Scholar]
  90. Henseler, J.; Ringle, C.M.; Sinkovics, R.R. The use of partial least squares path modeling in international marketing. In New Advances in International Marketing; Emerald Publishing Limited: Bingley, UK, 2009; Volume 20, pp. 277–319. [Google Scholar]
  91. Hair, J.F.; Ringle, C.M.; Sarstedt, M. PLS-SEM: Indeed a Silver Bullet. J. Mark. Theory Pract. 2011, 19, 139–152. [Google Scholar] [CrossRef]
  92. Hayes, A.F. Beyond Baron and Kenny: Statistical Mediation Analysis in the New Millennium. Commun. Monogr. 2009, 76, 408–420. [Google Scholar] [CrossRef]
  93. Cepeda, G.; Nitzl, C.; Roldán, J. Mediation analyses in partial least squares structural equation modeling: Guidelines and empirical examples. In Partial Least Squares Path Modeling: Basic Concepts, Methodological Issues and Applications; Latan, H., Noonan, R., Eds.; Springer: Cham, Switzerland, 2017; pp. 173–195. [Google Scholar]
  94. Falk, R.; Miller, N. A Primer for Soft Modeling; University of Akron Press: Akron, OH, USA, 1992. [Google Scholar]
  95. Cohen, J. Set Correlation and Contingency Tables. Appl. Psychol. Meas. 1988, 12, 425–434. [Google Scholar] [CrossRef]
  96. Cameron, C.M.; Purdie, D.M.; Kliewer, E.V.; McClure, R.J. Differences in prevalence of pre-existing morbidity between injured and non-injured populations. Bull. World Health Organ. 2005, 83, 345–352. [Google Scholar]
  97. Leino-Kilpi, H.; Vuorenheimo, J. Patient satisfaction as an indicator of the quality of nursing care. Nord. J. Nurs. Res. 1992, 12, 22–28. [Google Scholar] [CrossRef]
  98. Duggirala, M.; Rajendran, C.; Anantharaman, R. Patient-perceived dimensions of total quality service in healthcare. Benchmarking Int. J. 2008, 15, 560–583. [Google Scholar] [CrossRef]
  99. Urrego, C.; Romero, M.; Murcia, Z.; Medina, C.; Marulanda, J.; Zerón, H. Evaluación de factores de riesgo asociados a enfermedad cardiovascular en jóvenes universitarios de la Localidad Santafé en Bogotá, Colombia. Nova 2016, 14, 35–45. [Google Scholar] [CrossRef] [Green Version]
Figure 1. The theoretical model of health–disease status in Spain.
Mathematics 09 01228 g001
Figure 2. The first step: lower order components’ measurement model.
Mathematics 09 01228 g002
Figure 3. The second step: higher-order composites’ structural model. Health system sustainability, health system performance, and health–disease status are higher-order constructs (HOC).
Mathematics 09 01228 g003
Table 1. Composites and description of indicators.
CompositesIndicatorsDescription
Effectiveness
(Mode B)
EF1Birth of children from women less than 20 years old for each 100 births
EF2Incidence of tetanus per 100,000 inhab.
EF3Incidence of hepatitis B per 100,000 inhab.
EF4Incidence of mumps per 100,000 inhab.
Safety
(Mode B)
SA1Rate of suspected severe adverse effects rate to medication notified per 1,000,000 inhab.
SA2Intrahospital mortality of post-heart attack for every 100 discharges per a heart attack
SA3Amputation rate of the lower limb in diabetes patients
Opinion
(Mode A)
O1Level of satisfaction of citizens with the public health system
O2 *Level of satisfaction of citizens with their historical knowledge and the tracking of their health condition by their family doctor and pediatrician
O3Level of satisfaction of citizens with the information provided by their doctor about their health condition
Pertinence
(Mode B)
PE1Percentage of laparoscopic cholecystectomy
PE2Percentage of conservative breast cancer surgery
PE3Percentage of hip fracture patients with surgery in the first 48 h
Expenses
(Mode B)
EX1Percentage of health expenditure in primary care
EX2Percentage of health expenditure in pharmacy
EX3Public health expenditure per covered population
EX4 *Percentage of health expenditure in specialized care
EX5Percentage of health expenditure on salaries
EX6Percentage of health expenditure on intermediate consumption
EX7 *Percentage of health expenditure on public–private contract
EX8Percentage of health expenditure on internship training
Utilization
(Mode B)
U1Consultations with specialist doctors (% NHS)
U2 *Hospitalizations (% NHS)
U3Surgical interventions (% NHS)
U4 *CT utilization (% NHS)
U5 *Use rate of nuclear magnetic resonance (% NHS)
U6Hemodialysis usage (% NHS)
U7Hemodynamic usage (%NHS)
Resources
(Mode B)
RE1Specialist doctors (% NHS)
RE2 *Specialized nursing (% NHS)
RE3Beds in operation (% NHS)
RE4Day hospital places (% NHS)
RE5 *Operating rooms (% NHS)
RE6CT equipment (% NHS)
RE7 *Nuclear magnetic resonance equipment (% NHS)
RE8Hemodialysis equipment (% NHS)
RE9Hemodynamic equipment (% NHS)
Well-being
(Mode A)
WB1Life expectancy at birth
WB2Life expectancy at 65 years
WB3Healthy life years at birth
WB4Healthy life years at the age of 65 years
Mortality
(Mode B)
MT1 *Ischemic heart disease mortality rate per 100,000 inhab.
MT2Cerebrovascular disease mortality rate per 100,000 inhab.
MT3Cancer mortality rate per 100,000 inhab.
MT4Chronic obstructive pulmonary disease mortality rate per 100,000 inhab.
MT5Pneumonia and influenza mortality rate per 100,000 inhab.
MT6 *Chronic liver disease mortality rate per 100,000 inhab.
MT7Diabetes mellitus mortality rate per 100,000 inhab.
MT8Unintentional accidents mortality rate per 100,000 inhab.
MT9Suicide mortality rate per 100,000 inhab.
MT10Alzheimer’s mortality rate per 100,000 inhab.
Morbidity
(Mode B)
MB1Tuberculosis incidence
MB2New HIV diagnosis
MB3Diabetes in adult population
MB4Acute myocardial infarction hospitalization per 10,000 inhab. (NHS only)
MB5Cerebrovascular disease hospitalization per 10,000 inhab. (NHS only)
MB6Chronic obstructive pulmonary disease hospitalization per 10,000 inhab. (NHS only)
MB7Diabetes mellitus hospitalization per 10,000 inhab. (NHS only)
MB8Hypertensive disease hospitalization per 10,000 inhab. (NHS only)
MB9 *Congestive heart failure hospitalization per 10,000 inhab. (NHS only)
MB10Victims of traffic accidents
MB11Work accidents
MB12Frequency of work accidents
Source: Ministry of Health, Social Services, and Equality (MHSE), 2008–2017. * These indicators were not included in latent variables due to the multicollinearity criteria of PLS-SEM or item reliability.
Table 2. Hierarchical component of study.
Lower Order CompositesHigher-Order Composites
EffectivenessHealth system performance
Safety
Opinion
Pertinence
ExpensesHealth system sustainability
Utilization
Resources
Well-beingHealth–disease status
Mortality
Morbidity
Source: Own elaboration.
Table 3. Construct reliability LOC.
ConstructsCronbach AlphaρAComposite Reliability
Opinion 0.7741.2100.884
Well-being0.8410.8780.890
Source: Own elaboration.
Table 4. Fornell and Larcker criterion LOC.
ConstructsEFEXMBMTOPERESAUW−B
EFn/a
EX−0.537n/a
MB0.854−0.71n/a
MT0.846−0.6350.873n/a
O−0.2710.364−0.452−0.3690.891
PE−0.1860.342−0.136−0.0330.167n/a
RE−0.5480.421−0.627−0.5550.6140.141n/a
SA0.578−0.6220.6730.599−0.188−0.199−0.422n/a
U−0.4050.112−0.382−0.4650.341−0.1040.403−0.252n/a
W−B−0.6570.543−0.665−0.7610.3670.1100.519−0.4050.4310.820
Source: Own elaboration.
Table 5. Individual item reliability HOC.
ConstructsMorbidityMortalityWell-Being
Health–disease Status0.9340.960−0.860
Source: Own elaboration.
Table 6. Construct reliability HOC.
ConstructCronbach AlphaρAComposite Reliability
Health–disease Status−0.8760.9260.696
Source: Own elaboration.
Table 7. Fornell and Larcker criterion HOC.
ConstructsHealth–Disease StatusHS PerformanceHS Sustainability
Health–disease St.0.919
HS Performance0.890n/a
HS Sustainability−0.821−0.826n/a
Source: Own elaboration.
Table 8. Significance of weights.
ConstructsOriginal SampletLoadingsLo95Hi95
Health System Sustainability
Expenses0. 600 ***9.9740.810[0.479;0.714]
Resources0. 413 ***7.9780.798[0.314;0.517]
Utilization0. 328 ***6.1940.562[0.220;0.427]
Health System Performance
Effectiveness0. 639 ***14.3070.902[0.547;0.723]
Opinion−0. 367 ***7.616−0.588[−0.459;−0.270]
Pertinence0. 051 ns1.410−0.189[−0.018;0.122]
Safety0. 298 ***6.2670.727[0.205;0.392]
ns not significant. * p < 0.05; ** p < 0.01; *** p < 0.001. Significance, t statistic, and 95% bias-corrected confidence interval performed by 10,000 replications bootstrapping procedure.
Table 9. Full sample results.
ConstructsPathtpLo95Hi95f2VIF
Direct effects
HSP→HS0.667 ***14.4130.0000.577;0.7600.7663.152
HSS→HS−0.821 ***36.4480.000−0.864;−0.7750.1253.152
R2: 0.816; Q2: 0.672
HSS→HSP−0.826 ***35.1970.000−0.873;−0.7812.1521.000
R2: 0.683
Indirect effect VAF
HSS→HSP→HS−0.551 ***13.2190.000−0.640−0.47567.31%n/a
* p < 0.05; ** p < 0.01; *** p < 0.001. Significance, t statistic, and 95% bias-corrected confidence interval performed by 10,000 replication bootstrapping procedure. VIF—inner model variance inflation factor; VAF—variance accounted for.
Table 10. Effect sizes (f2) and p-values.
HS Performance → Health–Disease Status0.7660.000
HS Sustainability → Health–Disease Status0.1250.010
HS Sustainability → HS Performance2.1520.000
Source: Own elaboration.
Publisher’s Note: MDPI stays neutral with regard to jurisdictional claims in published maps and institutional affiliations.

