1. Introduction
Pumps consume about 20% of the electricity generated worldwide [
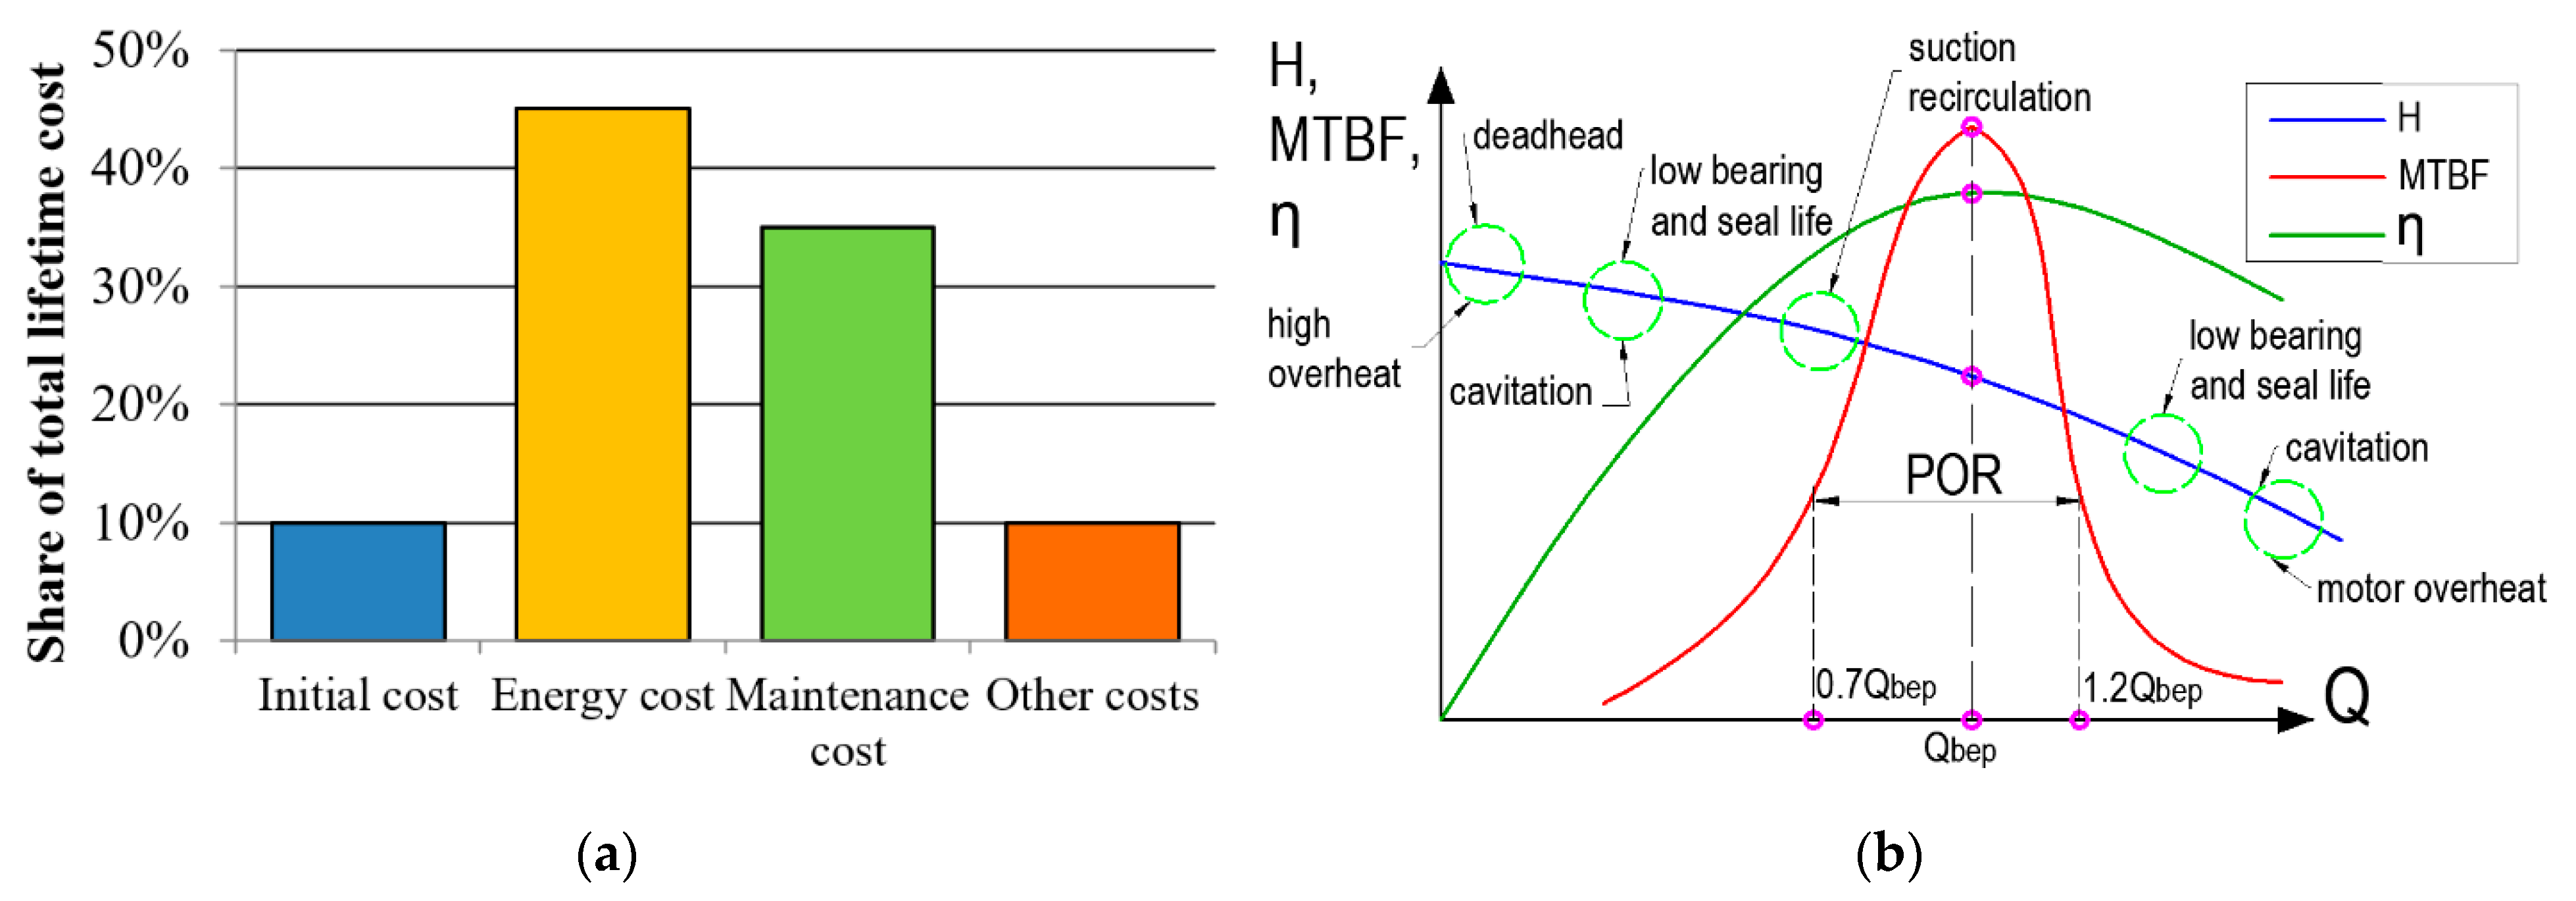
1]. Most of the life cycle cost of a pump is the cost of the electricity it consumes. Therefore, pumps are one of the most promising applications for the implementation of energy-saving technologies. At the same time, maintenance and repairs account for a significant part of the life cycle costs of a pump unit (
Figure 1a). Therefore, when optimizing the total life cycle costs, in addition to the initial cost of equipment and electricity costs, it is necessary to take into account also the costs of maintenance and repairs, which are affected by the reliability of the pump [
2]. It was shown in [
3,
4] that mean time between failure (MTBF) can be used to quantify pump reliability. In turn, MTBF depends on the deviation of the pump flow rate Q from the Best Efficiency Point (BEP,
Figure 1b) [
5,
6].
Parallel pumps are widely used in many applications, such as when high flow rates or wide flow control ranges are required. When using parallel pumps, it is possible to significantly reduce all components of the life cycle cost of a pumping station, in comparison with a single-pump unit of the same rated power [
3,
7]. At the same time, due to a large number of variable parameters and the nonlinearity of such systems, the problems of optimizing the energy consumption of parallel pumps, taking into account the reliability and cost of the life cycle, are complex and still not considered very often in the literature.
Many studies analyze the energy consumption of parallel pumps, without taking into account their reliability. Thus, in [
8], parallel operation of two pumps with the same rated head and different rated flow is investigated. It is shown that the overall efficiency of the system decreases with an increase in the ratio of the rated flow rates of individual pumps. This study compared the performance of 28 different combinations of the pumping system parameters. In [
9], parallel operation of a multi-pump system consisting of four pumps is considered, in which the flow is regulated by three different methods (throttling, bypass and speed control). A genetic algorithm and various optimization criteria were used to find the most economical control strategy. It was shown that the lowest energy consumption is achieved when the rotational speed of all pumps is simultaneously controlled at the same value. In [
10], an optimization of the total cost of systems of three parallel and three serial pumps without rotational speed control is considered, taking into account the cost of the pump, pipeline and energy consumption. In [
11], an optimization of energy consumption of a system of seven parallel pumps with various ratings, some of which are equipped with variable speed drive (VSD), is considered. In [
12], energy consumption of three parallel pumps when changing the number of VSDs is compared. In [
13], energy consumption of pumping systems with 2–4 parallel pumps without speed control is compared. In [
14], a predictive control algorithm is proposed for a system of 3 parallel pumps, each of which is equipped with a VSD, which allows, based on look-up tables, to increase the system efficiency.
Several works on parallel pumps consider not only energy consumption, but also the deviation of the pump operating points from the BEP. In [
15], an optimization of the energy consumption of a system of two parallel pumps using a genetic algorithm is considered. The results show that the lowest energy consumption of the system is obtained by equalizing the flows of the two pumps. Furthermore, [
15] compares the energy consumption of the two pumps equipped with a different number of VSD: one or two. It is shown that in the latter case, it is possible to achieve a lower energy consumption. The deviation of the operating point of the pumps from the BEP in various considered cases is compared, but not optimized.
In [
6], an optimization of a single-pump unit is considered to increase its reliability using a genetic algorithm. However, some aspects were not taken into account: the optimization criterion is only the maximum reliability of the pump unit. Achieving a trade-off between reliability and power consumption is not considered. The study also does not consider the use of bypass regulation to obtain a better operating point. The static head in the hydraulic system is assumed to be zero, which also reduces the range of cases to which the results of this study are applicable.
In [
16], a control strategy is proposed for a variable speed multi-pump system to reduce energy consumption. It was shown that the system of parallel pumps has the highest efficiency when the pumps operate at the same speed and flow rate than when one of the pumps operates at the rated speed and the speed of the other one is adjusted to obtain the required flow rate. It is also shown that in the former case, the deviation of the pump operating point from the BEP is less.
In [
17], an analysis of a single-pump unit with a power rating of 11 kW is carried out and the issues of reducing energy consumption and increasing reliability are investigated. A trade-off regulation is proposed that provides good pump reliability with the energy consumption close to the minimum. The energy consumption is calculated for three cases: the conventional rotational speed regulation, regulation with maximum reliability and trade-off regulation. It is shown that when using the trade-off regulation, it is possible to significantly reduce the energy consumption of the pump unit in comparison with the case of maximum reliability, while maintaining all pump operating points in the preferred operating range with sufficient reliability.
In [
3], an optimal trade-off control method using particle swarm optimization is proposed for a system of two identical parallel pumps, each equipped with a frequency converter (FC). The optimization parameters are the number of simultaneously operating pumps and the rotational speed of the pumps. The optimization criterion is the minimization of energy consumption. The deviation of the pump operating point from the BEP is used as an optimization constraint. It is assumed that both pumps rotate at the same speed at each operating point, and the throttle is used to regulate the flow in the common pipeline section of the parallel pumps. However, the results of this study are only applicable when the speed of both parallel pumps is controlled by VSD. Meanwhile, in practice, parallel pumping systems are often used in which some of the pumps do not have a VSD and are powered directly from the mains [
18]. The literature overview carried out shows that not all configurations of parallel pump systems have been analyzed from the point of view of reliability. In particular, multi-motor pumping stations with a single frequency converter (multi-pump single-drive systems), which are also actively used in practice to reduce the total cost of a multi-pump system, were not considered.
This paper analyzes the effectiveness of applying the trade-off regulation method proposed in [
17] to a system of 3 parallel pumps. This trade-off method is compared with the traditional regulation and regulation with maximum reliability proposed in [
3]. In contrast to [
3], a pumping system of the “multi-pump single-drive” type is considered, in which only one frequency converter is used to alternately drive several pump units (in this case, 3 units). Such systems are widely used in parallel pumping stations equipped with low-power electric motors. However, analysis of such systems is not very common in the literature [
7].
In such pumping systems, one frequency converter controls two or more pumps. At the same time, in contrast to systems without a frequency converter, a smooth start-up of each pump unit and a smooth flow/pressure adjustment are ensured. In contrast to the case where each pump unit is equipped with an individual frequency converter, the capital cost of the system is significantly reduced. This advantage is especially important if the system uses low-power pump units, for which the cost of the frequency converter is the largest part of the total cost, as well as in systems containing a large number of pumping units [
18,
19].
Since in multi-pump single-drive systems it is possible to control the rotational speed of only one pump at a time, the load range of the pumps in such a system is significantly different from the case when each of the pumps is equipped with a VSD. Therefore, the conclusions carried out in [
3] cannot be directly applied to the multi-pump single-drive systems.
Therefore, the contribution of this article is as follows: the effectiveness of the control principle, which provides a trade-off between reliability and energy efficiency, was theoretically verified in the case of a multi-pump single-drive system, which was not covered in previous studies on the topic.
It should be noted that many studies discuss the selection and setting of dynamic controllers for pumping systems [
6,
20,
21,
22,
23,
24,
25]. Several studies show the effectiveness of fractional-order proportional-integral-derivative control (FOPID) [
20] for improving the dynamics of complex non-linear pumping systems. Thus, [
21] provides a theoretical and experimental comparative study of a simple single-pump system with different types of regulators, including PI, PID and FOPID. Several papers [
22,
23] show the advantages of the FOPID over conventional PIDs in controlling pumping systems that provide liquid level in a connected tank system. Further improvement of pumping system dynamics can be achieved by adding fuzzy logic to the FOPID [
24,
25].
Our paper does not discuss the selection and setting of dynamic controllers; however, it evaluates the benefits of applying the proposed approach to the selection of operating points for pumps in a multi-pump system. The novelty of the proposed approach is that it considers both the energy efficiency of the system and its reliability. At the same time, it is assumed that a controller is used that provides a satisfactory quality of transients.
Using the traditional mathematical model of parallel pumps and polynomial interpolation of data from the manufacturer’s catalogs, the energy consumption and reliability of the considered multi-pump single-drive system using different regulation methods are compared. The conventional rotational speed regulation and the previously proposed method providing maximum reliability [
6] are considered. The benefits of using the proposed trade-off regulation method for the considered pumping system are also evaluated.
The aim of this study is to develop a regulation method that increases the reliability of multi-pump single-drive systems, in which, as will be shown below, when using the traditional control method, individual pumps can operate for a long time in conditions that shorten their service life. Reliability issues have already been discussed in detail in the literature for both single pump systems and systems of parallel pumps, each of which is equipped with a frequency converter [
3,
6,
15]. The objective of this study is a comparative analysis of a particular case of a pumping system consisting of three parallel low-power pump units, one of which is powered by a frequency converter and the other two are powered directly from the grid, using different control methods.
2. Mathematical Equations of the System and Methodology of the Study
The article uses the traditional analytical method of mathematical analysis of pumping systems, based on the calculation of
Q-H (head versus flow) and
Q-P (mechanical shaft power versus flow) characteristics, to analyze the performance of the pumping system with various regulation methods. The characteristics corresponding to the rated rotational speed are interpolated using polynomials according to the pump datasheet. The characteristics at the arbitrary rotational speed are calculated using the characteristics at the rated speed and the affinity laws [
26]. This study examines the change in energy consumption of the considered multi-pump single drive system when applying to it various restrictions on the deviation of its operating points from the BEP curve which is also the maximum reliability curve.
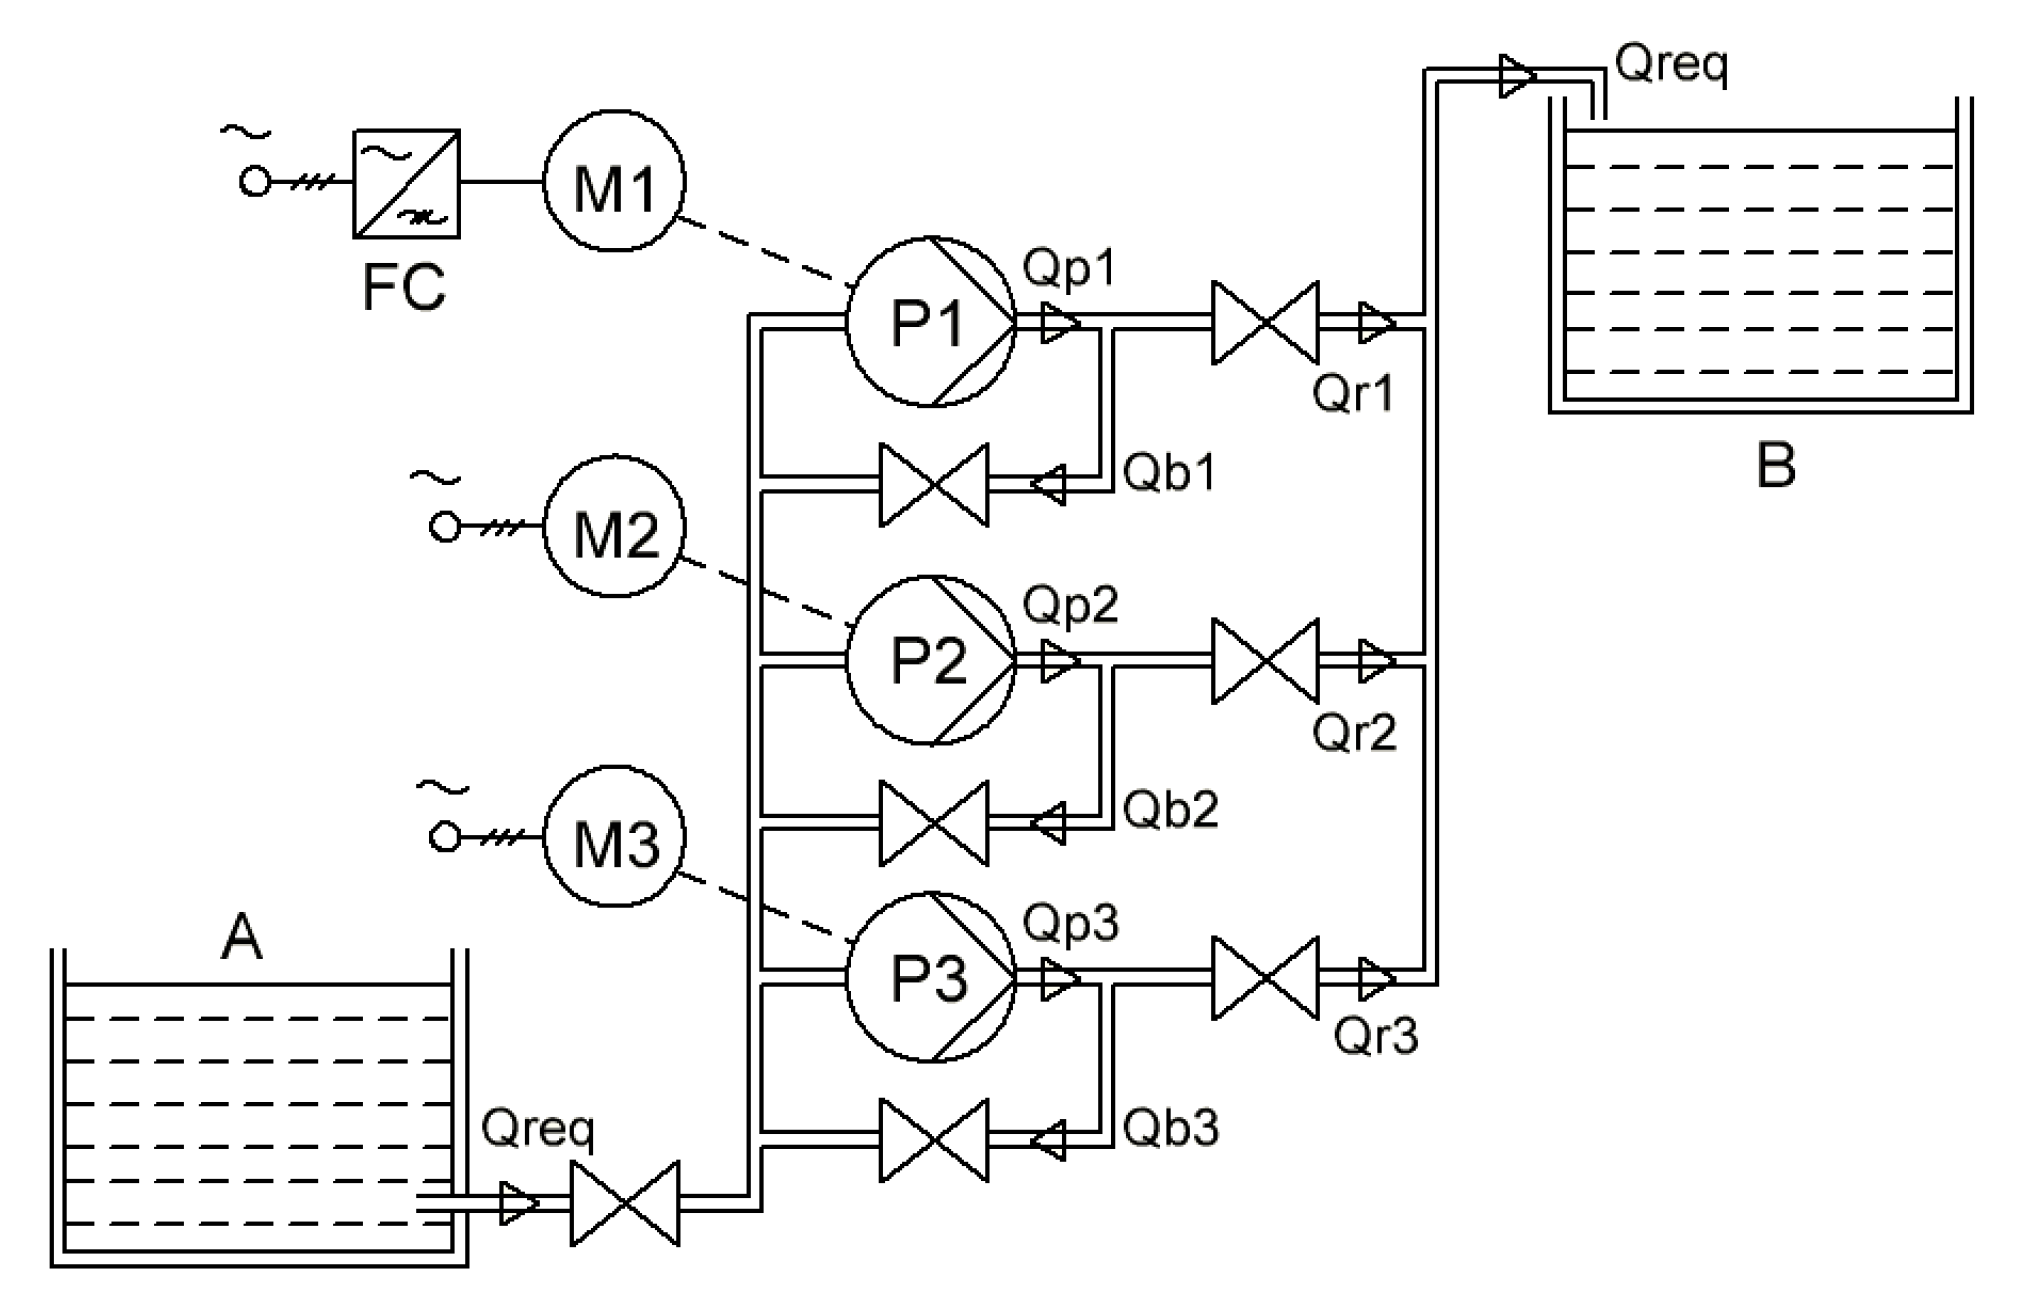
The parallel pump system serves to provide the required flow rate
Qreq with a constant static head
Hst in an open hydraulic system from point
A to point
B (
Figure 2) [
26].
Depending on the geometric dimensions of the pipelines (length, section, shape, etc.), the physical properties of the pumped liquid (density, viscosity, etc.) and the difference in heights of the basins
A and
B, a curve of the hydraulic system is constructed, which is described by the Equation (1) [
26]:
where
HREQ is the required hydraulic head;
HST is the static head;
k is the hydraulic friction coefficient.
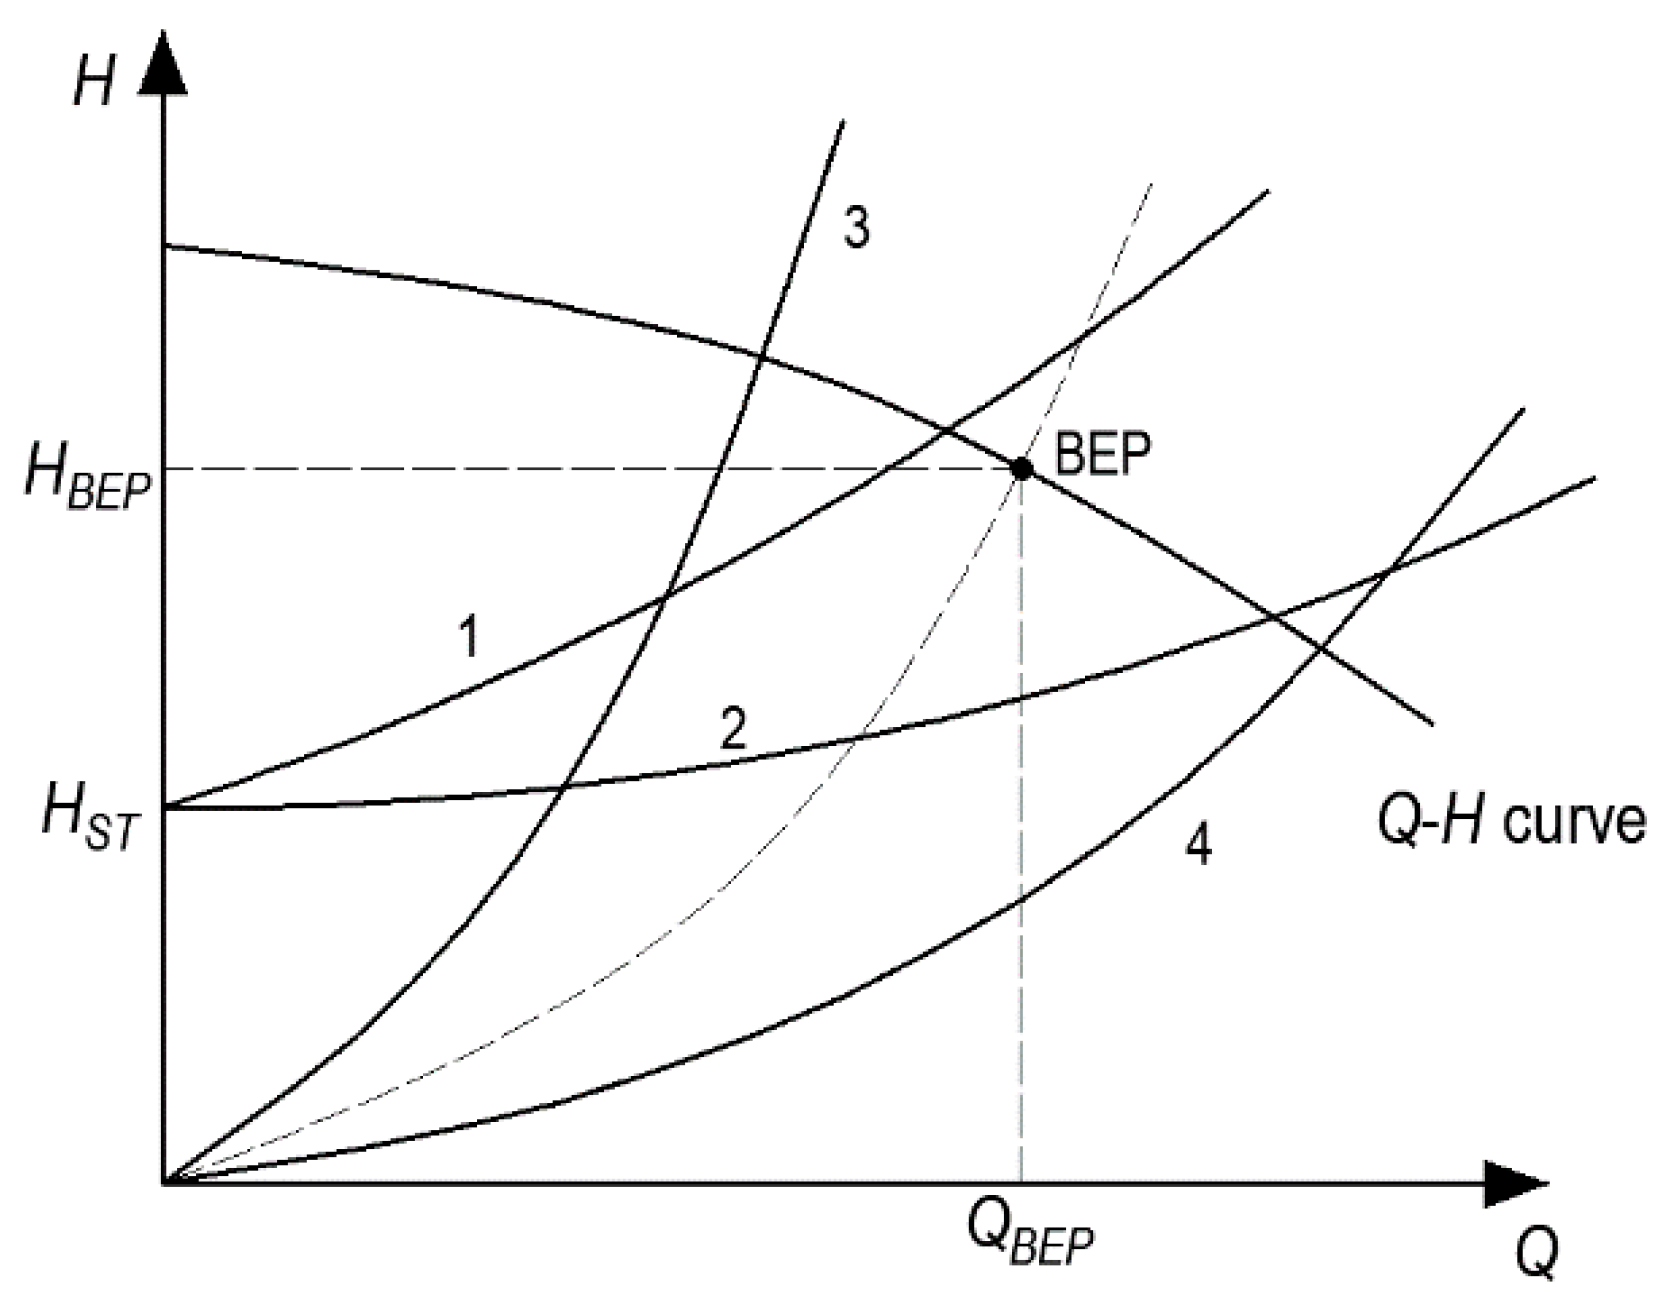
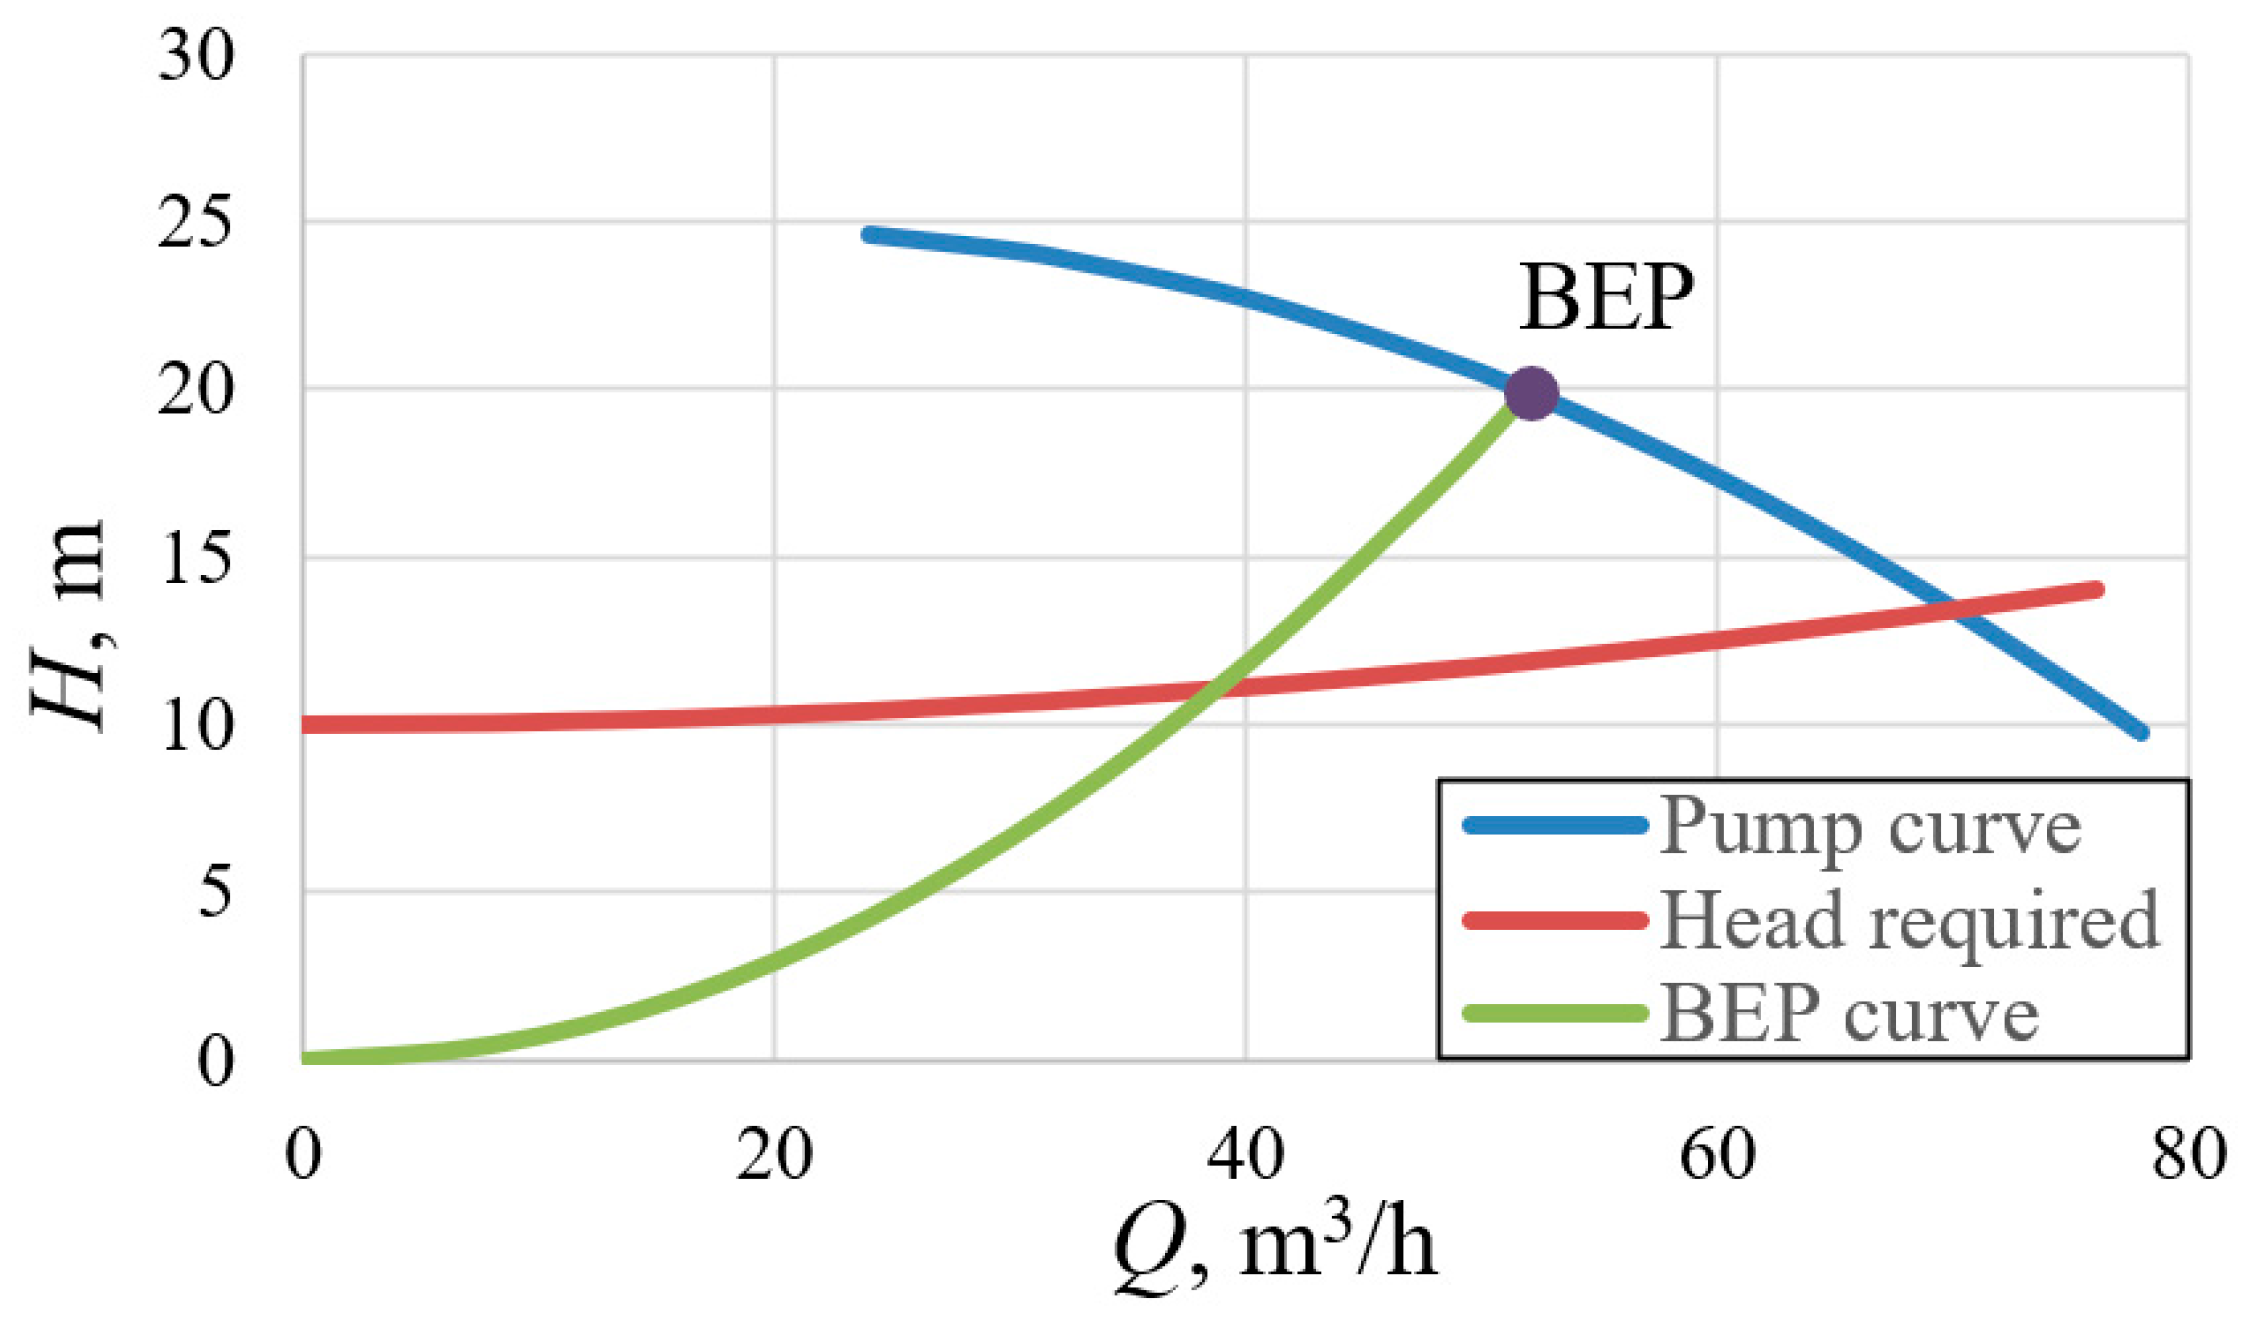
Figure 3 shows the various characteristics of the hydraulic system. Curves labeled with 1 and 2 are the curves of the system at a non-zero value of the static head
HST at different values of
k. Numbers 3 and 4 mark the curves of the hydraulic system, at different values of
k and
HST = 0. Number 5 marks the dashed curve on which the BEP points lie at different pump speed (BEP curve). The maximum reliability and maximum efficiency of the pump are reached when the system curve matches the BEP curve (dashed curve 5 in
Figure 3). The BEP curve is defined according to the affinity laws by the following equation [
3]:
where
QBEP and
HBEP are the flow and the head of the pump at the BEP with
n =
nrate;
kBEP =
HBEP/QBEP.
QBEP and
HBEP are defined according to the pump datasheet.
The selection of the pump unit is carried out based on the maximum values of the required flow rate and head.
In practice, however, they do not match, and the pump operating point may be far from the BEP curve. Therefore, depending on the parameters of the hydraulic load curve (1), it is necessary to shift the pump operating point closer to the BEP curve to increase the pump reliability.
If the hydraulic system curve is located to the right of the BEP curve (as curve 4 in
Figure 3), then to increase the pump reliability, it is necessary to regulate the water flow by adjusting the rotational speed and throttling [
6]. If the hydraulic system curve is located to the left of the BEP curve (as curve 3 in
Figure 3), then bypass also must be applied. However, the use of throttling and bypass along with the regulation of the pump rotational speed leads to additional energy consumption.
This study considers a hydraulic system with a curve like curve 2 in
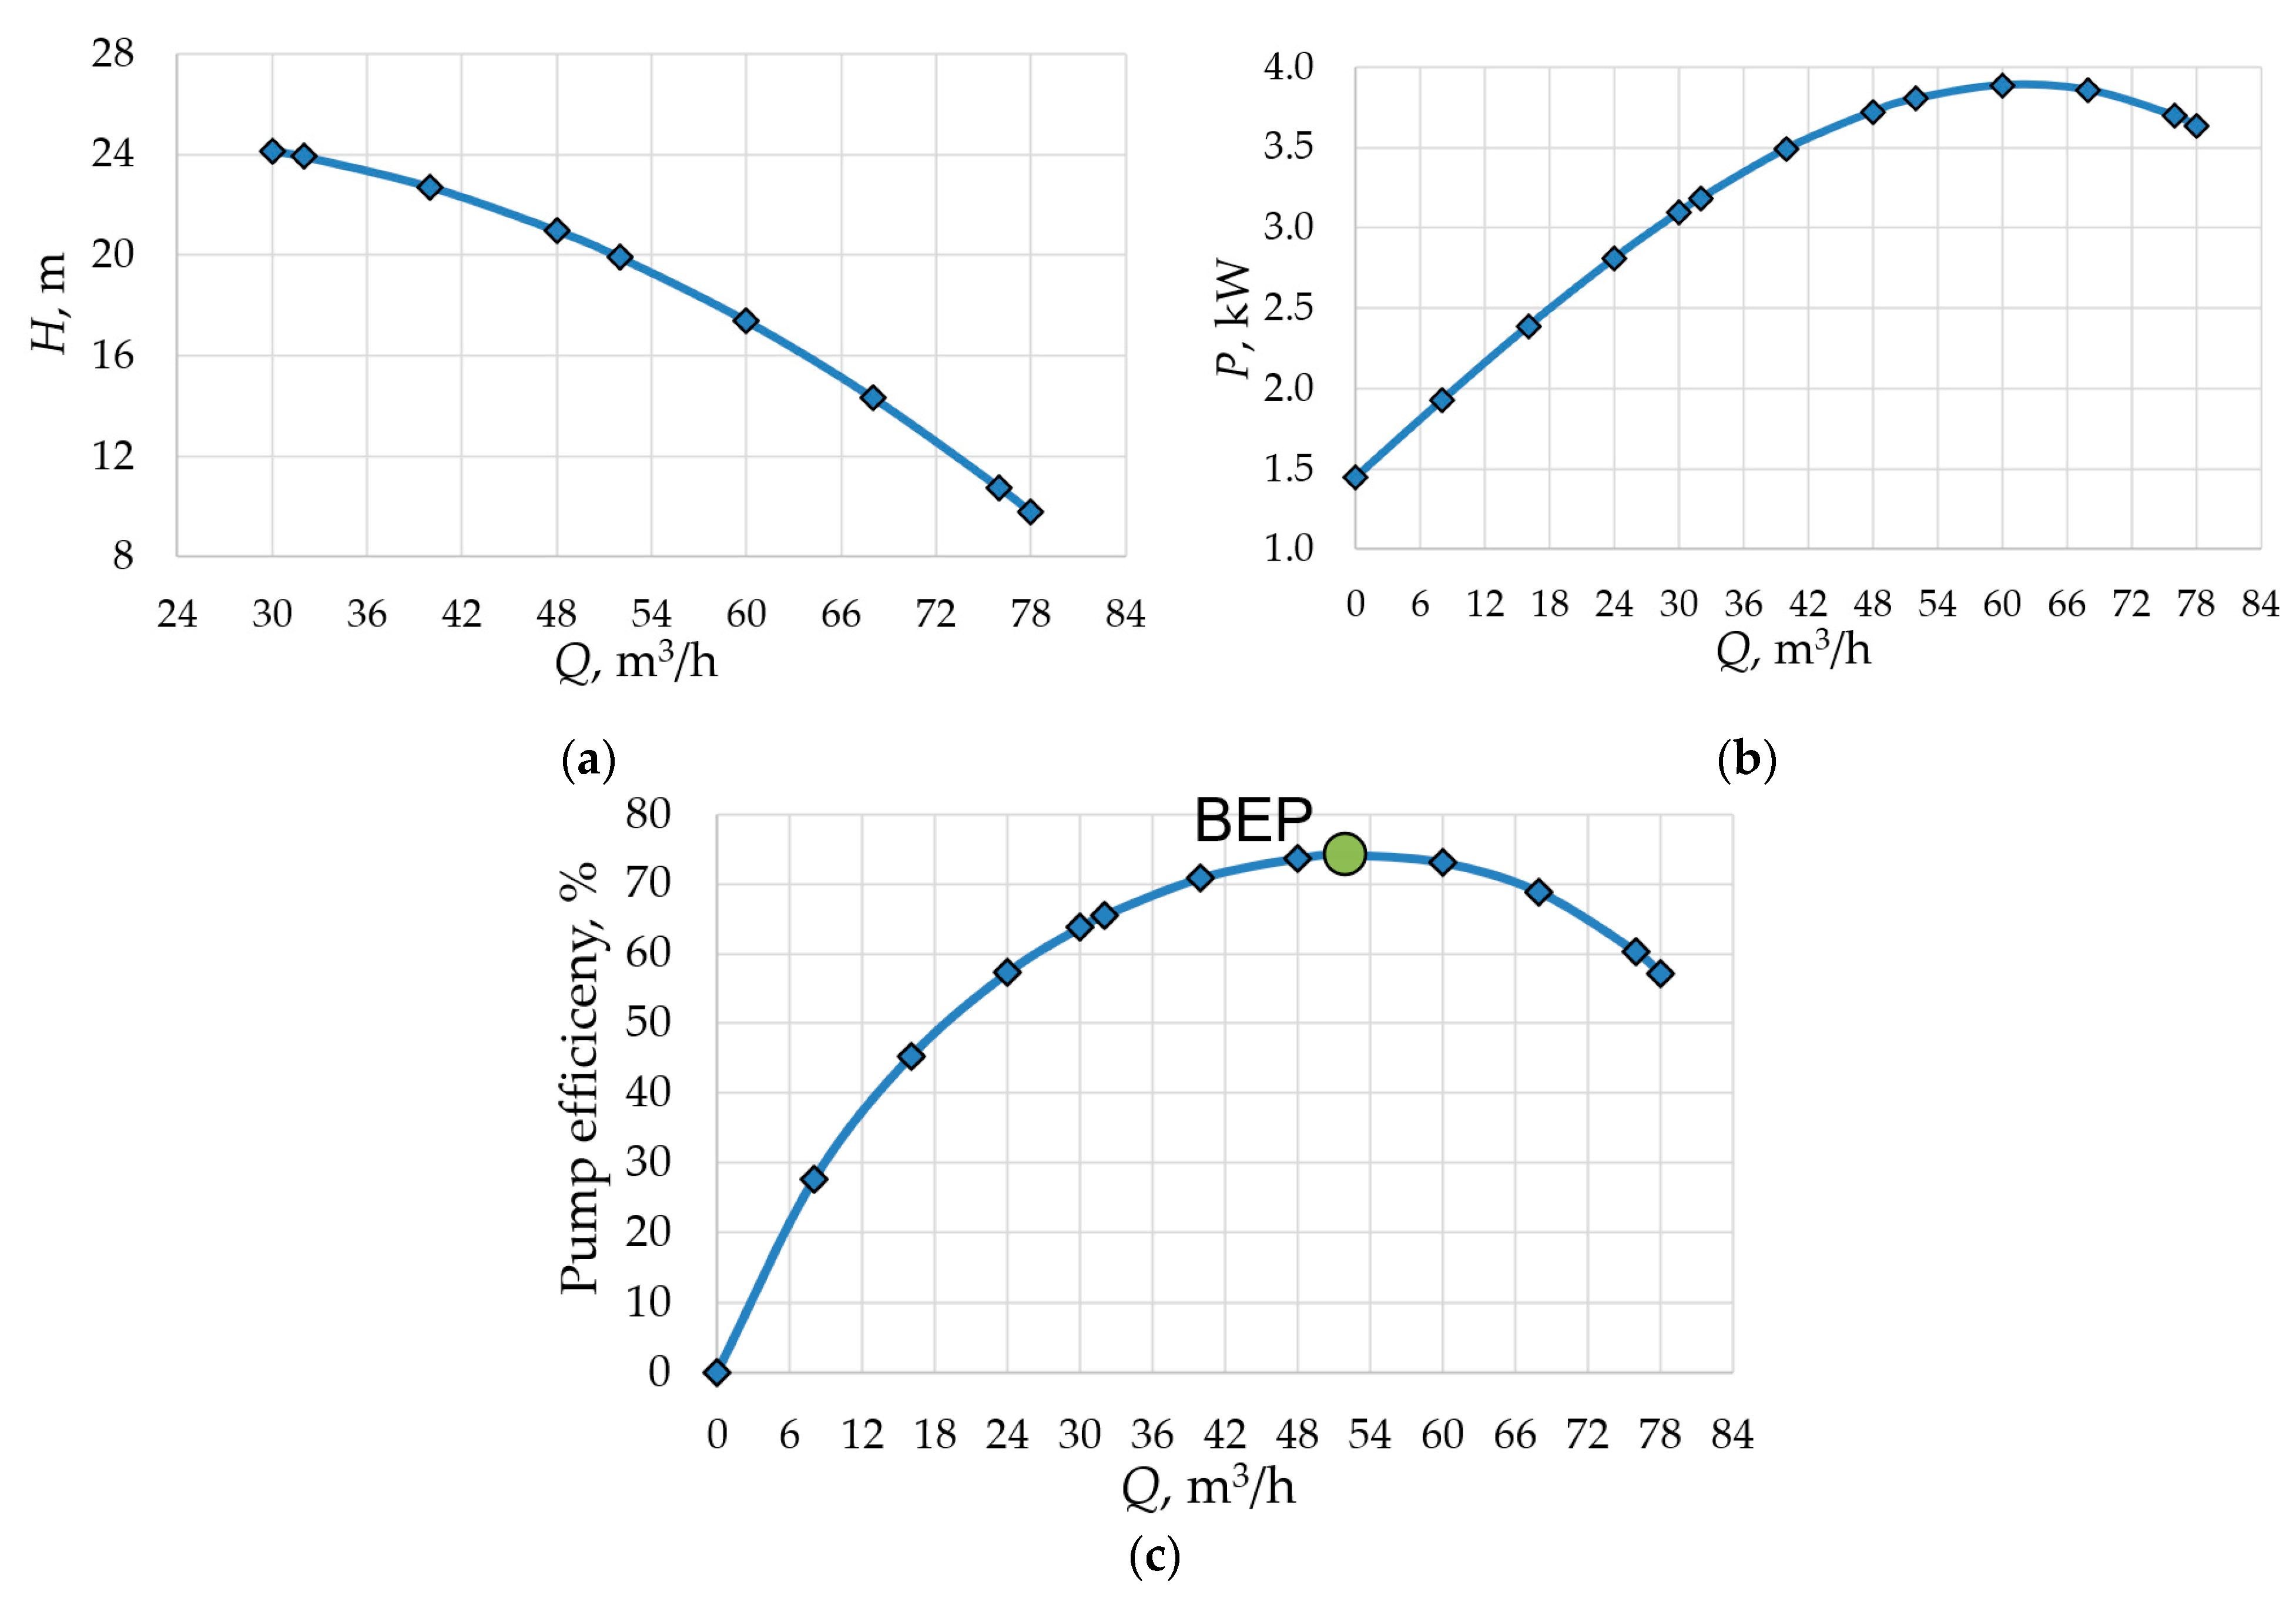
Figure 3. With this relationship between the system curve and the BEP curve, for maximum reliability, it is necessary to regulate the water flow by bypassing and throttling along with speed variation. It is assumed that in the considered parallel system centrifugal monoblock pumps Calpeda-B-50/12A with a power rating of 4 kW and a rated rotational speed of 2900 rpm are used.
Table 1 and
Figure 4 show the catalogue characteristics of this pump [
27].
The maximum required flow rate of the pumping system is
Qmax = 120 m
3/h. To simplify calculations, the
Q-H pump characteristic and characteristic of the pump required mechanical power
P =
f (
Q, s) are interpolated as polynomials with two variables of the 2nd and 3rd order, respectively [
10]:
where
s = n/nrate is the relative rotational speed;
a = −0.0012,
b = 0.166,
c = 21.505,
c0 = −0.0047,
c1 = −0.053,
c2 = 60.76,
c3 = 1449 are the coefficients of Equations (3) and (4).
Figure 5 shows the pump
H-Q curve at the rated speed (
nrate), the hydraulic system curve and the BEP curve. The BEP curve is defined according to Equation (2).
3. Calculation of Characteristics of the Pumping System at Different Methods of Regulation
This section describes the results of calculating the characteristics of the pumping system under consideration with three considered regulation methods: maximum efficiency, maximum reliability and trade-off.
Due to the wide range of variation in water flow and head in a real pumping system, the pump operating point is very rarely near the BEP. However, to ensure an acceptable service life, the pump operating point must be in the so-called preferred operating region (POR). According to [
5], the POR is located between the points 0.7∙
QBEP and 1.2∙
QBEP on the
Q-H characteristic. This condition can be considered as a constraint when regulating the pumping system. Therefore, this paper compares the energy consumption of the pumping system in three cases:
- (1)
maximum efficiency (minimum power consumption) regulation, without applying any reliability constraints. In this case, the flow rate is regulated by changing only the rotational speed of the regulated (first) pump and throttling of the unregulated (second and third) pumps. When two and three pumps operate together, an equal distribution of the flow rate between them is achieved. In this case, energy consumption is minimized, but at the same time not all pump operating points are in the POR [
6].
- (2)
maximum reliability regulation. In this case, the flow rate is regulated by changing the rotation speed of the first pump, throttling and bypass regulation of all three pumps. With this regulation, the operation of all turned-on pumps is achieved at points with maximum reliability. Due to the use of throttling and bypass, the energy consumption of the pumping system increases in comparison with the first case.
- (3)
trade-off regulation taking into account the POR reliability constraint. Flow rate is regulated by changing the rotation speed of the first pump, throttling and bypass the regulation of all three pumps. With this regulation, the operation of all turned-on pumps is achieved at operating points in the range from 0.7∙QBEP to 1.2∙QBEP in the entire required control range.
In all three considered cases, when the flow rate changes from 0% to 40%, only the regulated pump runs, then the second (unregulated) pump turns on. When the flow rate reaches 80%, the third (unregulated) pump also turns on.
The rest of this section describes the results of calculating the pump operating points for each of the considered regulation methods.
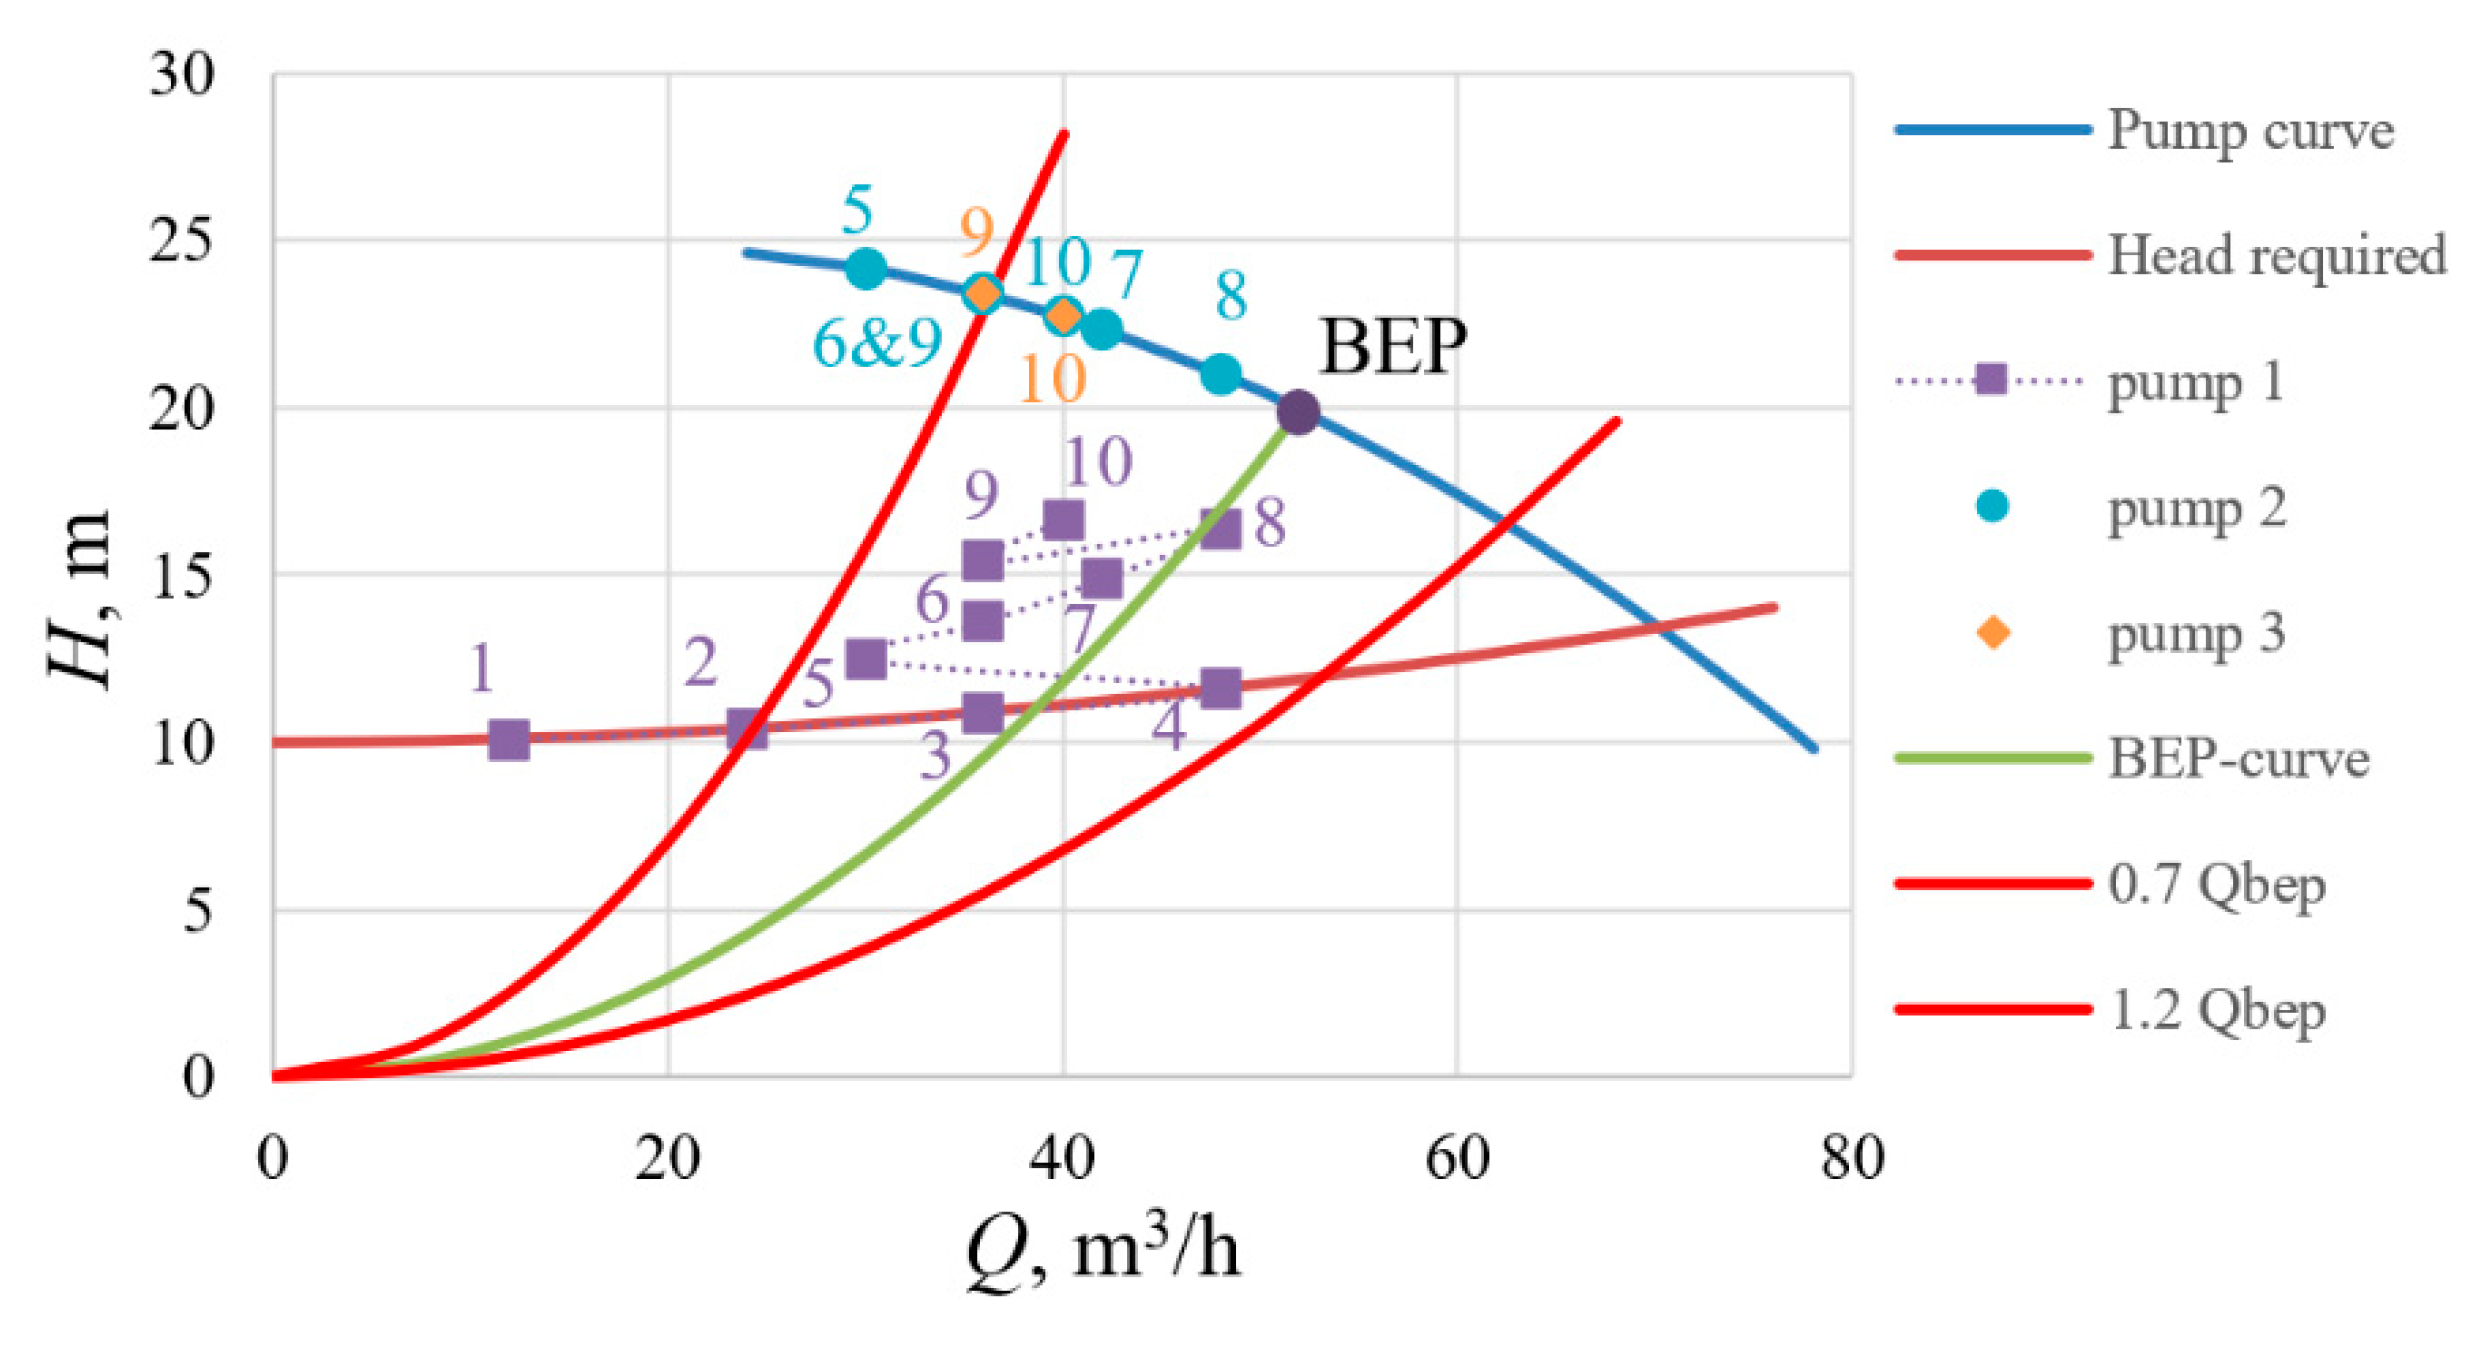
3.1. Characteristics of the Pumping System with the Maximum Efficiency Regulation (Conventional Speed Regulation)
The rotational speed of the first pump in the parallel system can be adjusted. The speeds of the second and third pumps running in parallel are not adjusted. With this control, the operating points of the variable speed pump are along the hydraulic load curve (“head required” curve) and the operating points of the fixed speed pumps are along the catalog
Q-H curve (
Figure 6).
The characteristics of the pumps when using this regulation method are determined as follows. The head of the variable speed pump
H1 =
HREQ is determined by Equation (1), the head of the unregulated pumps is determined by Equation (3), the pump mechanical power
P is determined by Equation (4). The rotational speed of the variable speed pump
n is determined by Equation (5) [
7], the pump efficiency is determined by Equation (6) and the deviation of the operating point from the BEP is determined by the Equation (7):
where
g = 9.81 m/s
2 is the gravitational acceleration; ρ = 1000 kg/m
3 is the water density;
Qi and
Hi are the flow and the head of
j-th pump; η
j and θ
j are the efficiency and the operating poit deviation of
j-th pump;
j = 1 … 3;
QBEP =
f(n) is the flow of the pump at BEP according the BEP curve Equation (2);
a,
b and
c are coefficients from Equation (3).
Table 2 shows the calculation results for flow rate in the range from 10% to 100% of the maximum flow rate
Qmax = 120 m
3/h. In
Table 2 and below the following characteristics of pumps 1–3 are indicated:
Q1 … Q3 are their flow rates;
Qreq =
Q1 +
Q2 +
Q3;
H1 … H3 are their hydraulic heads;
P1 … P3 are their mechanical powers;
n1 … n3 are their rotational speeds; PΣ =
P1 +
P2 +
P3; η
1–η
3 are their efficiencies; θ
1 … θ
3 are the deviations of the operating point of the pumps. From
Figure 6 and
Table 2, it can be seen that the estimated deviations θ exceed 30.8% and reach 63.9%, which are outside the POR in
Table 2.
Such points with the large deviations occur at all stages of the flow regulation: when the required water flow is less than 20% of the
Qmax (when only the first pump is running), at the flow rate in the range of 50–80% (the second pump turns on), and also when the flow rate is more than 80% (the third pump turns on). If the flow rate is below 0.7∙
QBEP pump operation may become unstable due to the flatness of the
Q-H curve: a small deviation in the rotational speed leads to a large deviation in the flowrate. In addition, due to the unstable shape of the
Q-H characteristic, the latter intersects the hydraulic system curve in two points which leads to the occurrence of a surge. In this case, the pump operates alternately in different operating points, the whole system is unstable, the loading on the pump changes and hydraulic shocks occur [
28,
29].
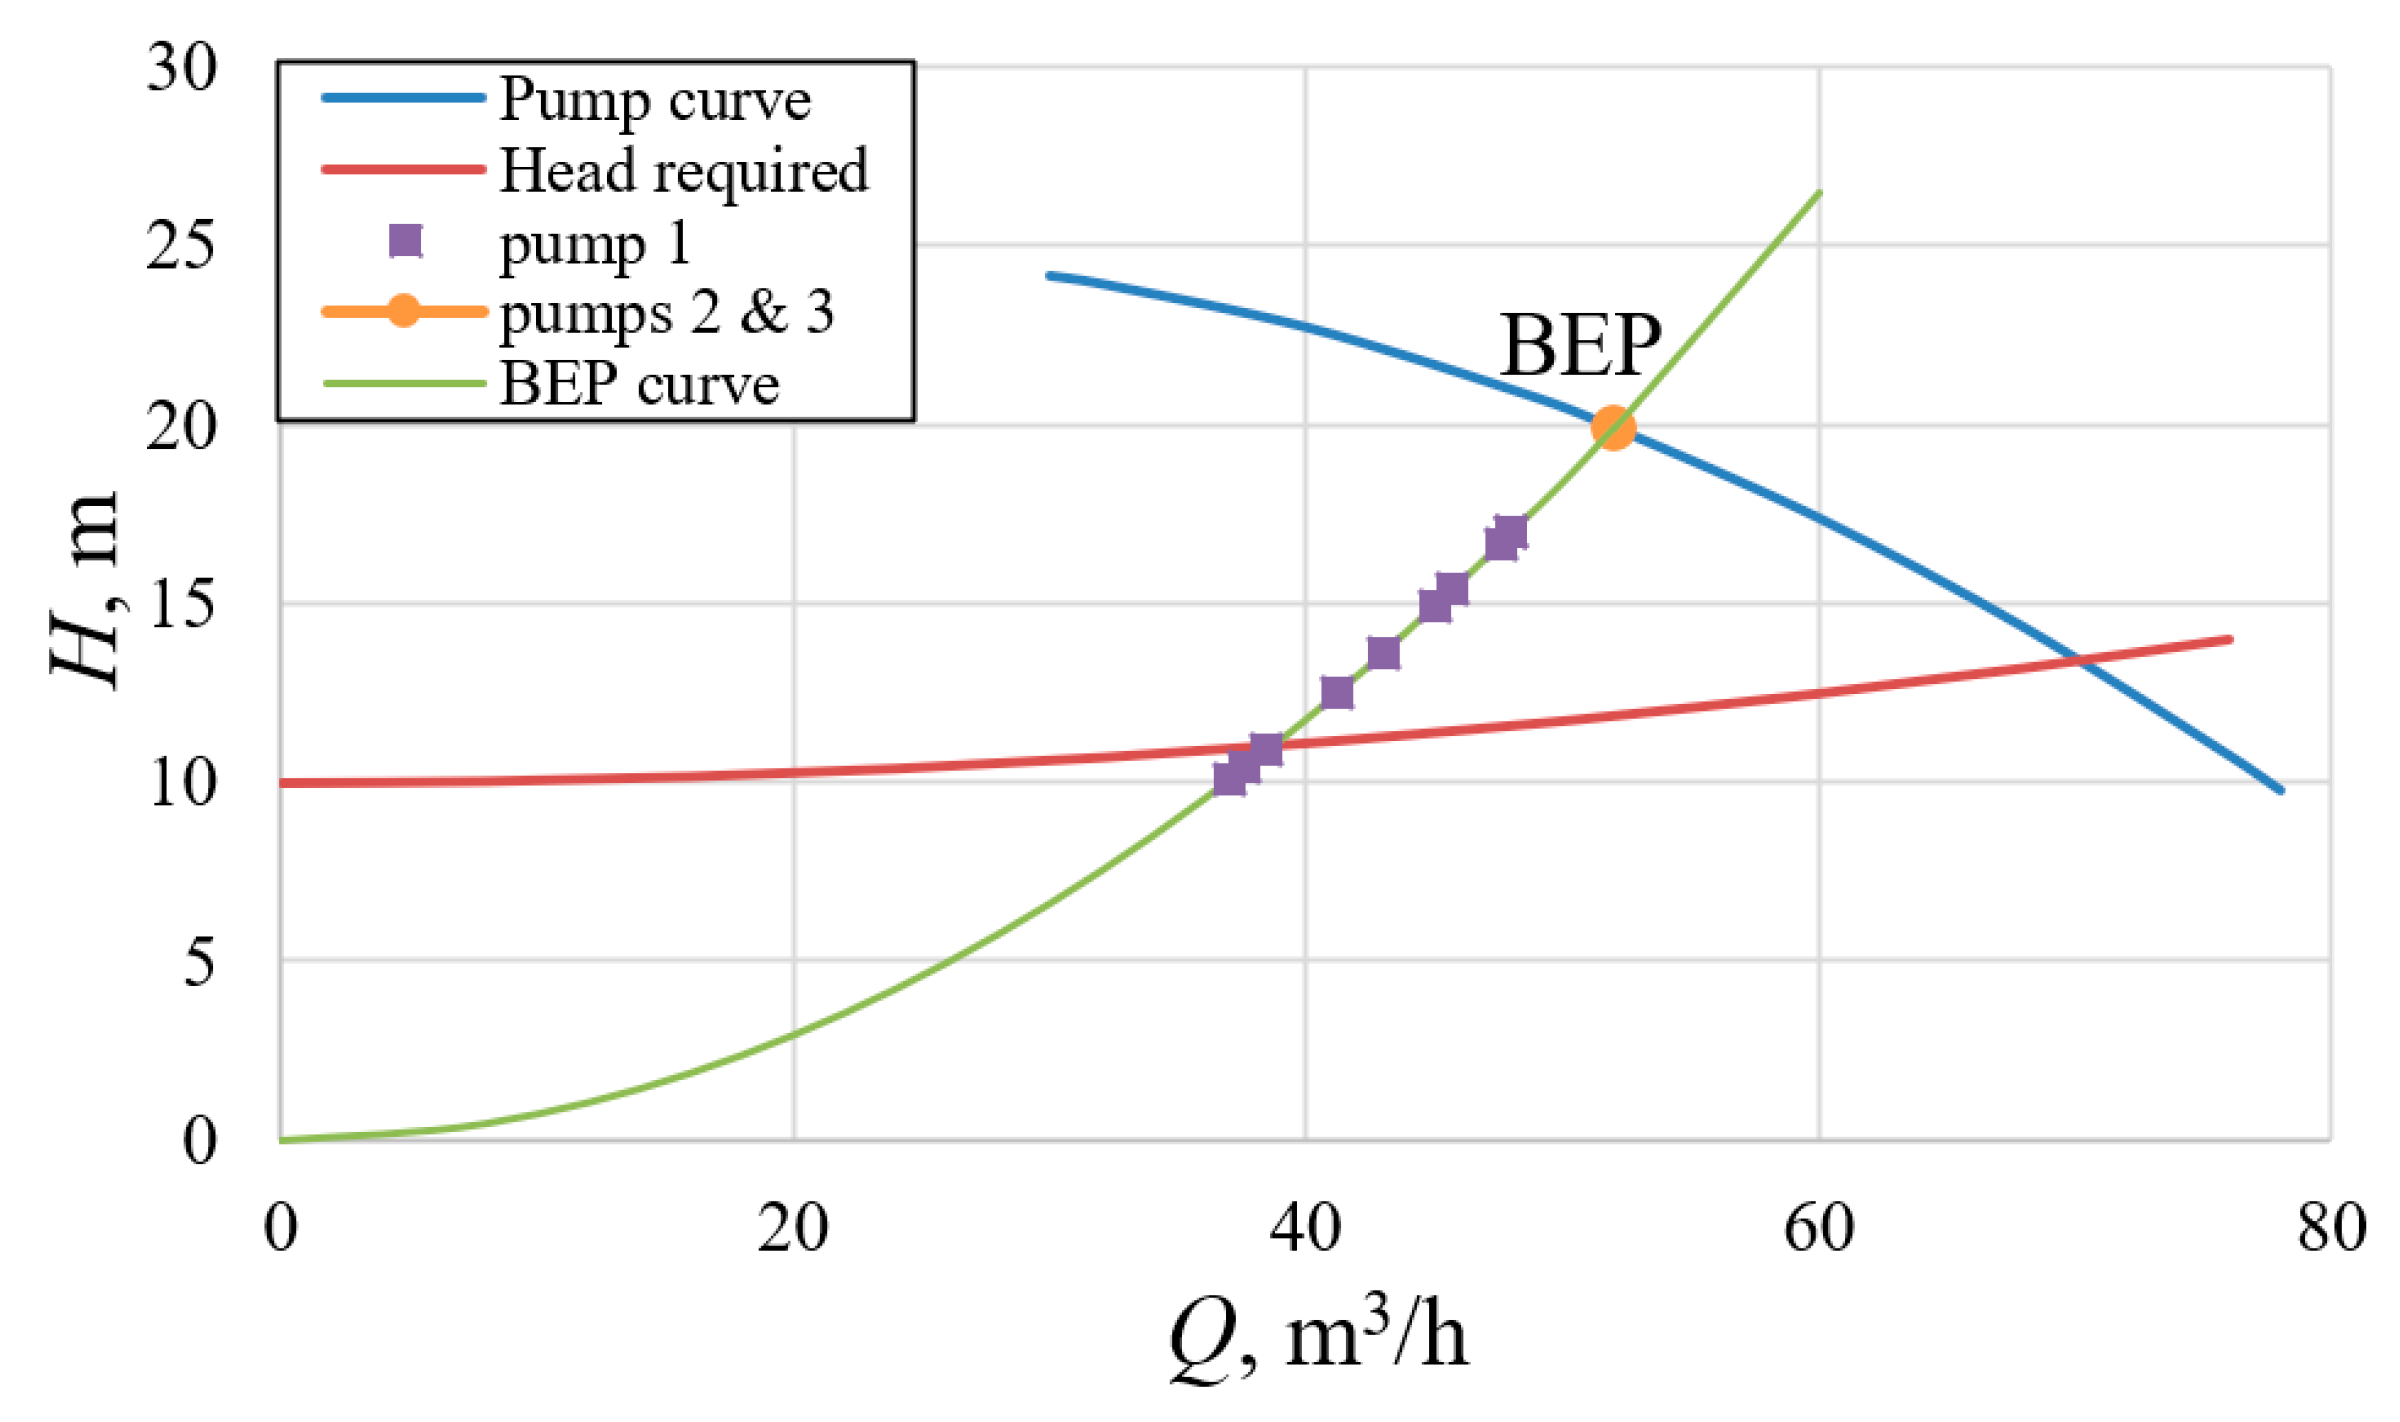
3.2. Characteristics of the Pumping System with the Maximum Reliability Regulation
For maximum pump reliability, the operating points of the variable speed pump must be on the BEP curve (dashed line in
Figure 3), and fixed-speed pumps must always run at the BEP point on the catalog pump
Q-H curve, regardless of the required flow rate. This can only be achieved by using all three of the above-mentioned water flow regulation methods together.
As shown in
Figure 6, variable speed pump operating points 1–3, 5–7 and 9–10 are located to the left of the BEP curve. To implement the condition of maximum reliability, these points are to move horizontally until they coincide with the BEP curve. All operating points of the fixed-speed pumps are also located to the left of the BEP curve. They need to be moved along the catalog
Q-H curve up to the BEP. This means that the pump flow rate
Qi will increase from
Qi’ to
QBEP at the same head. Excess flow
Qi −
Qi’ flows back through the bypass to the suction pipe, where. In this case
Qreq =
Q1′ +
Q2′ +
Q3′.Points 4 and 5 are located to the right of the BEP curve. To move these points up to the BEP curve, at a constant flow rate
Qreq, the head at the pump outlet must be increased by throttling (
Figure 7).
The required head
Hreq is determined by the Equation (1).
Hreq is the same for all switched on pumps as they operate in parallel. The flow Q
j and the head
H j are determined by Equation (8) when regulating the bypass together with speed regulation or by Equation (9) when regulating only the pump rotational speed. The rest of the parameters are determined in the same way as in the previous section:
where
Qreq and
Hreq are the required output flow and head; Q
j and H
j are the flow and head of
j-th pump.
Table 3 shows the calculated characteristics of the pump system with the maximum reliability regulation. As the results in
Figure 7 in
Table 3 show, when the throttling and bypass are used in combination with the speed control, the maximum pump reliability can be achieved. Operating point deviation θ is zero.
The pump efficiency throughout the entire flow regulation range remains at its maximum (74.2%). However, power consumption increases compared to the conventional speed regulation due to the increase in QPUMP when using the bypass and the increase in HPUMP when using the throttling.
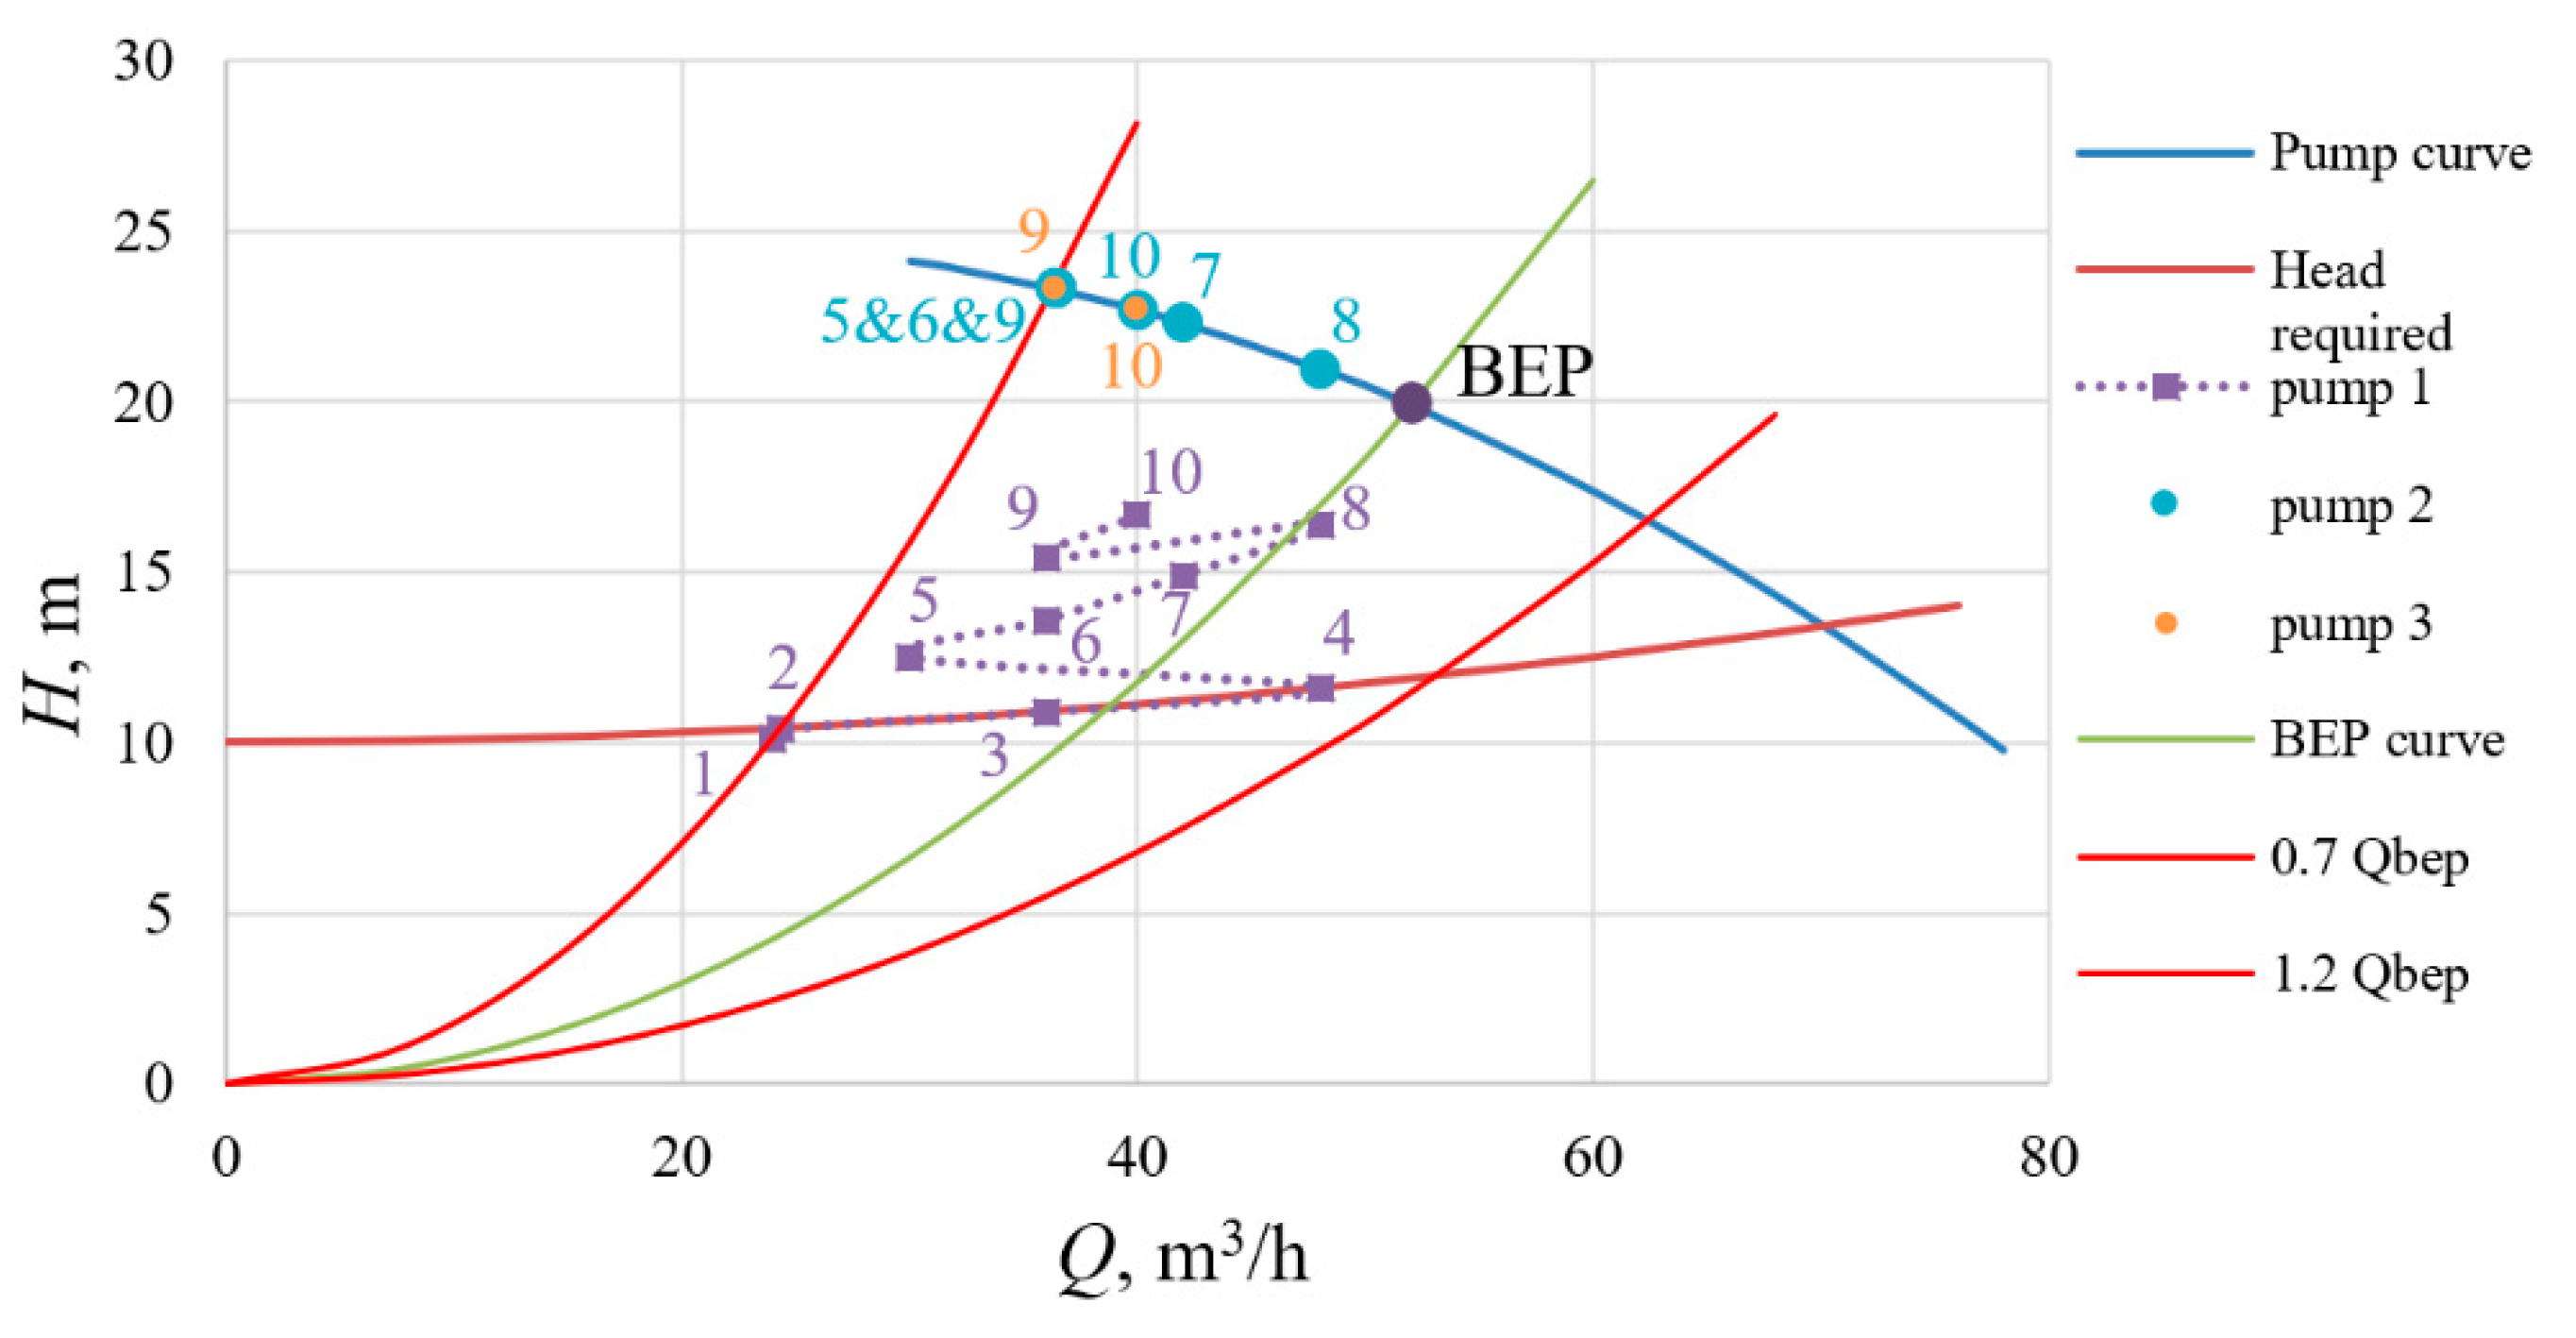
3.3. Characteristics of the Pumping System with the Trade-Off Regulation
It is also possible to apply a trade-off regulation method to reduce energy consumption and, at the same time, reach sufficiently high reliability. To achieve this, it is necessary to ensure that all pump operating points are located within the POR. According to
Figure 6, when using only the speed control, points 1, 2 of the first regulated pump, points 5, 6 of the second pump and point 9 of the third pump are outside of the POR.
In this case, as in the case of the maximum reliability regulation, points 1, 2 of the first pump are moved horizontally but only to the right to the border of the POR (1.2·
QBEP line) using a bypass (
Figure 8). Furthermore, points 5, 6 of the second pump and point 9 of the third pump move along the
Q-H-curve to the left border of the POR (0.7·
QBEP line). Thus, all operating points are restricted by the POR. As in the previous case,
Hreq is the same for all switched on pumps as they operate in parallel and
Qreq =
Q1′ +
Q2′ +
Q3′. This ensures high reliability and low power consumption. Throttling is not applied in this case. The characteristics of pumps with the trade-off regulation are determined as follows. The required head of the variable speed pump
Hreq is determined using Equation (1).
The flow through the pump
Qj and the head
Hj are determined by Equation (10) with bypass regulation. The rest of the parameters are determined in the same way as in the case of the conventional speed regulation:
where
k0.7BEP =
H(0.7∙
QBEP)/(0.7∙
QBEP).
Table 4 and
Figure 8 show the calculated characteristics of the pump system applying the proposed trade-off regulation. As the results in
Table 4 show, with the proposed trade-off regulation method, the efficiency of the pumps in the entire range of the flow control is not less than 68.8%. The flow deviation θ of the operating points from the BEP is no more than 30%, and the energy consumption is reduced compared to the maximum reliability regulation method.
4. Comparison of Energy Consumption and Reliability of the Parallel System with Different Regulation Methods
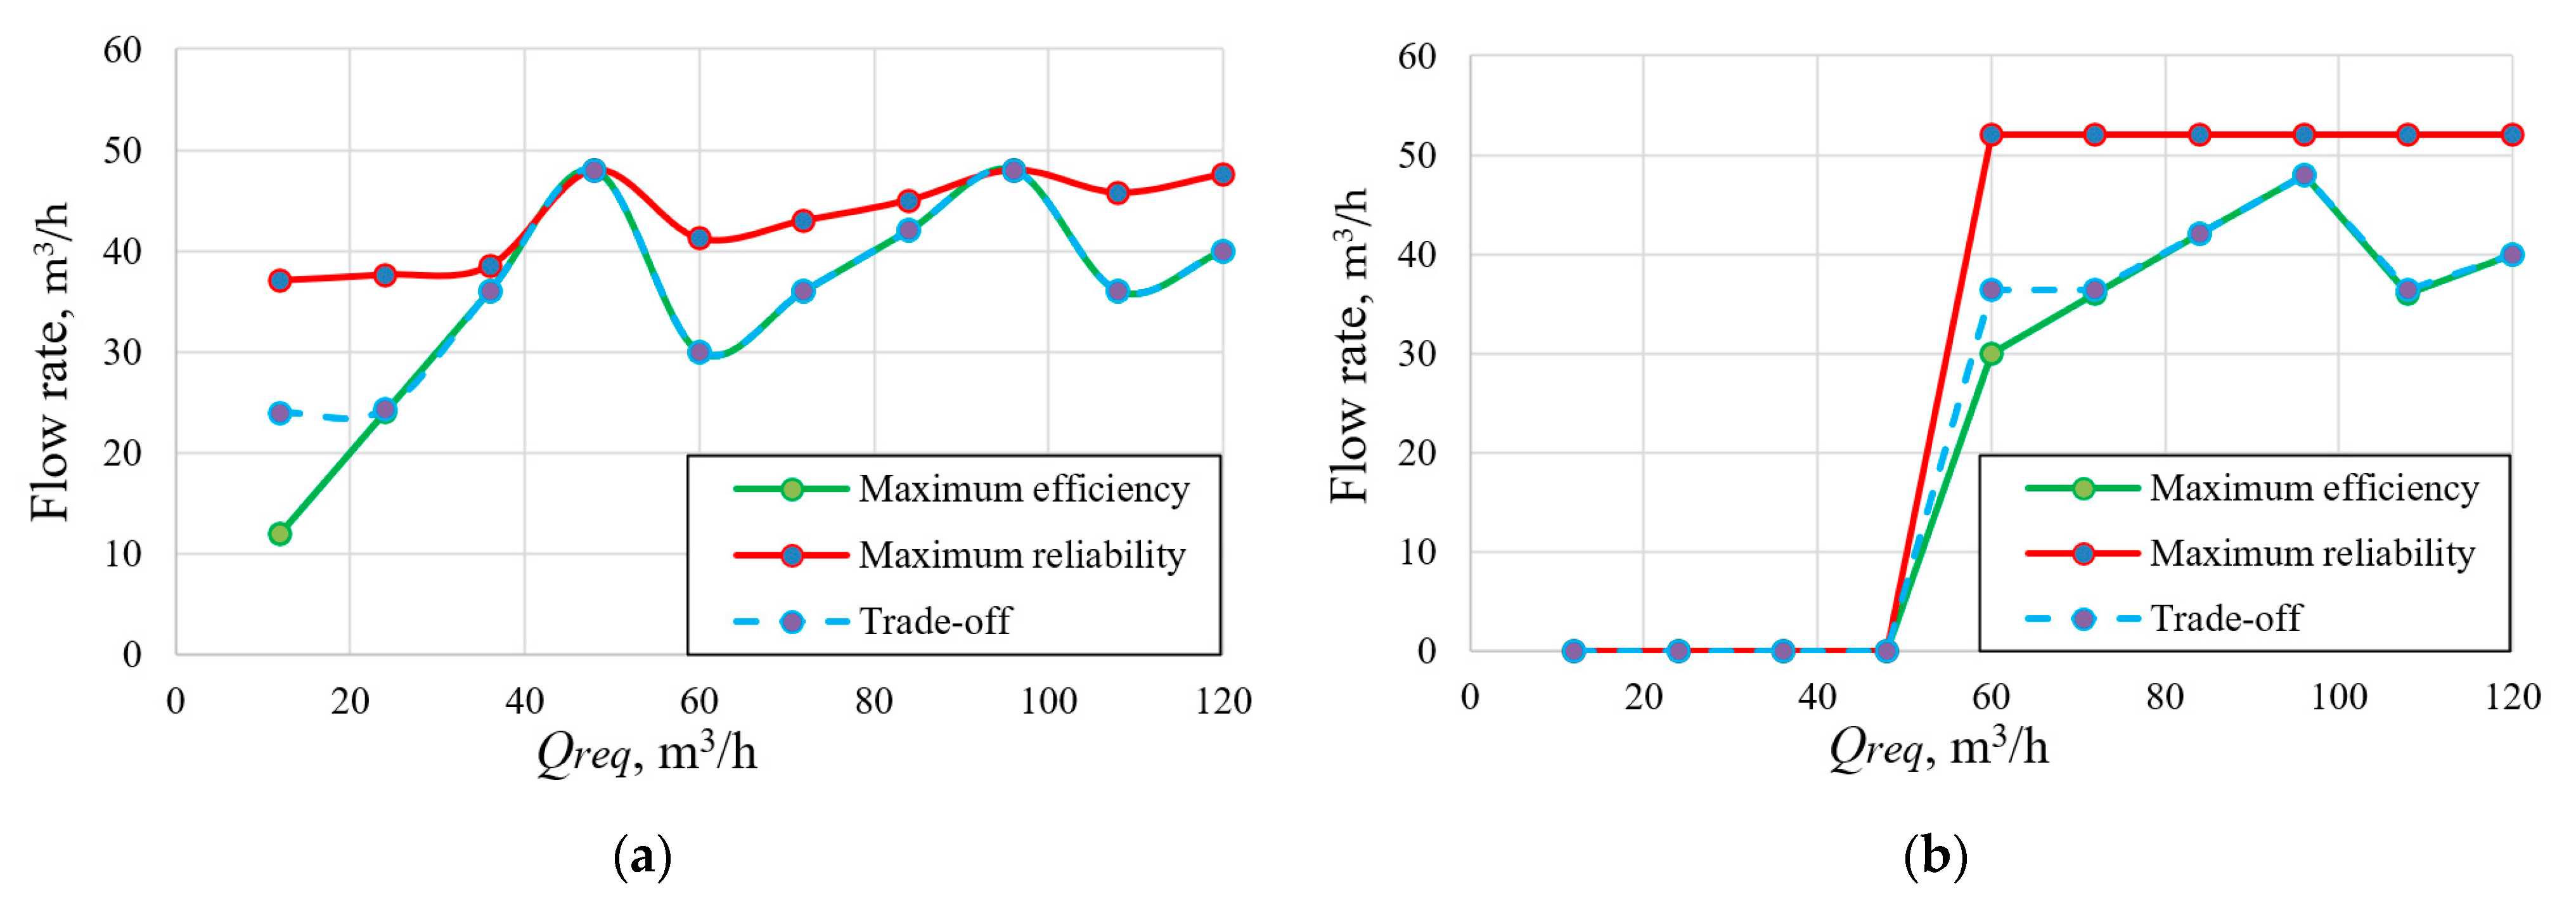
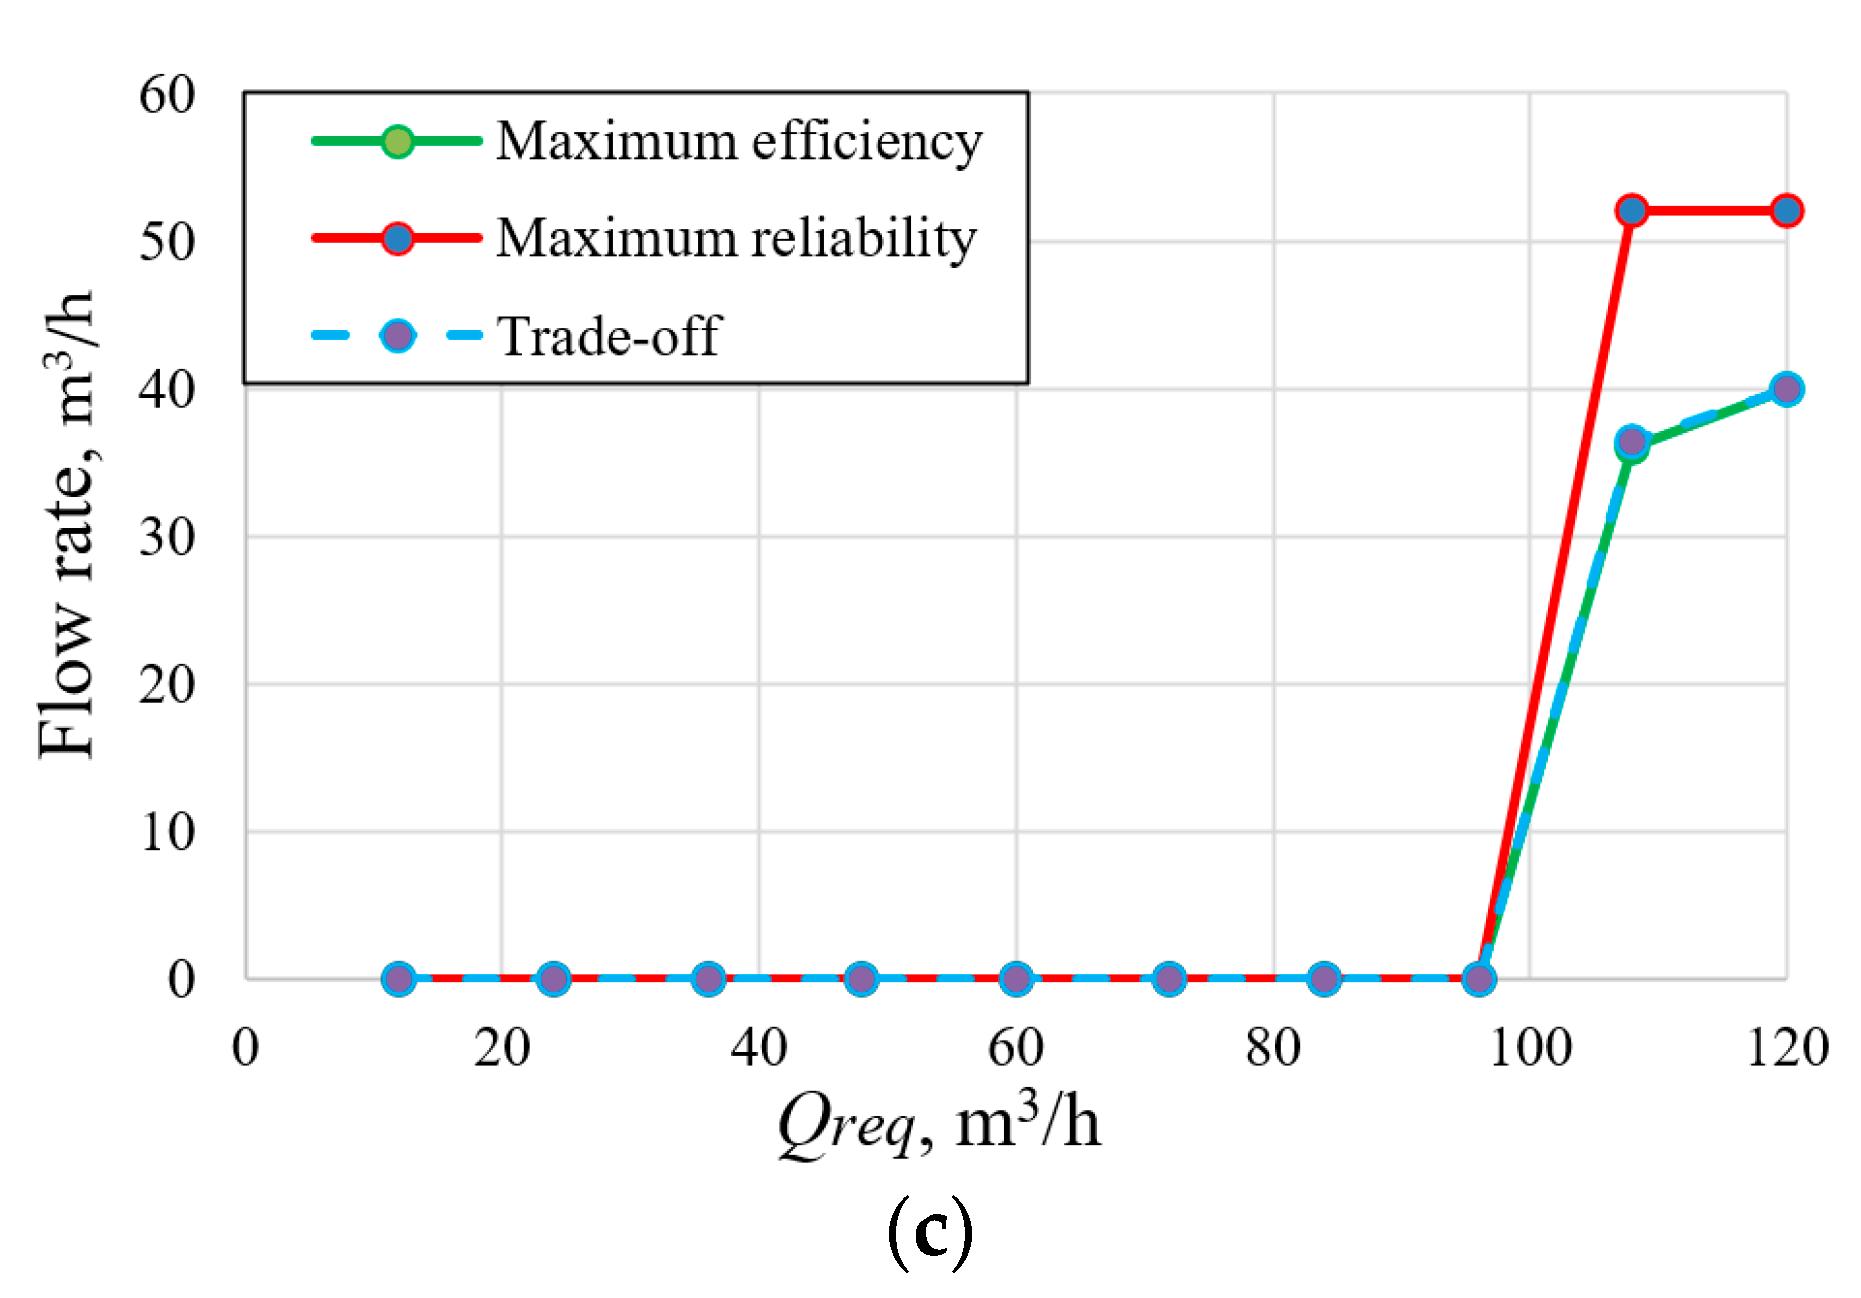
Figure 9,
Figure 10,
Figure 11 and
Figure 12 summarize the results of
Table 2,
Table 3 and
Table 4.
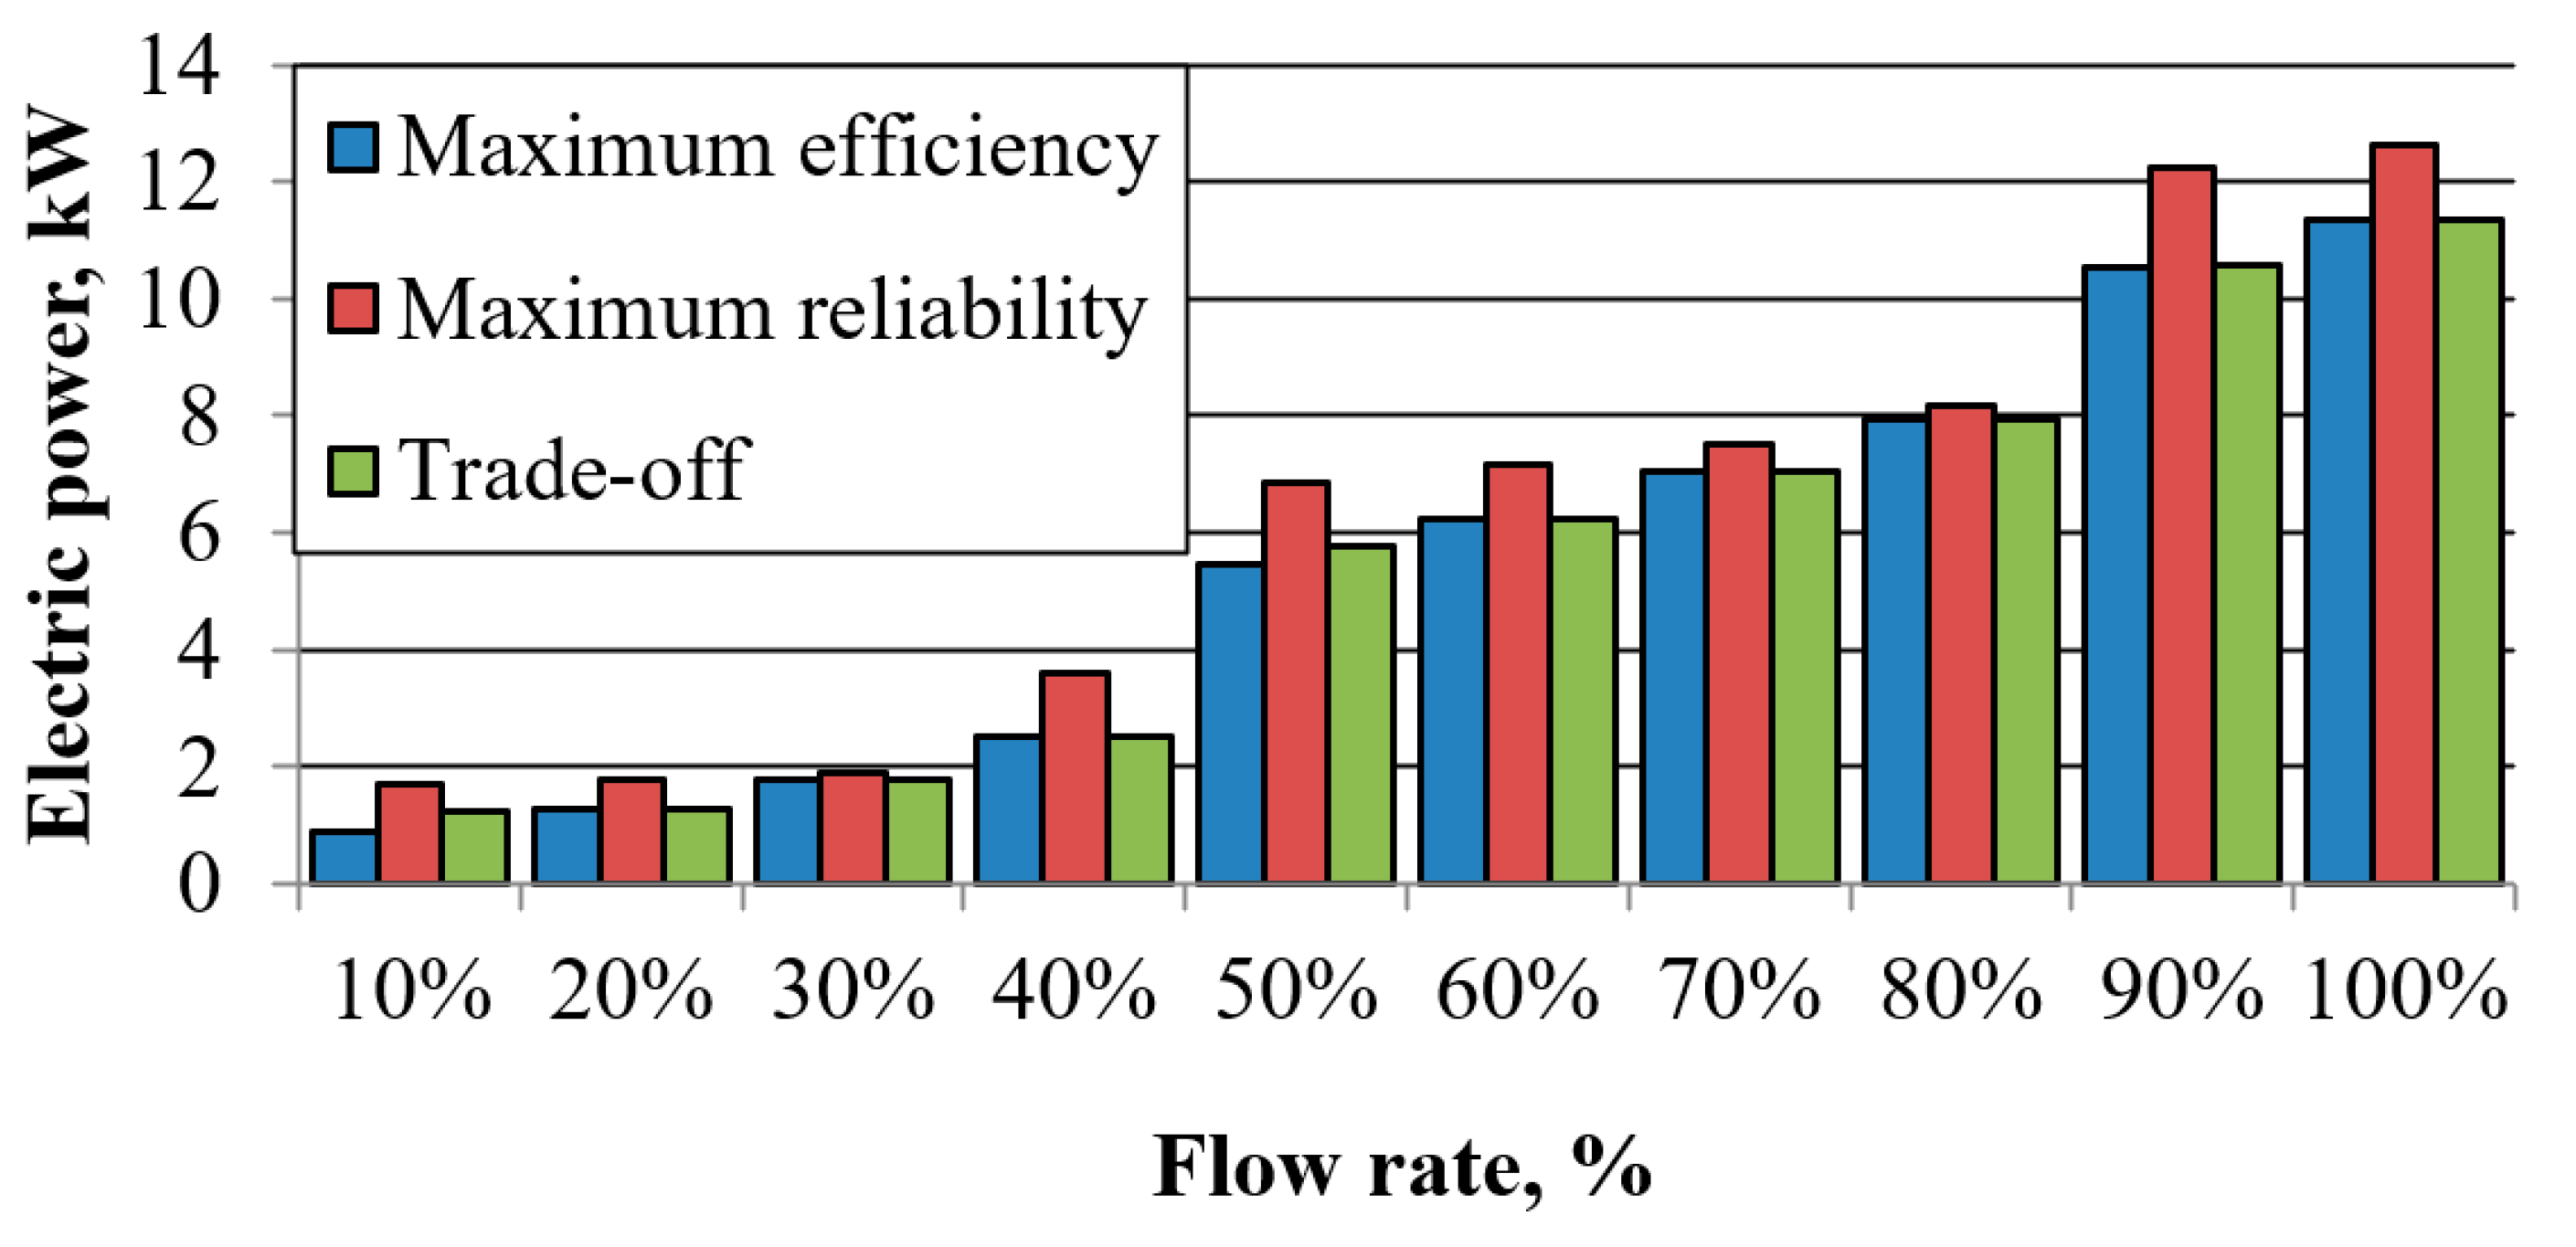
Figure 9 compares the flow rates of individual pumps with different control methods. With the maximum efficiency method, the flow of each pump is minimized, but the deviations of θ at some points are below the POR limit. When applying maximum reliability regulation, the pump flow is always increased by applying a bypass to keep all pumps running at the BEP. When applying the trade-off regulation, if θ < −30%, then the pump flow increases so that θ = −30%.
Figure 10 compares the efficiency of individual pumps with different control methods. With the maximum reliability method, the efficiency of all pumps is always maximized since they always run at the BEP. However, the total energy consumption of the pumping system in this case is also maximum (
Figure 11) since the additional energy consumption from throttling and bypass exceeds the benefit from improving the efficiency of the pumps.
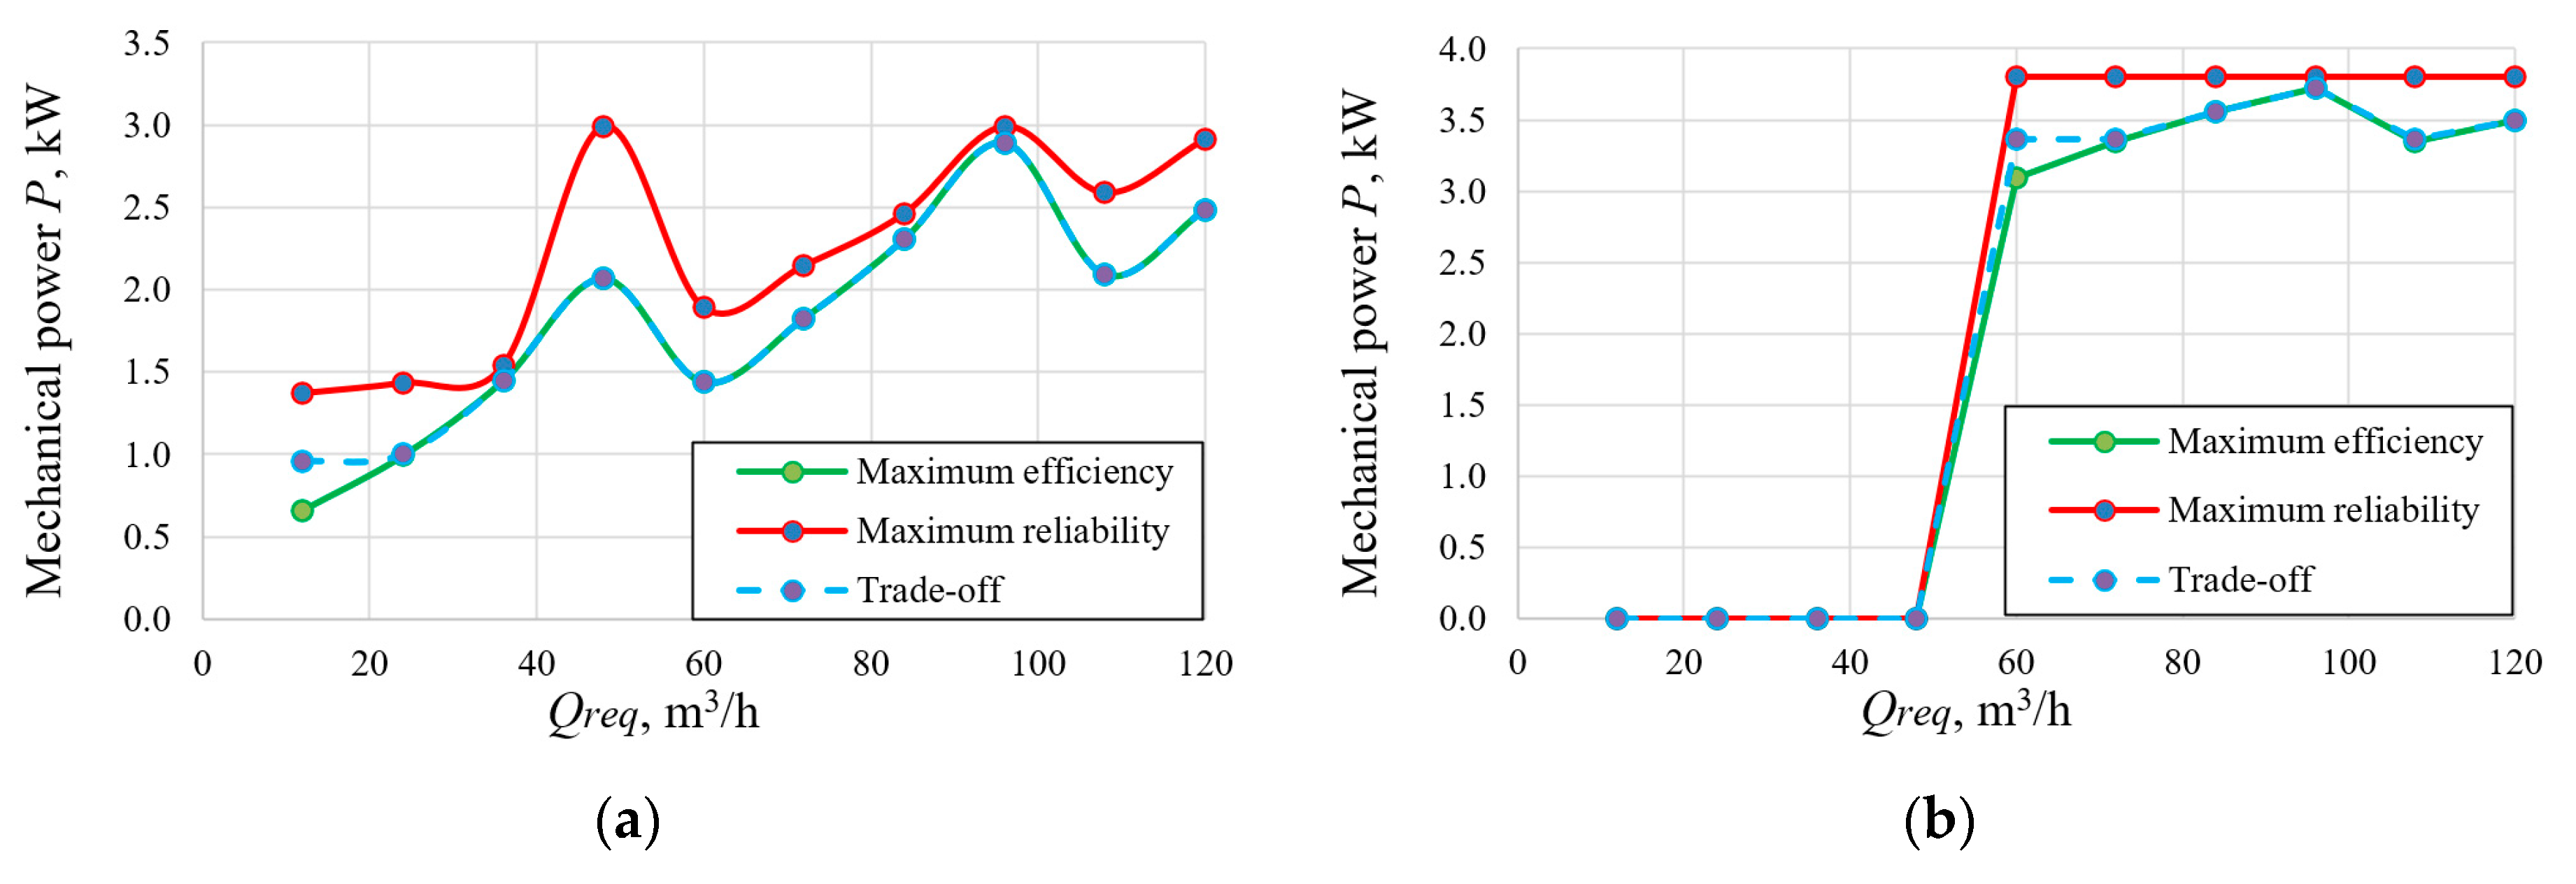
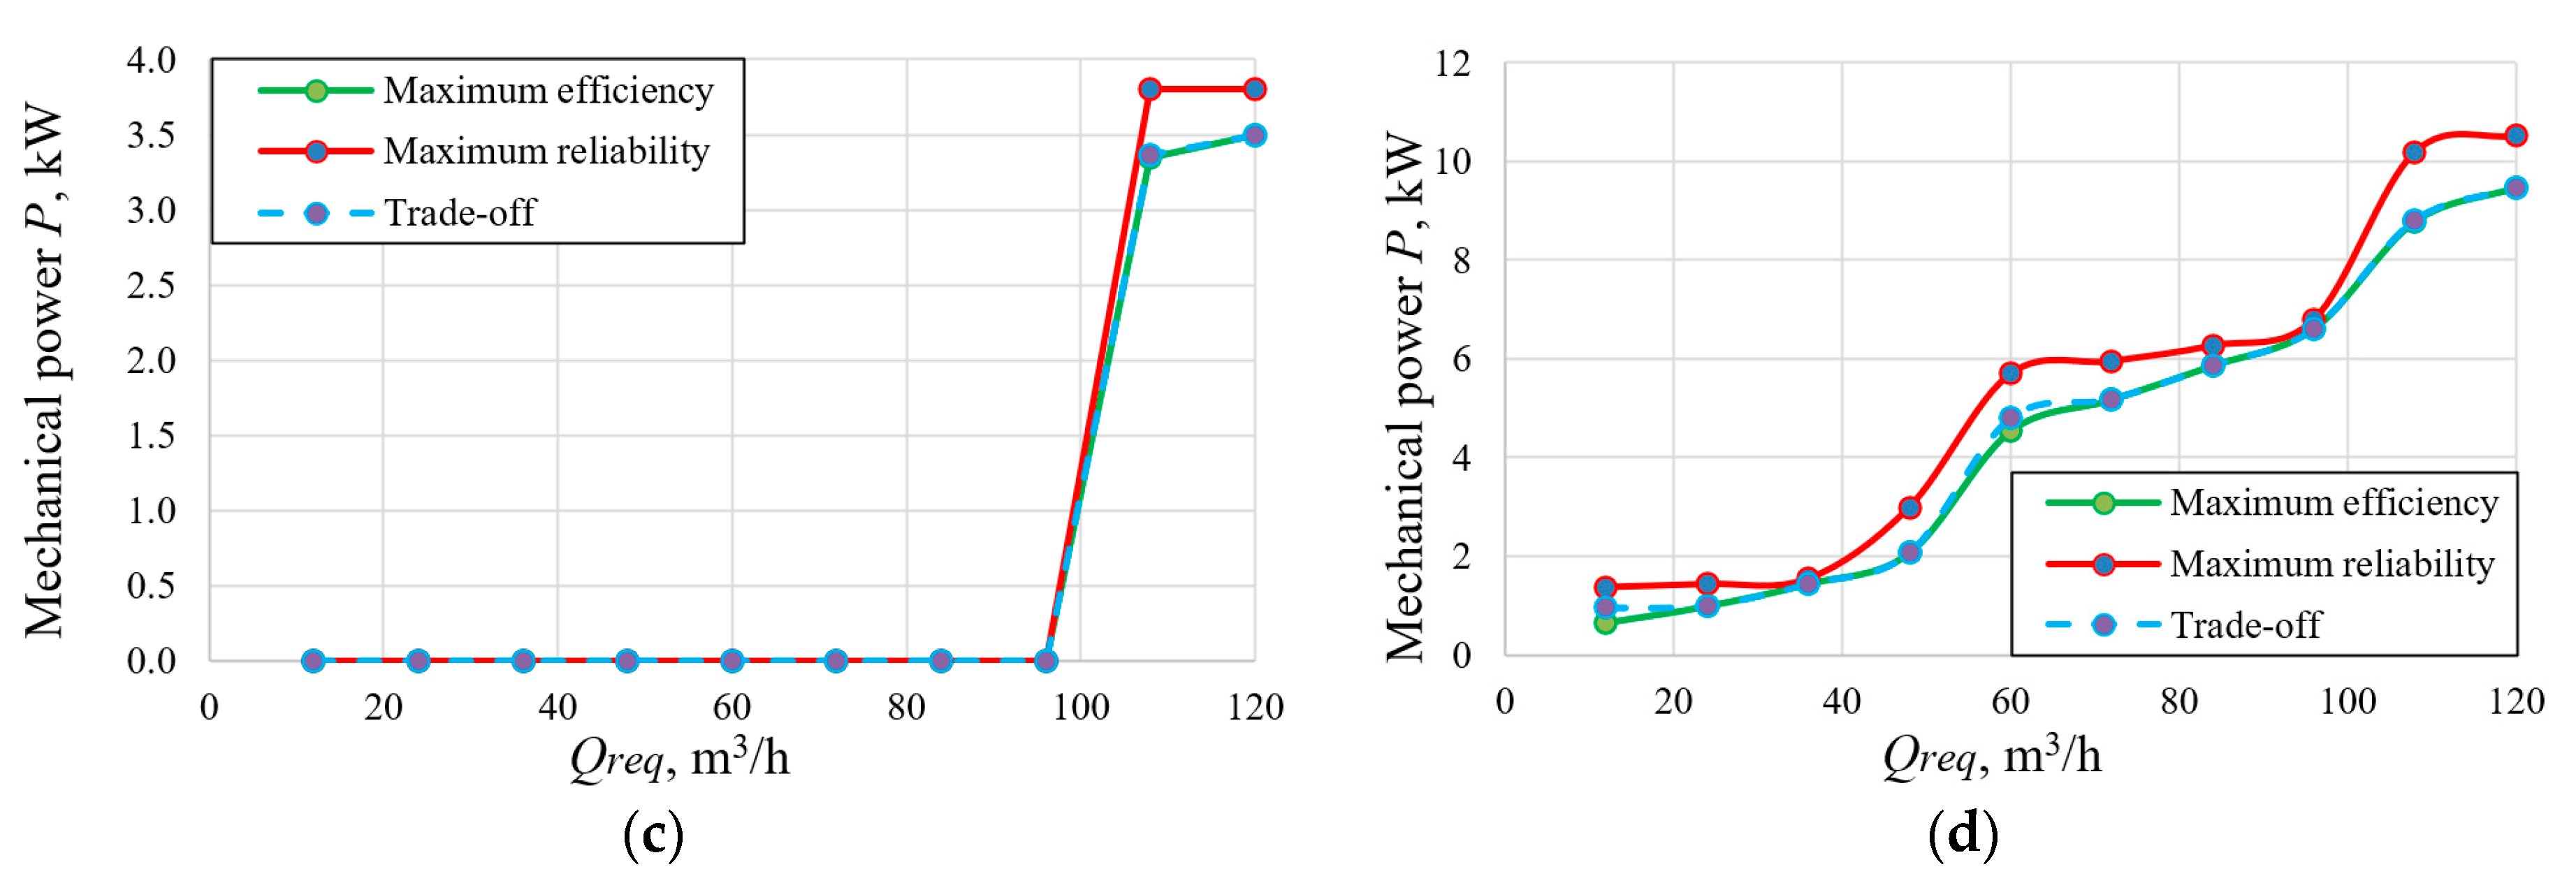
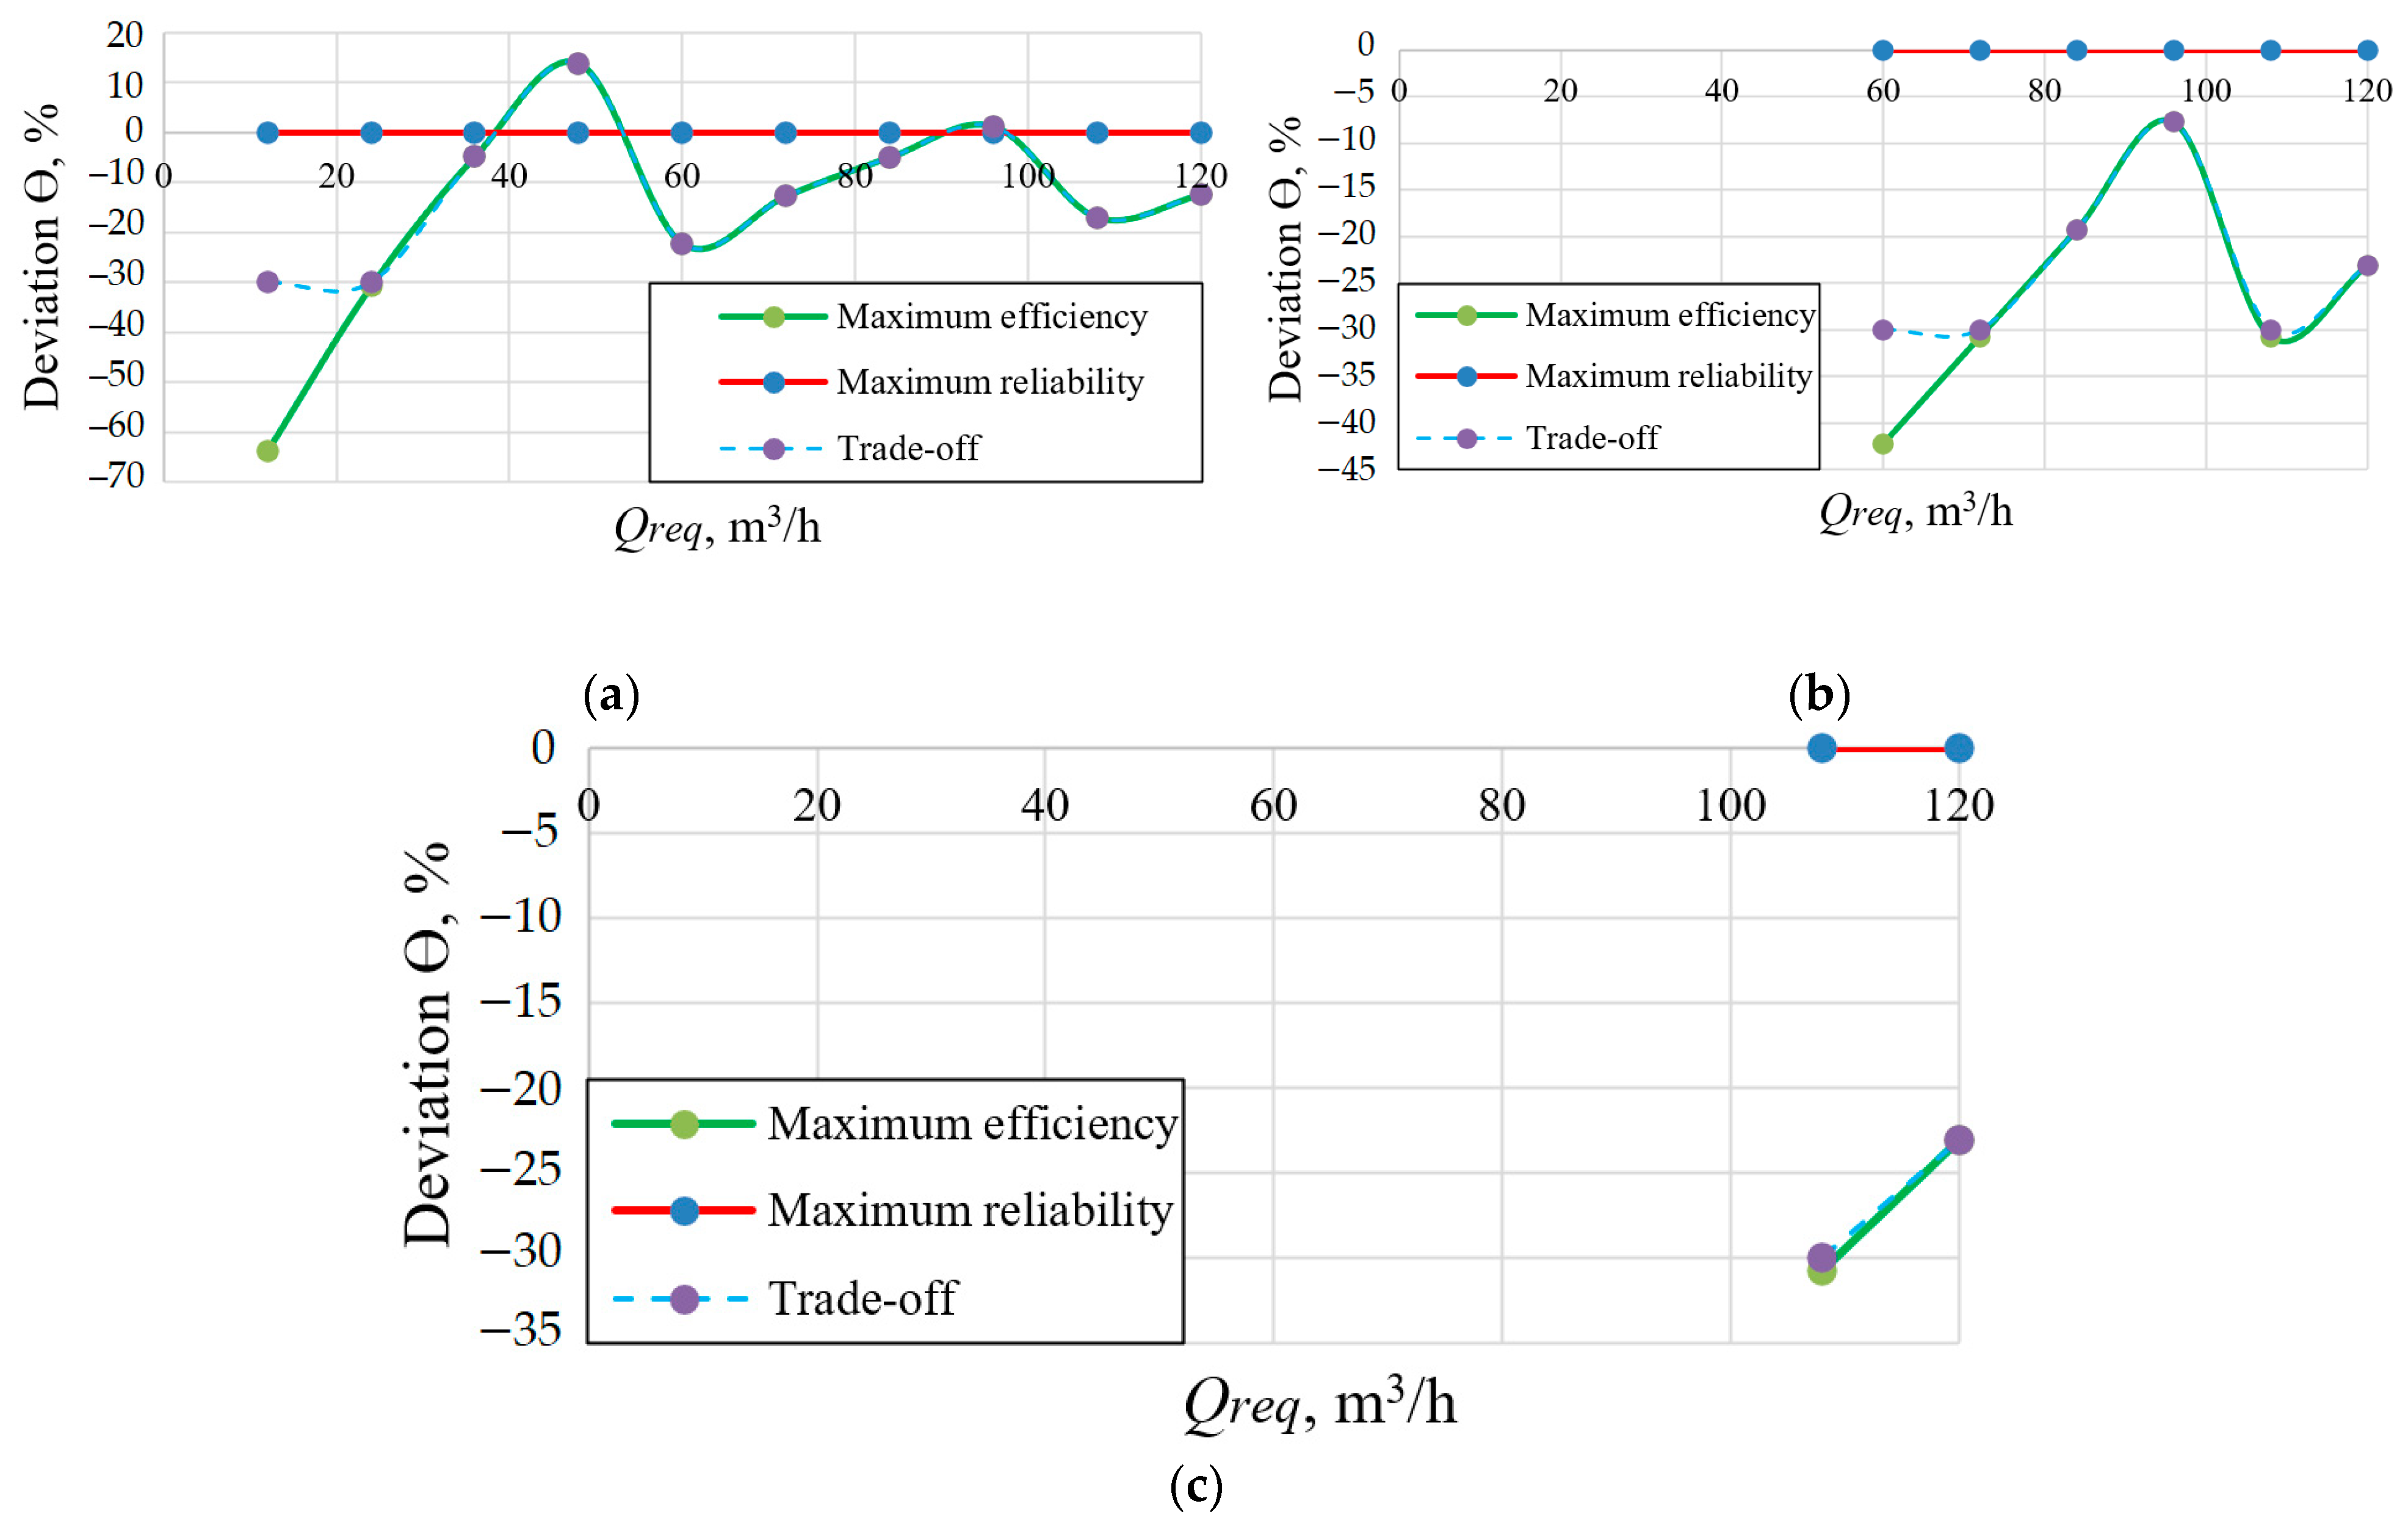
Figure 11 and
Figure 12 compare the required mechanical power and the pump operating point deviation from BEP θ at the various regulation methods considered.
Figure 11 shows that when using the maximum reliability regulation, the required mechanical power significantly increases compared to the conventional speed regulation due to the use of bypass and throttling. At the same time, when using the trade-off regulation, the required mechanical power only slightly increases at two operating points.
According to the proposed trade-off regulation principle, it is necessary to correct only the operating points which deviations θ are outside the POR boundaries (marked in red in
Table 2). As
Figure 6 and
Table 2 show, most of the operating points of the three pumps are already within the POR when the “maximum efficiency” control is applied. Therefore, when the trade-of regulation is applied, most of the operating points remain unchanged, in comparison with the maximum efficiency regulation method. In addition, 4 of 6 points with an unacceptable deviation θ have a deviation value of 30.8%, which is very close to the permissible limit value of 30%. Therefore, the correction of these points when using the trade-off regulation does not require significant additional energy consumption. Significant deviations θ only need to be corrected for the first pump (
j = 1) at point 1 (
i = 1) and for the second pump (
j = 1) at point 5 (
i = 5). This results in a very similar shape of the graphs for PΣ and θ in
Figure 11 and
Figure 12. Only for the correction of operating points 1 and 5 significant additional power consumption is required, which is reflected in
Figure 11d.
Figure 12 shows that the proposed trade-off regulation maintains pump duty points within POR over the entire required flow range.
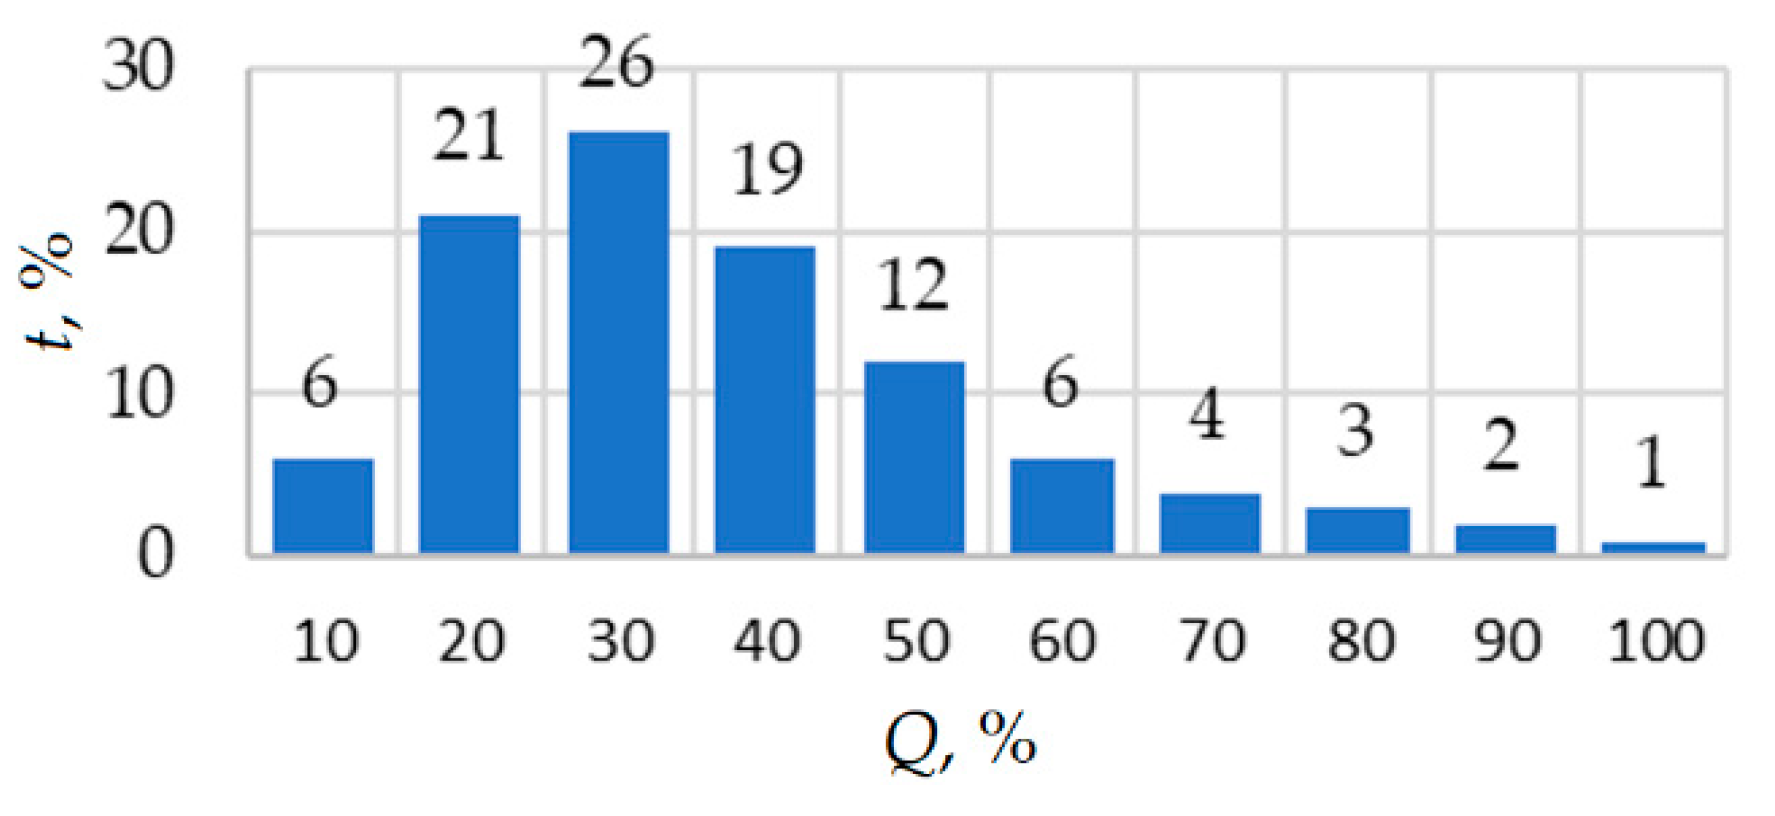
Based on the obtained results (
Figure 11), the energy consumption of the parallel pumping system is compared when operating with a duty cycle corresponding to a typical open-type pumping system [
26].
Figure 13 shows the diagram of the duty cycle. The duty cycle period is 24 h. Electricity consumption is compared at three regulation methods under consideration.
When calculating the electrical power consumption of a pump unit, it is also necessary to consider the characteristics of the components of its electric drive. It was assumed that Sinamics G120C frequency converter with the rated power of 4 kW [
30] and Simotics 1LE1001-1CA6 induction motors with the power of 4 kW and rated speed of 2955 rpm [
31] are used in the drive of the pump system. Data from SinaSave software [
32] in 8 standard loading points are used to determine the power losses and efficiency of the drive (motor plus frequency converter) in the operating points with given values of the shaft torque
T and speed
n that were calculated in the previous section (
Table 2,
Table 3 and
Table 4). The standard loading points are determined according to IEC 61800-9-2, “Adjustable Speed Electrical Power Drive Systems—Part 9-2: Ecodesign for Power Drive Systems, Motor Starters, Power Electronics and Their Driven Applications—Energy Efficiency Indicators for Power Drive Systems and Motor Starters” [
33]. These data are used because the standard [
33] requires manufacturers to declare the loss values for variable frequency drives at these 8 operating points.
Table 5 shows the results of calculating the losses in the electric drive using the SinaSave program at the standard points.
In
Table 5,
Trate drive = 100% = 12.93 N·m is the rated torque of the electric drive;
nrate drive = 100% = 2955 rpm is the rated rotational speed of the electric drive.
Using the data from
Table 5, the sum of losses in the three pump drives ΔPΣ at the considered operating points (
Table 2,
Table 3 and
Table 4) using polynomial interpolation [
34,
35] were found. The results of this calculation are shown in
Table 6.
Table 6 also shows the required total mechanical power PΣ from
Table 2,
Table 3 and
Table 4.
Due to the results of calculating the mechanical power and interpolation of losses in the electric drive from
Table 6, it can be concluded that the losses in the electric drive also make up a significant part of the energy consumption, about 20–30%, and strongly depend on the operating point of the pump. Therefore, the losses in the electric drive must also be taken into account when calculating the total energy consumption of the pumping system.
Using the results obtained (
Table 2,
Table 3,
Table 4,
Table 5 and
Table 6), it is possible to calculate the electrical power consumed from the grid (
Pelec), the daily consumed electrical energy (
Eday), the annual consumed electrical energy (
Eyear), the annual energy cost (
Cyear) and the cost of energy over the entire life cycle of the pumping system (
CLLC) [
36]:
where PΣ is the mechanical power required by the pumps; ΔP is the loss in the electric drive;
tƩ = 24 h is the whole operating period;
ti is the operation time of
i-th loading point;
GT = 0.2036 €/kWh is the applied grid tariffs for non-household consumers for Germany in the second half of 2019 [
37];
Cyear is the annual electricity cost;
Cyear k is the annual electricity cost for
k-th year;
y = 0.06 is the interest rate;
p = 0.04 is the expected annual inflation;
w = 20 years is the lifetime of the pump system.
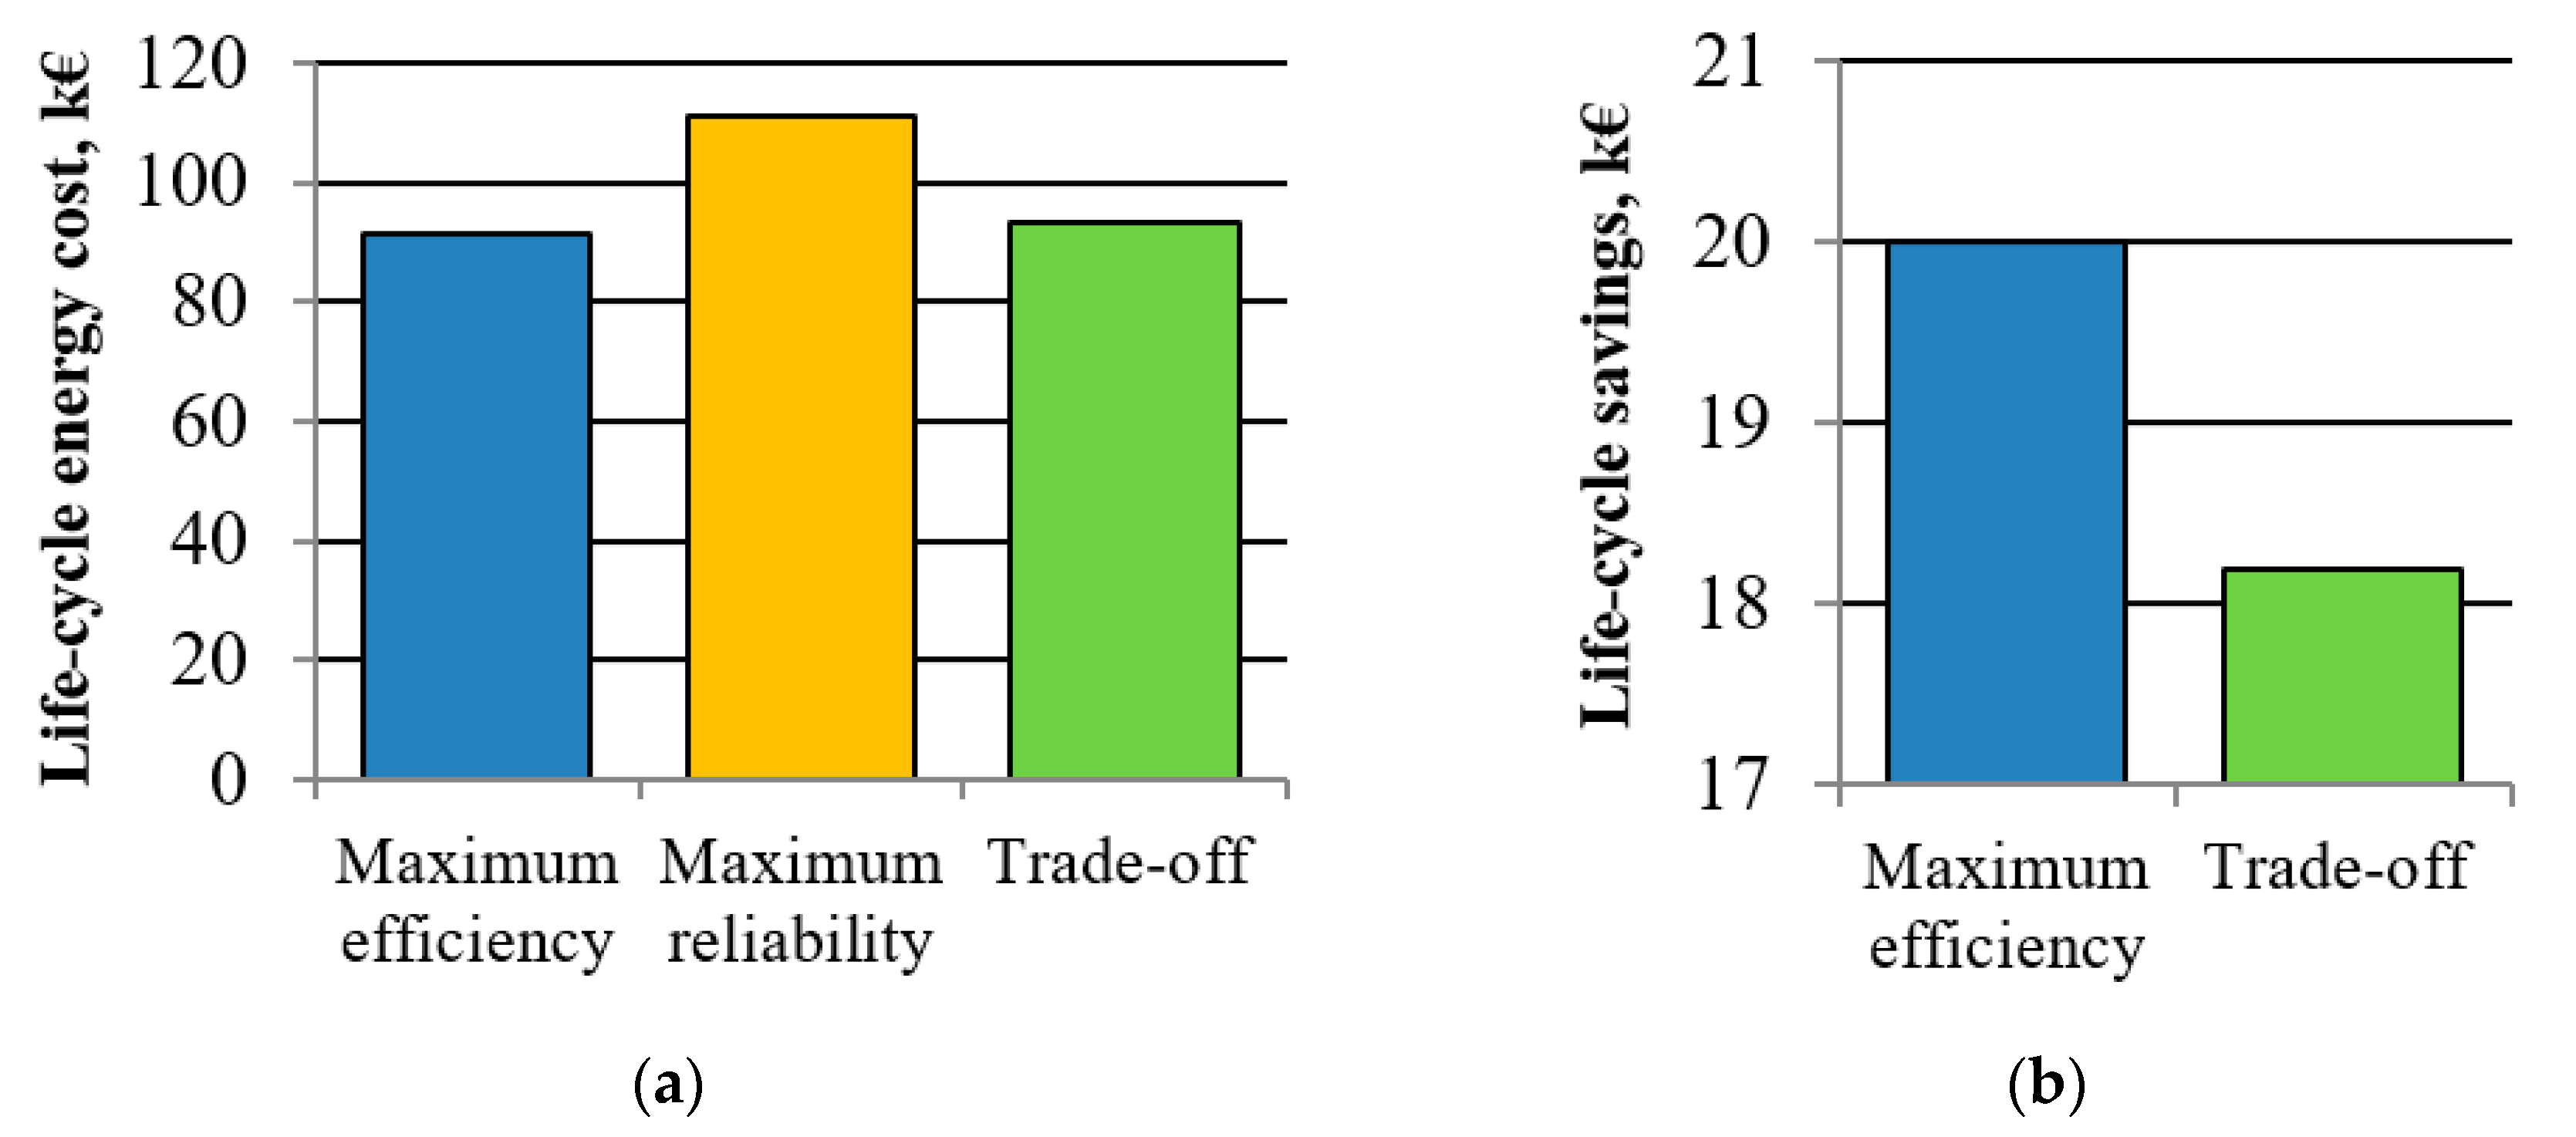
Annual and life cycle cost savings
Syear and
SLCC for a given regulation method compared to the maximum reliability method is calculated as:
where
Cyear max. reliab. is the annual energy cost with the maximum reliability control;
CLCC max. reliab is the lifetime energy cost with the maximum reliability control.
Syear year
SLCC percentage are calculated according to:
Table 7 and
Table 8 show the calculation results based on Equations (10)–(17).


