
An Efficient DA-Net Architecture for Lung Nodule Segmentation

1
Department of Computer Science, COMSATS University Islamabad Attock Campus, Attock 43600, Pakistan
2
Centre for Visual Computing, University of Bradford, Bradford BD7 1DP, UK
3
School of Computer Science and Engineering, Chung-Ang University, Seoul 06974, Korea
*
Authors to whom correspondence should be addressed.
Mathematics 2021, 9(13), 1457; https://0-doi-org.brum.beds.ac.uk/10.3390/math9131457
Submission received: 4 May 2021
/
Revised: 1 June 2021
/
Accepted: 2 June 2021
/
Published: 22 June 2021
(This article belongs to the Special Issue Artificial Intelligence and Big Data Computing)
Abstract
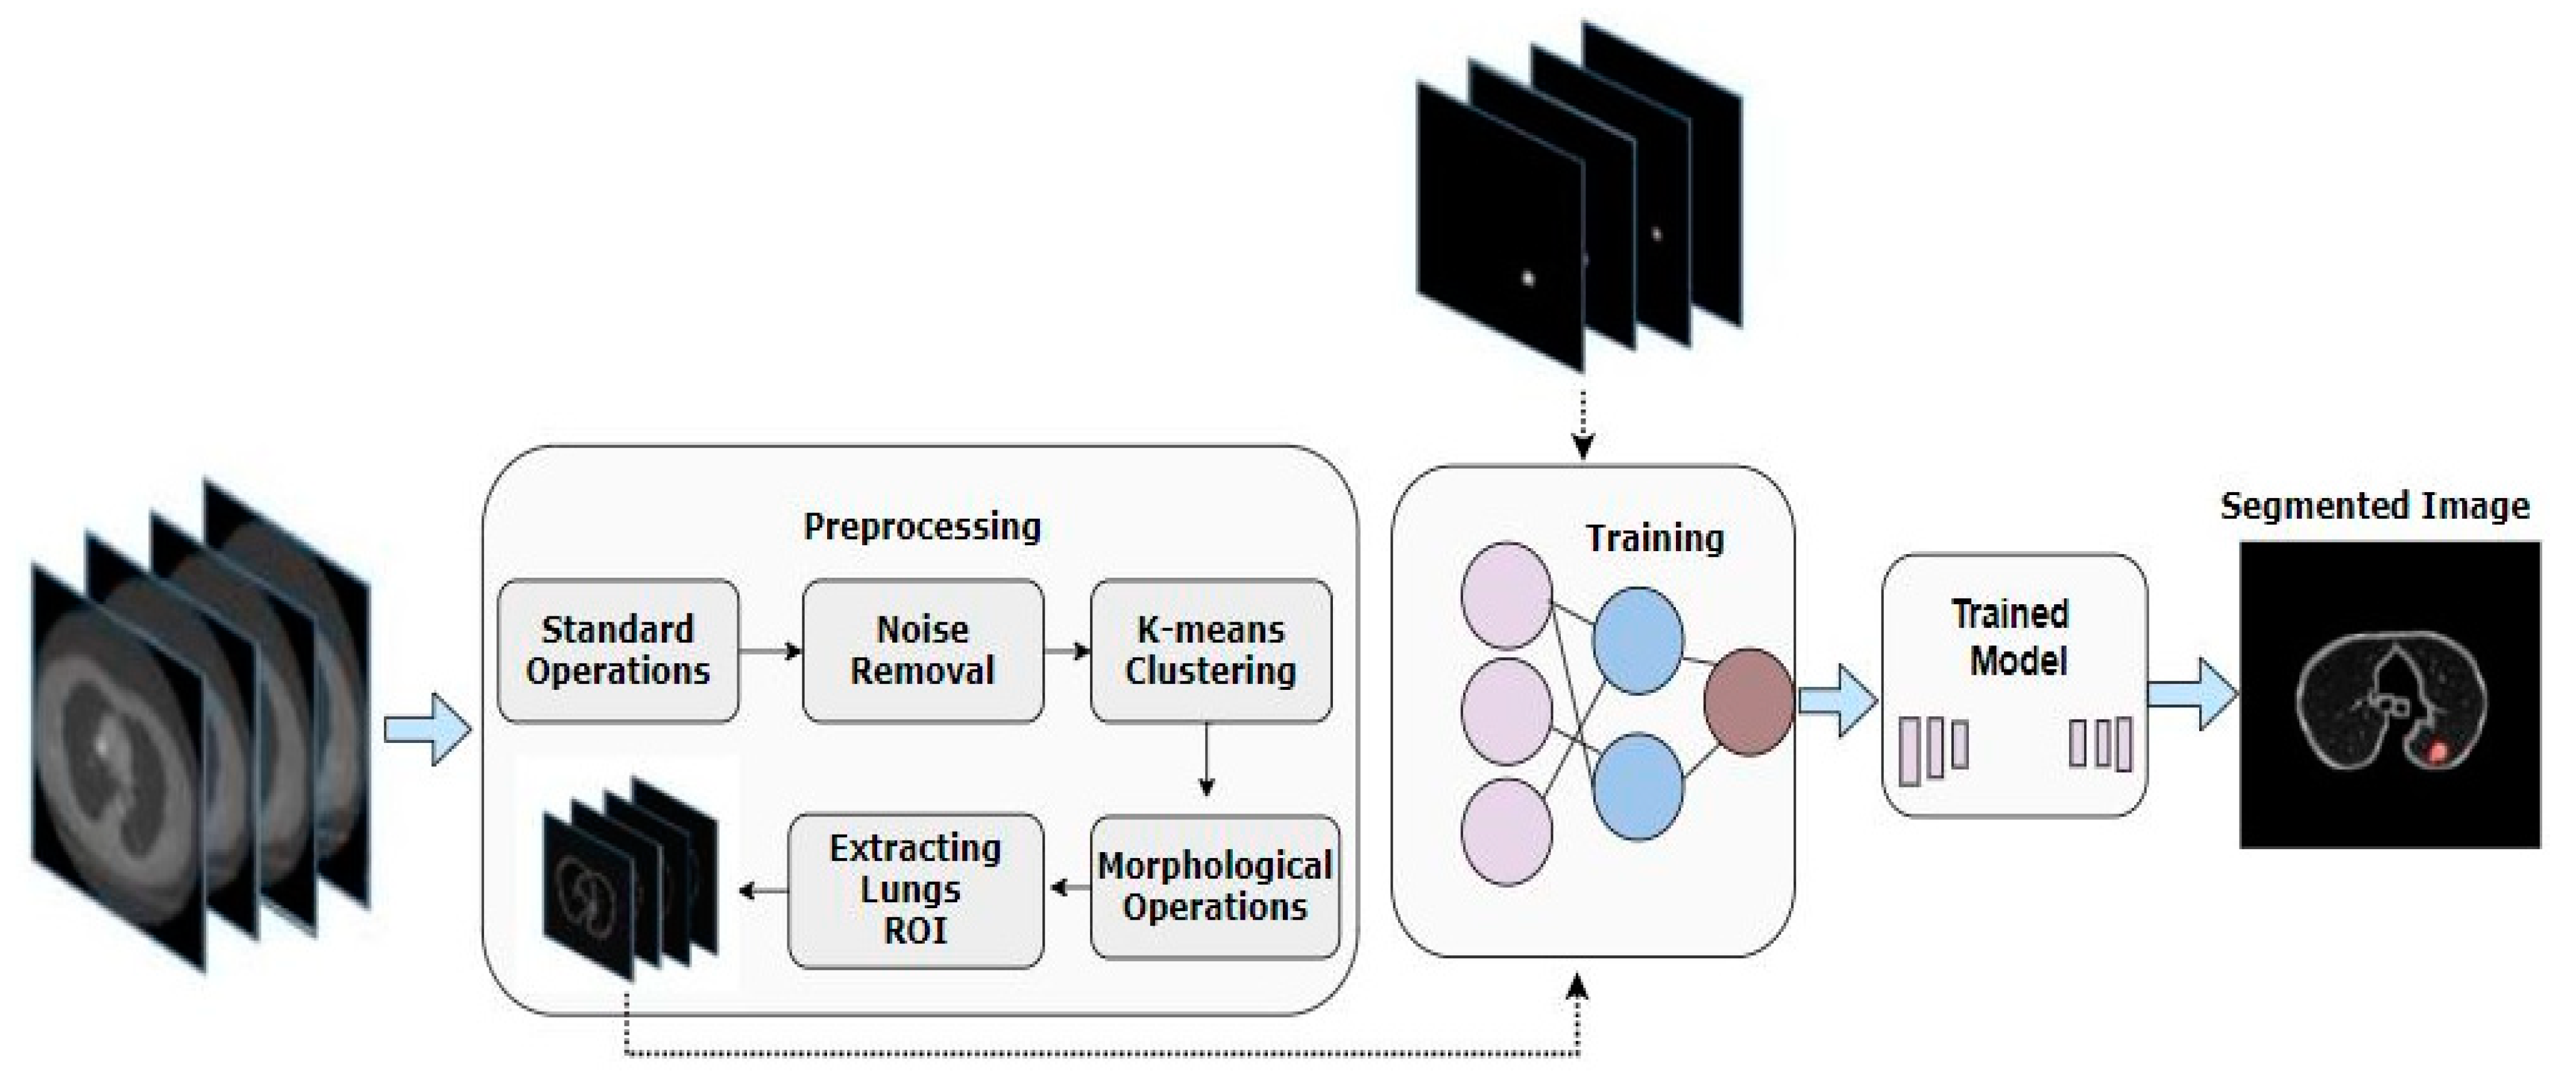
:A typical growth of cells inside tissue is normally known as a nodular entity. Lung nodule segmentation from computed tomography (CT) images becomes crucial for early lung cancer diagnosis. An issue that pertains to the segmentation of lung nodules is homogenous modular variants. The resemblance among nodules as well as among neighboring regions is very challenging to deal with. Here, we propose an end-to-end U-Net-based segmentation framework named DA-Net for efficient lung nodule segmentation. This method extracts rich features by integrating compactly and densely linked rich convolutional blocks merged with Atrous convolutions blocks to broaden the view of filters without dropping loss and coverage data. We first extract the lung’s ROI images from the whole CT scan slices using standard image processing operations and k-means clustering. This reduces the search space of the model to only lungs where the nodules are present instead of the whole CT scan slice. The evaluation of the suggested model was performed through utilizing the LIDC-IDRI dataset. According to the results, we found that DA-Net showed good performance, achieving an 81% Dice score value and 71.6% IOU score.
1. Introduction
Statistical data reveal that lung cancer is an incurable disease with a worldwide survival rate of around 18% for only five years [1]. The nature of this disease requires diagnosis before time, and proper treatment planning is also necessary for better treatment [2]. Over time, advancement has been witnessed in computer-aided diagnostic (CAD) systems, but there have been fewer improvements in CAD systems specifically in terms of lung nodule detection thus far [3,4,5]. Due to the complexity of the disease, detection of cancer tends to be inaccurate, eventually affecting diagnosis and treatment planning. Computed tomography (CT) plays a vital part in the diagnosis as well as treatment of lung nodule cancer [6]. However, as data are expanding with time, CT images are also rising in quantity. With the growing number of images, it becomes challenging to move towards manual lung nodule segmentation procedures. Considering this issue, we require automatic segmentation procedures, and it is important to move towards this area [7]. The structure and location of lung nodules make lung nodule detection a difficult problem [8,9,10]. Lung nodule detection is very demanding because of the way nodules are structured and situated inside the pulmonary region. Often, there is an indistinguishable color contrast among lung nodules and neighboring regions on CT images, which makes it difficult to design a generic segmentation method. The juxtapleural nodules are distinctively responsible for exhibiting identical color contrast as of lung wall, and manual approaches provide inaccurate results in this case. An additional complication is with achieving accurate segmentation of juxtavascular nodules since these are directly linked to blood vessels in the lung parenchyma. It causes difficulty in performing error-free segmentation of juxtavascular nodules because extremely low contrast is observed in CT images with blood vessels [11].
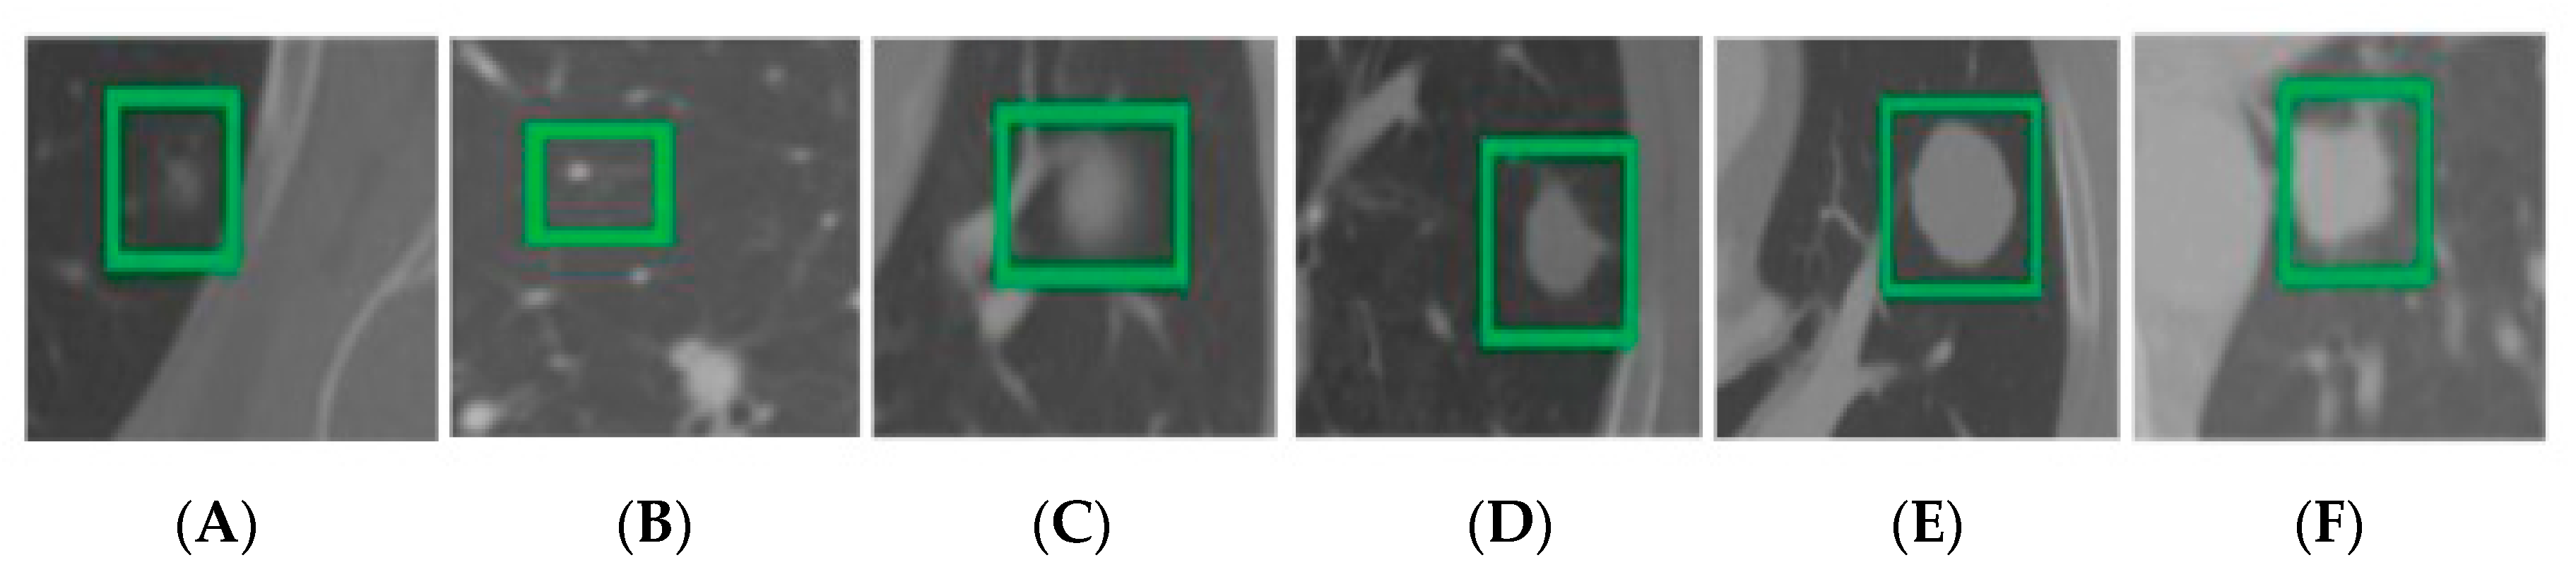
Ground-glass opacity nodules are also similar and have been observed to have low contrast in the neighboring background. In this scenario, simple threshold approaches often fail in achieving accurate results [12]. On the contrary, significantly high contrast is observed for calcific nodules with neighboring region pixels. Traditional threshold approaches such as OTSU are useful for nodule segmentation in cases such as these, but on an overall scale, this approach provides inaccurate results for adhesion-type nodules (juxtapleural and juxtavascular) and GGO nodules. The cavitary nodule comprises a specific cavity that represents a malignant nodule and is round in shape. The cavity has a low-density shadow, greater than 5 mm, as seen in the CT image. Usually, the density of shadows found in cavitary nodules is significantly different as compared to other parts of the body [13]. For this reason, the segmentation of cavitary nodules is generally inaccurate. It is a notable fact that numerous lung nodules secure a compact space with smaller diameters. This makes nodules almost identical to one another as well as to the intensity of the adjacent noise region. Moreover, nodules of small size potentially weaken and restrict the down-sampling segmentation network on an overall basis. Different types of nodules are presented in Figure 1. The network faces many constraints regarding deep semantic feature extraction, and the performance of the feature extraction step for large nodules subsequently deteriorates. For this purpose, it is important to critically analyze and understand the segmentation framework for better results. The multi-scale problem of nodular cysts must be addressed appropriately with the single detection and segmentation technique.
In the past, various intensity-based techniques have been applied that make use of morphological operators [14,15] and region growing [16] for lung nodule segmentation. Other than these techniques, energy-optimized approaches [9] include the graph-cut method [17]. However, it was observed that the aforementioned methods are not well suited specifically for juxtapleural nodules and nodules less than a diameter of 6mm [9,17]. It was observed in morphological approaches that morphological template size is inadaptable for nodules with fluctuating diameters [10]. Other approaches are based on semi-automatic interaction, which is entirely supported by user participation [18]. Some shape-constrained techniques are reliant on a provided set of rules [19]. In any case, all the above-mentioned techniques show a decline in performances and go through patchy nodular cysts if provided shape assumption is not followed. Extensive experimentation and research have revealed that CNN is practically an effective architecture, especially for computer vision problems [10,16,20,21]. CNN and its variants are well researched specifically due to its automatic feature learning. However, due to size differences and contrast issues of lung nodules, it is difficult for basic CNN architecture to detect various nodules simultaneously. With all these challenges taken into account, it is necessary to design an efficient approach that addresses all the issues discussed. Thus, in order to just contribute to the solutions of these problems, we present an end-to-end improved U-Net-based model called DA-Net for lung nodule detection and segmentation. The proposed model incorporates the DA blocks in the original U-Net for rich dense feature extraction by integrating compactly linked dense convolutional blocks merged with Atrous convolution blocks. It broadens the view of filters without dropping loss and coverage data. The dense connections among different convolutional layers improve the performance and boost up the process of feature reusability. The issues of vanishing gradients are also overcome by these connections [22]. Moreover, we also added different scales of transposed convolutions to encapsulate the information of different sizes of nodules instead of simple upsampling operations that are used in the original U-Net. Besides this, we also used different types of pooling that included max and average pooling. The proposed framework was trained on Lungs ROI extracted from the whole CT slice image. This step was performed by using various preprocessing operators such as morphological operations and k-means clustering. Our proposed model was assessed on the LIDC-IDRI dataset and exhibited good and acceptable results. Moreover, the proposed work efficiently handles different types of heterogeneous nodules.
2. Related Work
There are various techniques proposed for lung nodule detection including morphological-based techniques [14,15], region-growing-based techniques [10,16], energy-based optimization techniques [9], and machine learning-based techniques [23]. A large number of morphological operations were used to get rid of nodule connected to vessels [24] and growth patterns [25]. After performing this step, we discarded nodules according to a selection of linked regions. Lung walls were separated from juxtapleural nodules using a morphological parameter with shape hypothesis to alternate a fixed-size morphological template [26,27]. It is normally a difficult task to achieve accurate segmentation results using morphological operation [14]. Different region-growing approaches can be used to ideally segregate calcified nodules. A drawback of these approaches, however, is that the segmentation result of juxtavascular nodules and juxtapleural nodules is not accurate [10]. Dehmeshki et al. [16] presented a modified region growing method based on intensity information, distance, fuzzy connectivity, and peripheral contrast as a solution to this problem. This method was not productive enough for nodules with uneven shapes. A variation observed in energy optimization techniques is that researchers modify the segmentation phase into the energy minimization phase [28,29,30,31]. The level set function was exploited in this research for image characterization. In the next stage, the segmented patch corresponds with nodular boundary, and energy function is documented as the least [28,29,30,31]. Making use of a similar methodology, Farag et al. [9] presented their research approach, which is the lung nodule segmentation approach based on shape prior hypotheses. A graph-cut approach that converts lung nodular segmentation to maximum flow problem has been used as well [17,32,33]. However, these techniques are inadequate in terms of dealing with GGO nodules and juxtapleural nodular cysts at a time.
Furthermore, segmentation of targeted nodule is the primary step in the machine learning method, and to perform this step, related features are essentially extracted for voxel classification [23,34,35,36]. Lu et al. [37] presented a set of features with translational and rotational invariance to carry out classification. According to research work given by Wu et al. [38], it can be observed that their proposed method was based on conditional random fields and features related to nodular shape and texture were used. To acquire a mask of lung blood vessels, Hu et al. [39] performed nodule segmentation and applied vascular feature extraction based on the Hessian matrix. After this, they removed blood vessels from lung masks and used artificial neural networks for classification. Other than these techniques, Jung et al. [40] presented an efficient technique for the segmentation of ground-glass nodules. Their proposed technique was based on asymmetric multi-phase deformable layouts. Making use of the Hessian strategy, Gonçalves et al. proposed a 3D multi-scale lung nodule segmentation method [41].
In addition to the above, there are advanced techniques such as convolutional neural networks (CNNs) that are used for lung nodule detection. CNN is a multi-layer neural network that hierarchically learns features from the provided raw imagery data and labels [42,43]. The CNN-based lung nodule segmentation was carried out by altering the segmentation phase with the voxel classification problem. Wang et al. [44] used a multi-view convolutional neural network (MV-CNN) for lung nodule segmentation. The proposed work had three CNN branches linked to three views of an axial plane, coronal plane, and sagittal plane. In their later work, they proposed a semi-automatic central focused CNN for voxel classification [45]. However, their proposed model was not efficiently applicable over smaller nodules. In the research work of Zhao et al. [46], an updated pyramid deconvolution neural network was presented in which high-level semantic features were linked with low-level fine-grained features. Huang et al. [47] introduced a fully automated approach for the segmentation of lung nodules. The first step presented in their methodology related to the detection of nodules, the second step deals with nodular candidate integration, while the third step relates to false-positive minimization. The nodule segmentation was performed in the final step. On the other hand, a fully convolutional network (FCN) has also been used by researchers for image segmentation [48]. There are techniques such as the 2D U-Net framework by Ronneberger et al. [49] and the 3D U-Net framework by Çiçek et al. [50], which are adaptive to medical imagery data. As an extension to the above deep learning-based methods, we also propose a segmentation algorithm for the detection of lung nodules.
3. Materials and Methods
The proposed method is presented in Figure 2 and explained here in detail.
3.1. Dataset
In this research work, we used public datasets from Lung Image Database Consortium and Image Database Resource Initiative (LIDC-IDRI) [51] to conduct experiments. There were exactly 986 samples of nodules found in the LIDC-IDRI dataset, all of which were labeled by four radiologists who are experts in this domain. We were highly motivated to obtain accuracy as the nodules marked by four doctors were predicted to be true nodules. Another factor observed in labeling was dissimilarity, which became the primary reason for using the 50% consistency criterion to acquire a ground-truth outline [40]. It can be said that if the current voxel point was chosen by a total count of more than two physicians, it must be reserved, and in other cases, should be deleted from the gold standard. To conduct our research experimentation, we arbitrarily partitioned 986 nodules into three subsets for training, validation, and testing, with the number of nodules contained in each subset being 387, 55, and 544, respectively.
3.2. Pre-Processing
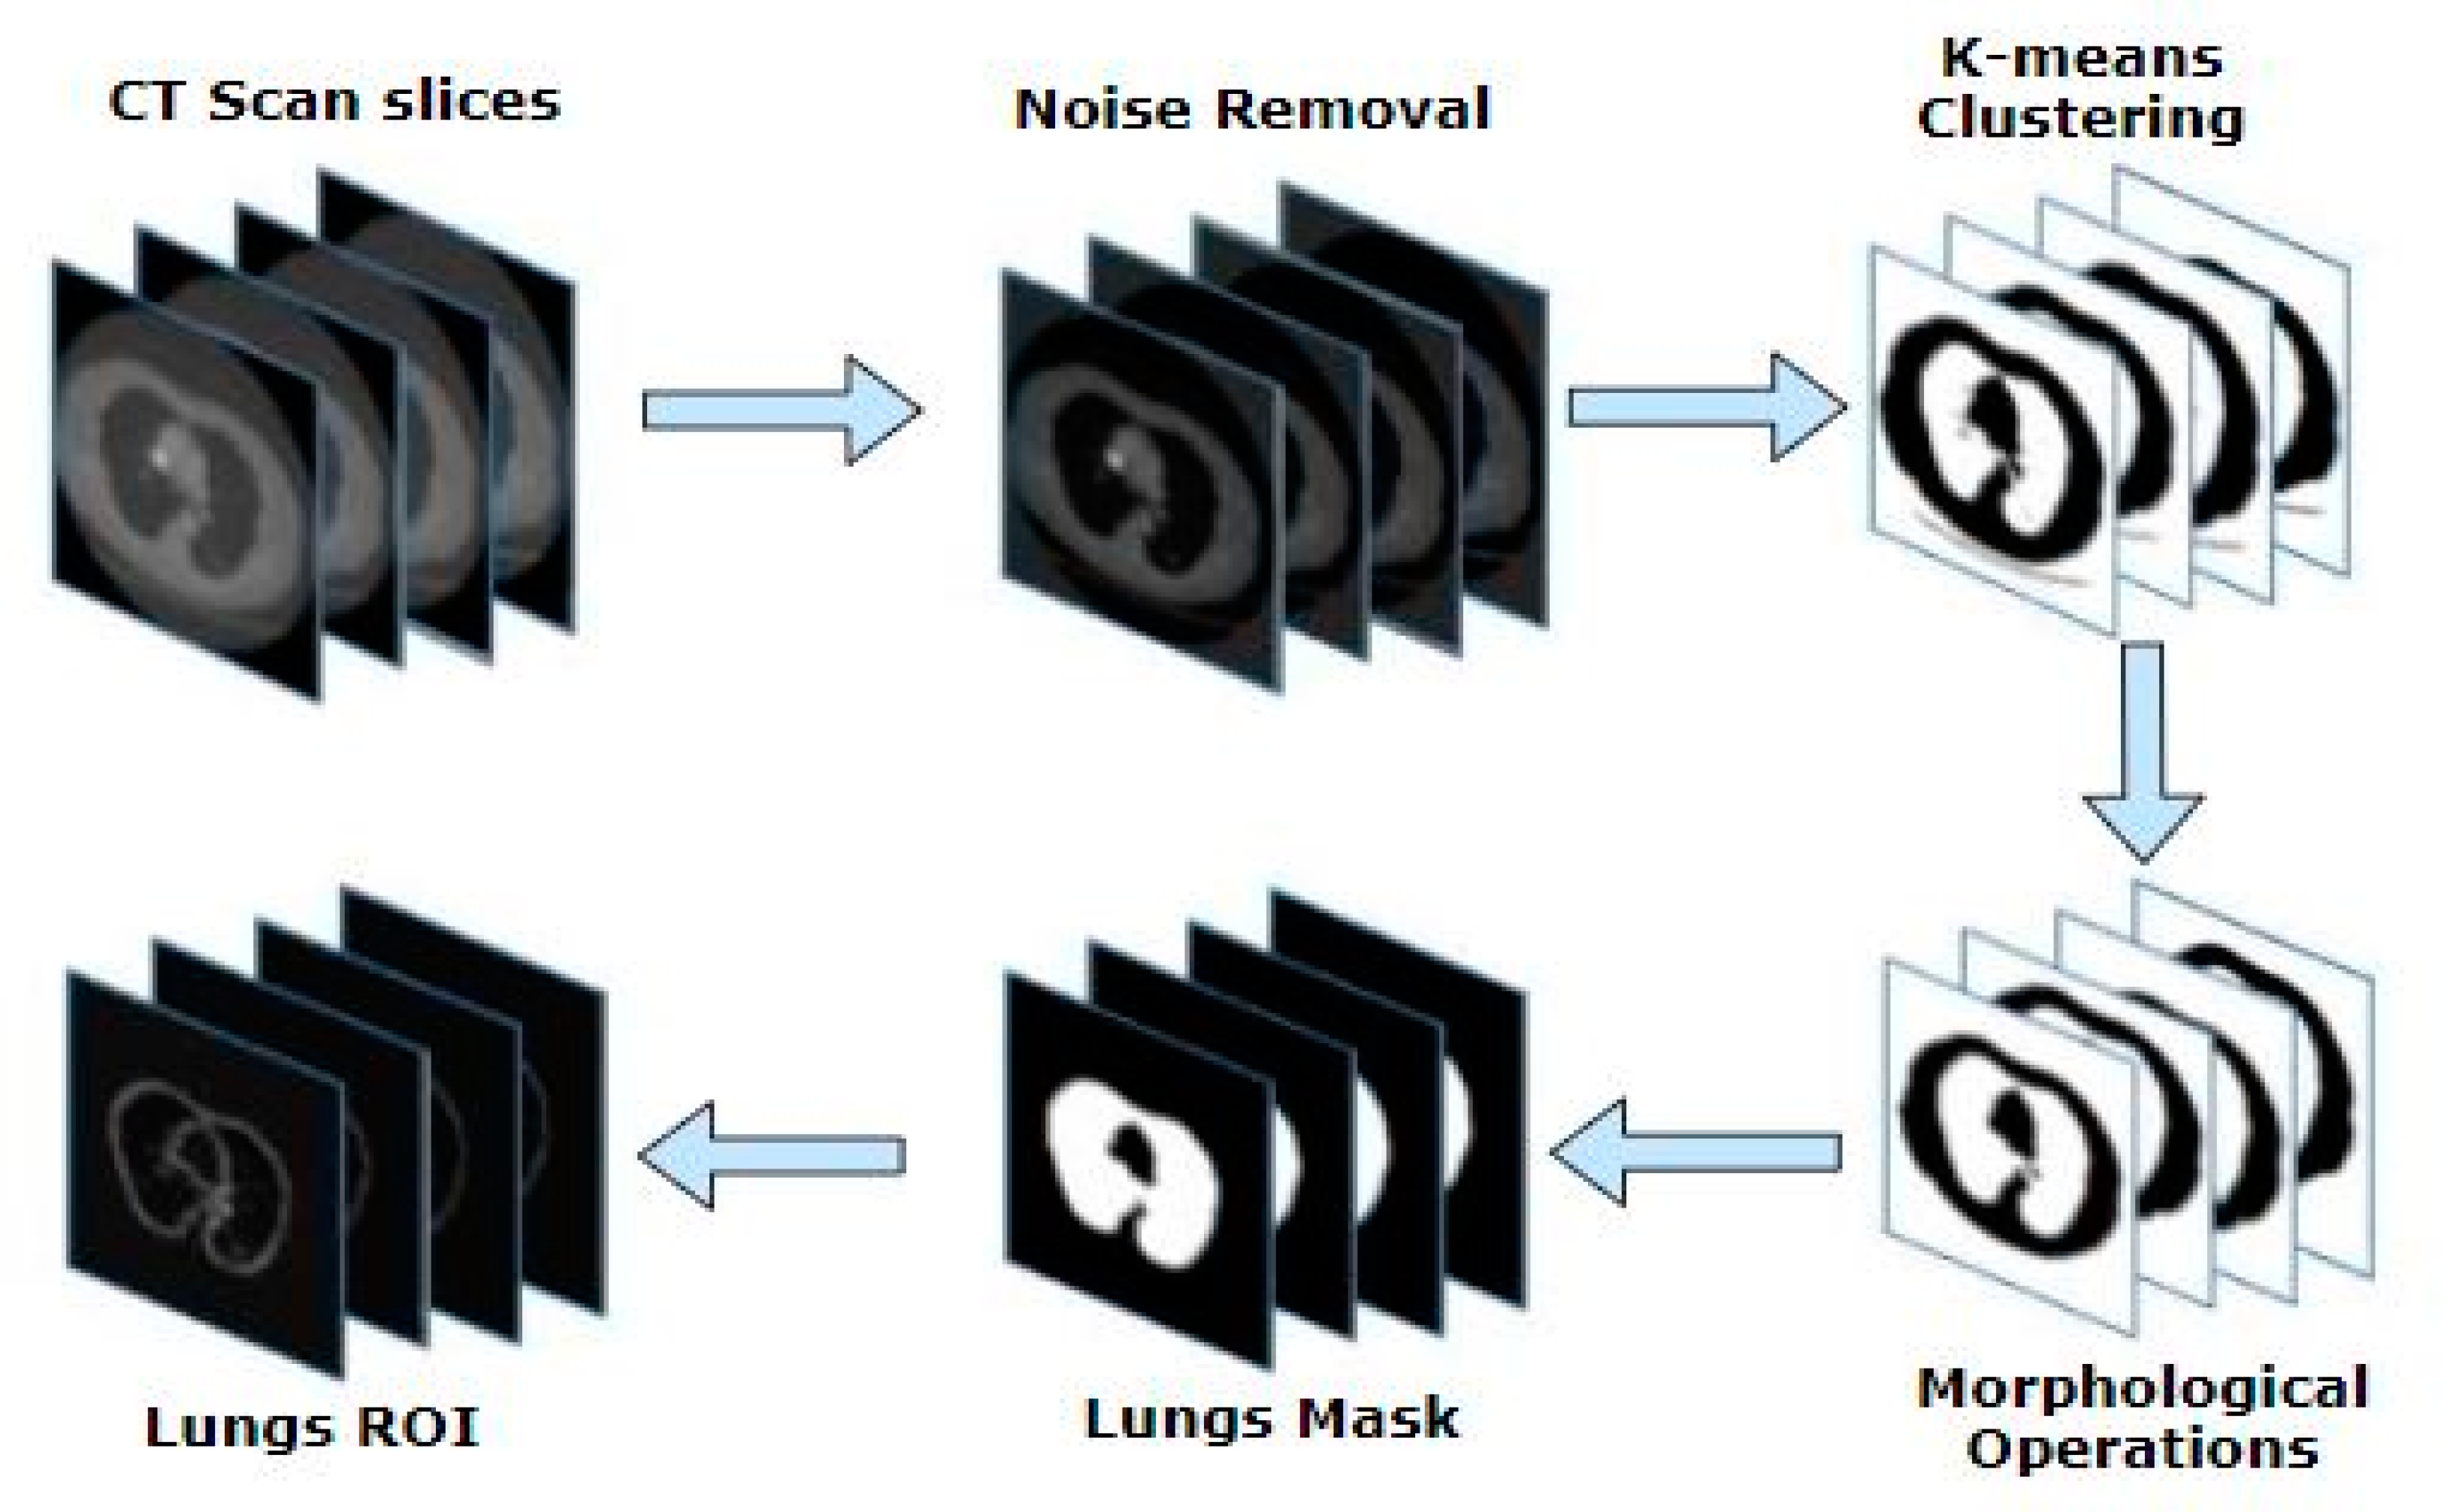
Medical imaging datasets often contain unwanted regions and noise, which affects the performance. This is an unnecessary part of medical imaging datasets that should be handled before further processing. It is also important to pass the dataset through a preprocessing phase so that an improved and clear version of images can be achieved. In this research, specifically for minimizing the search space of our proposed models, we worked on the extraction of ROI from a whole CT scan image with nodular cysts. To extract lung nodule ROI, we carried out the following crucial steps. A complete view of preprocessing is presented in Figure 3.
3.2.1. Standard Operations
It is commonly observed that a better output can be achieved using even basic image pre-processing techniques. Considering this notion in this research, we chose to apply two fundamental operations and observed a significant difference. We applied standard mean and deviation over the actual set of raw images in the CT slice. In the next step, we proceeded towards subtracting the image from the standard mean and deviation. Once this step was performed, the mean of the acquired cropped area was determined. Later on, the maximum and minimum values of the original slice were obtained, and the image was replaced by the mean of the cropped region.
3.2.2. Noise Removal Filters
Noise consists of some pixels or an entire region that does not fall under the ROI. The noise could be an object, multiple objects, blurred pixels, distorted boundaries, or unnecessary details that are of no use. Researchers have proposed many methods to minimize and remove noise in medical imaging. Over time, many noise removal filters have been introduced to achieve this goal, so here two of these filters have been used to obtain improved images [52,53,54,55,56]. A median filter is one of the most commonly used filters in medical imaging [52,57]. It targets the spatial domain of the image and preserves all the edges of the image without any loss. The median filter exploits a smaller matrix called the kernel to perform scanning of the entire image. Central pixel value is recalculated by obtaining a median of matrix values. We chose a kernel size of 3 × 3 in this scenario for the application of the median filter over the resultant image. Another filter that we used was an anisotropic diffusion filter. It was one of the non-linear filters and is also referred to as Perona–Malik diffusion. This filter tries to avoid noise inside an image without smudging the edges and corners of the nodule boundary line. The two constants associated with this filter include the gamma and kappa coefficients, whose values were 0.1 and 50. The diffusivity at different locations was reduced by a non-uniform process named the anisotropic process, and hence the edges of the objects remained stable while removing the noise.
3.2.3. K-Means Clustering
There are different methods proposed by different researchers for the segmentation of medical images [58,59]. One of the most widely used techniques is the k-means algorithm, which is also most widely used in the medical domain [60,61]. The k-means algorithm is based on unsupervised learning, and it extracts ROI from image background to perform segmentation. A prerequisite to achieve efficient results from the k-means algorithm is having smooth and clear imagery data for further processing. In our research work, this prerequisite step was performed during the pre-processing phase, and once the noise was removed, we proceeded towards k-means clustering. We set the value of as for performing segmentation of lungs from image followed by thresholding image so that two clusters were formed. Initially, the k-means algorithm chooses a random central point by calculating distance in image pixels. In the next step, a new centroid is calculated, and the value is updated. This algorithm keeps on performing iterations until the centroid becomes constant. The similarity measures determined during clustering directly relate to Euclidian distance given in Equation (1):
where the image is represented by , while and represent the pixel coordinates of images.
3.2.4. Morphological Operations
Morphological operators are used to discard distortions in imagery data [62]. The morphological operations are performed with these operators using numerous structuring elements referred to as pre-defined kernels on an image. We obtain a binary image from the previous step. Generally, there are many imperfections and flaws that are visible in a binary image. To remove these flaws, we applied erosion operation on an image along with dilation operation. It can be seen that object boundaries were even, and all tiny objects present in the foreground were eradicated by applying erosion operation. Moreover, dilation operation was used for restoring intrusions because of enlarged objects and for diminishing the gaps. This process of erosion followed by dilation is termed as opening on the image , which is a binary image obtained from the previous step. The structuring element of size was used in erosion operation, while in dilation operation, it was . The morphological opening operation is defined in Equation (2):
where an opening operation is denoted by , by which structuring element is applied to the image , while an erosion operation is denoted by ө, and dilation is denoted by .
3.2.5. Extracting Lung ROI
In this step, our ROI of lungs is extracted out of the CT scan image. The previously obtained results from a morphological opening operation were used to label the output image. This was entirely based on the intensity values of pixels. Two pixels are supposed to share a similar link and have the same values while sharing a neighborhood. When this rule is followed, all connected regions usually are assigned to a similar integer value. In the later stage, features of all labeled areas are assessed using bounding boxes that cover all pixels and belong to a single area. By making use of these bounding boxes, we extracted a lung mask. After this, we carried out dilation operation over lung mask obtained as output with structuring element of size The structuring element of size (10, 10) was convolved over the extracted lungs mask. This dilation operation blurred the boundaries of the lungs and filled out holes and gaps. In the last step, the lung mask was multiplied with a slice image to obtain the required ROI.
3.3. DA-Net Architecture
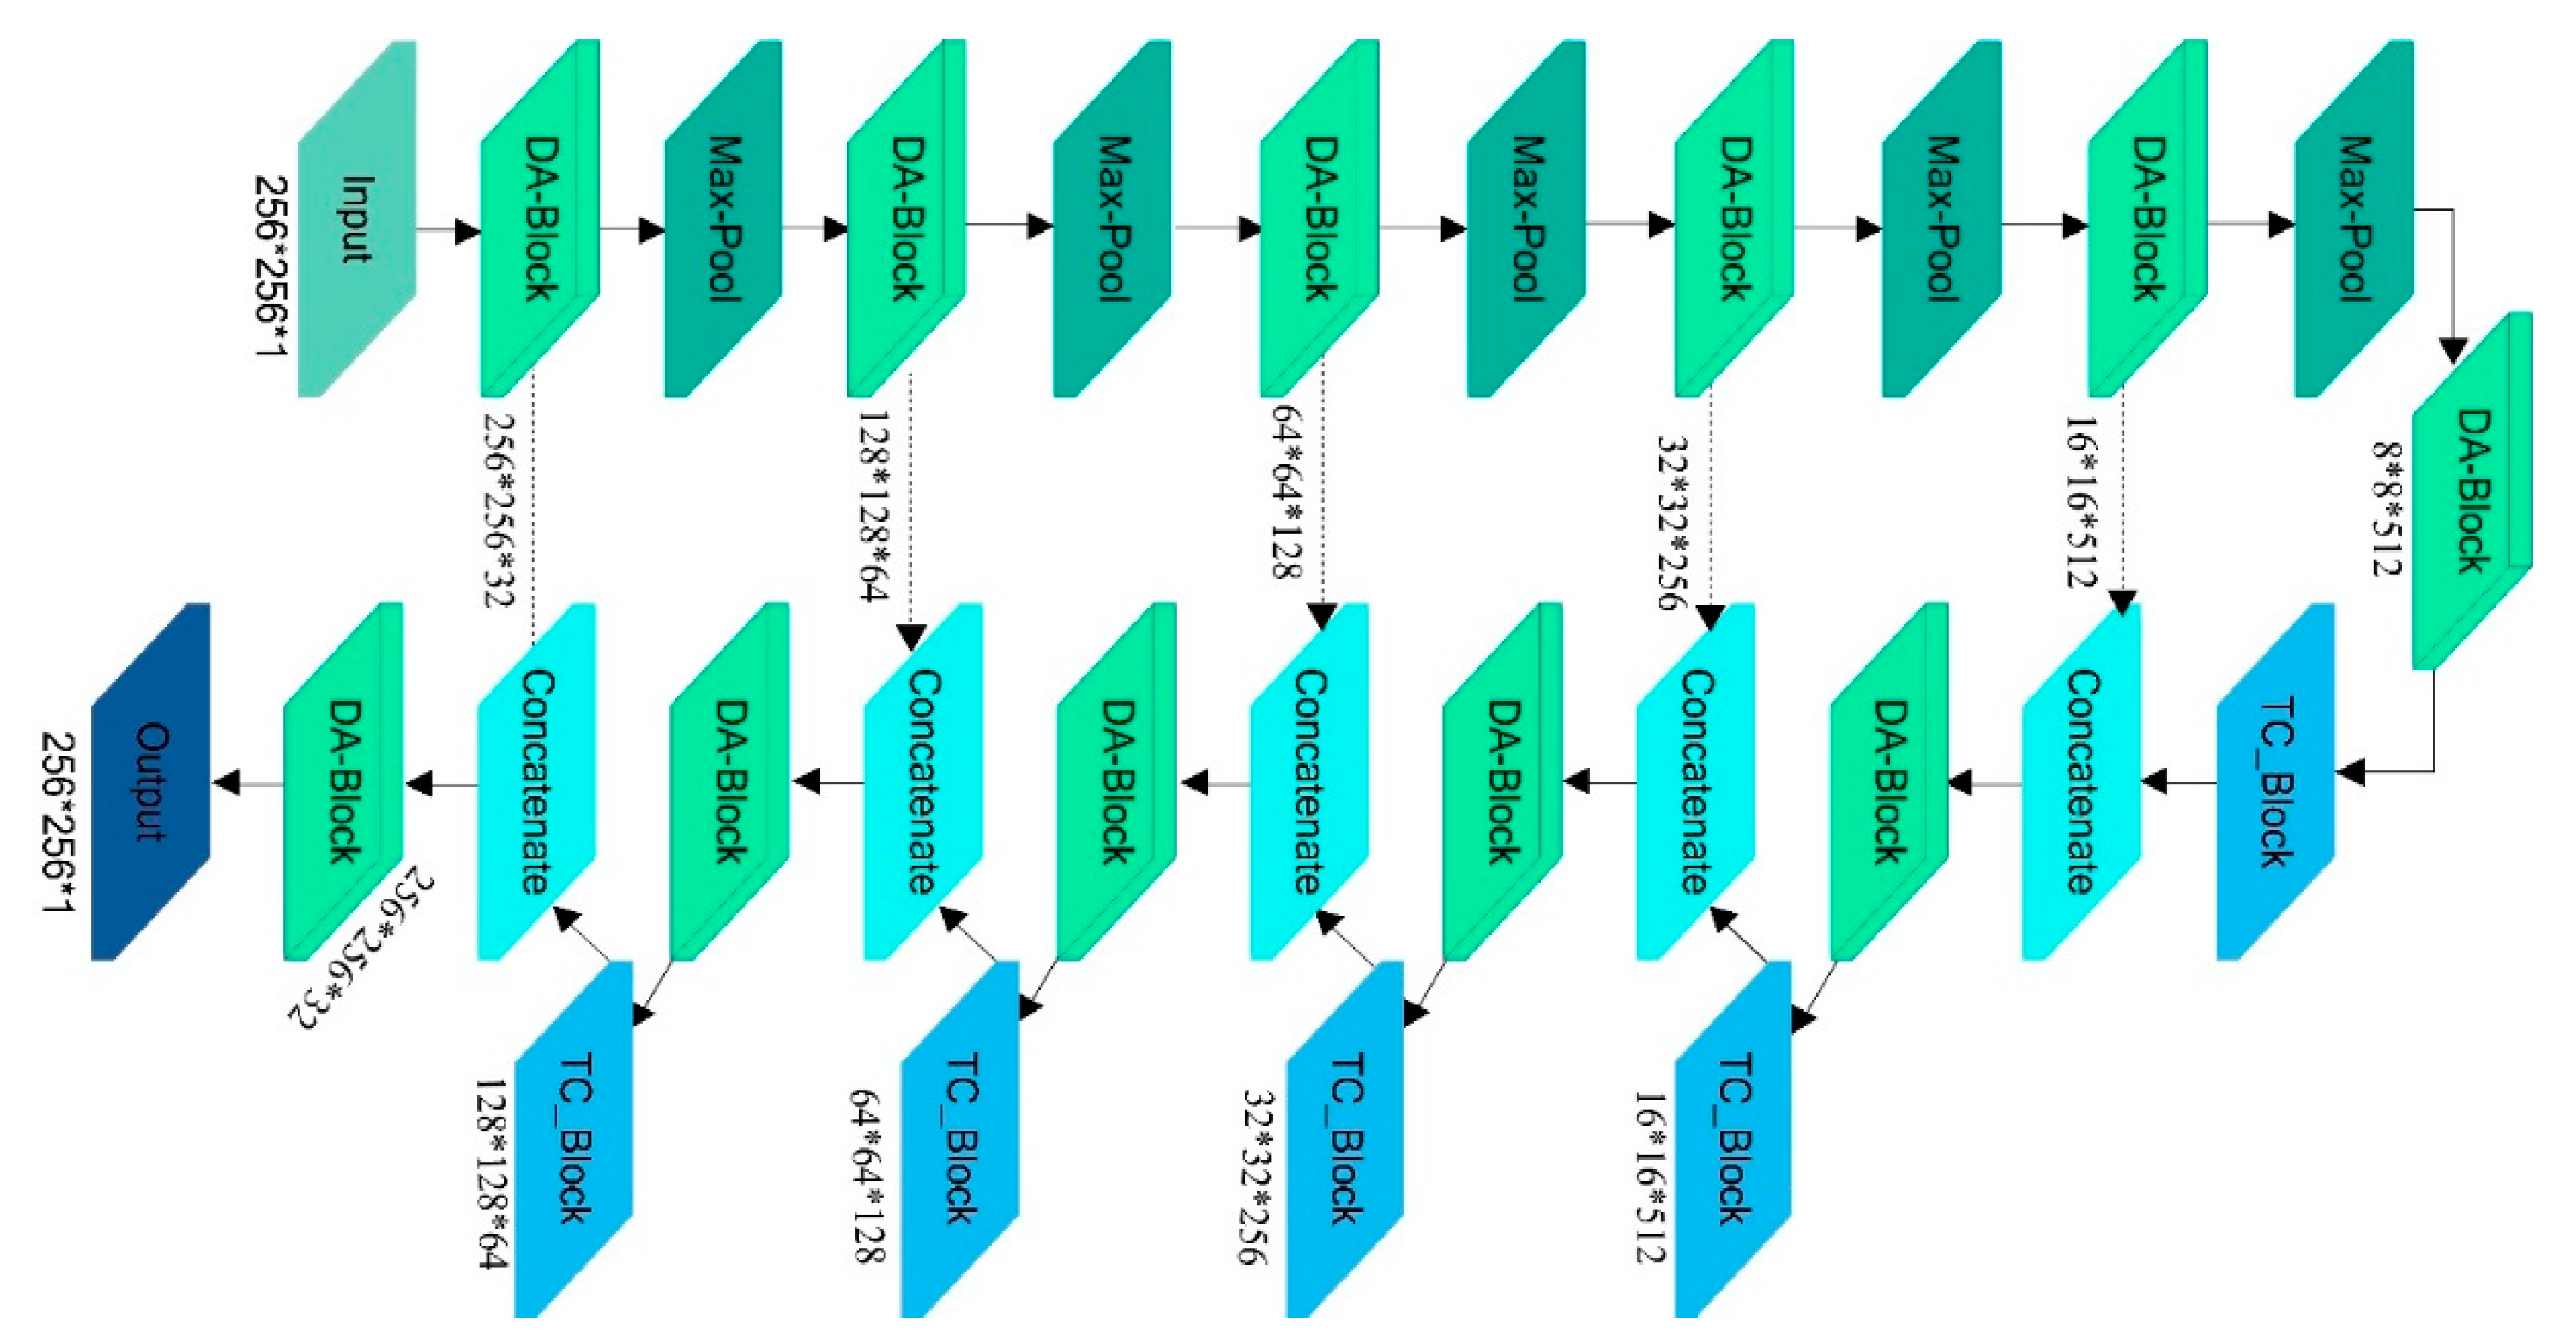
We propose a novel U-Net based architecture named DA-Net whose input is a lung ROI image with their ground masks to segment the lung nodules. Our proposed framework follows an end-to-end approach for the segmentation of lung nodules. A U-Net is an efficient segmentation algorithm in biomedical image segmentation. It consists of three main parts named a contracting path, a bottleneck path, and an expansion path. We improved the original U-Net to achieve better results. The complete architecture of the encoder, decoder, and bottleneck part of our DA-Net is also shown in Figure 4.
3.3.1. Encoder Path
The encoder path of our DA-Net consists of five DA blocks instead of simple four convolutional blocks, as is the case in the original U-Net. The increase in depth of the network results in the extraction of deeper features to discriminate the nodules region from the non-nodules region. Each DA block is composed of dense deep blocks and dense Atrous blocks. In each dense deep block, as shown in Figure 5, there are three convolutions of size , followed by batch-normalization [63] and Leaky ReLu [64] activation function as per Equation (3):
Usually, the negative part of features is ignored by ReLu [65] activation function and causes the problem of dying neurons, which can be solved by the Leaky ReLu activation function [65]. After every convolution operation, we introduced a batch normalization, which made training faster by normalizing the input values using mean and variance. Batch normalization increases the performance of the network and makes the weight initialization process easier. A batch consists of different examples such as , with each represented as D-dimensional vector, being given as an input to the batch normalization layer. All inputs to layer in the form of are given as a matrix in which each represents each example. Equation (4) is used to normalize each example.
Here, are the mean and variance. The equations for mean and variance are given by Equations (5) and (6)
Besides this, the densely connected convolutions [22] in our DA-Net combine the features maps resulting from one convolutional layer to all the next convolution layers to obtain more dense and rich features, as shown in Figure 5. Thus, every layer receives input of the feature-maps produced by all previous layers . Therefore,
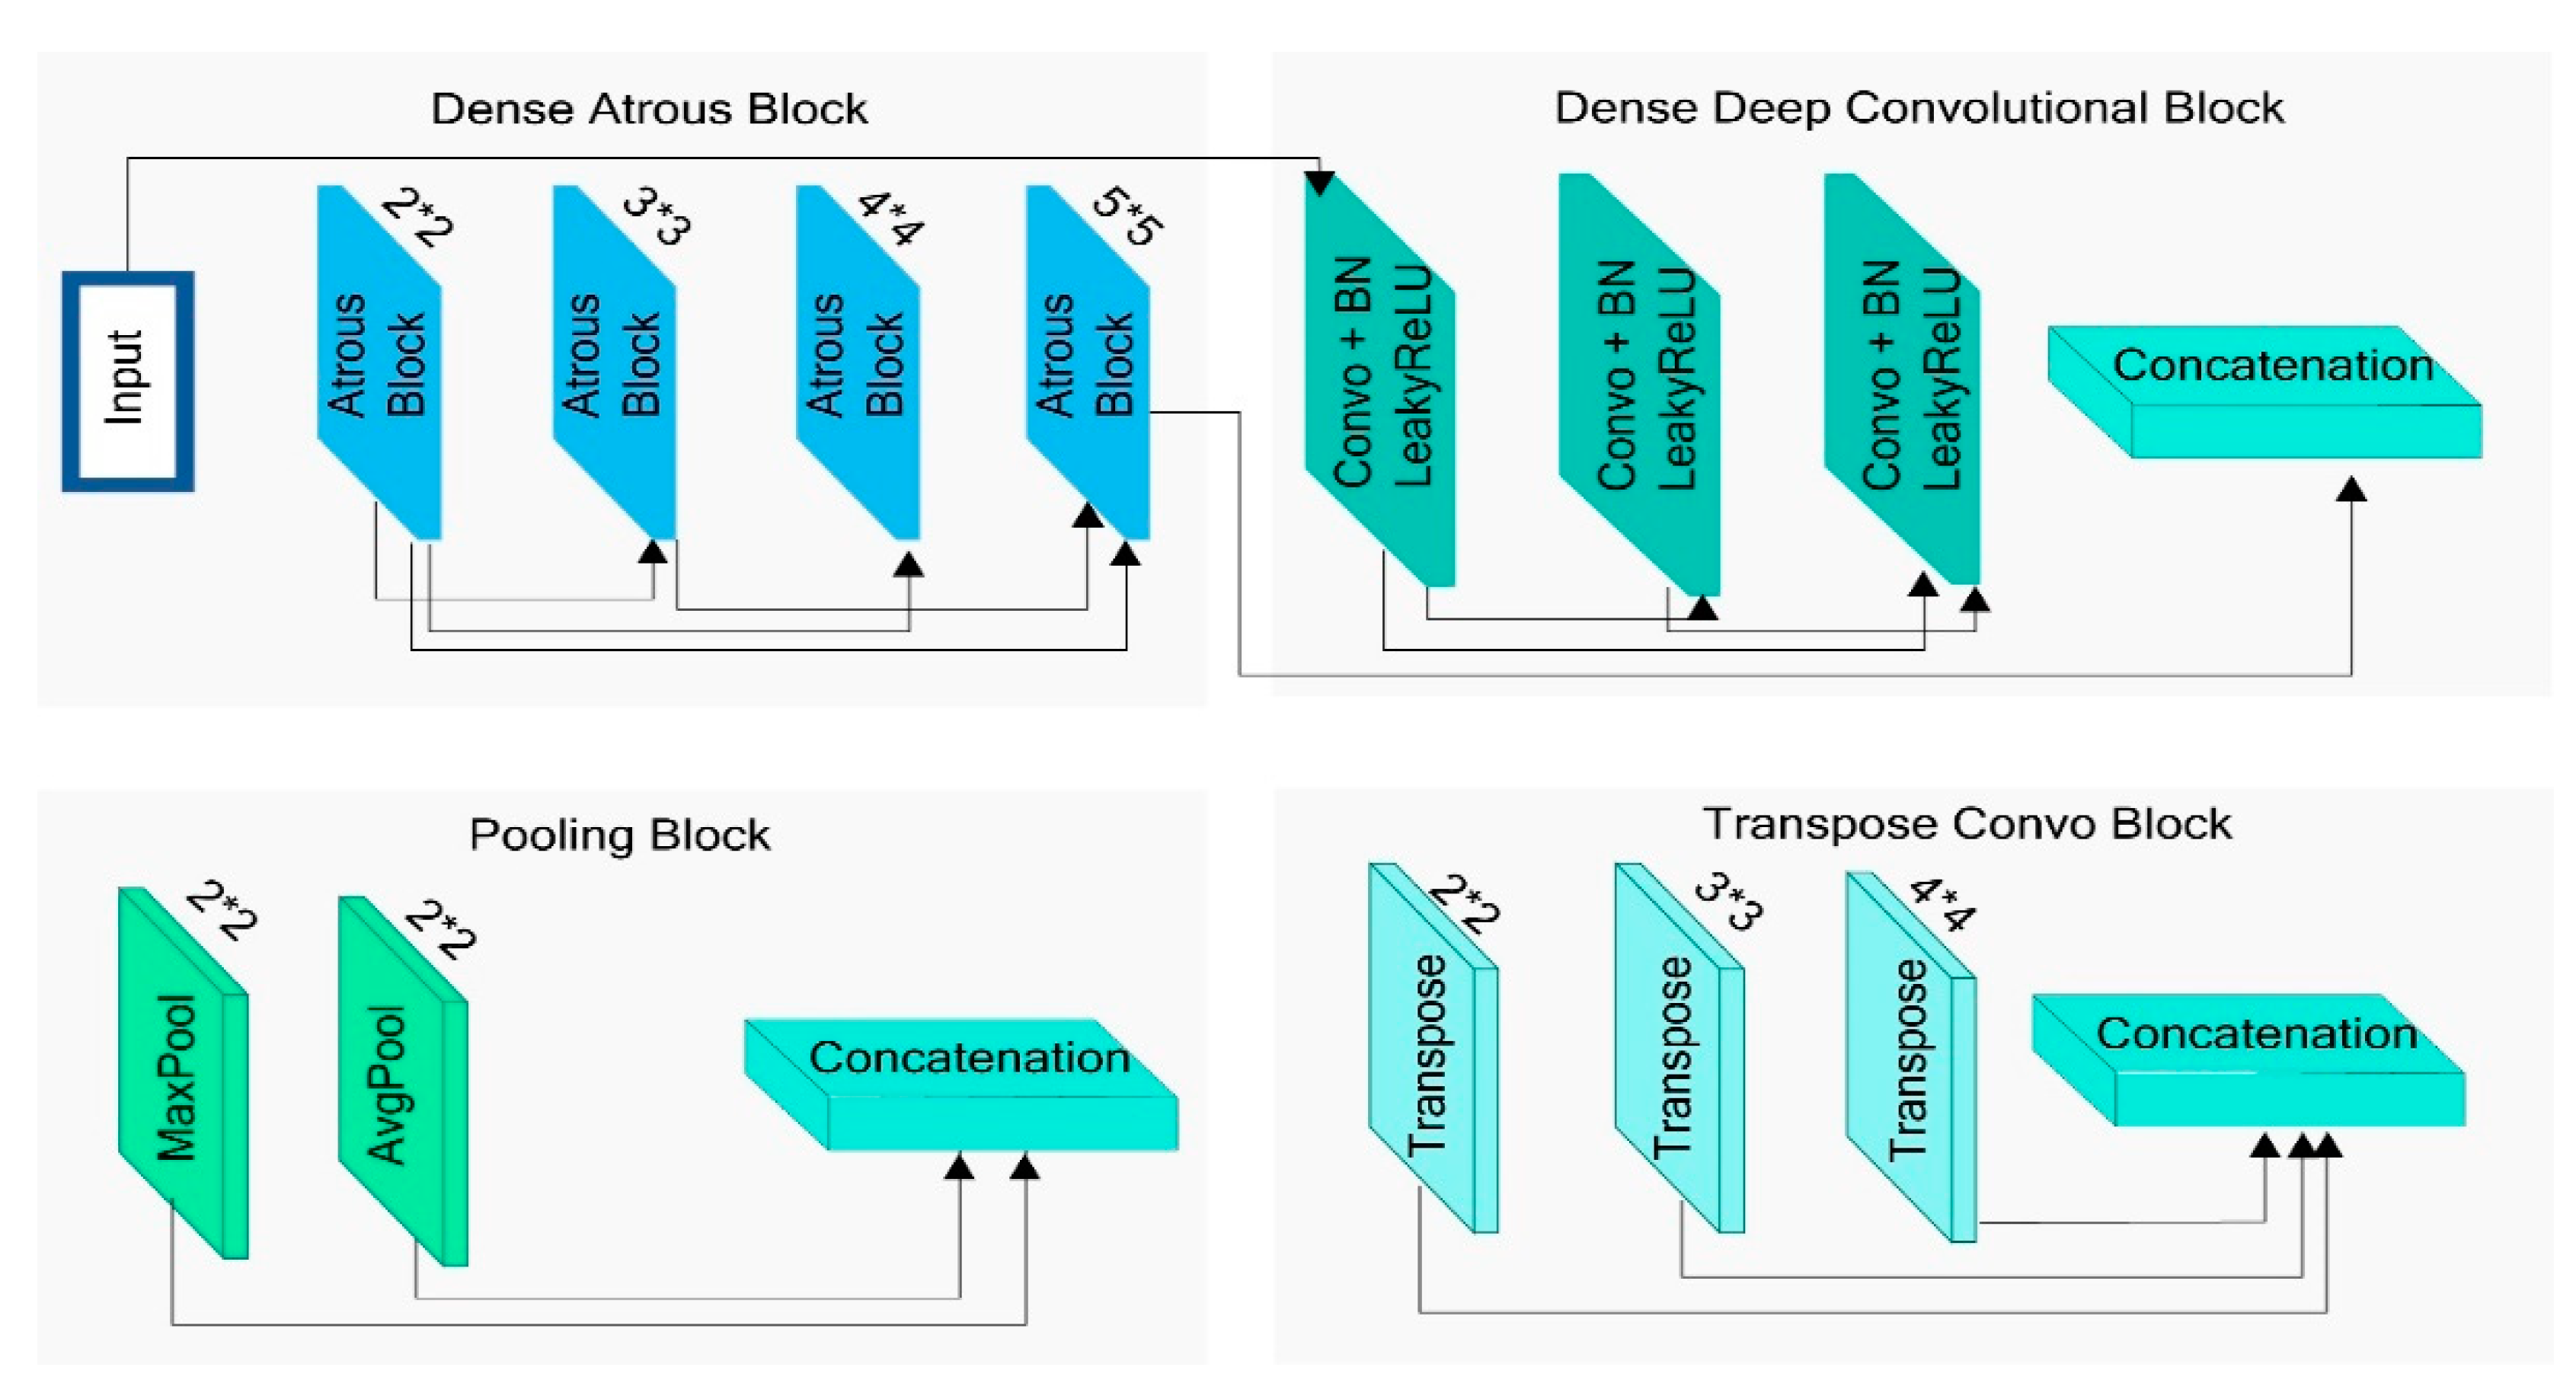
where refers to the feature map’s concatenation generated from layers . Besides this, the results of the dense deep block are also concatenated with densely connected Atrous convolutions in the Atrous block, as shown in Figure 5. In the Atrous convolution block, the Atrous convolutions of rates , , and are used with a kernel size of , followed by batch normalization and Leaky ReLu activation function. For Atrous convolutions, we had a feature map , which is a two-dimensional input signal, and a kernel , also called filter; then, the output at every location is computed as in Equation (8):
In Equation (8), with the help of the parameter, the input signal is sampled, which is simply a stride, and its operation is similar to the convolution operation on an input , with kernels , which is upsampled by inserting zero among consecutive filter values along each spatial dimension. A similar method has been adopted on the infinite line for the detection of opinion evolution in social networks [66]. Besides this, in the whole downsampling path, we use two types of pooling of size after every convolution block. One is average pooling, and the other is max pooling, as shown in Figure 5, followed by a dropout rate of 0.05 to stop the model from overfitting. The output of max-pooling is calculated by selecting the maximum value from the given input region, and it is defined by Equation (9):
In Equation (9), on the downsampling layer, the neuron is present on a position represented by on output map. In the region, , the maximum value, is selected and assigned to a neuron in the input map , while the average pooling provides the average value of the given input region. The results of both types of pooling are concatenated in the network. The total number of filters on each of our five DA blocks, which are further composed into dense deep and Atrous blocks, are 16, 32, 64, 128, and 256. The encoder path of DA-Net helps to extract the semantic information from an image by downsampling it with the help of convolution and pooling layers.
3.3.2. Bottleneck Path
The bottleneck part of our proposed DA-Net also consists of densely connected deep convolution block and Atrous convolutions that constitute our DA block, as shown in Figure 4.
3.3.3. Decoder Path
Furthermore, on the decoder path of our DA-Net, we employed three different kernel sizes of transpose convolution in DA-Net, which were , and and the results of all of them were concatenated to best localize the nodule, as shown in Figure 4. The transpose convolution serves as a deconvolution layer and upsamples images with proper learning instead of upsampling operation that upsample the image without learning. After the transposed convolution, a concatenation operation is performed between feature maps returned by each transposed convolution with corresponding results of the encoder path. The loss of spatial and location information in the encoder path is recovered in the decoder path of DA-Net with the help of concatenation of the encoder part to the decoder part. It combines both contextual and localization information of lung nodules in the lungs.
3.4. Training Details and Hyper Parameters
The lung ROI images, and their corresponding ground masks are used to train the network. To optimize weights, we used an Adam optimizer with a learning rate set to 0.0001. In Adam optimizer, an RMSprop and stochastic gradient descent is used along with momentum term. The equation to update weights in Adam optimizer is given by Equation (10):
where weights of the model are represented by , which is then optimized in several iterations, and represents the step size. The values of and are given in Equation (11):
Here in our research work, the default values of and are used, which are 0.9 and 0.999, respectively. The values of and are computed using Equations (12) and (13), respectively:
In Equations (12) and (13), g denotes the gradient of the current mini-batch. Besides this, binary cross-entropy is used as a loss function in our model, and it is defined in Equation (14):
where represents the predicted class label of the pixel in our model outputs, while the predicted probability is represented by of our trained model for all pixels classified as background or nodule class.
4. Experiments and Results
This section provides set of experiments being performed, and evaluation criteria used in this research work, followed by some comparisons with existing work.
4.1. Evaluation Criteria
To evaluate segmentation results from all three proposed models in this research, we used symmetric volume difference (SVD) as the primary evaluation factor. SVD provides a difference between segmented and actual ground truth images. Another primary evaluation parameter used in our evaluation is the Dice similarity coefficient (DSC), which calculates the overlap of two segmentation results. Furthermore, the IOU score and sensitivity [3,4,67,68,69,70,71] (SEN) are used as auxiliary evaluation parameters. Equations (15)–(18) represent their definitions.
where TP refers to true positive, FP refers to false positive, and FN refers to the false negative in the actual and segmented mask of lung nodules.
4.2. Results
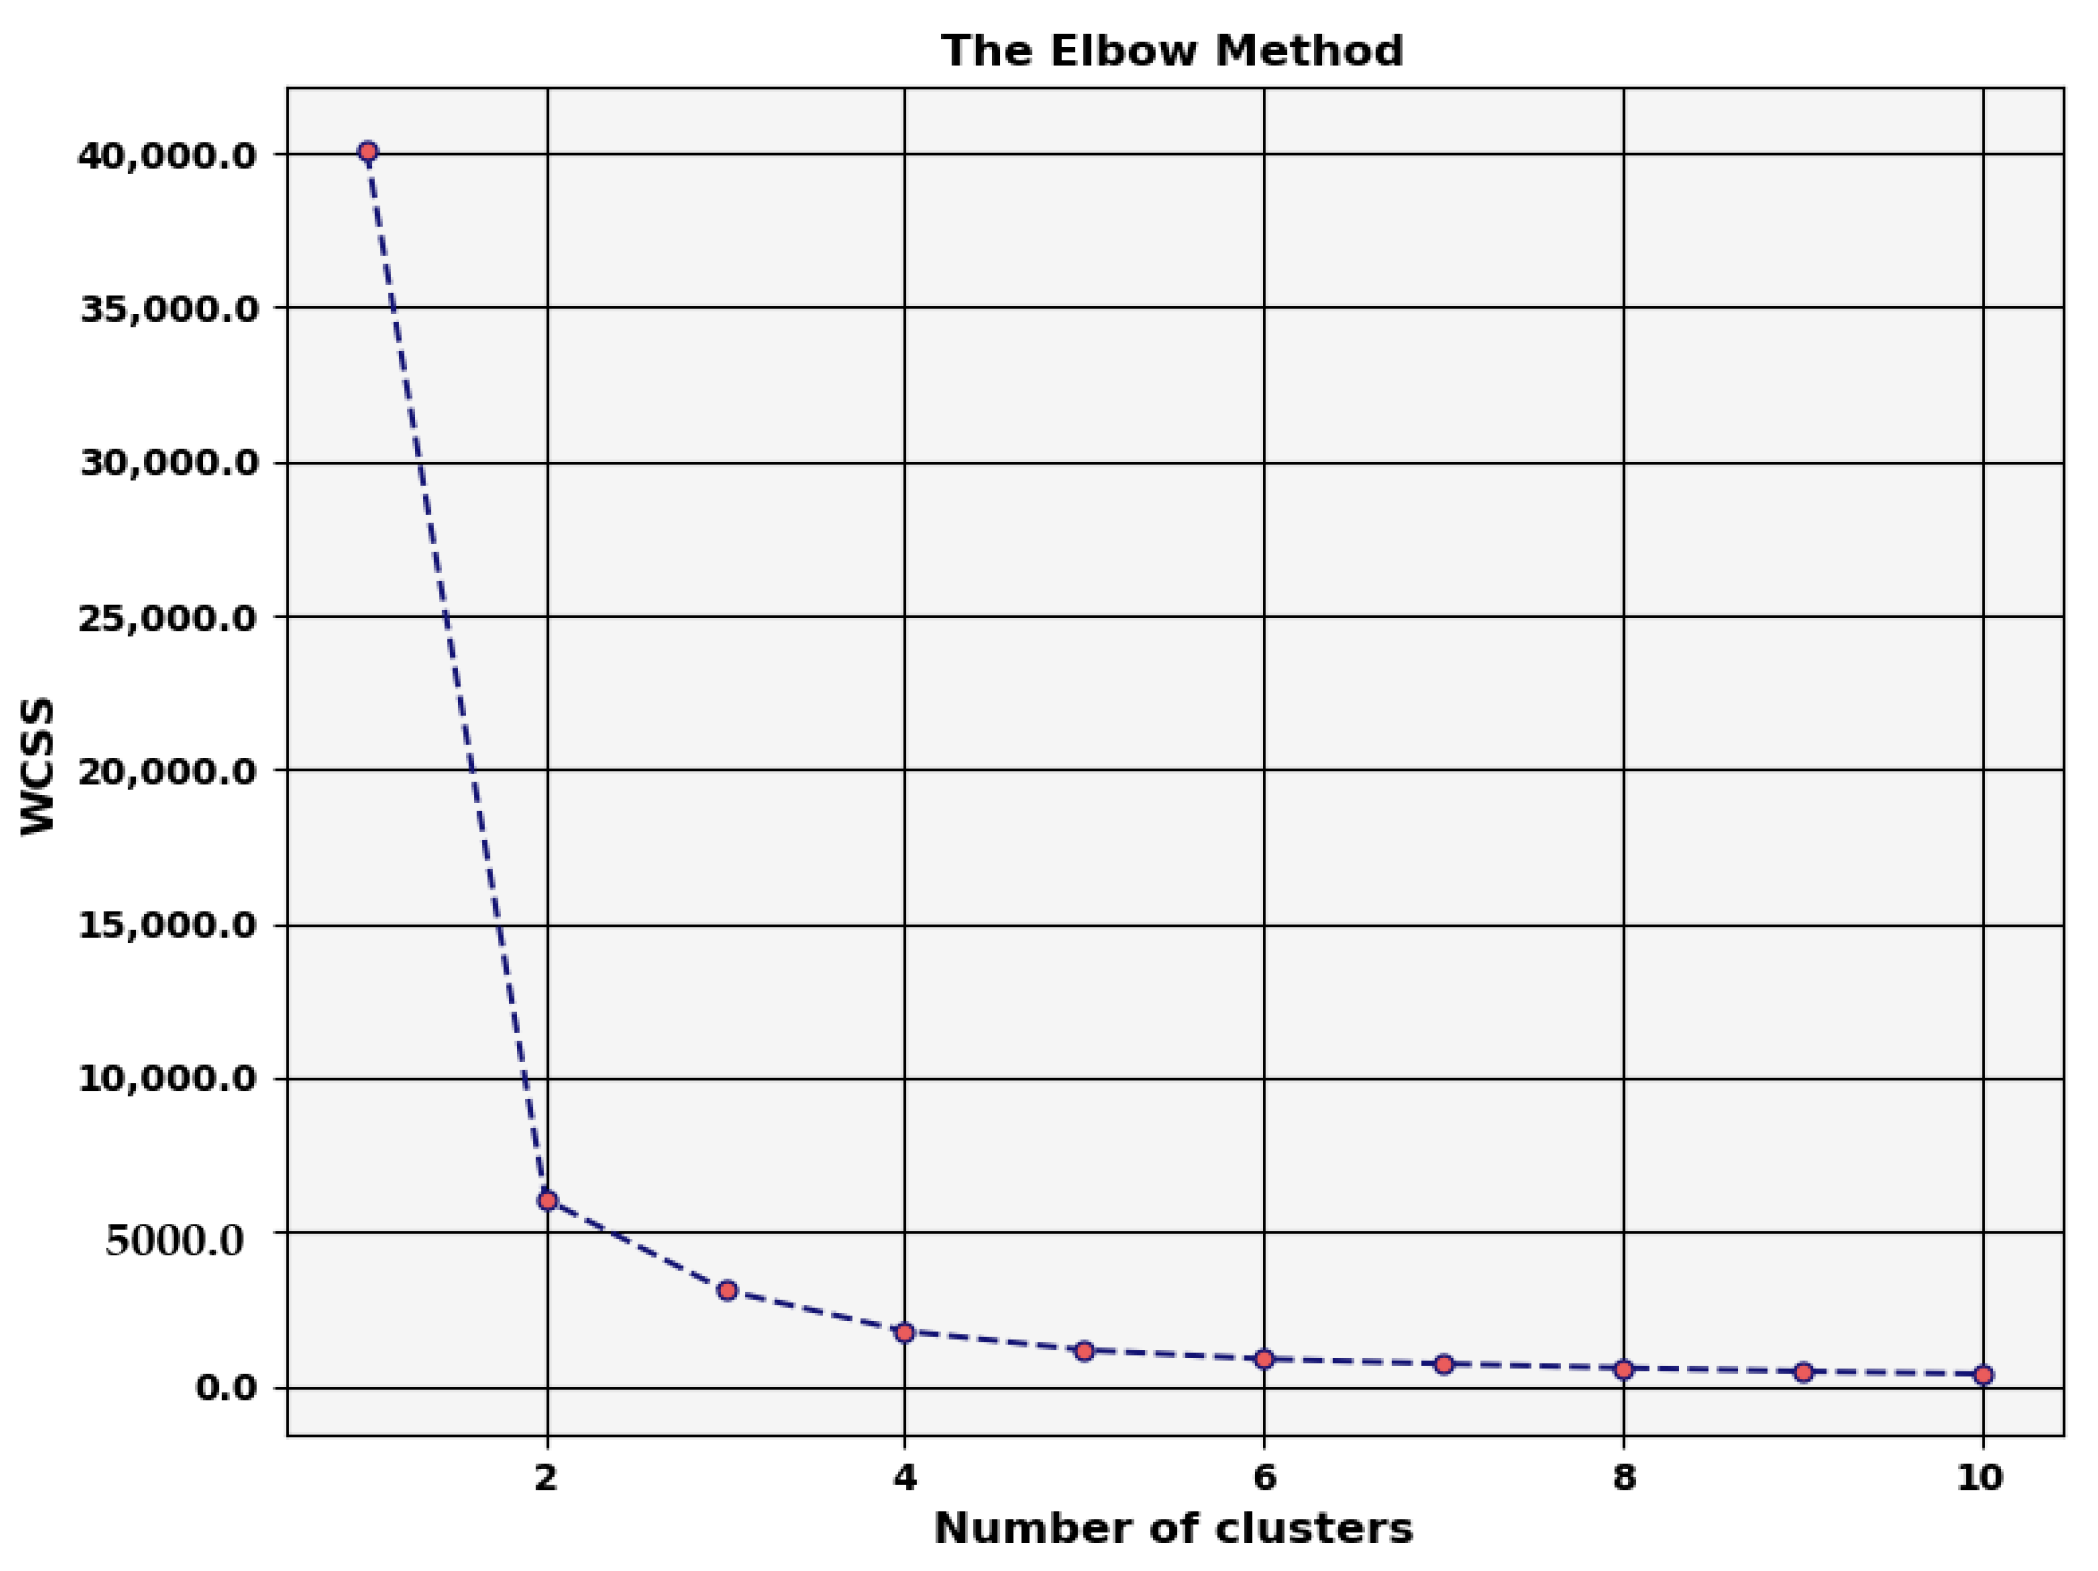
For detecting and segmenting lung nodules more efficiently and before giving input to the model, we performed some pre-processing steps, as explained in Section 3. These operations included standard operations, morphological operations, and k-means clustering. The optimal number of clusters for k-means clustering was found through the elbow method, as shown in Figure 6.
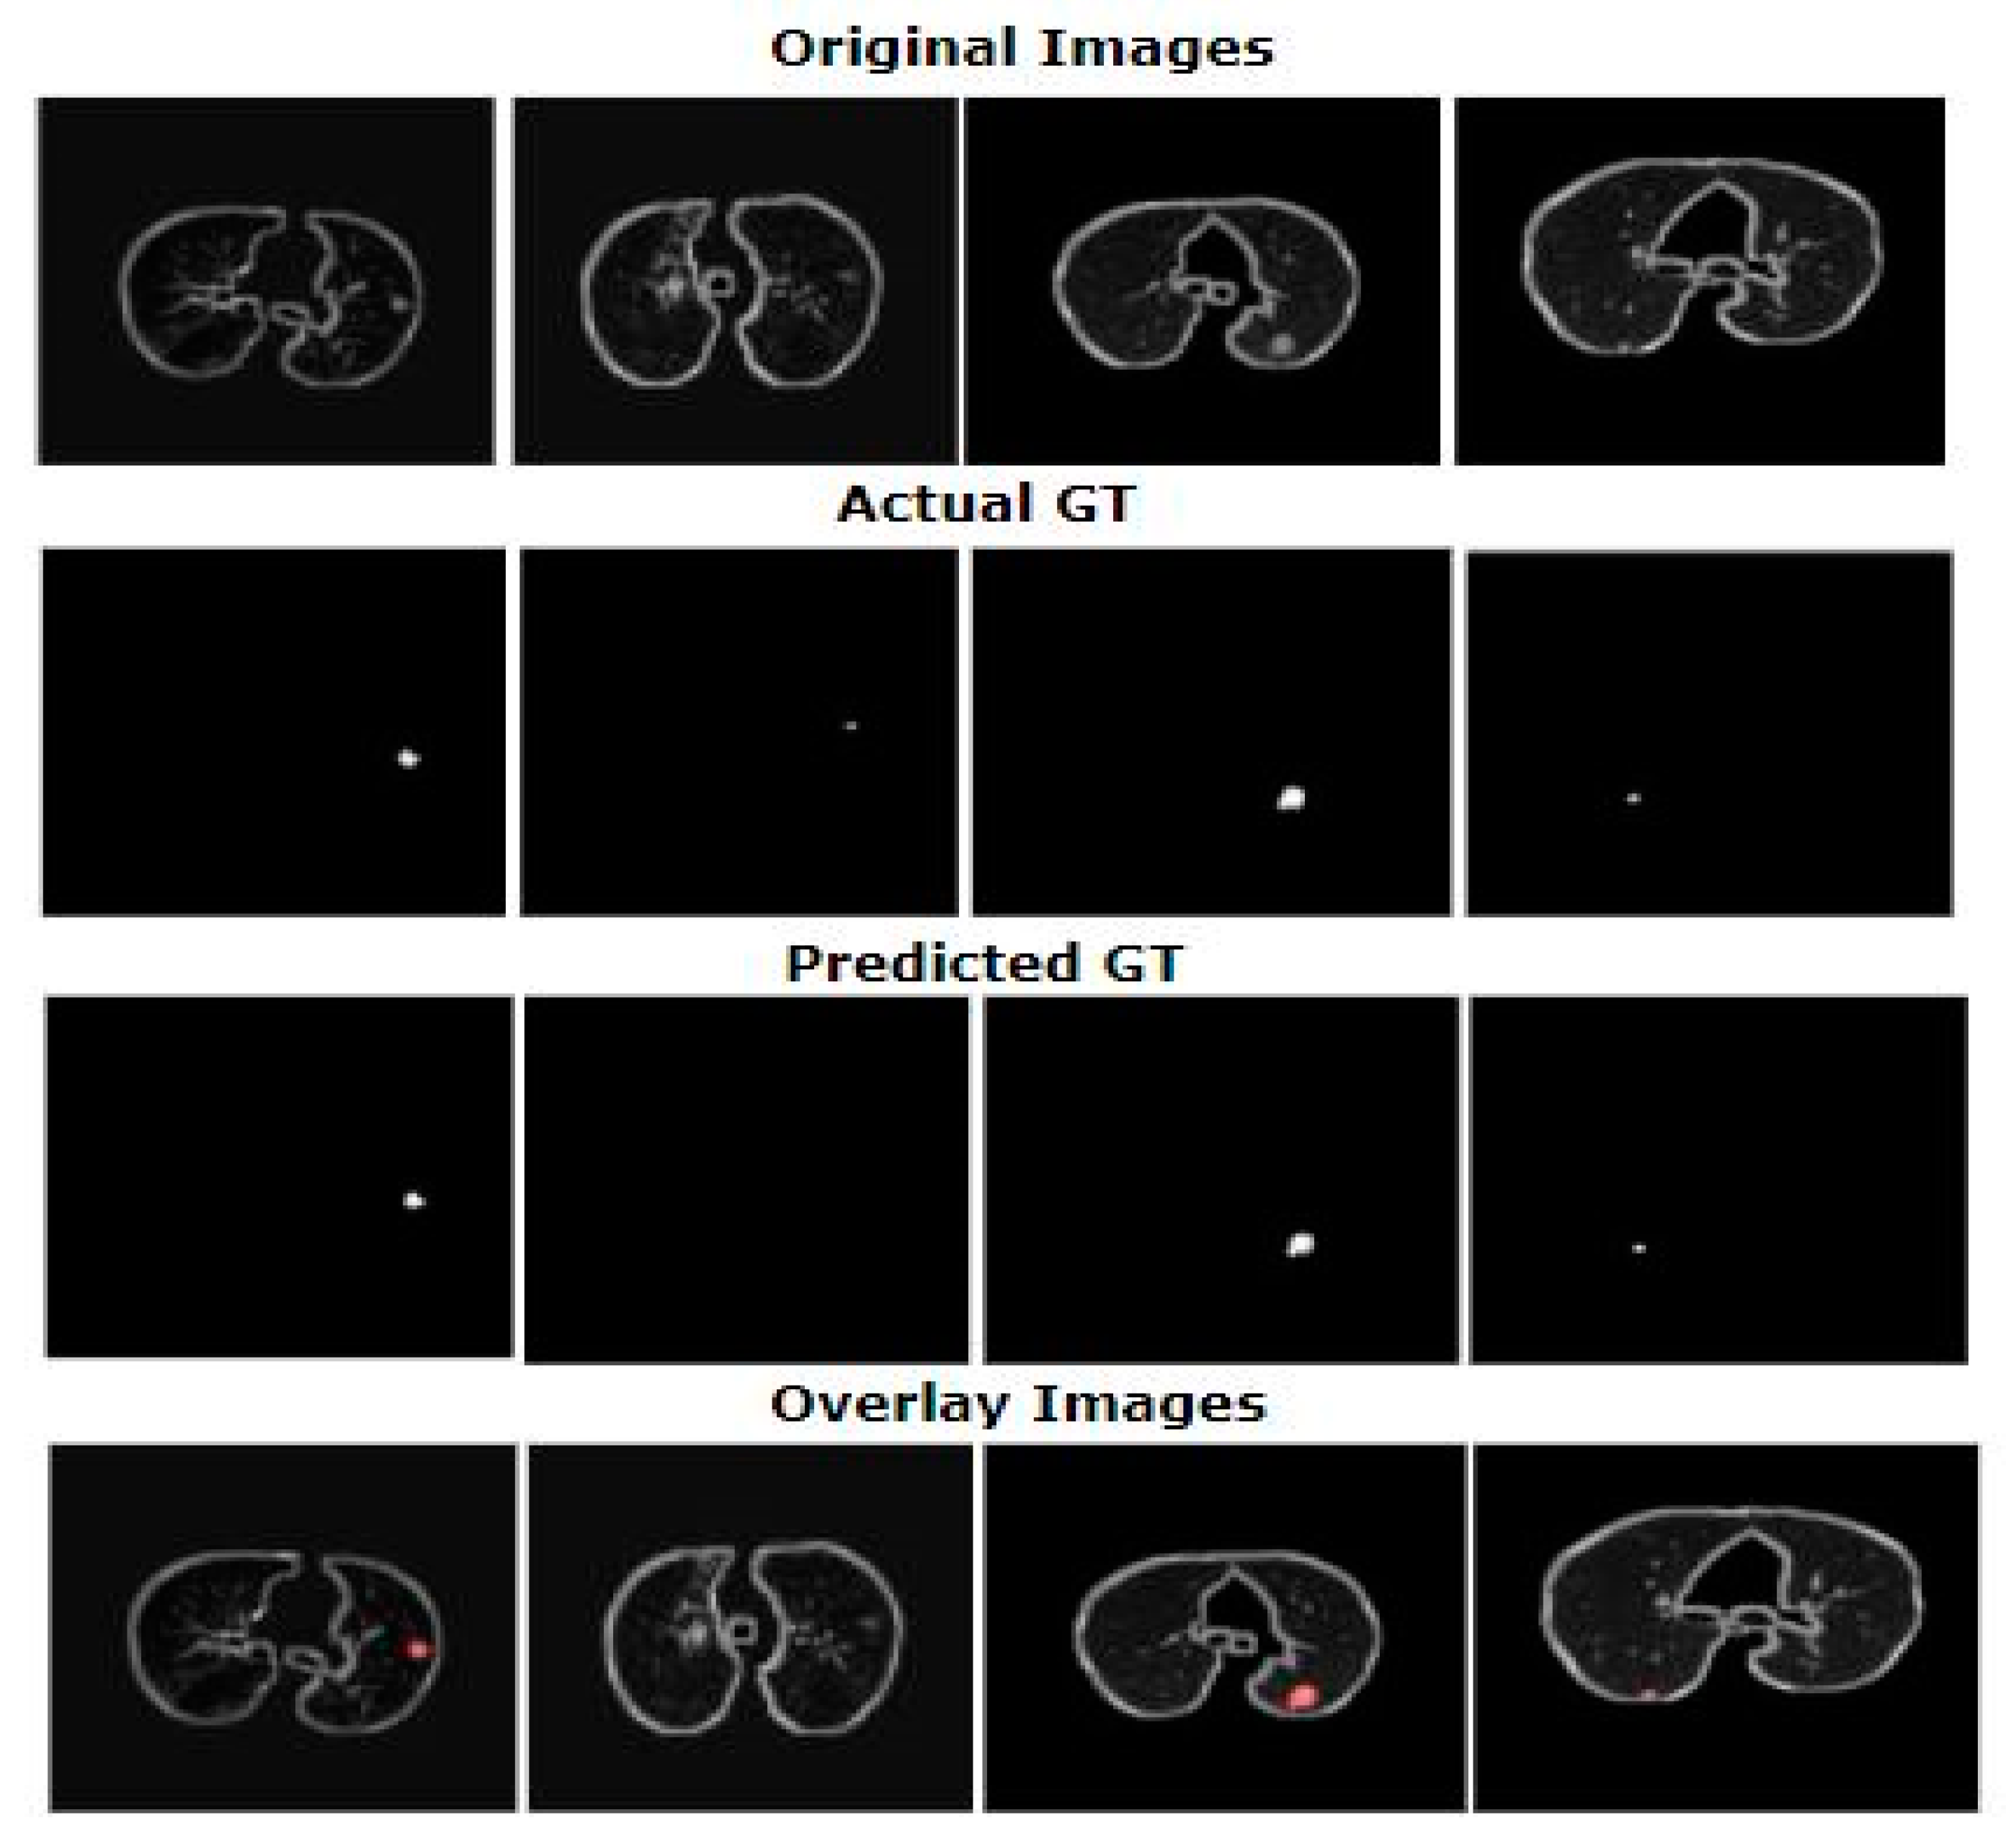
Figure 7 shows the segmentation results of DA-Net. As shown in Figure 7, row 1 shows the original images, row 2 shows the actual ground truth, row 3 shows the predicted masks by the segmented model, and the last row shows the overlay images of lungs. In row 1, the first image is an example of a tiny and juxtapleural nodule that has a very high similarity to lung walls. It was clearly observed that our model correctly segmented this type of nodule. Similarly, the second image in row 1 is an example of a non-solid nodule that is not segmented by the model. Furthermore, the proposed model correctly segmented the juxtavascular and well-circumscribed nodule shown in the third image of row 1, as well as the tiny nodule shown as the fourth image in row 1. Therefore, proposed model showed good performance in segmenting different types of nodules with heterogeneous characteristics.
Table 1 provides complete detail regarding the proposed model and values of different scores. It is evident from Table 1 that the results of the proposed DA-Net were good when it came to nodular segmentation. This particular model demonstrated great performance with a Dice score value of 81%. However, when compared with U-Net, the results of this model were comparatively higher. The values for SVD and sensitivity exhibited by the proposed DA-Net were 0.19% and 87.2%, respectively. Moreover, the IOU score achieved by DA-Net was 71.6%. Furthermore, the different scores achieved by U-Net were 71.0% Dice score, 62.8% IOU score, 0.29 SVD, and 70.2% sensitivity.
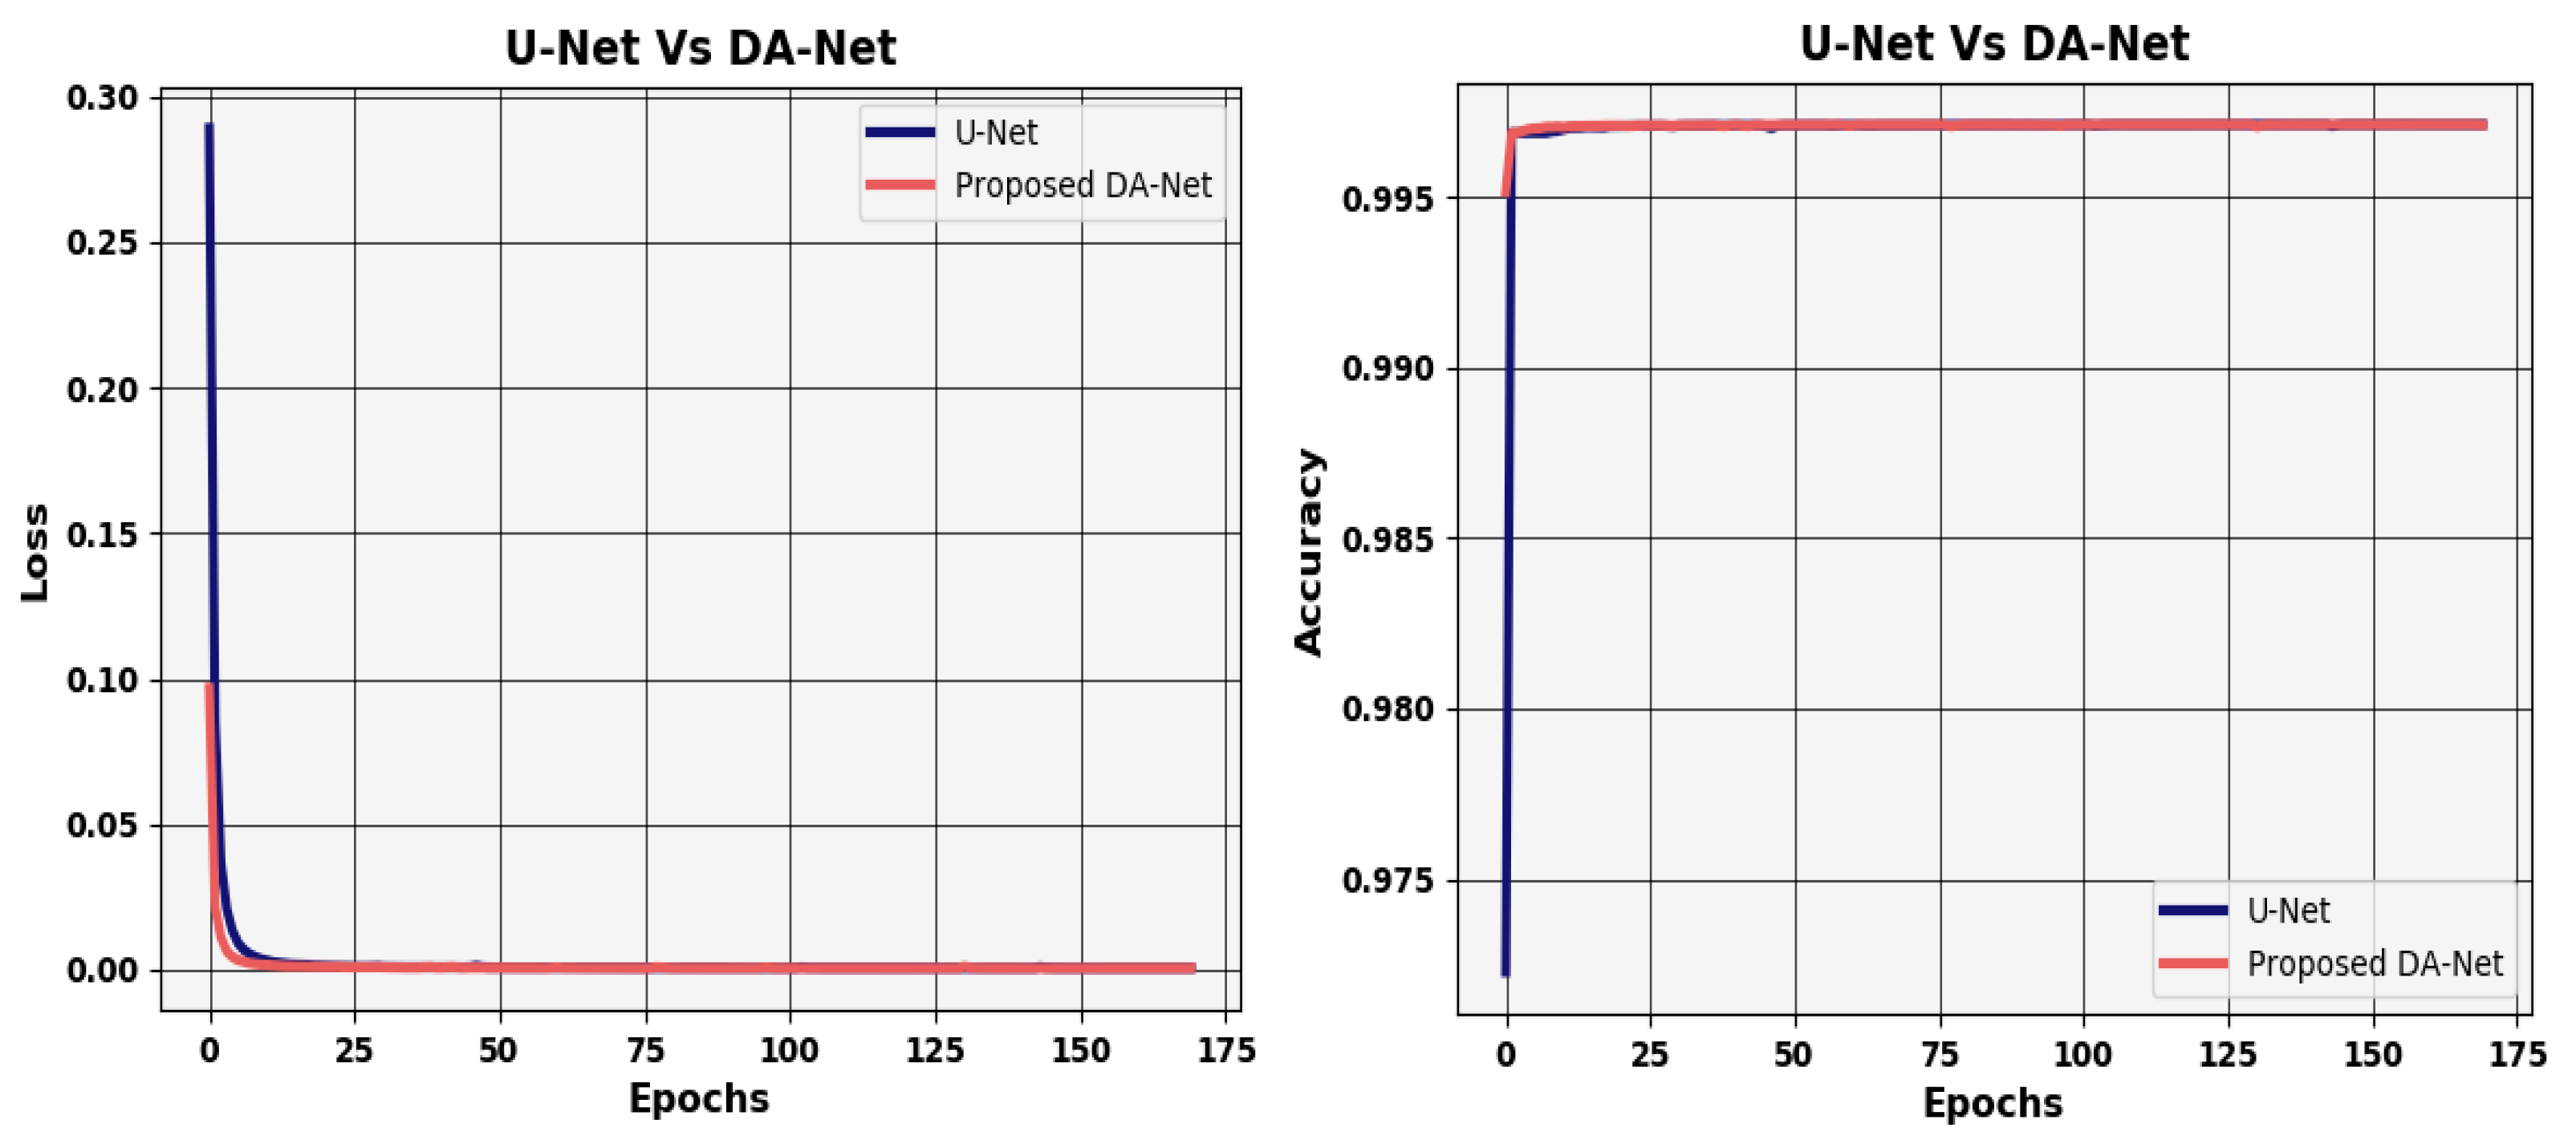
Furthermore, the inaccurate and wrong predictions performed by the proposed model are referred to as model loss over a single instance. The value of model loss should be close to zero to perform efficient prediction. Usually, the loss of a perfect model is very near to zero. We also checked model’s loss over iterations in comparison with U-Net, which is shown in Figure 8. Similarly, in general, the number of correct predictions by the proposed model is given by the accuracy of the model. The efficiency of the model is indicated by the higher value of accuracy. We also validated proposed model in order to determine its accuracy over each epoch of the model. The accuracy of proposed DA-Net in comparison with U-Net during network training is shown in Figure 8.
4.3. Discussions
The results presented in Section 4.2 reveal that proposed model provides good results in segmenting nodules of different types. The efficient construction of layers with dense connections merged with Atrous convolution boosted the process of feature learning of the model. The dense connections enabled feature reusability in the network and controlling the problems of vanishing gradients. The different types of pooling and different scales of transposed convolutions helped to obtain the information for different sizes of nodules. The efficient and careful design of layers improved the process of feature extraction of the model. The existing methods also adopt deep learning-based algorithms for the automated segmentation of nodules, achieving very good results [42,44,46]. In addition to all these previous design approaches, the proposed variant of deep learning algorithm based on U-Net showed significant improvements over the existing algorithms. The layers of the proposed model are designed in such a way that the process of feature learning is improved, and the model extracts more discriminative features for segmentation. Moreover, the preprocessing part also plays an important role in the increased performance of the model. Existing methods work by first extracting the various number patches of nodules from the CT slices of different sizes as a preprocessing step [42,72]. Here, we changed the approach, and instead of giving patches to the model, we extracted the ROIs from the CT scan image. Therefore, this research also contributes to the problem of automated lung nodule segmentation.
Furthermore, to validate the proposed model in terms of evaluation metrics, we compared our methodology with existing approaches in detail. Table 2 shows detail of various techniques along with the evaluation parameters such as Dice score and IOU score. According to the analysis, many researchers have proposed improved techniques and have achieved excellent results for lung nodule segmentation. When a comparison was carried out, the DSC value of the model proposed by Shen et al. [42] was 78.55%, and it was further improved by Huang et al. [73] in the following year. Wang et al. [44] proposed their technique and achieved a value of DSC of 77.67. Wu et al. [74] presented their approach, achieving a DSC value of 74.05% and an IOU score of 58%. Some recent works include the work of Qian et al. [46]. They achieved a Dice score value of 62.8% and an IOU score of 71.93. Moreover, Hancock et al. [75] and Huang et al. [47] achieved IOU scores of 71.85 and 70.24, respectively.
The above comparison with existing approaches revealed that proposed model achieves better performance.
5. Conclusions
Lung nodular segmentation is a critical topic to deal with due to the same visual attributes of nodules. There is a noisy neighboring region around nodules that also causes inaccuracy in segmentation and decline in performance. To address these issues and to obtain good segmentation of lung nodules, we proposed a U-Net-based improved data-driven model. The proposed model extract features by densely connected convolution blocks and Atrous convolution blocks. The experimental setup was performed over the LIDC-IDRI dataset that comprises 986 sample nodular images. Furthermore, we conducted an elaborated comparison analysis to validate our methodology. It is clear from the comparison drawn that the proposed model in this research study is suitable for lung nodular segmentation, with a DSC of 81% and an IOU score of 71.6%. Results have also shown that the DA-Net model can segment out complex nodular cysts such as juxtapleural and tiny nodules. Our proposed model can be useful for radiologists in the diagnosis of lung cancer in time. In the future, we aim to design a lung nodule detection algorithm based on DSSD (deconvolution single-shot detector) network architecture that can enhance the efficiency of the proposed method.
Author Contributions
Conceptualization, I.M.; formal analysis, M.M., M.B. and S.Y.; investigation, M.B. and S.Y.; methodology, M.M. and M.K.; validation, visualization, writing—original draft, I.M.; writing—review and editing, M.K. and M.M. All authors have read and agreed to the published version of the manuscript.
Funding
This research was supported in part by a grant of the Korea Health Technology R&D Project through the Korea Health Industry Development Institute (KHIDI), funded by the Ministry of Health and Welfare, Republic of Korea (grant number: HI19C0870), and part by Korea Institute for Advancement of Technology (KIAT) grant funded by the Korean Government (MOTIE) (P0012724, The Competency Development Program for Industry Specialist).
Institutional Review Board Statement
Not Applicable.
Informed Consent Statement
Not Applicable.
Data Availability Statement
Not Applicable.
Conflicts of Interest
The authors declare no conflict of interest.
References
- Siegel, R.L.; Miller, K.D.; Jemal, A. Cancer statistics, 2016. CA Cancer J. Clin. 2016, 66, 7–30. [Google Scholar] [CrossRef] [Green Version]
- Firmino, M.; Morais, A.H.; Mendoça, R.M.; Dantas, M.R.; Hekis, H.R.; Valentim, R. Computer-Aided detection system for lung cancer in computed tomography scans: Review and future prospects. Biomed. Eng. Online 2014, 13, 1–16. [Google Scholar] [CrossRef] [Green Version]
- Thomas, G.A.S.; Robinson, Y.H.; Julie, E.G.; Shanmuganathan, V.; Nam, Y.; Rho, S. Diabetic retinopathy diagnostics from retinal images based on deep convolutional networks. Preprints 2020. [Google Scholar] [CrossRef]
- Nawaz, H.; Maqsood, M.; Afzal, S.; Aadil, F.; Mehmood, I.; Rho, S. A deep feature-based real-time system for Alzheimer disease stage detection. Multimed. Tools Appl. 2020, 1–19. [Google Scholar] [CrossRef]
- Jung, S.; Moon, J.; Park, S.; Rho, S.; Baik, S.W.; Hwang, E. Bagging ensemble of multilayer perceptrons for missing electricity consumption data imputation. Sensors 2020, 20, 1772. [Google Scholar] [CrossRef] [Green Version]
- Aerts, H.J.; Velazquez, E.R.; Leijenaar, R.T.; Parmar, C.; Grossmann, P.; Carvalho, S.; Bussink, J.; Monshouwer, R.; Haibe-Kains, B.; Rietveld, D. Decoding tumour phenotype by noninvasive imaging using a quantitative radiomics approach. Nat. Commun. 2014, 5, 1–9. [Google Scholar] [CrossRef]
- Reeves, A.P.; Chan, A.B.; Yankelevitz, D.F.; Henschke, C.I.; Kressler, B.; Kostis, W.J. On measuring the change in size of pulmonary nodules. IEEE Trans. Med. Imaging 2006, 25, 435–450. [Google Scholar] [CrossRef] [PubMed]
- Lassen, B.; Jacobs, C.; Kuhnigk, J.; Van Ginneken, B.; Van Rikxoort, E. Robust semi-automatic segmentation of pulmonary subsolid nodules in chest computed tomography scans. Phys. Med. Biol. 2015, 60, 1307. [Google Scholar] [CrossRef]
- Farag, A.A.; Abd El Munim, H.E.; Graham, J.H.; Farag, A.A. A novel approach for lung nodules segmentation in chest CT using level sets. IEEE Trans. Image Process. 2013, 22, 5202–5213. [Google Scholar] [CrossRef]
- Kubota, T.; Jerebko, A.K.; Dewan, M.; Salganicoff, M.; Krishnan, A. Segmentation of pulmonary nodules of various densities with morphological approaches and convexity models. Med. Image Anal. 2011, 15, 133–154. [Google Scholar] [CrossRef]
- Zhang, G.; Jiang, S.; Yang, Z.; Gong, L.; Ma, X.; Zhou, Z.; Bao, C.; Liu, Q. Automatic nodule detection for lung cancer in CT images: A review. Comput. Biol. Med. 2018, 103, 287–300. [Google Scholar] [CrossRef]
- Paing, M.P.; Choomchuay, S. Ground glass opacity (GGO) nodules detection from lung CT scans. In Proceedings of the 2017 International Symposium on Electronics and Smart Devices (ISESD), Yogyakarta, Indonesia, 17–19 October 2017; pp. 230–235. [Google Scholar]
- Zhao, J.j.; Ji, G.H.; Xia, Y.; Zhang, X.L. Cavitary nodule segmentation in computed tomography images based on self-generating neural networks and particle swarm optimisation. Int. J. Bio-Inspired Comput. 2015, 7, 62–67. [Google Scholar] [CrossRef]
- Diciotti, S.; Lombardo, S.; Falchini, M.; Picozzi, G.; Mascalchi, M. Automated segmentation refinement of small lung nodules in CT scans by local shape analysis. IEEE Trans. Biomed. Eng. 2011, 58, 3418–3428. [Google Scholar] [CrossRef]
- Messay, T.; Hardie, R.C.; Rogers, S.K. A new computationally efficient CAD system for pulmonary nodule detection in CT imagery. Med. Image Anal. 2010, 14, 390–406. [Google Scholar] [CrossRef]
- Dehmeshki, J.; Amin, H.; Valdivieso, M.; Ye, X. Segmentation of pulmonary nodules in thoracic CT scans: A region growing approach. IEEE Trans. Med Imaging 2008, 27, 467–480. [Google Scholar] [CrossRef] [Green Version]
- Ye, X.; Beddoe, G.; Slabaugh, G. Automatic graph cut segmentation of lesions in CT using mean shift superpixels. Int. J. Biomed. Imaging 2010, 2010. [Google Scholar] [CrossRef]
- Messay, T.; Hardie, R.C.; Tuinstra, T.R. Segmentation of pulmonary nodules in computed tomography using a regression neural network approach and its application to the lung image database consortium and image database resource initiative dataset. Med. Image Anal. 2015, 22, 48–62. [Google Scholar] [CrossRef]
- Keshani, M.; Azimifar, Z.; Tajeripour, F.; Boostani, R. Lung nodule segmentation and recognition using SVM classifier and active contour modeling: A complete intelligent system. Comput. Biol. Med. 2013, 43, 287–300. [Google Scholar] [CrossRef]
- Ding, J.; Li, A.; Hu, Z.; Wang, L. Accurate pulmonary nodule detection in computed tomography images using deep convolutional neural networks. In Proceedings of the International Conference on Medical Image Computing and Computer-Assisted Intervention, Quebec City, QC, Canada, 10–14 September 2017; pp. 559–567. [Google Scholar]
- Pereira, S.; Pinto, A.; Alves, V.; Silva, C.A. Brain tumor segmentation using convolutional neural networks in MRI images. IEEE Trans. Med. Imaging 2016, 35, 1240–1251. [Google Scholar] [CrossRef] [PubMed]
- Huang, G.; Liu, Z.; Van Der Maaten, L.; Weinberger, K.Q. Densely connected convolutional networks. In Proceedings of the IEEE Conference on Computer Vision and Pattern Recognition, Honolulu, HI, USA, 21–26 July 2017; pp. 4700–4708. [Google Scholar]
- Lu, L.; Barbu, A.; Wolf, M.; Liang, J.; Salganicoff, M.; Comaniciu, D. Accurate polyp segmentation for 3D CT colongraphy using multi-staged probabilistic binary learning and compositional model. In Proceedings of the 2008 IEEE Conference on Computer Vision and Pattern Recognition, Anchorage, AK, USA, 23–28 June 2008; pp. 1–8. [Google Scholar]
- Kostis, W.J.; Reeves, A.P.; Yankelevitz, D.F.; Henschke, C.I. Three-Dimensional segmentation and growth-rate estimation of small pulmonary nodules in helical CT images. IEEE Trans. Med. Imaging 2003, 22, 1259–1274. [Google Scholar] [CrossRef]
- Shang, Y. Percolation on random networks with proliferation. Int. J. Mod. Phys. B 2018, 32, 1850359. [Google Scholar] [CrossRef]
- Sargent, D.; Park, S.Y. Semi-Automatic 3D lung nodule segmentation in CT using dynamic programming. In Image Processing, Proceedings of the Medical Imaging 2017, Orlando, Florida, USA, 11–16 February 2017; SPIE—International Society for Optics and Photonics: Bellingham, WA, USA, 2017; p. 101332R. [Google Scholar]
- Kuhnigk, J.-M.; Dicken, V.; Bornemann, L.; Bakai, A.; Wormanns, D.; Krass, S.; Peitgen, H.-O. Morphological segmentation and partial volume analysis for volumetry of solid pulmonary lesions in thoracic CT scans. IEEE Trans. Med. Imaging 2006, 25, 417–434. [Google Scholar] [CrossRef]
- Rebouças Filho, P.P.; da Silva Barros, A.C.; Almeida, J.S.; Rodrigues, J.; de Albuquerque, V.H.C. A new effective and powerful medical image segmentation algorithm based on optimum path snakes. Appl. Soft Comput. 2019, 76, 649–670. [Google Scholar] [CrossRef]
- Wang, J.; Guo, H. Automatic approach for lung segmentation with juxta-pleural nodules from thoracic CT based on contour tracing and correction. Comput. Math. Methods Med. 2016, 2016, 1–13. [Google Scholar] [CrossRef] [Green Version]
- Nithila, E.E.; Kumar, S. Segmentation of lung nodule in CT data using active contour model and fuzzy C-mean clustering. Alex. Eng. J. 2016, 55, 2583–2588. [Google Scholar] [CrossRef] [Green Version]
- Chan, T.F.; Vese, L.A. Active contours without edges. IEEE Trans. Image Process. 2001, 10, 266–277. [Google Scholar] [CrossRef] [Green Version]
- Peng, J.; Heisterkamp, D.R.; Dai, H.K. Adaptive quasiconformal kernel nearest neighbor classification. IEEE Trans. Pattern Anal. Mach. Intell. 2004, 26, 656–661. [Google Scholar] [CrossRef] [PubMed]
- Khan, A.; Gould, S.; Salzmann, M. Segmentation of developing human embryo in time-lapse microscopy. In Proceedings of the 2016 IEEE 13th International Symposium on Biomedical Imaging (ISBI), Prague, Czech Republic, 13–16 April 2016; pp. 930–934. [Google Scholar]
- Lu, L.; Bi, J.; Wolf, M.; Salganicoff, M. Effective 3D object detection and regression using probabilistic segmentation features in CT images. In Proceedings of the 2011 IEEE Conference on Computer Vision and Pattern Recognition (CVPR), Colorado Springs, CO, USA, 20–25 June 2011; pp. 1049–1056. [Google Scholar]
- Mukhopadhyay, S. A segmentation framework of pulmonary nodules in lung CT images. J. Digit. Imaging 2016, 29, 86–103. [Google Scholar] [CrossRef] [Green Version]
- Shen, S.; Bui, A.A.; Cong, J.; Hsu, W. An automated lung segmentation approach using bidirectional chain codes to improve nodule detection accuracy. Comput. Biol. Med. 2015, 57, 139–149. [Google Scholar] [CrossRef]
- Lu, L.; Devarakota, P.; Vikal, S.; Wu, D.; Zheng, Y.; Wolf, M. Computer aided diagnosis using multilevel image features on large-scale evaluation. In Proceedings of the International MICCAI Workshop on Medical Computer Vision, Nagoya, Japan, 26 September 2013; pp. 161–174. [Google Scholar]
- Wu, D.; Lu, L.; Bi, J.; Shinagawa, Y.; Boyer, K.; Krishnan, A.; Salganicoff, M. Stratified learning of local anatomical context for lung nodules in CT images. In Proceedings of the 2010 IEEE Computer Society Conference on Computer Vision and Pattern Recognition, San Francisco, CA, USA, 13–18 June 2010; pp. 2791–2798. [Google Scholar]
- Hu, Y.; Menon, P.G. A neural network approach to lung nodule segmentation. In Image Processing, Proceedings of the Medical Imaging 2016, San Diego, CA, USA, 27 February 2016; SPIE—International Society for Optics and Photonics: Piscataway, NJ, USA, 2017; p. 978420. [Google Scholar]
- Jung, J.; Hong, H.; Goo, J.M. Ground-Glass nodule segmentation in chest CT images using asymmetric multi-phase deformable model and pulmonary vessel removal. Comput. Biol. Med. 2018, 92, 128–138. [Google Scholar] [CrossRef]
- Gonçalves, L.; Novo, J.; Campilho, A. Hessian based approaches for 3D lung nodule segmentation. Expert Syst. Appl. 2016, 61, 1–15. [Google Scholar] [CrossRef]
- Shen, W.; Zhou, M.; Yang, F.; Yu, D.; Dong, D.; Yang, C.; Zang, Y.; Tian, J. Multi-Crop convolutional neural networks for lung nodule malignancy suspiciousness classification. Pattern Recognit. 2017, 61, 663–673. [Google Scholar] [CrossRef]
- Gao, W.; Zhou, Z.-H. Dropout rademacher complexity of deep neural networks. Sci. China Inf. Sci. 2016, 59, 1–12. [Google Scholar] [CrossRef] [Green Version]
- Wang, S.; Zhou, M.; Liu, Z.; Liu, Z.; Gu, D.; Zang, Y.; Dong, D.; Gevaert, O.; Tian, J. Central focused convolutional neural networks: Developing a data-driven model for lung nodule segmentation. Med. Image Anal. 2017, 40, 172–183. [Google Scholar] [CrossRef]
- Wang, S.; Zhou, M.; Gevaert, O.; Tang, Z.; Dong, D.; Liu, Z.; Jie, T. A multi-view deep convolutional neural networks for lung nodule segmentation. In Proceedings of the 39th Annual International Conference of the IEEE Engineering in Medicine and Biology Society (EMBC), Jeju Island, Korea, 11–15 July 2017; pp. 1752–1755. [Google Scholar]
- Zhao, X.; Sun, W.; Qian, W.; Qi, S.; Sun, J.; Zhang, B.; Yang, Z. Fine-Grained lung nodule segmentation with pyramid deconvolutional neural network. In Computer-Aided Diagnosis, Proceedings of the Medical Imaging 2019, San Diego, CA, USA, 17–20 February 2019; SPIE—International Society for Optics and Photonics: Bellingham, WA, USA, 2019; p. 109503S. [Google Scholar]
- Huang, X.; Sun, W.; Tseng, T.-L.B.; Li, C.; Qian, W. Fast and fully-automated detection and segmentation of pulmonary nodules in thoracic CT scans using deep convolutional neural networks. Comput. Med. Imaging Graph. 2019, 74, 25–36. [Google Scholar] [CrossRef] [PubMed]
- Long, J.; Shelhamer, E.; Darrell, T. Fully convolutional models for semantic segmentation. In Proceedings of the 2015 IEEE Conference on Computer Vision and Pattern Recognition (CVPR), Boston, MA, USA, 7–12 June 2015; p. 4. [Google Scholar]
- Ronneberger, O.; Fischer, P.; Brox, T. U-Net: Convolutional networks for biomedical image segmentation. In Proceedings of the International Conference on Medical Image Computing and Computer-Assisted Intervention, Munich, Germany, 5–9 October 2015; pp. 234–241. [Google Scholar]
- Çiçek, Ö.; Abdulkadir, A.; Lienkamp, S.S.; Brox, T.; Ronneberger, O. 3D U-Net: Learning dense volumetric segmentation from sparse annotation. In Proceedings of the International Conference on Medical Image Computing and Computer-Assisted Intervention, Athens, Greece, 17–21 October 2016; pp. 424–432. [Google Scholar]
- Armato, S.G., III; McLennan, G.; Bidaut, L.; McNitt-Gray, M.F.; Meyer, C.R.; Reeves, A.P.; Zhao, B.; Aberle, D.R.; Henschke, C.I.; Hoffman, E.A. The lung image database consortium (LIDC) and image database resource initiative (IDRI): A completed reference database of lung nodules on CT scans. Med. Phys. 2011, 38, 915–931. [Google Scholar] [CrossRef] [PubMed]
- Ning, C.-Y.; Liu, S.-F.; Qu, M. Research on removing noise in medical image based on median filter method. In Proceedings of the 2009 IEEE International Symposium on IT in Medicine & Education, Jinan, China, 14–16 August 2009; pp. 384–388. [Google Scholar]
- Jagatheeswari, P.; Suresh Kumar, S.; Rajaram, M. Contrast enhancement for medical images based on histogram equalization followed by median filter. In Proceedings of the International Conference on Man-Machine Systems (ICoMMS), Batu Ferringhi, Malaysia, 11–13 October 2009. [Google Scholar]
- Krissian, K.; Aja-Fernández, S. Noise-Driven anisotropic diffusion filtering of MRI. IEEE Trans. Image Process. 2009, 18, 2265–2274. [Google Scholar] [CrossRef] [PubMed]
- Kumar, N.; Nachamai, M. Noise removal and filtering techniques used in medical images. Orient. J. Comp. Sci. Technol. 2017, 10. [Google Scholar] [CrossRef] [Green Version]
- Bhonsle, D.; Chandra, V.; Sinha, G. Medical image denoising using bilateral filter. Int. J. Image Graph. Signal Process. 2012, 4. [Google Scholar] [CrossRef] [Green Version]
- Ali, H.M. MRI medical image denoising by fundamental filters. In High-Resolution Neuroimaging-Basic Physical Principles and Clinical Applications; InTech: London, UK, 2018; pp. 111–124. [Google Scholar]
- Pohle, R.; Toennies, K.D. Segmentation of medical images using adaptive region growing. In Image Processing, Proceedings of the Medical Imaging 2001, San Diego, CA, USA, 17–22 February 2001; SPIE—International Society for Optics and Photonics: Bellingham, WA, USA, 2001; pp. 1337–1346. [Google Scholar]
- Senthilkumaran, N.; Vaithegi, S. Image segmentation by using thresholding techniques for medical images. Comput. Sci. Eng. Int. J. 2016, 6, 1–13. [Google Scholar]
- Ng, H.; Ong, S.; Foong, K.; Goh, P.-S.; Nowinski, W. Medical image segmentation using K-means clustering and improved watershed algorithm. In Proceedings of the 2006 IEEE Southwest Symposium on Image Analysis and Interpretation, Denver, CO, USA, 26–28 March 2006; pp. 61–65. [Google Scholar]
- Vijay, J.; Subhashini, J. An efficient brain tumor detection methodology using K-means clustering algoriftnn. In Proceedings of the 2013 International Conference on Communication and Signal Processing, Melmaruvathur, India, 3–5 April 2013; pp. 653–657. [Google Scholar]
- Firoz, R.; Ali, M.S.; Khan, M.N.U.; Hossain, M.K.; Islam, M.K.; Shahinuzzaman, M. Medical image enhancement using morphological transformation. J. Data Anal. Inf. Process. 2016, 4, 1–12. [Google Scholar] [CrossRef] [Green Version]
- Ioffe, S.; Szegedy, C. Batch normalization: Accelerating deep network training by reducing internal covariate shift. In Proceedings of the International Conference on Machine Learning, Lille, France, 6–11 July 2015; pp. 448–456. [Google Scholar]
- Liew, S.S.; Khalil-Hani, M.; Bakhteri, R. Bounded activation functions for enhanced training stability of deep neural networks on visual pattern recognition problems. Neurocomputing 2016, 216, 718–734. [Google Scholar] [CrossRef]
- Nair, V.; Hinton, G.E. Rectified linear units improve restricted boltzmann machines. In Proceedings of the International Conference on Machine Learning (ICML), Haifa, Israel, 21–24 June 2010. [Google Scholar]
- Shang, Y. Consensus formation of two-level opinion dynamics. Acta Math. Sci. 2014, 34, 1029–1040. [Google Scholar] [CrossRef]
- Bukhari, M.; Bajwa, K.B.; Gillani, S.; Maqsood, M.; Durrani, M.Y.; Mehmood, I.; Ugail, H.; Rho, S. An efficient gait recognition method for known and unknown covariate conditions. IEEE Access 2020, 9, 6465–6477. [Google Scholar] [CrossRef]
- Jifara, W.; Jiang, F.; Rho, S.; Cheng, M.; Liu, S. Medical image denoising using convolutional neural network: A residual learning approach. J. Supercomput. 2019, 75, 704–718. [Google Scholar] [CrossRef]
- Muhammad, K.; Ahmad, J.; Mehmood, I.; Rho, S.; Baik, S.W. Convolutional neural networks based fire detection in surveillance videos. IEEE Access 2018, 6, 18174–18183. [Google Scholar] [CrossRef]
- Kalsoom, A.; Maqsood, M.; Ghazanfar, M.A.; Aadil, F.; Rho, S. A dimensionality reduction-based efficient software fault prediction using Fisher linear discriminant analysis (FLDA). J. Supercomput. 2018, 74, 4568–4602. [Google Scholar] [CrossRef]
- Jiang, F.; Grigorev, A.; Rho, S.; Tian, Z.; Fu, Y.; Jifara, W.; Adil, K.; Liu, S. Medical image semantic segmentation based on deep learning. Neural Comput. Appl. 2018, 29, 1257–1265. [Google Scholar] [CrossRef]
- Jiang, J.; Hu, Y.C.; Liu, C.J.; Halpenny, D.; Hellmann, M.D.; Deasy, J.O.; Mageras, G.; Veeraraghavan, H. Multiple resolution residually connected feature streams for automatic lung tumor segmentation from CT images. IEEE Trans. Med. Imaging 2019, 38, 134–144. [Google Scholar] [CrossRef]
- Huang, X.; Shan, J.; Vaidya, V. Lung nodule detection in CT using 3D convolutional neural networks. In Proceedings of the 2017 IEEE 14th International Symposium on Biomedical Imaging (ISBI 2017), Melbourne, Australia, 18–21 April 2017; pp. 379–383. [Google Scholar]
- Wu, B.; Zhou, Z.; Wang, J.; Wang, Y. Joint learning for pulmonary nodule segmentation, attributes and malignancy prediction. In Proceedings of the 2018 IEEE 15th International Symposium on Biomedical Imaging (ISBI 2018), Washington, DC, USA, 4–7 April 2018; pp. 1109–1113. [Google Scholar]
- Hancock, M.C.; Magnan, J.F. Lung nodule segmentation via level set machine learning. arXiv 2019, arXiv:1910.03191. [Google Scholar]
Figure 1.
(A) Non-solid; (B) tiny; (C) partially solid; (D) solid; (E) well-circumscribed; (F) juxtapleural.
Figure 1.
(A) Non-solid; (B) tiny; (C) partially solid; (D) solid; (E) well-circumscribed; (F) juxtapleural.

Figure 2.
A framework of the proposed method.

Figure 3.
Preprocessing steps on (LIDC-IDRI) dataset.

Figure 4.
An improved U-Net architecture with DA, pooling, and transposed convolution blocks.

Figure 5.
An architecture of our DA, pooling, and transposed convolution blocks.

Figure 6.
Graph of elbow method to show error for optimal clustering.

Figure 7.
Segmentation results of proposed DA-Net architecture.

Figure 8.
Accuracy and loss graphs of both DA-Net and U-Net.


Table 1.
Comparative analysis of the proposed model with U-Net.
| Sr. No. | Models | Dice Score | IOU Score | SVD | Sensitivity |
|---|---|---|---|---|---|
| 1 | U-Net [49] | 71.0 | 62.8 | 0.29 | 70.2 |
| 2 | DA-Net | 81 | 71.6 | 0.19 | 87.2 |
Table 2.
Comparative analysis with state-of-the-art work.
| Sr. No. | Method | Dice Score | IOU Score | Year |
|---|---|---|---|---|
| 1 | Wang et al. [44] | 77.67% | - | 2017 |
| 2 | Jiang et al. [72] | 68% | - | 2019 |
| 3 | Huang et al. [73] | 80.52 | - | 2017 |
| 4 | Qian et al. [46] | 62.8 | 71.93 | 2019 |
| 5 | Hancock et al. [75] | - | 71.85 | 2019 |
| 6 | Huang et al. [47] | - | 70.24 | 2019 |
| 7 | Wu et al. [74] | 74.05 | 58 | 2018 |
| 8 | Shen et al. [42] | 78.55 | - | 2016 |
| 9 | U-Net [49] | 71.0 | 62.8 | 2015 |
| 10 | Proposed DA-Net | 81 | 71.6 | - |
Publisher’s Note: MDPI stays neutral with regard to jurisdictional claims in published maps and institutional affiliations. |
© 2021 by the authors. Licensee MDPI, Basel, Switzerland. This article is an open access article distributed under the terms and conditions of the Creative Commons Attribution (CC BY) license (https://creativecommons.org/licenses/by/4.0/).
Share and Cite
MDPI and ACS Style
Maqsood, M.; Yasmin, S.; Mehmood, I.; Bukhari, M.; Kim, M. An Efficient DA-Net Architecture for Lung Nodule Segmentation. Mathematics 2021, 9, 1457. https://0-doi-org.brum.beds.ac.uk/10.3390/math9131457
AMA Style
Maqsood M, Yasmin S, Mehmood I, Bukhari M, Kim M. An Efficient DA-Net Architecture for Lung Nodule Segmentation. Mathematics. 2021; 9(13):1457. https://0-doi-org.brum.beds.ac.uk/10.3390/math9131457
Chicago/Turabian StyleMaqsood, Muazzam, Sadaf Yasmin, Irfan Mehmood, Maryam Bukhari, and Mucheol Kim. 2021. "An Efficient DA-Net Architecture for Lung Nodule Segmentation" Mathematics 9, no. 13: 1457. https://0-doi-org.brum.beds.ac.uk/10.3390/math9131457
Note that from the first issue of 2016, this journal uses article numbers instead of page numbers. See further details here.