1. Introduction
Due to the current needs of society, education requires changes in the teaching–learning processes through the implementation of innovative and motivating pedagogical actions. Among those that have shown effective results are collaborative teaching strategies. These have become a more common practice today thanks to their high educational potential [
1]. One of the key processes when implementing this type of strategy is the formation of working groups.
Outside the academic scope, groups are formed with various objectives, for example, people group together in social situations, at work, or when they seek common interests. Groups are considered as a basic social structure. Although in the academic scope groups are also formed with ease and for various purposes, the establishment of groups in the classroom can be a complicated and stilted process, always depending on the objective being pursued [
2]. However, for collaborative learning to succeed, it is important to form effective groups, since the result of the group depends largely on the fulfilment of the responsibilities of each of its members, good academic and empathy relationships are fundamental among them [
3].
The grouping problem is critical in collaborative learning, due to the complexity and difficulty of achieving an adequate grouping, based on different criteria and numerous students [
4]. Group formation in collaborative environments is not a trivial task when it comes to achieving homogeneity or heterogeneity within the groups. Applying a good strategy in their forming, which considers not only one, but several characteristics of the students depends largely on the general academic benefit [
5]. Therefore, it is very useful to have a solution that automates this process, to do it as efficiently as possible and increase the chances of success of the groups.
There are various criteria for the automatic formation of learning groups. These criteria have been used in a wide variety of studies that can be found in the literature. These studies usually consider factors such as the students’ learning style [
6,
7], their thinking style [
8], their knowledge and behaviour [
9,
10], or characteristics such as their gender, skills, and personality [
11,
12,
13,
14,
15,
16], among others.
Considering the above, one of the aspects to be evaluated in the group formation may be the students’ personality. However, in the literature review developed by Borges et al. [
17], it is observed that personality is one of the grouping criteria that is least used in studies, showing great potential for research on this topic.
The proposed approach in this paper seeks to find homogeneous, heterogeneous, or mixed groups, considering each student’s personality traits. Personality traits are measured under the “Big Five” model, using the self-assessment instrument based on this model named Big Five Questionnaire—BQF. The traits of each person within a global group are evaluated, to later find the group mean in each dimension contemplated by the Big Five model, and groups are formed seeking to optimize a certain intra-heterogeneity and inter-homogeneity measure. Since group formation is a combinatorial problem that involves multiple characteristics, the heuristic search offered by evolutionary algorithms was used as an optimization technique.
The characteristics from which groups are formed and the operators implemented in the genetic algorithm are the main contributions of this work. Most of the existing studies in group formation that use genetic algorithms focus the grouping according to the students’ knowledge level and use crossover and mutation basic operators. The proposed strategy exploits the traits derived from the five dimensions of the Big Five personality model (Extraversion, Agreeableness, Conscientiousness, Neuroticism, and Openness), to improve collaboration and learning outcomes at group and individual level. Likewise, a modification of the crossover operator named C1 is used, which is suggested for problems where genes should not be repeated, as is the case under study; and, for mutation, a variation of the swap mutation operator is used. These modified genetic operators allow a more complete search in the solution space, providing new genetic information to the population, preventing the algorithm from being trapped in a local minimum.
The proposed approach was empirically validated through a controlled experiment with 82 students from four programming courses, belonging to Systems Engineering and Electronic Engineering programs of the University of Nariño of the City of San Juan de Pasto-Colombia during the academic semester B-2020. The experiment consisted of developing collaborative activities by the students, obtaining the required groups through the proposed strategy and by students’ preference, to evaluate the academic performance achieved by the participants finally. To somehow guarantee the initial equivalence of the groups, a pre-test was applied to both the experimental and control groups.
Section 4.3 describes the empirical study in detail.
The rest of this paper is organized as follows:
Section 2 addresses the relevant theoretical foundation of the Big Five model, work and collaborative learning, and genetic algorithms;
Section 3 shows some related work about group formation; subsequently,
Section 4 describes the proposed approach divided into two parts, the first describes the psychometric instrument used, while the second poses the use of genetic algorithms; and finally,
Section 5 and
Section 6 present the results obtained, the conclusions and the future work.
3. Related Works
In collaborative work, it is essential to have very well formed work teams, in which the members are comfortable with their peers and where the academic level of each allows a favourable interdependence. However, in practice, self-selection and random assignment of members are the most popular approaches used in group formation, although they do not always produce good results [
40]. Currently, it is difficult to find group formation techniques, as research is based on the correct functioning of collaborative learning, but formation as such is neglected or undervalued. In the literature, however, there are several works where certain elements that must exist within the group are discussed and roles that must be fulfilled in each work team [
41]. Below are some of the most important related works of recent years, including a brief description of their application.
Battur et al. [
16] propose in their study that teams be formed based on the student’s complementary skills and ensuring that each team has an expert member in each identified skill. Wichmann et al. [
9] investigated how group formation based on student behaviour affects productivity on a small group task. Amara et al. [
42] carried out research to form homogeneous groups in a mobile collaborative learning environment, with a grouping attributes personalized selection; the technique used was the K-Means algorithm. Sadeghi and Kardan [
13] and Amarasinghe et al. [
12] propose binary integer linear programming based on task assignment, gender, and language preferences as a group formation optimization technique. Manske and Hoppe [
10] used a semantic algorithm, which maximized the knowledge diversity in the groups. Odo et al. [
43] analysed how the student’s affective state can affect their performance in collaborative study groups. Lykourentzou et al. [
14] and Reis [
15] highlight in their work the importance of personality traits as critical elements that affect collaboration and students’ interaction, affirming that this factor can influence performance and student satisfaction, and induce various actions and behaviours in group work.
On the other hand, the literature review carried out by Cruz and Isotani [
44] regarding group formation demonstrates the great researcher’s interest in using the genetic algorithm technique as a solution to the problem, given its relevance when dealing with a large variable number and its ability to quickly generate optimal solutions, that is, useful groups.
4. Proposed Approach
As previously mentioned, the approach proposed in this paper seeks to find three types of groups, homogeneous, heterogeneous, and mixed, attending to the student’s personality traits, contrasting the five dimensions of the Big Five model. The measurement of these dimensions can be obtained employing the “Big Five Inventory” (BFI), to then find the group mean in each of the dimensions, and finally form groups seeking to optimize a certain measure of heterogeneity, homogeneity, or mixture.
The approach is explained below in three sections—the first one describes the proposed psychometric test to measure personality traits, followed by the formation of workgroups as such, through the application of genetic algorithms, and finally, the empirical design is described as used for validation.
4.1. Big Five Inventory (BFI)
As described in
Section 2.1, the Big Five model, on which this work is theoretically and psychologically based, is a purely descriptive personality model, which has led psychologists to develop various tests and questionnaires that evaluate each of the five factors or dimensions in individuals. In the specific case, an adaptation to Spanish of the Big Five Inventory-BFI by John et al. [
45] is used as an instrument to measure the students’ personality traits.
The use of this instrument is considered a scientifically accepted resource to quantify personality traits, which, as described below, are the input required by the grouping algorithm. It is not intended to issue a concept or psychological diagnosis of the participants, as this is outside the scope of the study.
Table 1 shows the Spanish and English versions of the instrument, the latter as a reference for non-Spanish-speaking readers, which were reconstructed from the original paper “Los Cinco Grandes Across Cultures and Ethnic Groups: Multitrait Multimethod Analysis of the Big Five in Spanish and English” [
46]. It consists of 44 multiple-response items (Likert type) that measure the dimensions proposed for the Big Five model.
4.2. Algorithm for Group Formation
The proposed method for group formation is described in detail in this section. It is based on the previous work of Moreno et al. [
47], who propose a method to group elements in a homogeneous way. The mathematical and algorithmic formulation of the model is generally described, from the representation of the elements to be grouped (students), the solutions (feasible groupings) and their fitness measures, to the operators employed in applying the genetic algorithm.
4.2.1. Student Representation
Each student
n can be represented through a vector, where
M is the number of characteristics, which could have a different nature, for example, demographic (age, gender), psychological (personality traits, abilities, capacities), academic (grades, pre-tests, self-assessment), and cognitive (learning styles, intelligence types), among others.
Each characteristic m (1 ≤ m ≤ M) must be a value in a predefined numerical range. If categorical attributes are considered, a prior numerical discretization process would be required. For example, if a characteristic takes “high”, “medium”, and “low” values, these could be changed to 1, 2, and 3, respectively.
A set of students can be represented by an
N × M matrix, where
N is the number of students and
M is the number of characteristics, as shown in
Table 2.
The data must be scaled to a common range so that there are no alterations in calculating the objective function. One way to do this is by applying the min–max normalization [
48], which allows all the data to remain, for example, in the range 0–1, using the following expression, where
and
are the maximum and minimum values of the corresponding characteristic.
4.2.2. Individual Representation
In the group formation problem, an individual corresponds to a given set of G groups, each with up to N/G students, where N is the total number of students. For the representation of individuals, it is proposed to use a matrix, where the number of rows corresponds to the number of groups G and the number of columns corresponds to the maximum size of each group N/G. In this way, each gene that makes up the chromosome contains the identifier of an element, and its position within the matrix defines the group to which it belongs. This representation facilitates the coding of the chromosome and the use of the genetic operators described below.
As in other combinatorial problems, in group formation, a chromosome cannot have repeated genes, which means that an individual (feasible solution) is one in which each element (student) is in a single position on the chromosome. For example, if you have a set of 20 students and you want to form 4 groups, each group would contain 5 students. A possible individual, if the students are numbered consecutively, is presented in
Table 3.
4.2.3. Fitness Measure
As mentioned above, the objective of the proposed approach is to form homogeneous, heterogeneous, or mixed groups concerning all the students, considering their personality traits. The way to measure this classification criterion would be given by the fitness measure. One possible way to calculate it is described below:
The average of each characteristic of all students (
TM) is calculated:
For each group
g (1 ≤
g ≤
G) of each individual
i the average of each characteristic is calculated. Considering that individual
i is represented as a vector of
Xi, these averages (
IM) are represented as follows:
The sum of the squared differences between the
M characteristics of each group
g of individual
i and the average of each characteristic in all the students is calculated, like this:
The lower this value (with a minimum of 0), the more similar each group will be on average concerning all the students (
TM), in the case of homogeneous group formation; and the higher this value, the less similar each group will be on average concerning all the students, in the case of heterogeneous group formation. The objective function is expressed as follows:
For mixed group formation, that is, heterogeneous for certain characteristics and homogeneous for others, the problem becomes one of multi-objective optimization: it is required to maximize the differences for the heterogeneous characteristics and at the same time minimize the differences for the homogeneous characteristics. Considering the above, a possible way to deal with this situation is described below.
Let
HT and
HM be the vectors of characteristic for which heterogeneity and homogeneity are considered, respectively, represented as follows:
For the fitness measure, the sum of the squared differences between the
J characteristics of heterogeneity for each group
g of individual
i and the average of each characteristic in all the students is calculated, and the value obtained from the sum is subtracted from the differences squared between the
M characteristics of homogeneity for each group
g of individual
i and the average of each characteristic in all the students, like this:
The greater the difference in objectives, the better heterogeneity the groups would have in the
HT characteristics and the better homogeneity in the
HM characteristics, simultaneously. The objective function can be expressed as follows:
To clarify the entire process described, the data in
Table 4, corresponding to a list of 6 students and 3 assessed characteristics, are considered as an example.
Now we want to form two groups, each with three students. Two possible individuals are shown in
Table 5.
By applying (3), the following is obtained:
Table 6 shows the
calculation from
Table 4 and
Table 5, necessary to obtain
according to (4).
Finally, calculating the fitness measures applying (5),
D1 = 0.048 and
D2 = 0.380 are obtained.
The grouping represented by Individual 1 is more inter-homogeneous than Individual 2; with this distribution, all the groups of Individual 1 reflect all the students (TM) with greater precision when all the characteristics are considered as a whole. On the contrary, the grouping represented by Individual 2 is more inter-heterogeneous than Individual 1; with this distribution, all the groups of Individual 2 present greater variability concerning all the students (TM) when all the characteristics are considered in whole.
Now a mixed formation is desired, which is homogeneous for
C2 and at the same time heterogeneous for
C1 and
C3. According to (7) and (8), we obtain:
Calculating the fitness measures applying (9), the following is obtained:
The grouping represented by Individual 2 is more inter-homogeneous for C2 and inter-heterogeneous for C1 and C3 than Individual 1; with this distribution, all groups of Individual 2 more accurately reflect similarity and variability with the whole set of students (TM), when simultaneously seeking homogeneity for C2 and heterogeneity for C1 and C3.
4.2.4. Initial Population and Evolution
The example in
Table 5 shows a trivial group formation: each student is assigned in an orderly manner to a group based on their identifier. The first
N/
G students (in this case 3) belong to Group 1, the next
N/
G to Group 2 and so on. Although this formation is valid, the idea of the initial population is to randomly generate
k individuals, using the matrix representation described above and satisfying the restriction that each student must be in one and only one of the array positions.
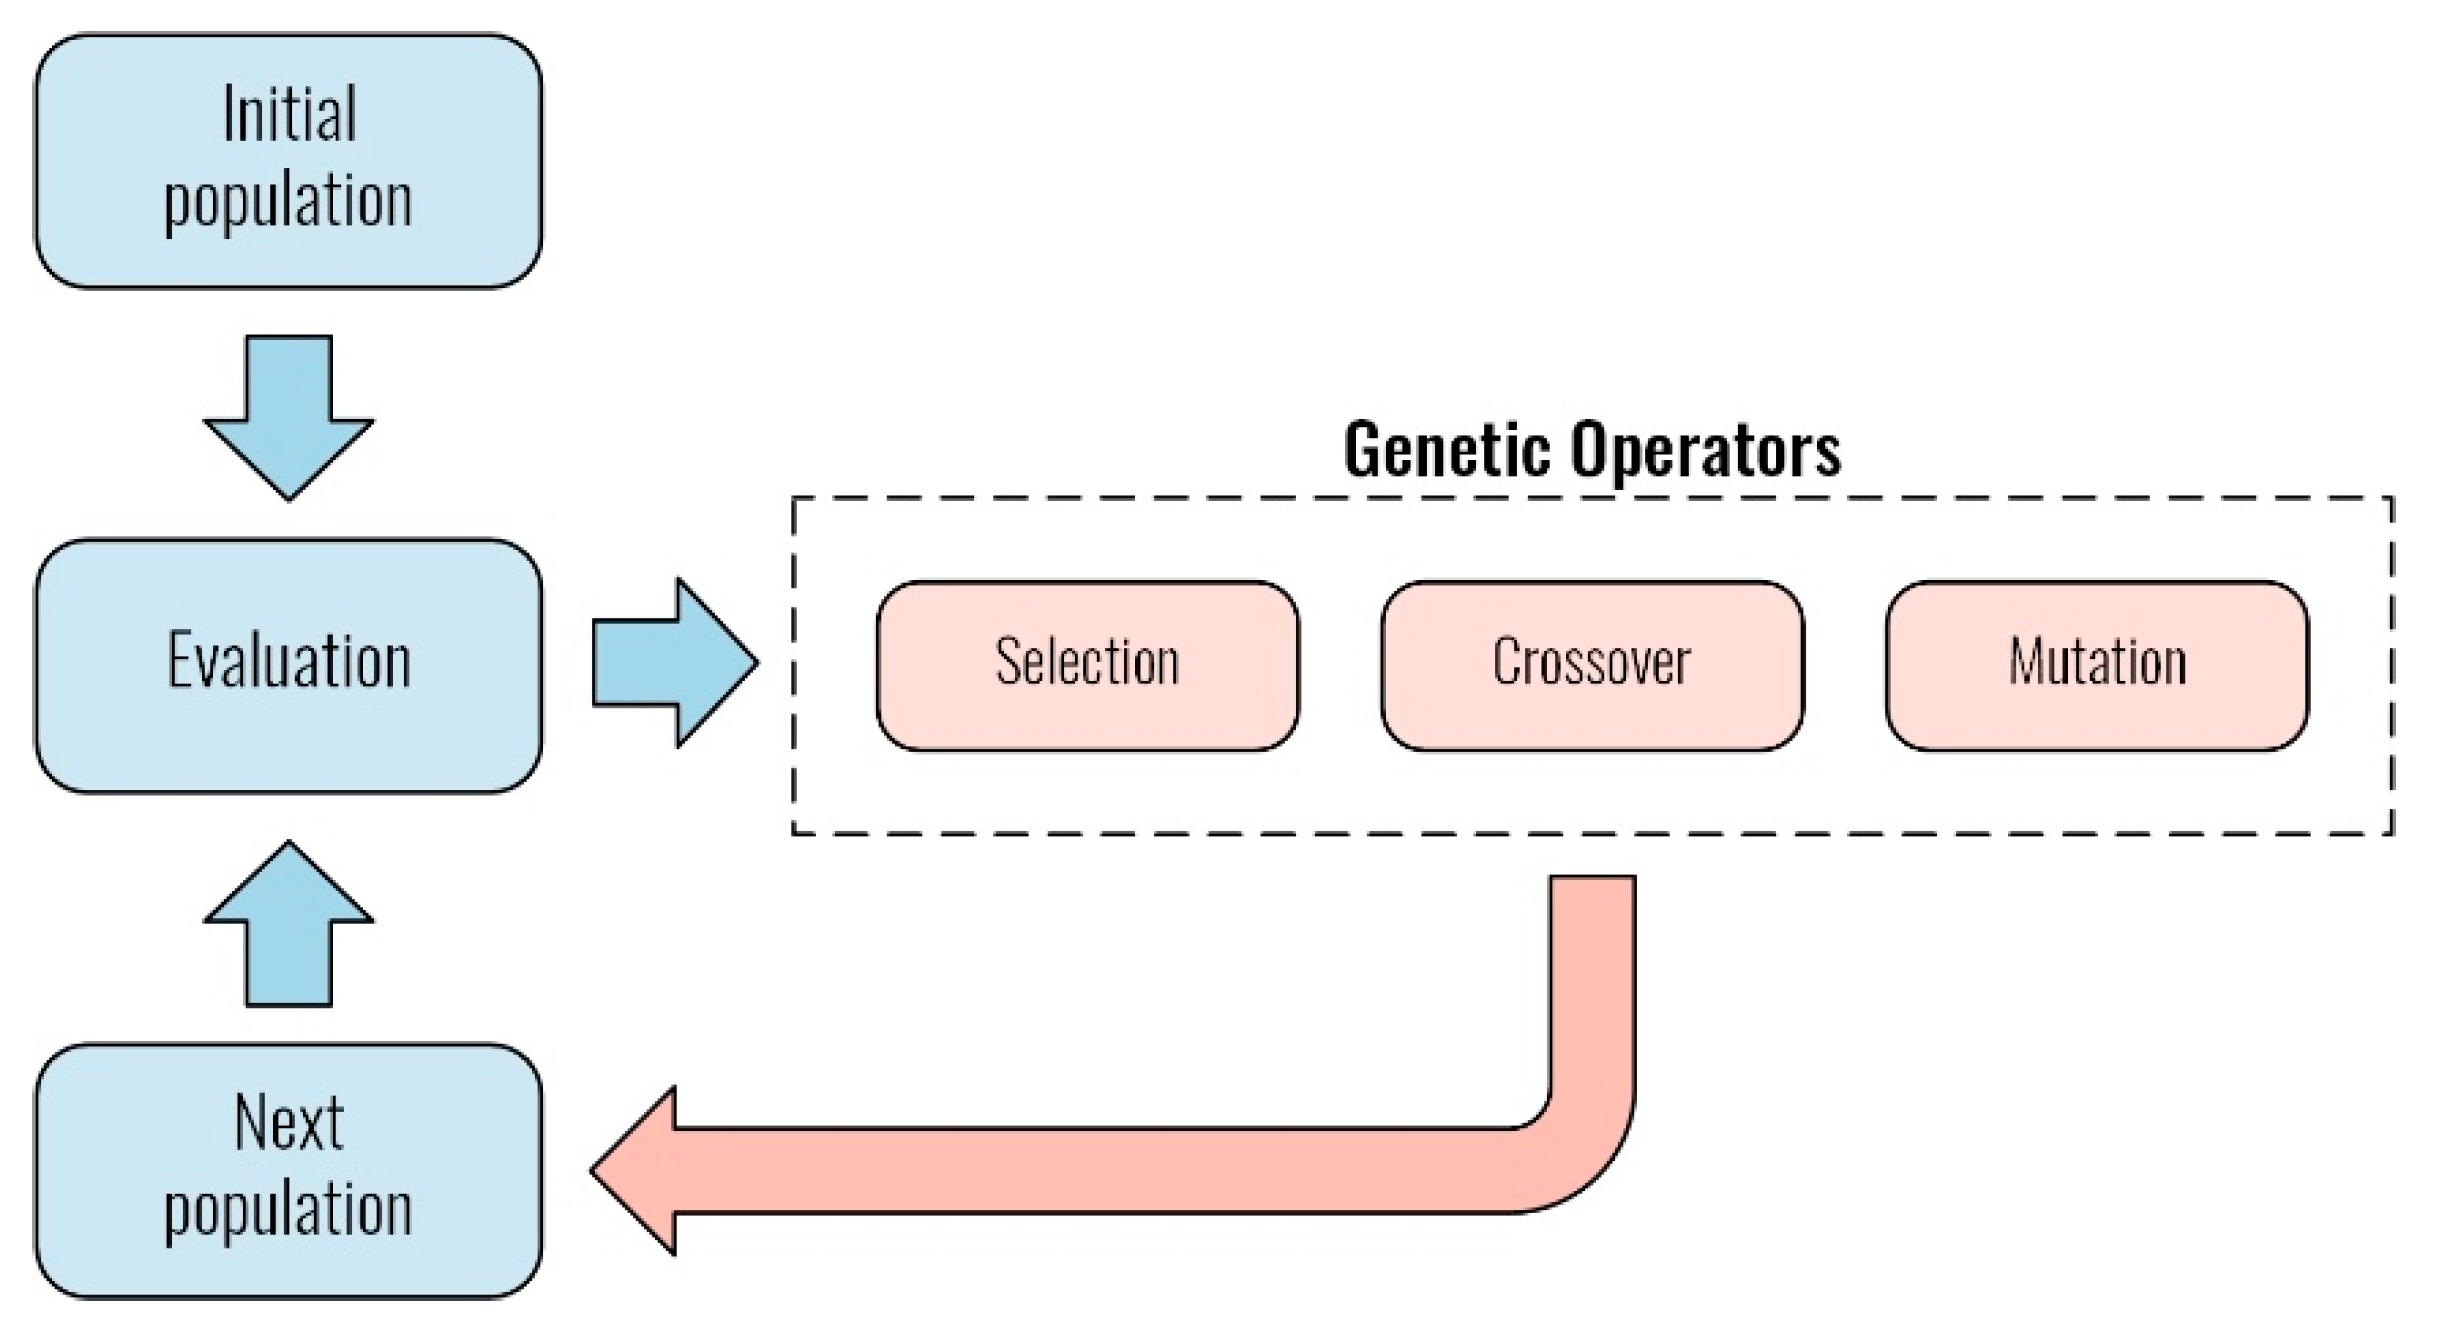
Once the initial population is obtained, the process of evolution is carried out, passing from one generation to another using genetic operators, until a desired fitness measure is obtained or until a certain number of generations is reached.
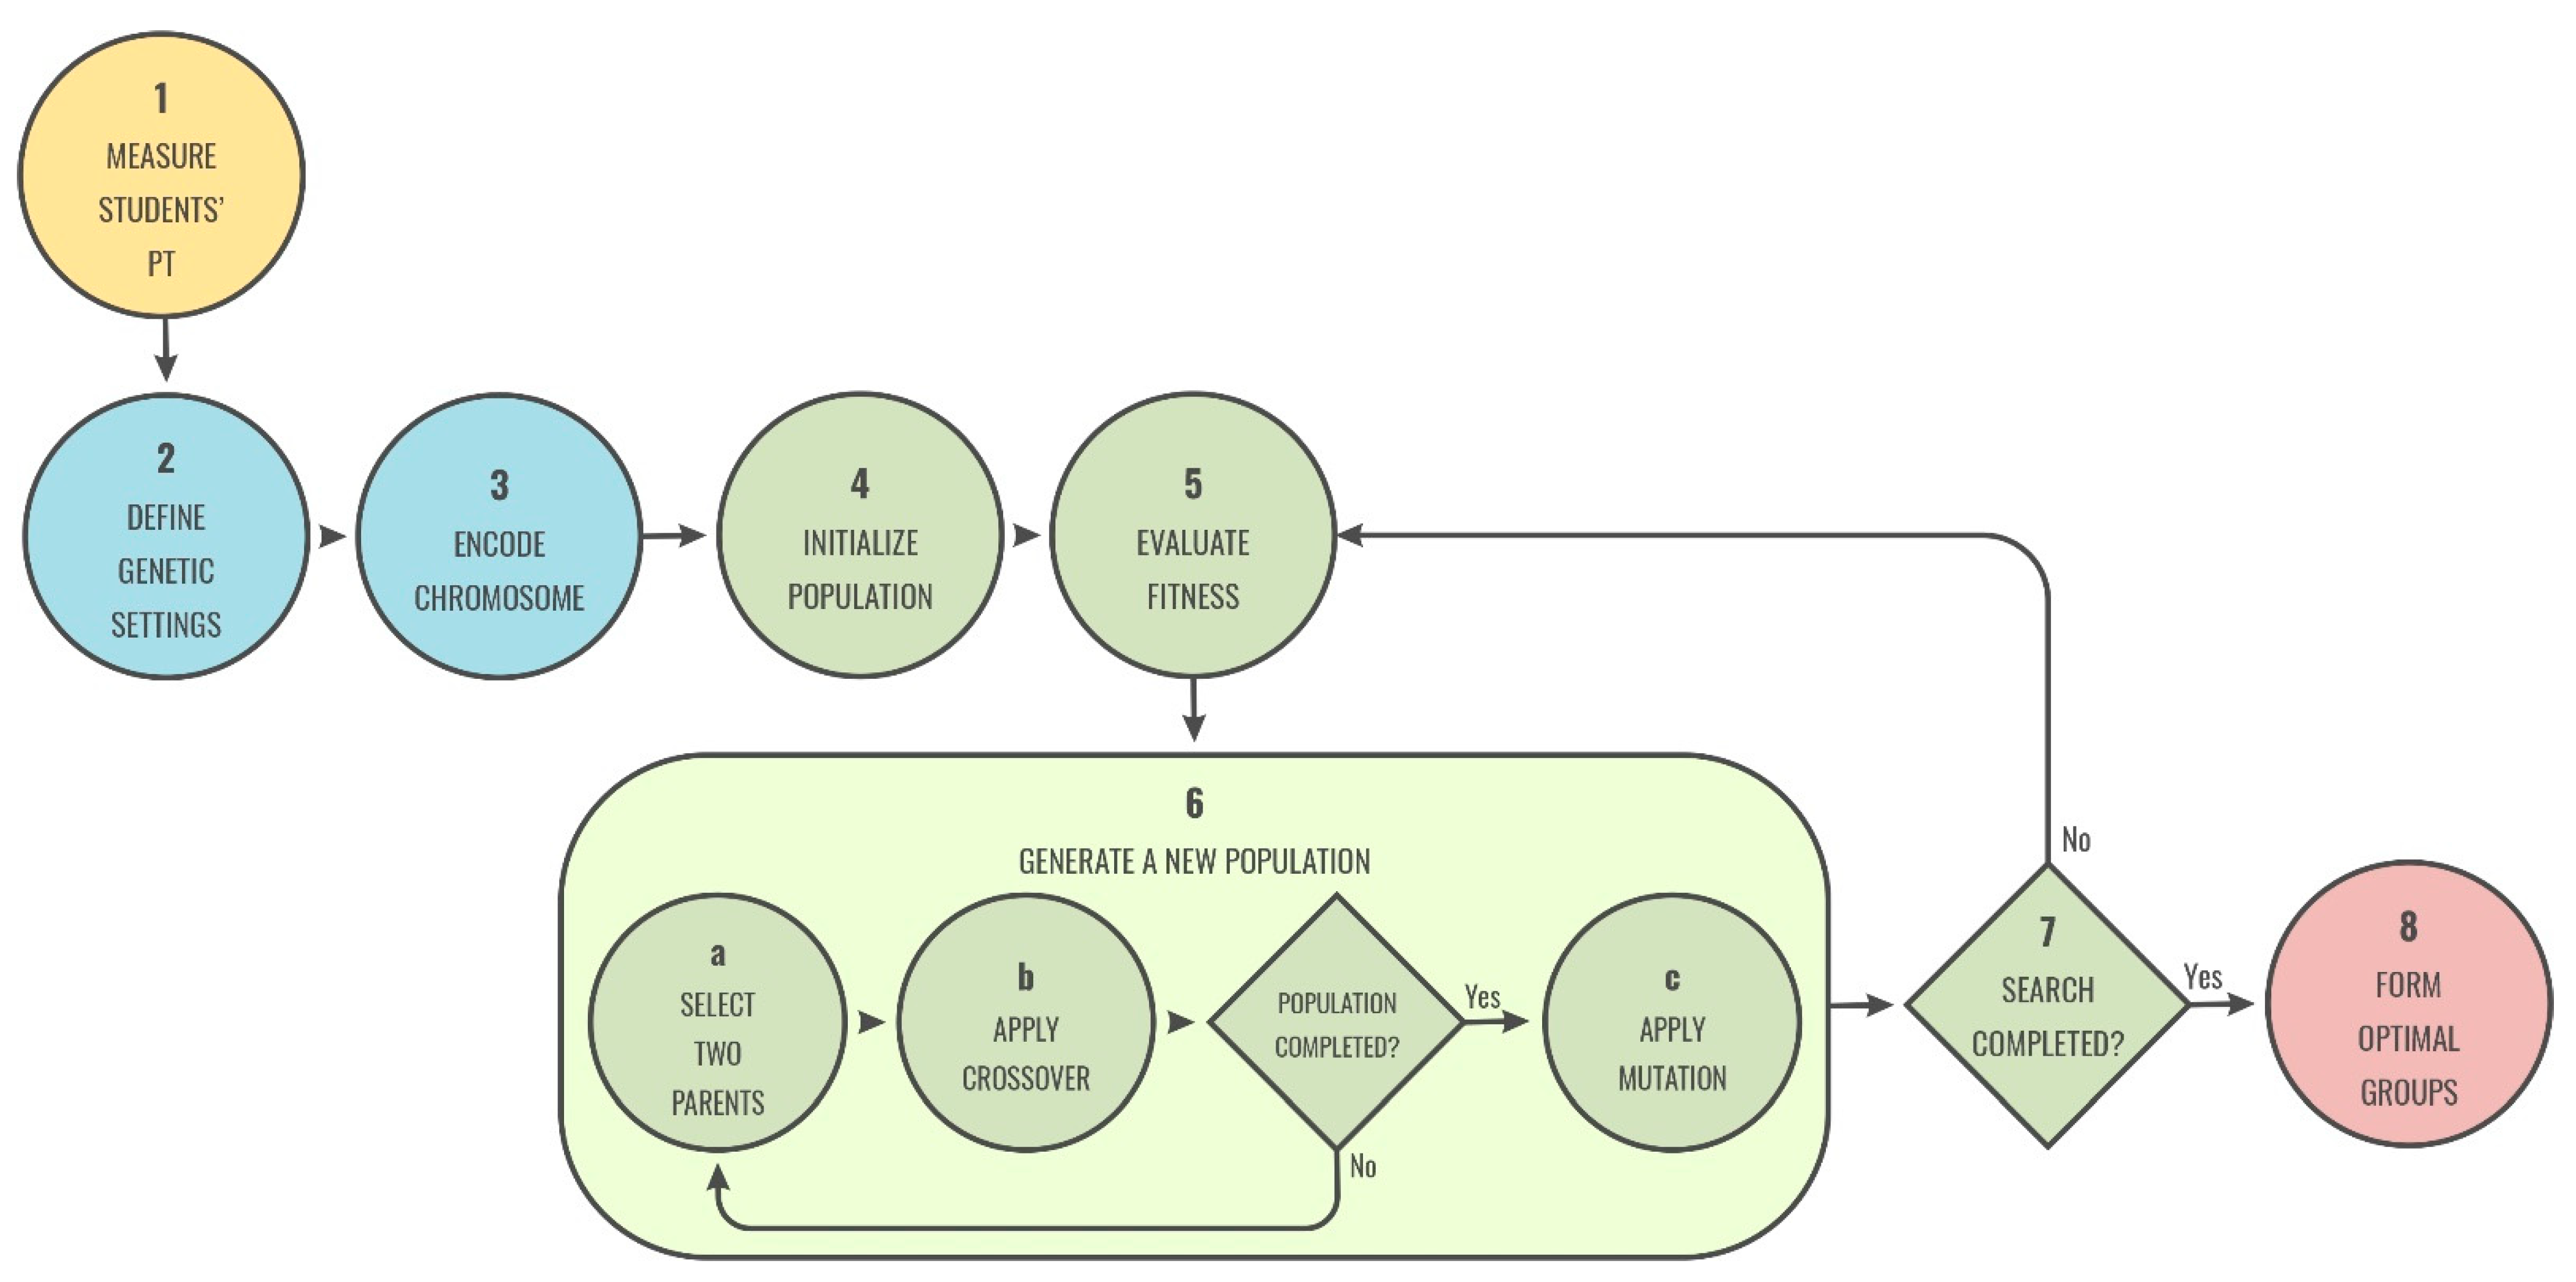
The main objective of the proposed algorithm is to improve the quality of group formation and its effectiveness in collaborative processes. To do this, a set of configurations are tested, and some modifications are made to the classical genetic operators. The flow of the genetic algorithm used for the student group formations based on personality traits is:
Step 1—Measure students’ personality traits: The first step is to measure the characteristics of the students based on which the groups are formed, in this case, their personality traits. This measurement is crucial for structuring good groups that promote efficient and effective collaboration and achieve better learning outcomes.
Step 2—Define genetic parameters: Before executing the genetic algorithm, the genetic parameters concerning group size, population size, number of generations, and crossover and mutation probabilities must be established. This process is described in
Section 4.2.5.
Step 3—Encode chromosome: In this step, the chromosome is represented into a predefined data structure to allow genetic operators to apply. In this study, a matrix structure is used, as described in
Section 4.2.2.
Step 4—Initialize population: The genetic algorithm is started by creating an initial population that consists of a set of feasible encoded solutions (chromosomes). This population is generated randomly to ensure its diversity.
Step 5—Evaluate fitness: A fitness function based on the students’ personality traits is used to evaluate the chromosomes of the population, as described in
Section 4.2.3.
Step 6—Generate a new population: This step is the core of the genetic algorithm, where new and better solutions are generated. The genetic operators applied are: (a) selection, where two parents are selected for crossing, (b) crossover, where, based on a probability, a recombination of the parents’ genes is carried out, and (c) mutation, where, based on a probability, parts of the chromosome of the new population are mutated.
Step 7—End search: After several generations, the algorithm ends and converges to the fittest chromosome, which represents a feasible solution.
Step 8—Form optimal groups: Student groups are formed based on the genetic algorithm results, and students are notified to begin working in their groups on the development of the proposed collaborative activity.
Figure 2 illustrates the main flow of the student group formation process, using the proposed genetic algorithm, grouping the different steps into four stages: input (1), GA settings preparation (2, 3), GA procedure (4, 5, 6, 7), and output (8).
4.2.5. Search Complexity and Algorithm Performance
The estimation of the exhaustive search complexity of the proposed algorithm is associated with the combinatorial explosion generated by the group formation process, it goes hand in hand with the total number of students to group and the number of groups that want to be formed, which, in turn, is directly related to the size of the groups. In general, the number of
G different groups of
N/G students that can be obtained from a whole set of
N students, considering the ordering of the groups relevant, can be calculated through multinomial coefficients [
49] with the following expression:
Thus, for example, if you want to organize 50 students into 10 groups of 5, this value would amount to 4.91 × 1043 possible combinations (applying (24)), which makes finding the best solution from an exhaustive search not very feasible in many cases. Hence the usefulness of the proposed method.
On the other hand, before presenting the results of the implemented genetic algorithm, the process of defining its general parameters is described: crossover probability, mutation probability, population size and generation number (termination criterion). The values obtained for these parameters were generalized for the different cases of model validation.
To define good values for both the crossover probability (
pc) and the mutation probability (
pm), values of each of the parameters were simulated in the ranges suggested by the literature [
50,
51], and others slightly outside of them, selecting the set with the best results. A high crossover probability allows greater exploration of the solution space, reducing the possibility of establishing a false optimum; but if the probability is very high, it causes a great investment in computation time in the exploration of unpromising regions of the solution space. As for the mutation probability, if it is very low, some genes that could have been produced are never tested; if it is too high, there will be much random disturbance, the children would begin to lose their parental likeness.
The simulation was performed on a base case: the example described in
Section 4.2.3; the formation of two groups of three students is considered; formation of the three types: homogeneous, heterogeneous, and mixed; with three-valued characteristics; establishing a population size of 100 individuals; 100 generations of execution of the genetic algorithm; and, with 100 simulation runs. Since this is a case with low complexity in the calculations, its verification was possible through the example implementation in an electronic sheet. The simulation results are shown in
Table 7.
The results show that statistically similar values are obtained for the three types of formation. In the three cases, with crossover probability from 0.2 to 0.4 and with mutation probability from 0.001 to 0.01, practically 100 times out of the 100 simulation runs, the corresponding optimal values were obtained. Therefore, for the case under study, it was decided to take the mean values in each interval as appropriate values, that is, pc = 0.4 and pm = 0.01.
Likewise, to define good values, both for the population size and the generations number (termination criterion of the genetic algorithm), each of the parameters was simulated by selecting the set of those with the best results. Small populations run the risk of not adequately covering the search space, while large populations can generate a high computational cost. On the other hand, as the number of generations increases, the average fitness is more likely to approach that of the best individual, but the computational cost increases.
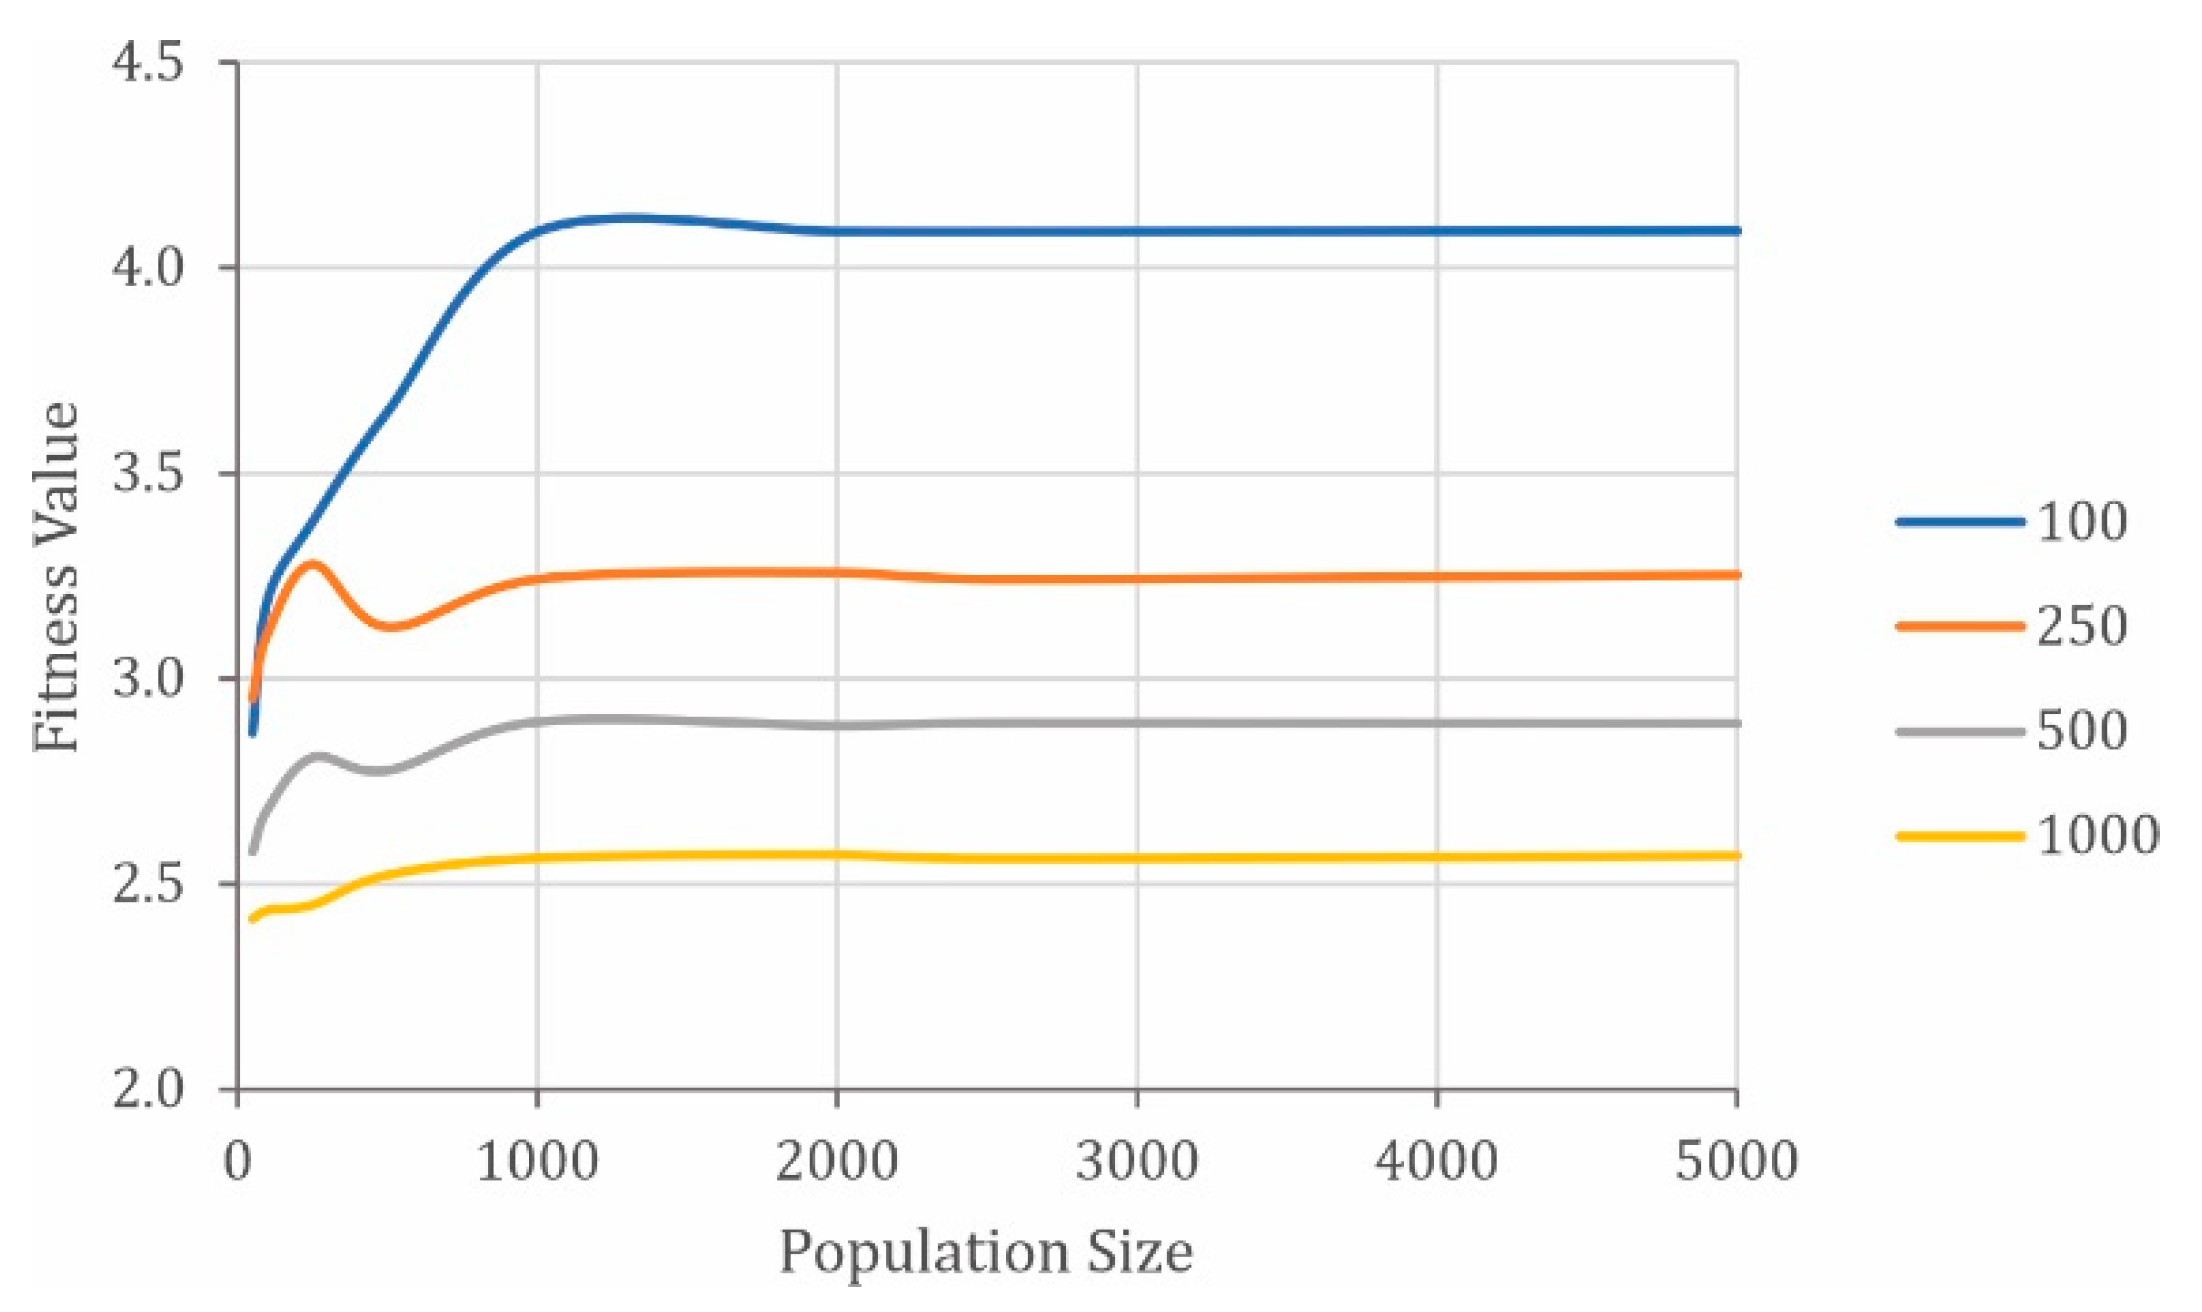
The simulation was performed with randomly generated data for 50 students; heterogeneous group formation of four members; with five valued characteristics (corresponding to the five dimensions of the Big Five model); establishing a crossover of 0.4 and mutation of 0.01 probabilities; and with 100 simulation runs. The simulation results are shown in
Table 8.
The results show that, for the case under analysis, a good population size (PS) is 100 individuals; with higher values, it is observed that fitness (F) decreases. Regarding the generations number (G), the above is ratified: the greater the number, the greater the computational cost (time (T) in milliseconds); and, in addition, as can be seen in
Figure 3, after 1000 generations the fitness value stabilizes, which would indicate that the algorithm has found a value close to the optimal; so, it was decided to handle a value around 1000 generations.
The implemented genetic algorithm was validated from randomly simulated data with a structure like that presented in
Table 4, considering five valued characteristics (corresponding to the five dimensions of the Big Five model). Three tests were carried out with lists of 20, 50, and 100 students; formation of the three types; groups of 4 and 5 members; a population size of 100 individuals; a generation number of 1000; and a run simulation number of 100.
For the first genetic operator, selection, a survivor’s number equal to population size was chosen by the tournament selection method. The choice of individuals (with replacement) was made randomly, although proportional to the fitness functions, that is, that the fittest individuals have a greater possibility of cloning to the next generation.
The crossover operator was applied to the resulting population, choosing two parents randomly according to the crossover probability of 0.4. Every two parents produce two children using the C1 operator, which chooses a crossing point between the parents’ chromosomes, combines the first segment of the first parent with the second segment, but in the order in which they appear in the second parent and vice versa [
52].
Given the nature of the problem, a variation of the swap mutation operator was used [
53]. It is proposed in two steps: in the first step, the individuals to be mutated are randomly selected; and, in the second step, two genes to be mutated are randomly selected. The gene mutation will consist of the swap of values of a specific allele in each gene, also selected randomly. Considering the matrix representation used, it is necessary to clarify that the swap’s allele cannot be in the same row since the change would not affect it (the order within a group has no relevance). The mutation operator was applied to the entire population of each generation with a probability of 0.01.
Under all these parameters, the execution of the algorithm programmed in Java™, on a laptop with an Intel Core I7 processor of 1.8 GHz and 8 Gb of RAM, generated the results presented in
Table 9 and
Table 10.
These results show that the algorithm implemented does not differentiate between the types of groups to be formed, practically the computational performance (time in milliseconds) is the same for the three in each of the lists, for groups of 4 or 5 members. On the other hand, the time used, and the fitness value are increasing for each of the lists, since as the total number of students increases, the complexity of the search increases, that is, there are more combinations to consider in determining the optimal value. It is important to consider the above: the tests were performed using a generations number of 1000 as the termination criterion of the genetic algorithm; if this parameter is increased, the adaptation value improves, but the processing time is also increased.
These results demonstrate the effectiveness of the proposed algorithm, which, being a heuristic search method, does not guarantee to reach the global optimum, but a very close value, despite the simplicity of its formulation and its low demand for computational resources (time and memory), even when the number of possible combinations is very high.
4.3. Empirical Design
The experiment consisted in conducting a collaborative learning activity, specifically an activity named “Peer Code Evaluation” [
54], with 82 students from 4 programming courses, belonging to the programs of Systems Engineering and Electronic Engineering of the University of Nariño of the City of San Juan de Pasto-Colombia, in the academic semester B-2020. It is worth mentioning that for this period, given the COVID-19 situation, the courses were developed in virtual mode.
Table 11 shows the characterization of each of the courses.
The research process was developed with an empirical design based on a quasi-experiment as shown in
Table 12, seeking to verify one of the following hypotheses: H
0: the means of the grades obtained by the students in the topic of the collaborative activity are equal (null hypothesis); H
1: the means of the grades obtained by the students in the topic of the collaborative activity are different (research hypothesis). It is a quasi-experiment since the study groups (described below) were already formed before the experimentation, they were intact groups (the reason why they arose and the way they were formed have nothing to do with the experiment, it is a task that corresponds to the registration and academic control University office for each new academic period) [
55]. This is a common situation in educational contexts, as teachers must evaluate the efficacy of their teaching methods, but pure experiments in these contexts are seldom politically, administratively, or ethically feasible [
56].
G1 and G2 groups were the experimental groups and G3 and G4 were the control groups in each course. In addition, X was the experimental treatment that consisted of forming the required groups using the proposed approach, carrying out a collaborative learning activity during work sessions scheduled. In the control groups, to which the experimental treatment was not applied, the groups required for the collaborative activity, which was the same as for the experimental ones, were formed by students’ preference.
O1, O2, O3, and O4, were the pre-tests applied at the beginning of the experiment, both for the experimental and control groups, seeking to guarantee in some way the initial equivalence of the groups, which in turn guarantees the internal validity of the experiment. The pre-tests consisted of the individual response to the same questionnaire (for each of the courses), related to the topics of the collaborative activity.
In turn, O5, O6, O7, and O8 were the post-tests applied at the end of the experiment for both experimental and control groups, seeking to determine the implication of the experimental treatment. The post-tests consisted of individual responses to the same pre-test questionnaire (for each of the courses), related to the topics of collaborative activity.
The first experimental group G1 consisted of 22 students from the Computer Programming course—Group 1 of the second semester of Electronic Engineering, who were applied the experimental treatment X and the post-test O5. The control group G3 consisted of 17 students from the Computer Programming course—Group 2, from the same semester and academic period, and who were not experimentally treated, but the O7 post-test was applied. The second experimental group G2 consisted of 24 students from the Graphic Programming course—Group 1 of the tenth semester of Systems Engineering, for whom the experimental treatment X and the post-test O6 were applied. The control group G4 consisted of 19 students from the Graphic Programming course—Group 2, from the same semester and academic period, and who were not experimentally treated, but the O8 post-test was applied. As mentioned above, all groups were given pre-tests O1, O2, O3, and O4, seeking to guarantee the initial equivalence of the groups in each of the courses.
All participant students in the study were informed about the research’s purpose and scope and were assured of their anonymity.
5. Results
The proposal presented in this paper contemplates applying an instrument for measuring personality traits and an approach using genetic algorithms for group formation. The results described here correspond to the validation of the model and its application in a controlled experiment with students in a collaborative learning scenario. It is verified that the methodology described in
Section 4 is useful to obtain groups with the desired characteristics, and it is empirically verified that the academic results obtained through the collaborative work of these groups are favourable.
As mentioned in
Section 4.3, at the beginning of the experiment the pre-tests were applied to the study groups, the objective of which was to guarantee in some way the initial equivalence of the groups, since they are intact groups. These pre-tests consisted of questionnaires for individual response, about the specific topics of the collaborative activity developed in each course.
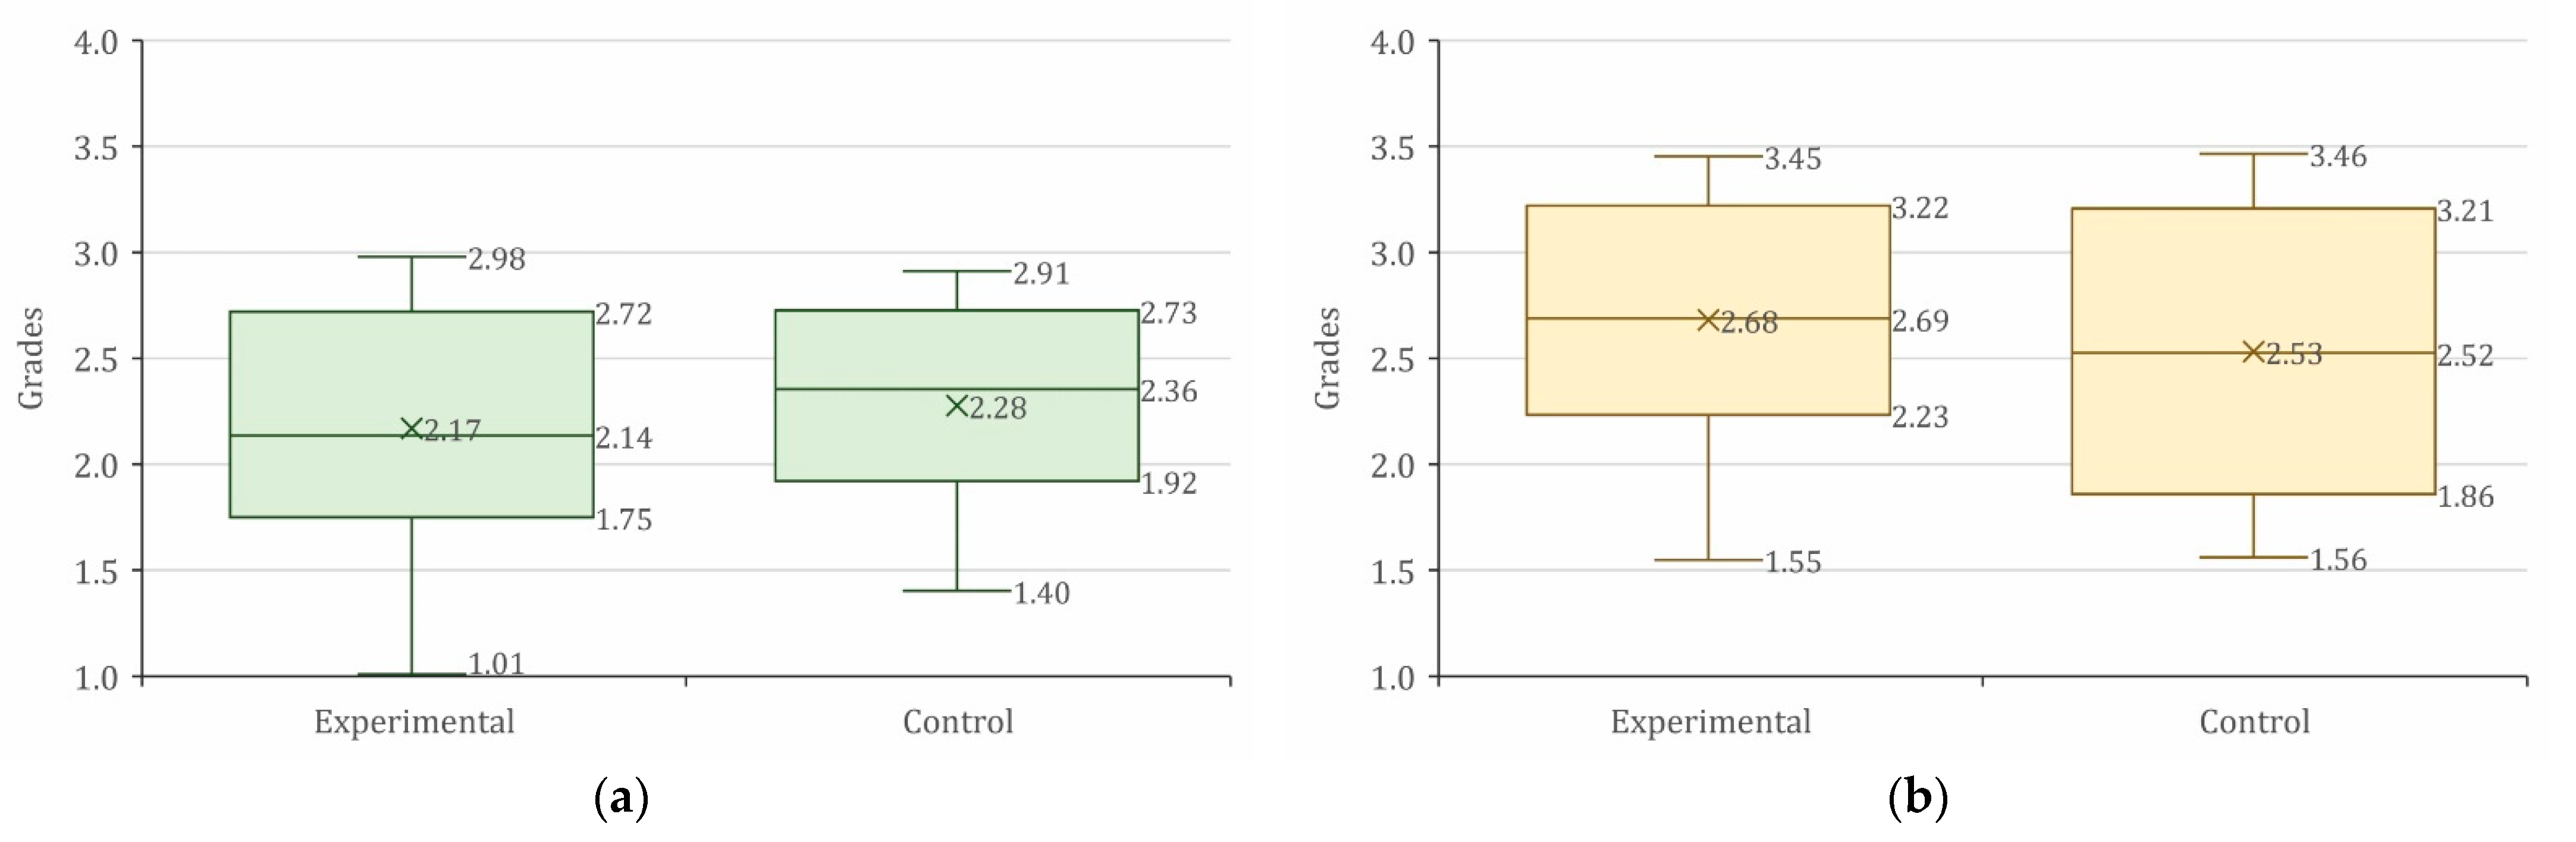
Figure 4 shows the apparent initial equivalence of the study groups. The results show that, on average, the grades obtained in the pre-tests by the experimental groups are like those obtained by the control groups in each of the courses.
To provide a solid conclusion regarding the initial equivalence of the groups, a statistical analysis was carried out using the Mann–Whitney U test, a non-parametric test used to compare two independent samples, seeking to statistically confirm the apparent similarity between the grades obtained by the experimental groups and those obtained by the control groups in the pre-tests, that is to say, that the students, in general, handle the same pre-concepts in each of their courses, before carrying out the experimentation. This test was used considering that the students’ pre-test grades do not follow a normal distribution.
The results of the application of the Mann–Whitney U test are shown in
Table 13, which were obtained using SPSS™, with a confidence level of 95% and considering the following hypotheses: H
0: the means of the grades obtained by the students in the pre-test are similar; H
1: the means of the grades obtained by the students in the pre-test are different.
When comparing the experimental group G1 with the control group G3 of the Computer Programming course, a p-value of 0.589 was obtained. As this value is greater than 0.05, the alternative hypothesis (H1) is rejected in favour of the null hypothesis (H0), with a confidence level of 95%, that is, that the means of the grades obtained by the students in the pre-test are similar.
When comparing the experimental group G2 with the control group G4 of the Graphic Programming course, a p-value of 0.607 was obtained. As this value is greater than 0.05, the alternative hypothesis (H1) is rejected in favour of the null hypothesis (H0), with a confidence level of 95%, that is, that the means of the grades obtained by the students in the pre-test are similar.
The results of these tests show that there is no statistically significant difference between the means of the grades obtained in the pre-tests by the experimental groups and those obtained by the control groups in each of the courses, that is, that the pre-concepts that students handle about the topics required for the development of collaborative activity in each of the courses are similar. This adds validity to the experiment.
On the other hand, as mentioned in
Section 4.3, at the end of the experiment, post-tests were applied to the study groups, the objective of which was to determine the implication of the experimental treatment. These post-tests consisted of questionnaires for individual response, about the specific topics of the collaborative activity developed in each course. This process made it possible to contrast the grades of the experimental groups versus those of the control groups, seeking to verify in a basic way if there is an improvement in the learning process by applying the proposed group formation technique based on personality traits, concerning the formation technique by students’ preference, traditionally used by teachers, when developing a collaborative activity.
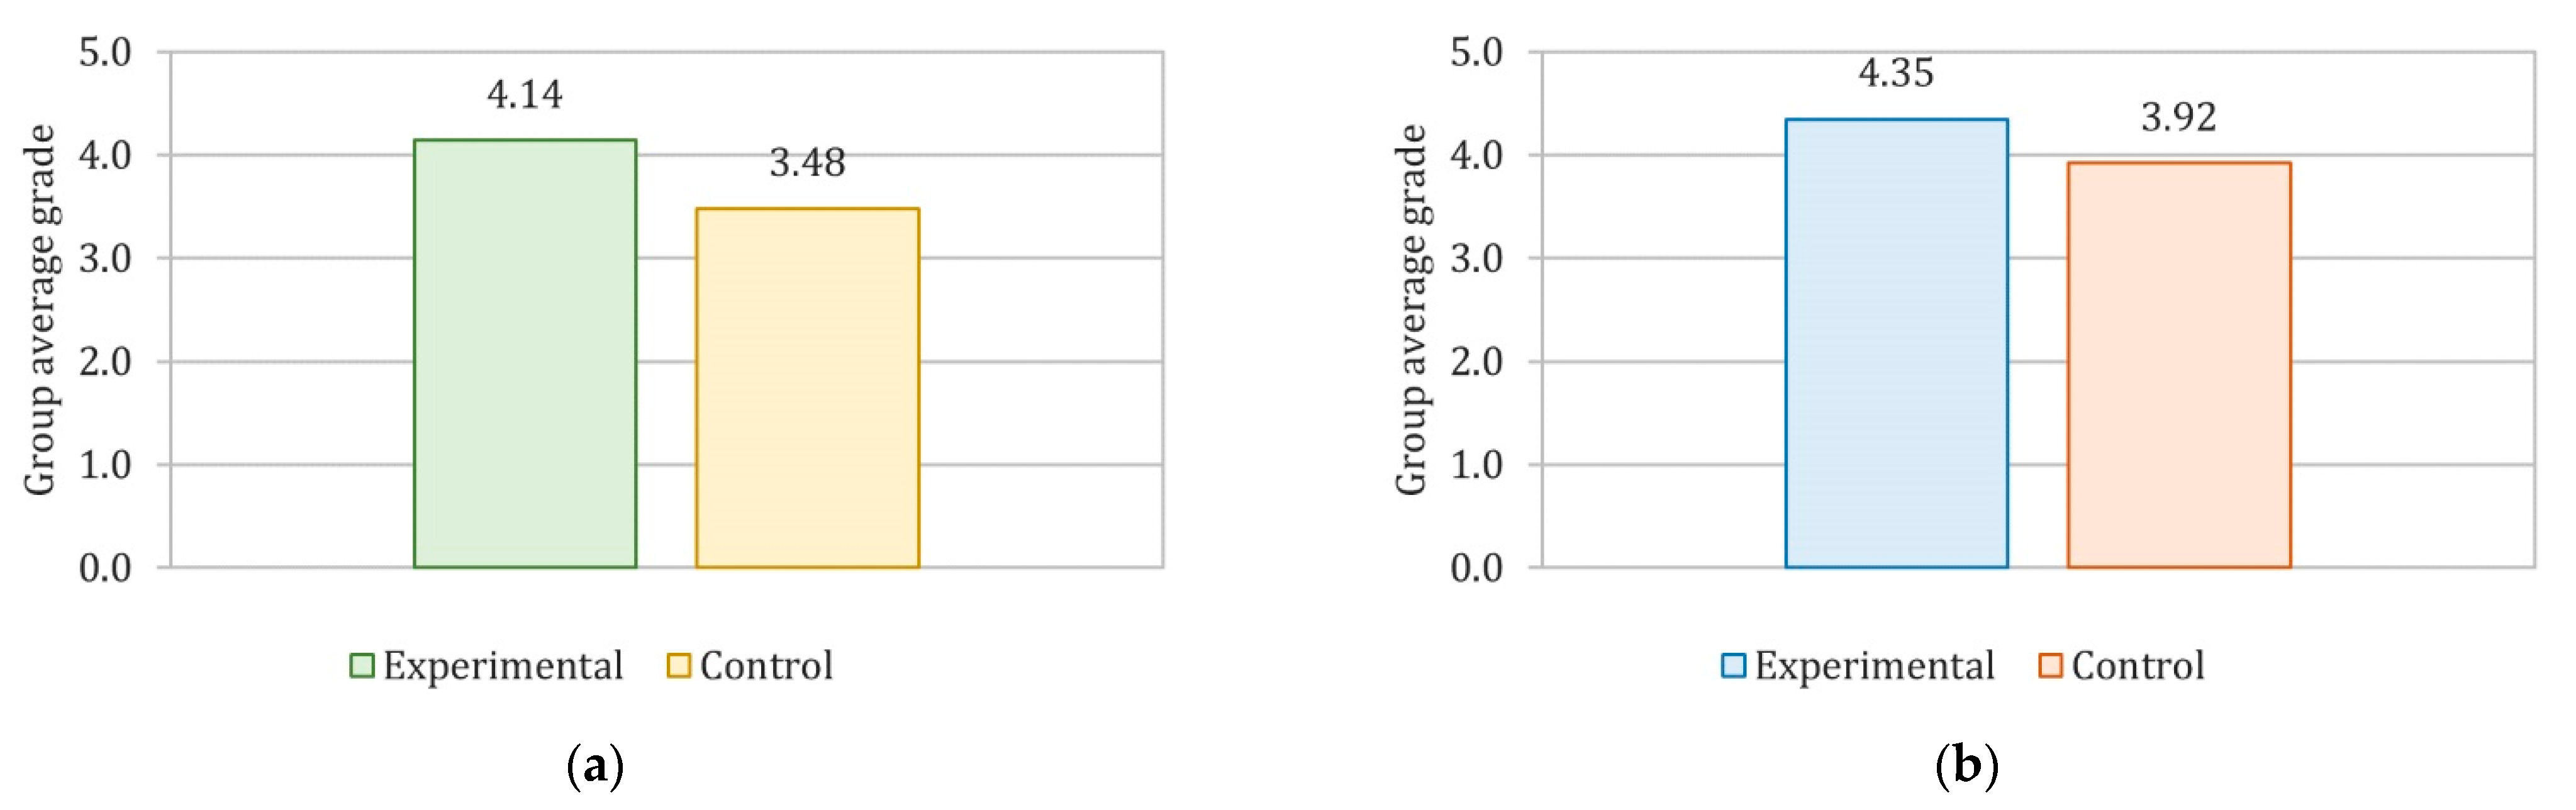
Figure 5 shows the apparent positive incidence of the proposed experimental treatment. The results show that, on average, the grades obtained in the post-test by the experimental groups are higher than those obtained by the control groups.
To provide a solid conclusion regarding the goodness of the proposed group formation technique, a statistical analysis was performed using the Mann–Whitney U test, seeking to statistically confirm the difference between the grades obtained by the experimental groups compared to those obtained by the control groups, that is, a basic difference in the level of learning achieved by the students in the specific subject. This test was used considering that the students’ post-test grades do not follow a normal distribution. In addition, the effect size of the experimental treatment was calculated through Hedges’
g [
57], a metric that allows to quantify the magnitude of the difference between two independent samples analysed through non-parametric tests, giving it greater reliability to test results.
The results of the application of the Mann–Whitney U test, which were obtained using SPSS™, are shown in
Table 14 with a confidence level of 95% and considering the following hypotheses: H
0: the means of the grades obtained by the students in the post-test are similar; H
1: the means of the grades obtained by the students in the post-test are different.
When comparing the experimental group G
1 with the control group G
3 of the Computer Programming course, a
p-value of 0.029 was obtained. As this value is less than 0.05, the null hypothesis (H
0) is rejected in favour of the alternative hypothesis (H
1), with a confidence level of 95%, that is, that the means of the grades obtained by the students in the post-test are different, with a difference of 0.6545 in favour of G
1. According to the classification made by Cohen [
58], the effect size of the experimental treatment (
g) with a value of 0.729 is considered as medium, approaching large, which implies that there is a significant difference between the results of the experimental group versus the control group not due to chance.
When comparing the experimental group G
2 with the control group G
4 of the Graphic Programming course, a
p-value of 0.039 was obtained. As this value is less than 0.05, the null hypothesis (H
0) is rejected in favour of the alternative hypothesis (H
1), with a confidence level of 95%, that is, that the means of the grades obtained by the students in the post-test are different, with a difference of 0.4311 in favour of G
2. According to the classification made by Cohen [
58], the effect size of the experimental treatment (
g) with a value of 0.579 is considered as medium, which implies that there is a moderate difference between the results of the experimental group versus the control group that is not due to chance.
Finally,
Table 15 shows the results of the application of the Mann–Whitney U test to the contrast between post-tests and pre-tests, which were obtained using SPSS™, with a confidence level of 95% and considering the following hypotheses: H
0: the means of the grades obtained by the students in the post-test and the pre-test are similar; H
1: the means of the marks obtained by the students in the post-test and the pre-test are different.
When comparing the post-tests with the pre-tests in both courses, it can be observed that in all cases the
p-value is less than 0.05. Therefore, the null hypothesis (H
0) is rejected in favour of the alternative hypothesis (H
1), with a confidence level of 95%, that is, the means of the grades obtained by the students in the post-test and the pre-test are different. According to the classification made by Cohen [
58], the effect size of the experimental treatment (
g) with values (in all cases) greater than 0.8 is considered large, which implies that there is a very significant difference between the results of the post-tests and pre-tests that are not due to chance. In addition, these results indicate that there is an improvement on the part of the students in the domain of the specific topics in each course, independent of the group formation strategy that is used, which is more evident in the experimental groups than in the control ones.
The previous statistical analysis shows the positive impact of the experimental treatment applied in this research to the experimental groups compared to the control groups, allowing us to confirm that forming groups for collaborative learning scenarios considering the students’ personality traits benefits their academic performance.
6. Conclusions and Further Work
Considering that the problem of obtaining homogeneous, heterogeneous, or mixed groups from a set of students, where several of their characteristics are taken into account (for example, the personality dimensions of the Big Five model), is difficult to solve by analytical or exhaustive search methods, given the combinatorial explosion that occurs depending on the number of students and groups, a heuristic search method, such as genetic algorithms, turned out to be a good alternative for solving it.
The model presented in this paper aims to be a contribution to collaborative learning scenarios since it addresses one of its fundamental requirements: group formation. Therefore, it is very useful to have a solution that automates this process, to do it as efficiently as possible and increase the chances of success of the groups. The proposal aims to make the groups obtained as homogeneous as possible (as similar as possible to the general characteristics of the whole group), as heterogeneous as possible among themselves (to differ as far as possible from the general characteristics of the whole group), or showing a mixture among themselves (that are similar in some characteristics and that differ in others at the same time, concerning the general characteristics of the whole group). To achieve this, the model is made up of two parts. First, it considers the five dimensions proposed by the Big Five model to assess personality: extraversion, agreeableness, conscientiousness, neuroticism, and openness, proposing a specific instrument to measure them. Secondly, it uses genetic algorithms defining an objective function for each individual (a possible grouping), considering grouping as a multi-objective optimization problem.
The innovations of the proposed strategy lay in the grouping criterion considered and in the genetic operators used. Most studies in student group formation that use genetic algorithm approaches focus on grouping based on the students’ knowledge level and use crossover and mutation basic operators. The proposed approach took advantage of the personal characteristics arising from the five dimensions of the Big Five model, to improve collaboration and learning outcomes, both at the group and individual level. Additionally, a modification of the named C1 operator was used, a crossover operator for problems where there should not be repeated genes, as is the case under study; and, for mutation, a variation of the swap mutation operator was used. These modified genetic operators allow a more thorough search in the solution space, inserting new genetic information into the population, preventing the algorithm from being trapped in a local minimum.
The validation of the proposed model was carried out concerning the goodness of the genetic algorithms so that the group formation achieves the desired objectives; the results were satisfactory to the extent that the grouping obtained for each of the types (one of the possible ones) ensures that each group reflects more precisely similarity and/or variability with the whole set of students when considering the five dimensions of the Big Five Model as a grouping criterion.
As future work from the pedagogical perspective, it is desirable to improve the evaluation process by measuring not only the academic results of the students but also their performance at a collaborative level in these types of scenarios, which can facilitate knowledge, control, and improvement group work, leading to a progressive acquisition of this competence by students.
After this, it is proposed to assess in each context, also through controlled experiments, what type of approach is most suitable for organizing groups (homogeneous, heterogeneous, or mixed), bearing in mind that a technique and tool are available that facilitate this work and automate it.
In addition, it is suggested to explore which specific dimensions of the personality, evaluated through the Big Five Model, can most directly influence the learning process, particularly programming and software engineering in general. Based on this, eventually a recommendation system could be proposed that suggests what should be the ideal formation of workgroups, considering the specific characteristics of the students and the proposed collaborative activities.
Considering the above, from the computational point of view, the proposed group formation strategy works for any knowledge area—from the pedagogical point of view, an eventual generalization of the proposal would initially require characterization of the personality dimensions that favour collaborative performance in a specific area of knowledge, especially for mixed groups.
It is also proposed as future work to evaluate the additional effort that applying the proposed approach would imply on teachers and students, trying to determine if this “amount of additional effort” is worth making and under what circumstances.


