Article

Identifying the Main Risk Factors for Cardiovascular Diseases Prediction Using Machine Learning Algorithms

by
Luis Rolando Guarneros-Nolasco
1,
Nancy Aracely Cruz-Ramos
1,
Giner Alor-Hernández
1,
Lisbeth Rodríguez-Mazahua
1 and
José Luis Sánchez-Cervantes
2,*
1
División de Estudios de Posgrado e Investigación, Tecnológico Nacional de México/I.T. Orizaba, Av. Oriente 9 No. 852 Col. Emiliano Zapata, Orizaba, Veracruz C.P. 94320, Mexico
2
CONACYT, Instituto Tecnológico de Orizaba, Av. Oriente 9 No. 852 Col. Emiliano Zapata, Orizaba, Veracruz C.P. 94320, Mexico
*
Author to whom correspondence should be addressed.
Submission received: 23 August 2021 / Revised: 27 September 2021 / Accepted: 2 October 2021 / Published: 9 October 2021

Abstract

:
Cardiovascular Diseases (CVDs) are a leading cause of death globally. In CVDs, the heart is unable to deliver enough blood to other body regions. As an effective and accurate diagnosis of CVDs is essential for CVD prevention and treatment, machine learning (ML) techniques can be effectively and reliably used to discern patients suffering from a CVD from those who do not suffer from any heart condition. Namely, machine learning algorithms (MLAs) play a key role in the diagnosis of CVDs through predictive models that allow us to identify the main risks factors influencing CVD development. In this study, we analyze the performance of ten MLAs on two datasets for CVD prediction and two for CVD diagnosis. Algorithm performance is analyzed on top-two and top-four dataset attributes/features with respect to five performance metrics –accuracy, precision, recall, f1-score, and roc-auc—using the train-test split technique and k-fold cross-validation. Our study identifies the top-two and top-four attributes from CVD datasets analyzing the performance of the accuracy metrics to determine that they are the best for predicting and diagnosing CVD. As our main findings, the ten ML classifiers exhibited appropriate diagnosis in classification and predictive performance with accuracy metric with top-two attributes, identifying three main attributes for diagnosis and prediction of a CVD such as arrhythmia and tachycardia; hence, they can be successfully implemented for improving current CVD diagnosis efforts and help patients around the world, especially in regions where medical staff is lacking.

1. Introduction

In 2019, the World Health Organization (WHO) predicted that 17.5 million people would die from cardiovascular diseases (CVDs), thus accounting for 30% of deaths worldwide. CVDs are the leading cause of death globally, as more people die each year from CVD-related diseases than from anything else. Of all CVDs, an estimated 7.4 million are attributed to coronary heart disease, while 6.7 million are attributed to stroke, hypertension, coronary artery disease, rheumatic heart disease, and heart failure, among others. CVDs affect low- and middle-income nations the most. In fact, it is estimated that by 2030, nearly 23.6 million people will die from CVDs, as it is expected to remain the leading cause of death in the world’s poorest countries [1].
CVDs include several types of heart conditions. The most common of them all, coronary heart disease, may cause heart attacks that kill more than 370,000 people each year. Heart failure is another CVD leading to morbidity and mortality and one of the earliest manifestations of CVD. In recent years, the World Heart Federation has defined multiple risk factors affecting the incidence and occurrence of heart failure, such as arterial hypertension, diabetes, smoking, defective heart valves, damaged heart muscles, and obesity [2].
As “classical” CVD risk factors, such as hypertension, have been successfully treated with medication, the balance between risk factors depending on age and sex and their distribution across the general population may change over time. Moreover, new and relatively less-known risk factors may emerge. As regards CVD diagnosis, timing and accuracy are key, yet not always ensured. Although early and accurate CVD detection helps medical staff determine appropriate and effective treatments to increase the chances of survival of patients, many developing countries and low-income regions lack specialists to perform such diagnostic tests. Moreover, when CVD diagnoses are inaccurate and medical procedures are performed incorrectly, they may jeopardize patient health.
In the last years, multiple organizations and researchers have built large databases of electronic health records (EHR). Along with timely and accurate diagnoses, such databases contribute to current efforts to improve CVD patient life quality in the long term and provide researchers the opportunity to identify potential CVD risk factors among age- and sex-specific patient groups in the general population. From this perspective, computational sciences support the healthcare sector with valuable CVD predictions through computer-aided detection methods.
Among modern methods for computer-aided detection, machine learning (ML) is an emerging technology for clinical data analysis and prediction generation in the context of early detection of diseases. In this work, we analyze the performance of ten machine learning algorithms (MLAs), such as linear regression, decision trees, support vector machine, and k-nearest neighbor, among others, using four datasets with clinical data of patients diagnosed with heart disease.
In this sense, the main contribution of our study is to identify the top-two and top-four risk attributes in the four datasets we analyzed, focused principally on the prediction and diagnostic of CVD such as arrhythmia or tachycardia. This will allow the preventive diagnosis of these cardiovascular diseases to include adequate follow-up of the identified risk factors for their timely and accurate treatment when necessary.
The remainder of this paper is structured as follows: Section 2 discusses current research on MLA applied in clinical datasets, MLA performance metrics, and clinical datasets available in repositories for the data science community. Subsequently, Section 3 presents the evaluation model conducted to identify the main CVD risk factors from dataset attributes. Then, Section 4 presents and discusses the results from the case study. Finally, in Section 5, we propose our conclusions and highlight our suggestions for upcoming works.

2. Related Work

This section reviews research using public datasets for CVD diagnosis and prevention. The reviewed research articles are classified into two main trends: CVD prediction and CVD diagnosis.

2.1. CVD Prediction

Pandey et al. [3] designed a model for predicting heart disease to assist medical professionals in predicting heart disease status. The model exploits the Cleveland Heart Disease dataset and uses the J38 decision tree for classifying heart disease based on a series of clinical attributes. The model results highlighted fasting blood sugar as the most important heart disease attribute. Samuel et al. [4] proposed an integrated decision support process (combining ANN and Fuzzy_AHP) for heart failure prediction. The researchers analyzed the performance of said process using three performance metrics and concluded that it could be employed to accurately predict the risks of suffering from heart failure in clinical settings. In Amin et al. [5], the researchers sought to identify key attributes and data mining procedures that could improve the accuracy of CVD prediction. To this end, the researchers developed a series of predictive models using different combinations of features and seven classification methods: k-NN, decision tree, Naïve Bayes, Logistic Regression, support vector machine (SVM), Neural Network, and Vote. The results showed that the best-performing model achieved an accuracy of 87.4% in terms of heart disease prediction. Mienye et al. [6] proposed a two-stage model that effectively predicts heart diseases. First, the researchers trained an improved sparse autoencoder (SAE), which is an unsupervised neural network that serves to study the best description of the training data. Then, they employed an artificial neural network (ANN) for predicting patient health status based on the learned records. The experimental results obtained with the proposed method increased the performance of the ANN classifier. In turn, Chicco & Jurman [7] applied a series of ML classifiers to both predict patient survival and identify the characteristics associated with the most relevant heart failure risk factors. Similarly, the researchers developed an alternative feature classification study using traditional biostatistical tests and compared the results with those obtained by the MLAs. They concluded in their analysis that serum creatinine and ejection fraction were the most significant attributes for predicting heart failure. Ayon et al. [8] studied seven ML models for coronary heart disease prediction using the Statlog and Cleveland datasets. From their comparative studies, the researchers found that the highest accuracy (98.15%) on the Statlog dataset was obtained with Deep Neural Network, whereas SVM showed the best performance on the Cleveland dataset (97.36%). Mohan et al. [9] introduced an ML-based heart disease prediction model (HRFLM) combining Random Forest features and a linear method. The system operates with diverse feature configurations and various classification techniques. According to the test results, the model performed effectively, with an accuracy level of 88.7%. In Shah et al. [10], the researchers relied on ML techniques for effectively predicting heart disease using a small number of features and running a few tests. The researchers used 14 essential attributes from the Cleveland dataset and conducted a series of performance tests on four MLAs. Their results showed that the highest accuracy in terms of heart disease prediction was achieved with K-Nearest Neighbor. Dwivedi [11] tested six ML techniques for heart disease prediction. They reported the highest accuracy (85%) with logistic regression on the Statlog dataset. From a similar perspective, Belavagi and Muniyal [12] used historical medical data to predict coronary heart disease with the South African Heart Disease dataset using three MLAs to discover correlations in the data to improve coronary heart disease prediction rate. The results showed that the Nayve Bayes algorithm was promising for heart disease detection. Finally, researchers Deepika and Seema [13] used effective mechanisms for chronic disease prediction by mining health data. They used four MLAs to perform diabetes and heart disease diagnoses and presented the comparative revision of the diverse classifiers to measure their performance based on accuracy. According to the results, the highest accuracy was achieved by SVM (95.556%) on the heart disease dataset and by Naive Bayes (73.588%) on the diabetes dataset.

2.2. CVD Diagnosis

Tiwaskar et al. [14] conducted a study to compare statistical, ML, and data mining methods in terms of their ability to assist in predicting heart failure risks. The researchers compared the performance of statistical evaluation, Decision Trees, Random Forest, and convolutional neural networks, and they obtained prediction accuracy results of 85%, 80.1%, 85.38%, and 93%, respectively. Similarly, Nahar et al. [15] analyzed those health factors that contribute to heart disease in both genders. To this end, they relied on rule mining, a computational intelligence approach. As main results, the researchers found that factors such as asymptomatic chest pain and the existence of exercise-induced angina pectoris pointed to the probable presence of heart disease in both men and women. From a slightly different perspective, Ahmad et al. [16] conducted a survival analysis of heart failure patients admitted to two hospitals in Pakistan and used Cox regression to model mortality. The researchers found age, renal dysfunction, blood pressure, ejection fraction, and anemia as significant risk factors for mortality among patients suffering from heart failure. In Detrano et al. [17], patients were classified according to whether or not they suffered from heart disease using cardiac catheterization to test a new discriminant function model to estimate probabilities of occurrence of coronary heart disease. If one or two coronary arteries in a patient showed more than 50% of narrowing, said patient was considered to suffer from heart disease. Shimpi et al. [18] proposed an ML-based model for cardiac arrhythmia detection and classification. The model compares different MLAs—Random Forest, SVM, and Logistic Regression—and chooses the most accurate, i.e., SVM. Similarly, Niazi et al. [19] introduced a model for cardiac arrhythmia diagnosis using KNN and SVM as classification algorithms using 20-fold for cross-validation. The average accuracy achieved was 73.85% by KNN and 68.8% by SVC. Fida et al. [20] proposed a classifier ensemble method for improving heart disease diagnosis using the Cleveland, Statlog, and South African Hearth datasets. Namely, a homogeneous ensemble was applied for heart disease classification. Then, the results were optimized using a genetic algorithm. To evaluate the data, the researchers used 10-fold cross-validation, whereas the performance of the method was evaluated using the metrics of classifier accuracy, sensitivity, and specificity to test the feasibility of the method. The genetic algorithm proved to be an effective technique for optimizing and finding quality solutions as the proposed method achieved a maximum accuracy of 98.63%. Singh and Singh [21] designed a cardiac arrhythmia diagnosis system that can identify the 30 best attributes using three filter-based feature selection methods on three different ML methods (linear SVM, Random Forest, and JRip) applied on the cardiac arrhythmia dataset. The system achieved its highest level of accuracy (85.58%) with Random Forest. Soman & Bobbie [22] applied three ML methods—OneR, Naive Bayes, and J48—to classify arrhythmias from ECG recordings and found that OneR and Naive Bayes exhibited the most constant accuracy rate. Researchers Kodati et al. [23] used different varieties of unsupervised clustering algorithms to determine their accuracy in terms of cardiac disease search and diagnosis. The algorithms were applied to the Cleveland dataset. The study results highlighted k-means as the most appropriate algorithm for cardiac disease diagnosis.
MLAs are similarly applied for the prediction and diagnosis of chronic degenerative diseases. For instance, Haq et al. [24] proposed an ML-based diabetes diagnostic system that uses a filtering method centered on a Decision Tree to select the most significant dataset attributes. The model proved to perform remarkably thanks to the different configurations of the chosen attributes. Similarly, the researchers found that plasma glucose concentrations, diabetes pedigree function, and blood mass index were the most prominent features in the dataset for diabetes prediction. Ghosh & Waheed [25] evaluated the most popular classification algorithms in terms of accuracy, precision, sensitivity, and specificity using a dataset of liver patients. Similarly, in their findings, the researchers highlighted attributes such as age, sex, SGOT, SGPT, SGPT, SGPT, ALP, total bilirubin, direct bilirubin, total protein, and albumin as crucial in deciding liver status.
Authors Mishra et al. [26] conducted a comparative study of the impact of wrapper and filter selection methods on classification performance across various chronic disease datasets. Similarly, the researchers proposed an integrated hybrid method for variable evaluation in which they associated a new alternative of K-Means cluster analysis, called Integrated Supervised K-Means, with the Correlation Feature Selection (CFS) and Best First Search (BFS) methods, thus achieving a classification accuracy of 96.85%. Danjuma [27] evaluated the performance of ML classification systems applied on the clinical prognosis of postoperative life probability among lung cancer patients. They used a k = 10 cross-validation to calculate the performance accuracy of the classifiers and found that the Perceptron algorithm exhibited the best accuracy performance (82.3%). Researchers Li & Chen [28] studied the relationship between breast cancer and some factors as a means to reduce the death probability of breast cancer. To this end, they used five classification systems for the classification of two breast-cancer-related datasets: the Breast Cancer Coimbra Dataset (BCCD) and the Wisconsin Breast Cancer Database (WBCD). According to the results, Random Forest performed best on the AUC metric.
According to our review of the literature, the eight most common MLAs applied in CVD detection and diagnosis include Decision Tree, Random Forest, k-Nearest Neighbors, Logistic Regression, SVM, ANN Perceptron, Gradient Boosting, and AdaBoost. On the other hand, current initiatives for detecting and diagnosing chronic degenerative diseases (i.e., diabetes, breast cancer, and lung cancer) rely mostly on algorithms K-Nearest Neighbors, SVM, AdaBoost, Random Forest, Decision Tree, Neural Network, and Logistic Regression. Additionally, we found that existing initiatives for CVD prediction and diagnosis fail to recognize all the main attributes of CVD as the applied algorithms perform on few public datasets. For instance, Pandey et al. [3] determined only 13 key attributes from the Cleveland dataset, whereas Nahar et al. [15] and Amin et al. [5] only found two and nine attributes, respectively, also from the Cleveland dataset. In turn, on the Faisalabad dataset, Ahmad et al. [16] managed to identify five cardiac disease attributes, whereas Chicco & Jurman [7] identified only two heart disease attributes.

3. Materials and Methods

The subsequent sections briefly discuss our research methods and the results from the analysis of the ten MLAs on four datasets.

3.1. Datasets

We identified four main clinical datasets: the Cleveland dataset, the Framingham Heart study dataset, the Faisalabad Institute dataset, and the South African Hearth dataset (Table 1). Each of them contains data on heart disease clinical instances. The Cleveland health disease dataset is an open-access dataset stored in the online repository of the University of California, Irvine (UCI). It is frequently used to perform search analyses of heart failure risk in patients, as it contains 303 patient records with no missing values. The Cleveland database contains 76 attributes, 13 of which are considered key. As Janosi et al. [29] point out, current experimental studies relying on the Cleveland dataset attempt to distinguish heart failure presence from heart failure absence. The Framingham Heart study dataset is an ongoing cohort study project being conducted in Framingham, Massachusetts. It is publicly accessible on the Kaggle website [30] and comprises 15 columns and around 4200 rows of data. Each row presents a person’s behavioral, demographic, and medical (history and current) data, while each column is a potential risk factor. The Faisalabad Institute dataset is based on 13 attributes and one class with records of 299 heart failure patients (105 women and 194 men) at the Faisalabad Institute of Cardiology and the Allied hospital in Faisalabad, Pakistan. The dataset is hosted on the Kaggle website for public consultation. Finally, the South African Hearth dataset consists of 462 records of patient data and contains 13 attributes to predict mortality from heart disease. The dataset is publicly accessible from the KEEL (Knowledge Extraction based on Evolutionary Learning) website [31].

3.2. Machine Learning Classifiers

Our study revolves around the binary prediction and identification of main CVD risk factors. We used ten different classifying procedures from the diverse areas of ML (Table 2). The classifiers comprise a linear statistical approach (linear Regression [32]), three tree-based methods (Random Forest [33], XGBRF [34], and decision tree [35]), one SVM [36], one instance-based learning model [37], and four ensemble boosting methods (Gradient Boosting [38], LightGBM [39], CatBoost [40], and AdaBoost [41]). We measured the performance of each classifier algorithm independently. Then, we properly recorded all the results for further analysis.

3.3. Methodology

Several authors propose methodologies such as [5,8,9,10,12,20]. Our proposal is based on some of these models. We followed a six-staged methodology to evaluate the performance of the ten MLAs on the clinical datasets and thus identify the main CVD risk factors (Figure 1). The six stages are as follows: (1) Load data dataset, (2) Pre-process data, (3) Select attributes, (4) Run ML models, (5) Apply evaluation metrics, and (6) Process MLA/classifier performance results.
Each methodology stage can be described as follows:
  • Load data dataset. Select and load data from the dataset containing clinical records of patients with CVDs.
  • Pre-process dataset. Review loaded data to understand their content. Then, select the classification variable to obtain the best results.
  • Select attribute or main risk factors. Use Random Forest to select the top-two and top-four attributes from each dataset. Split data for training and testing (i.e., 70% for training and 30% for testing), and k = 10. Similarly, calculate the best parameters for RandomizedSearchCV for n_estimators, max_attributes, and max_depth. Most of the algorithms have these parameters in common, except for K-nearest neighbor and MLP. Parameter ramdom_state was set to 42 in all the evaluations.
  • Run ML classifiers: Apply the ten ML classifiers to discern participants with CVD from healthy individuals.
  • Apply evaluation metrics. Analyze MLA classification performance with respect to five criteria: accuracy, precision, recall, f1-score, and area under the curve (ROC-AUC).
  • Process performance results. Gather and compare performance values from the ten MLAs and record such results for further analysis. Then, choose the best-performing MLA or classifier.

3.4. Validation of the Classification Method

We analyzed the performance of the ten ML classifiers or MLAs with the help of the train-test split technique and k-fold cross-validation (k = 10) to identify top-two and top-four main attributes in public datasets [42,43]. Classifier performance was analyzed with respect to five performance evaluation metrics: accuracy, precision, recall, f1-score, and ROC-AUC. The train-test split technique [44] is a simple and agile procedure that is adaptable to large datasets. It can be used to assess MLA performance by splitting a given dataset into training and testing sets. Hence, a given model is trained using the training set, and then the model is applied to the test set. Cross-validation [44] is also used to calculate MLA performance, as it ensures less variance than a single split of the training and test sets. Cross-validation means segmenting the dataset into k-parts, e.g., k = 3, k = 5 and k = 10. After performing the cross-validation, k different performance scores are obtained, which can be synthesized through a mean and standard deviation. The result is a better approximation of the algorithm’s performance on the new data. This technique is usually more reliable than the train-test split method as algorithms are trained and evaluated several times on different data. The choice of k should allow the test partition size to be large enough to construct a reasonable sample; hence, k values of 3, 5, and 10 are common.

4. Results and Discussion

This section discusses the results from the several performance analyses of the ten ML classification models in terms of their ability to identify the top-two and top-four main attributes from publicly available datasets of CVD patient records. As previously mentioned, we conducted the classifier performance evaluations, first by applying the train-test split method (70–30%), and second with k-fold cross-validation (k = 10). During the evaluations, we recorded five performance measures: accuracy, precision, recall, f1-score, and ROC-AUC.

4.1. Results of MLA Classifier Performance

4.1.1. Attribute Selection in Medical Diagnosis Datasets

The Cleveland Dataset

We applied Random Forest on the Cleveland dataset to identify and select the four most important CVD attributes. Table 3 lists the 13 key attributes of the dataset, from which the top four were retrieved. Additionally, Figure 2a graphically shows the ranking of these attributes.

Faisalabad Dataset

Random Forest yielded 11 main CVD attributes on the Faisalabad dataset. Table 4 lists such attributes in ranked order, whereas Figure 2b depicts a graph of said ranking. As in the previous case, the top-two and top-four attributes were used in the classifier performance analyses.
Figure 2. Ranking of attributes selected by Random Forest for CVD prediction on (a) Cleveland dataset and (b) Faisalabad dataset.
Mathematics 09 02537 g002

4.1.2. Attribute Selection in Medical Prediction Datasets

Framingham Dataset

On the Framingham dataset, Random Forest ranked the most important CVD attributes as listed in Table 5. Additionally, Figure 3a graphically shows the ranking of said attributes.

South African Hearth Dataset

The nine key attributes from the South African Hearth dataset were ranked by Random Forest as listed in Table 6. Additionally, Figure 3b graphically shows the ten ranking of such attributes. As in the three previous databases, the top two and top four attributes were used to run the classifier performance analyses.
Figure 3. Ranking of attributes selected by Random Forest for CVD prediction on (a) Framingham dataset and (b) South African Hearth dataset.
Mathematics 09 02537 g003

4.2. Results of the Train-Test Split Technique for Classifier Performance on Two and Four Attributes

We relied on the Cleveland and Faisalabad datasets to analyze the performance of the classifiers on datasets for CVD diagnosis.

4.2.1. Datasets for CVD Diagnosis

We analyzed the performance of the ten ML classifiers on both the top two and the top four dataset attributes using the train-test data split technique (70–30%). The analysis results are discussed below.

Classifier Performance on Top-Two CVD Attributes

We tested the performance of the ten ML classifiers on the top-two attributes from the Cleveland and Faisalabad datasets. Selected Cleveland attributes comprised cp (score = 13.55) and thalach (score = 12.52), and Faisalabad attributes referred to serum creatinine (score = 20.15) and ejection fraction (score = 17.52). Table 6 lists the results from the analysis.
As can be observed from Table 7, CatBoost and XGBRF classifiers showed the best results in terms of accuracy performance (81.32%). As for the Faisalabad attributes, the Decision Tree exhibited the highest accuracy (74.44%). Conversely, the lowest-performing classifiers with respect to accuracy included GradientBoosting Classifier (61.54%) on the Cleveland dataset and Support Vector Classification (58.89%) on the Faisalabad dataset. As regards precision, Logistic Regression and KNeighbors proved to be the best-performing classifiers on the Cleveland dataset and the Faisalabad dataset with precision scores of 84.09% and 83.33%, respectively. The lowest-performing classifiers in terms of precision were once again GradientBoosting Classifier (64.71%) on the Cleveland dataset and Support Vector Classification (50.0%) on the Faisalabad dataset. In conclusion, on the Cleveland dataset, CatBoost Classifier exhibited good performance in terms of accuracy, f1-score, and roc-auc, whereas Logistic Regression performed best in terms of precision. As regards the Faisalabad dataset, Decision Tree Classifier performed best in accuracy, f1-score, and roc-auc, Decision Tree Classifier exhibited the best performance in terms of precision, and Random Forest Classifier performed best in terms of recall.

Classifier Performance on Top-Four Attributes

At this stage, we tested the performance of the ML classifiers on the four best-ranked attributes from both the Cleveland dataset and the Faisalabad dataset. Cleveland attributes included cp (score = 13.55), thalach (score = 12.52), ca (score = 11.70), and oldpeak (score = 10.90). On the other hand, Faisalabad attributes comprised serum creatinine (score = 20.15), ejection fraction (score = 17.52), age (score = 14.56), and platelets (score = 12.83). Figure 4 graphically introduces the results of the analysis.
As depicted in Figure 4, the highest accuracy on the Cleveland dataset was achieved with Logistic Regression and Support Vector Classification (82.42%), whereas the Decision Tree classifier outperformed on the Faisalabad dataset (71.11%). As for precision, the best-performing classifiers included Logistic Regression (88.64%) on the Cleveland dataset and Support Vector Classification (100.00%) on the Faisalabad dataset. Conversely, the lowest accuracy was yielded by both GradientBoosting Classifier and KNeighbors Classifier (70.33%) on the Cleveland dataset and KNeighbors Classification (56.67%) on the Faisalabad dataset. The lowest-performing algorithms in terms of precision were GradientBoosting Classifier (74.47%) on the Cleveland dataset and KNeighbors Classifier on the Faisalabad dataset (37.50%). Overall, the classifiers exhibited better performance on the Cleveland dataset across the five metrics, whereas on the Faisalabad dataset the classifiers exhibited favorable behavior only in terms of accuracy and roc-auc. In conclusion, evaluating four attributes instead of two significantly improves classifier performance in accuracy and precision metrics.

4.2.2. Datasets for CVD Prediction

We evaluated the performance of ten ML classifiers on the top two and four attributes from the Framingham and the South African Hearth datasets. The data were split into 70% for algorithm training and 30% for algorithm testing. The results are introduced and discussed below.

Classifier Performance on Top-Two Attributes

Framingham attributes sysBP (score = 14.15) and BMI (score = 13.55) and South African Hearth attributes Tobacco (score = 15.70) and Age (score = 15.39) were used at this stage. Table 8 lists the results from the analysis of classifier performance.
As shown in Table 8, the LGBM classifier achieved the best performance on the Framingham dataset in terms of accuracy, precision, recall, and f1-score. On the South African Hearth dataset, the Decision Tree classifier outperformed the other algorithms in terms of recall, f1-score, and roc-auc. Conversely, Decision Tree Classifier proved to be the lowest-performing algorithm on the Framingham dataset, with performance scores of 64.16% in accuracy and 58.68% in precision. As regards the South African Hearth dataset, GradientBoosting Classifier exhibited the lowest scores with an accuracy performance of 63.31% and a precision performance of 47.62%. Overall, in top-two attribute classifications, classifiers exhibit good performance in both accuracy and precision.

Classifier Performance on Top-Four Attributes

In the four-attribute classification analysis, Framingham attributes included sysBP (score = 14.15), BMI (score = 13.55), Age (score = 12.73), and totChol (score = 12.69), whereas South African Hearth dataset attributes included Tobacco (score = 15.70), Age (score = 15.39), Ldl (score = 13.29), and Adiposity (score = 11.73). Figure 5 depicts the results from the analysis.
According to Figure 5, in the four-attribute classification, LGBM classifiers and Decision Tree Classifiers exhibited the best performance in terms of accuracy (81.18% and 71.22%, respectively) on the Framingham and the South African Hearth datasets, respectively. As for precision, GradientBoosting classifier (89.80%) and Logistic Regression (62.50%) proved to be the best-performing algorithms on the Framingham and the South African Hearth datasets, respectively. Conversely, the most underperforming algorithms in terms of accuracy included Support Vector Classification (66.01%) on the Framingham dataset and GradientBoosting Classifier (59.71%) on the South African Hearth dataset. Decision Tree Classifier and GradientBoosting Classifier exhibited the lowest precision performance on the Framingham and the South African Hearth datasets, respectively, with values of 61.86% and 43.40% each. We concluded in this step that the classifiers performed better on the Framingham dataset across the five metrics, whereas in the South African Hearth dataset, favorable classifier behavior was observed only in terms of accuracy and roc-auc metrics. We concluded that selecting four attributes does not considerably increase classifier performance in terms of accuracy and precision.

4.3. Results of k-Fold Cross-Validation for Classifier Performance on Top Two and Four Attributes

As previously mentioned, we also relied on 10-fold cross-validation to validate the performance of the ML classifiers on the top two and four attributes of each dataset. The results of the cross-validation analyses are discussed below.

4.3.1. Medical Diagnostic Datasets

In this section, we discuss our results on the performance analysis of the LM classifiers when using k-fold cross-validation. The classifiers were applied on the top two and four attributes on the Cleveland and Faisalabad datasets.

Classifier Performance on Top-Two Attributes

The selected attributes from the Cleveland dataset included cp (score = 13.55) and thalach (score = 12.52), whereas serum creatinine (score = 20.15) and ejection fraction (score = 17.52) were chosen from the Faisalabad dataset. Table 9 lists the obtained results on the performance of the ten classifiers.
In the two attribute classification with cross-validation, Logistic Regression achieved the greatest performance in accuracy, precision, and f1-score on the Cleveland dataset, whereas CatBoost yielded the best performance in terms of accuracy and f1-score on the Faisalabad dataset. On the other hand, the lowest-performing algorithms on the Cleveland dataset included GradientBoosting in terms of accuracy, f1-score, and roc_auc, and Random Forest Classifier (71.75%) in terms of precision. On the Faisalabad dataset, AdaBoost Classifier yielded the lowest results in accuracy and roc_auc, and Random Forest Classifier (56.67%) exhibited the poorest precision performance. We concluded from this step that the k-fold cross-validation approach increases classifier performance in precision and roc-auc metrics in a two-attribute classification.

Classifier Performance on Top-Four Attributes

For the top-four attribute classification analysis, the selected Cleveland attributes included cp (score = 13.55), thalach (score = 12.52), ca (score = 11.70), and oldpeak (score = 10.90). The selected Faisalabad dataset attributes comprised serum creatinine (score = 20.15), ejection fraction (score = 17.52), age (score = 14.56), and platelets (score = 12.83). Figure 6 depicts a graphic representation of the analysis results.
As can be observed from Figure 6, classifiers Support Vector Classification and Decision Tree yielded the best accuracy results on the Cleveland and Faisalabad datasets, respectively, with values of 81.16% and 76.59% each. The highest precision was achieved by the XGBRF classifier on both datasets with values of 79.77% and 64.74%, respectively. On the other hand, the algorithm achieving the lowest performance in accuracy was the LGBM Classifier with values of 72.94% on the Cleveland dataset and 64.59% on the Faisalabad dataset. In terms of precision, the Decision Tree Classifier proved to be the lowest-performing algorithm (73.73%) on the Cleveland dataset, whereas KNeighbors Classifier and Support Vector Classification yielded the lowest results (40.17%) on the Faisalabad dataset. Overall, the classifiers exhibited better performance on the Cleveland dataset than in the Faisalabad dataset, with an adequate behavior above 75%. On the Faisalabad dataset, the classifiers showed adequate performance only in accuracy and roc-auc and poor performance in terms of recall and f1-score. We concluded in this step that k-fold cross-validation increases classifier performance in the four-attribute classification analysis in accuracy and roc-auc metrics.

4.3.2. Medical Prediction Datasets

In this section, we discuss our results on the performance analysis of the LM classifiers when using k-fold cross-validation. The classifiers were applied on the top two and four attributes on the Framingham and the South African Hearth datasets.

Classifier Performance on Top-Two Attributes

Selected Framingham attributes included sysBP (score = 14.15) and BMI (score = 13.55), whereas selected South African Hearth attributes comprised Tobacco (score = 15.70) and Age (score = 15.39). Table 10 introduces the results of the classifier performance analysis using cross-validation.
According to Table 10, in the top-two attribute classification, the LGBM classifier yielded the best results for accuracy, recall, f-1 score, and roc_auc, whereas the Decision Tree achieved the best performance on the South African Hearth dataset in terms of accuracy, recall, and f1-score. As regards precision, GradientBoosting outperformed the other nine classifiers on the Framingham dataset with a value of 75.17%, whereas Support Vector Classification achieved the best precision on the South African Hearth dataset with a value of 66.31%. On the other hand, on the Framingham dataset, Support Vector Classification was the lowest-performing algorithm in terms of accuracy, recall, and f1-score, while Decision Tree Classifier underperformed in terms of precision (61.67%). On the South African Hearth dataset, GradientBoosting Classifier was the lowest-performing algorithm in accuracy and roc-auc, whereas Random Forest Classifier exhibited the lowest precision performance (43.46%). We also observed that classifiers performed better on the Framingham dataset than on the South African Hearth dataset across the five metrics, although there was improved behavior on the South African Hearth dataset if compared to the previous analyses.

Classifier Performance on Top-Four Attributes

For the top-four attribute performance analysis, the selected attributes included sysBP (score = 14.15), BMI (score = 13.55), Age (score = 12.73), and totChol (score = 12.69) for the Framingham dataset. On the other hand, Tobacco (score = 15.70), Age (score = 15.39), Ldl (score = 13.29), and Adiposity (score = 11.73) were selected on the South African Hearth dataset. Figure 7 shows the results from the analysis.
As depicted in Figure 7, the highest accuracy was achieved by the LGBM classifier (83.10%) on the Framingham dataset, and by both Support Vector Classification and Logistic Regression (70.99% respectively) on the South African Hearth dataset. Regarding precision, the highest performance was exhibited by GradientBoosting classifier (89.60%) on the Framingham dataset and Support Vector Classification (62.79%) on the South African Hearth dataset. Conversely, the lowest accuracy performance was exhibited by Logistic Regression (64.61%) on the Framingham dataset and GradientBoosting Classifier (58.64%) on the South African Hearth dataset. The lowest precision was recorded by Decision Tree Classifier (61.05%) on the Framingham dataset and GradientBoosting Classifier (39.77%) on the South African Hearth dataset. Overall, the Framingham dataset allowed for better classifier performance across the five metrics, while the South African Hearth dataset exhibits better performance than in previous analyses.

4.4. Most Important Dataset Attributes

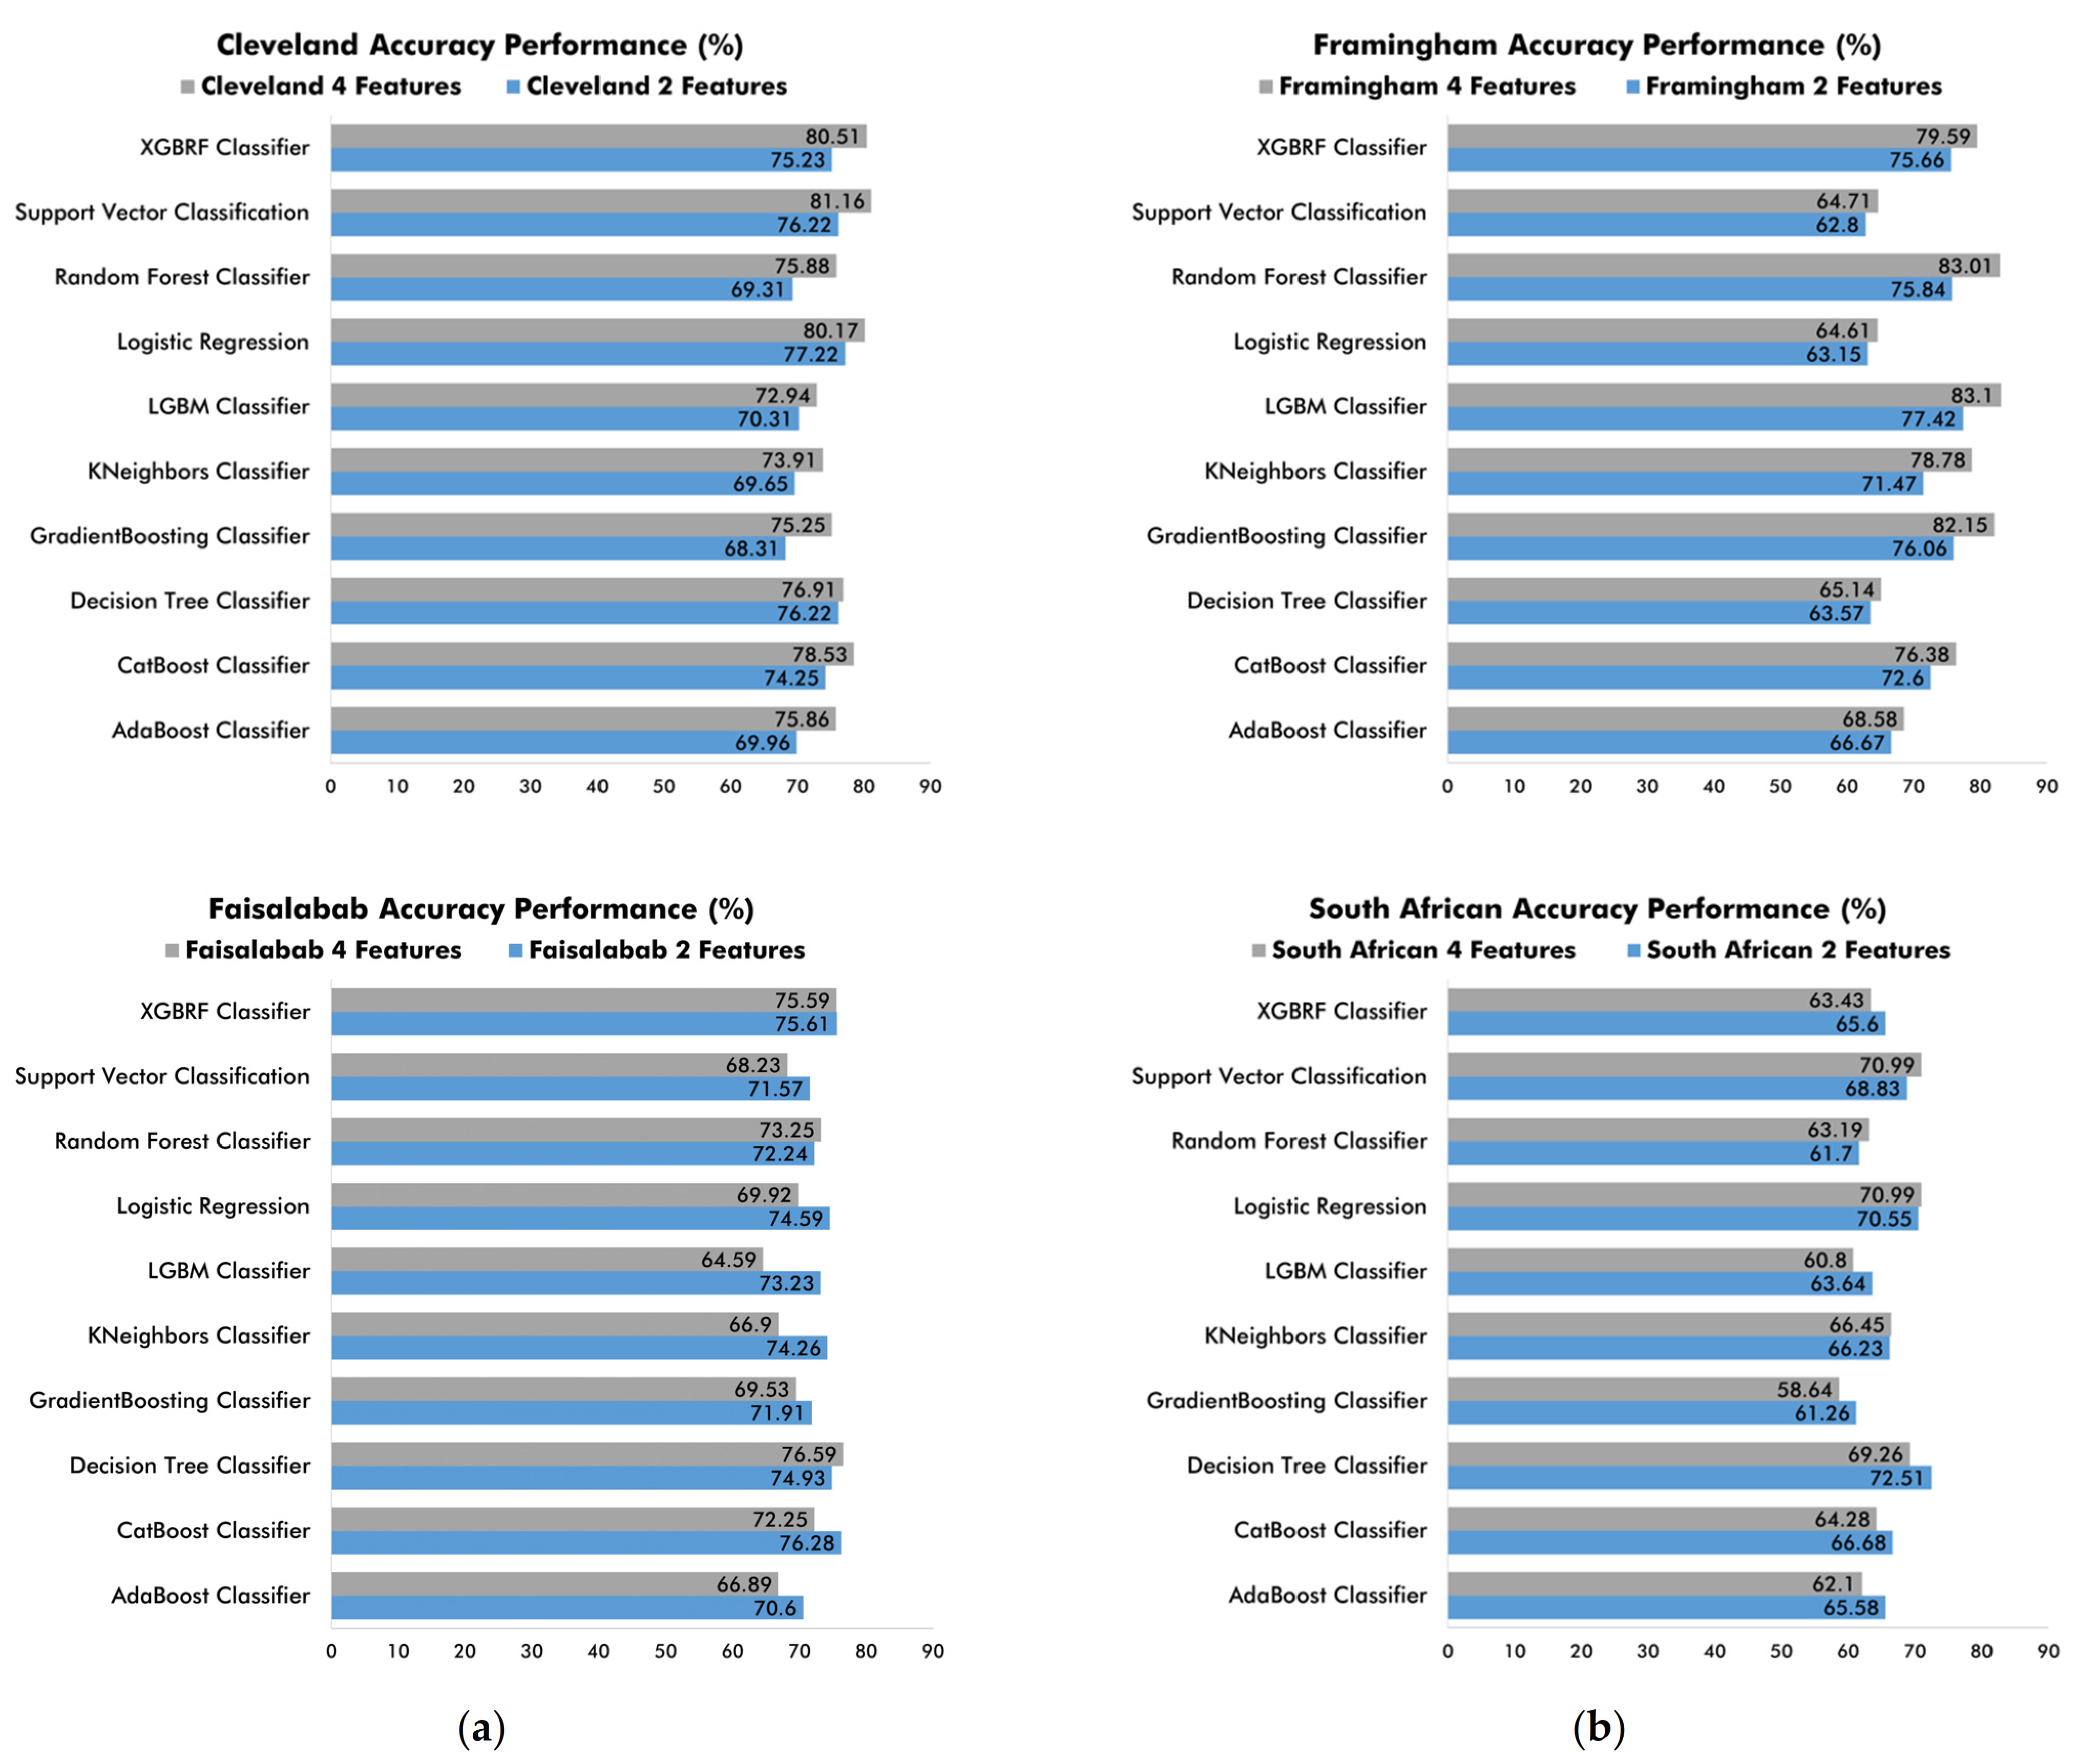
The importance of this research lies in finding the best precision and accuracy results from the ten ML classifiers to identify the top-two and top-four attributes for CVD detection and prevention. At this stage, we compared the results obtained from all the previous performance analyses. When comparing the accuracy metrics (Figure 8), we found that in both the two-attribute and the four attribute classifications, the ML classifiers performed adequately on all the CVD diagnostic and prediction datasets using k-fold cross-validation. Specifically, when working with medical diagnosis datasets, the ten classifiers performed better when applied on the top-four attributes of the Cleveland dataset and the top-two attributes of the Faisalabad dataset. Conversely, when working with medical prediction datasets, we observed overall better classifier performance on the top-four attributes from the Framingham dataset and the top-two attributes from the South African Hearth dataset.
As for the validation technique, we found that it is feasible to rely on k-fold cross-validation to obtain adequate classifier performance on the Cleveland, Framingham, and Faisalabad datasets. However, on the South African Hearth dataset, ML classifiers are lowest-performing when using k-fold cross-validation.
Figure 8. Comparison of ML classifier accuracy performance using k-fold cross-validation on top-two and top-four attributes from (a) medical diagnostic datasets; (b) medical prediction datasets.
Mathematics 09 02537 g008
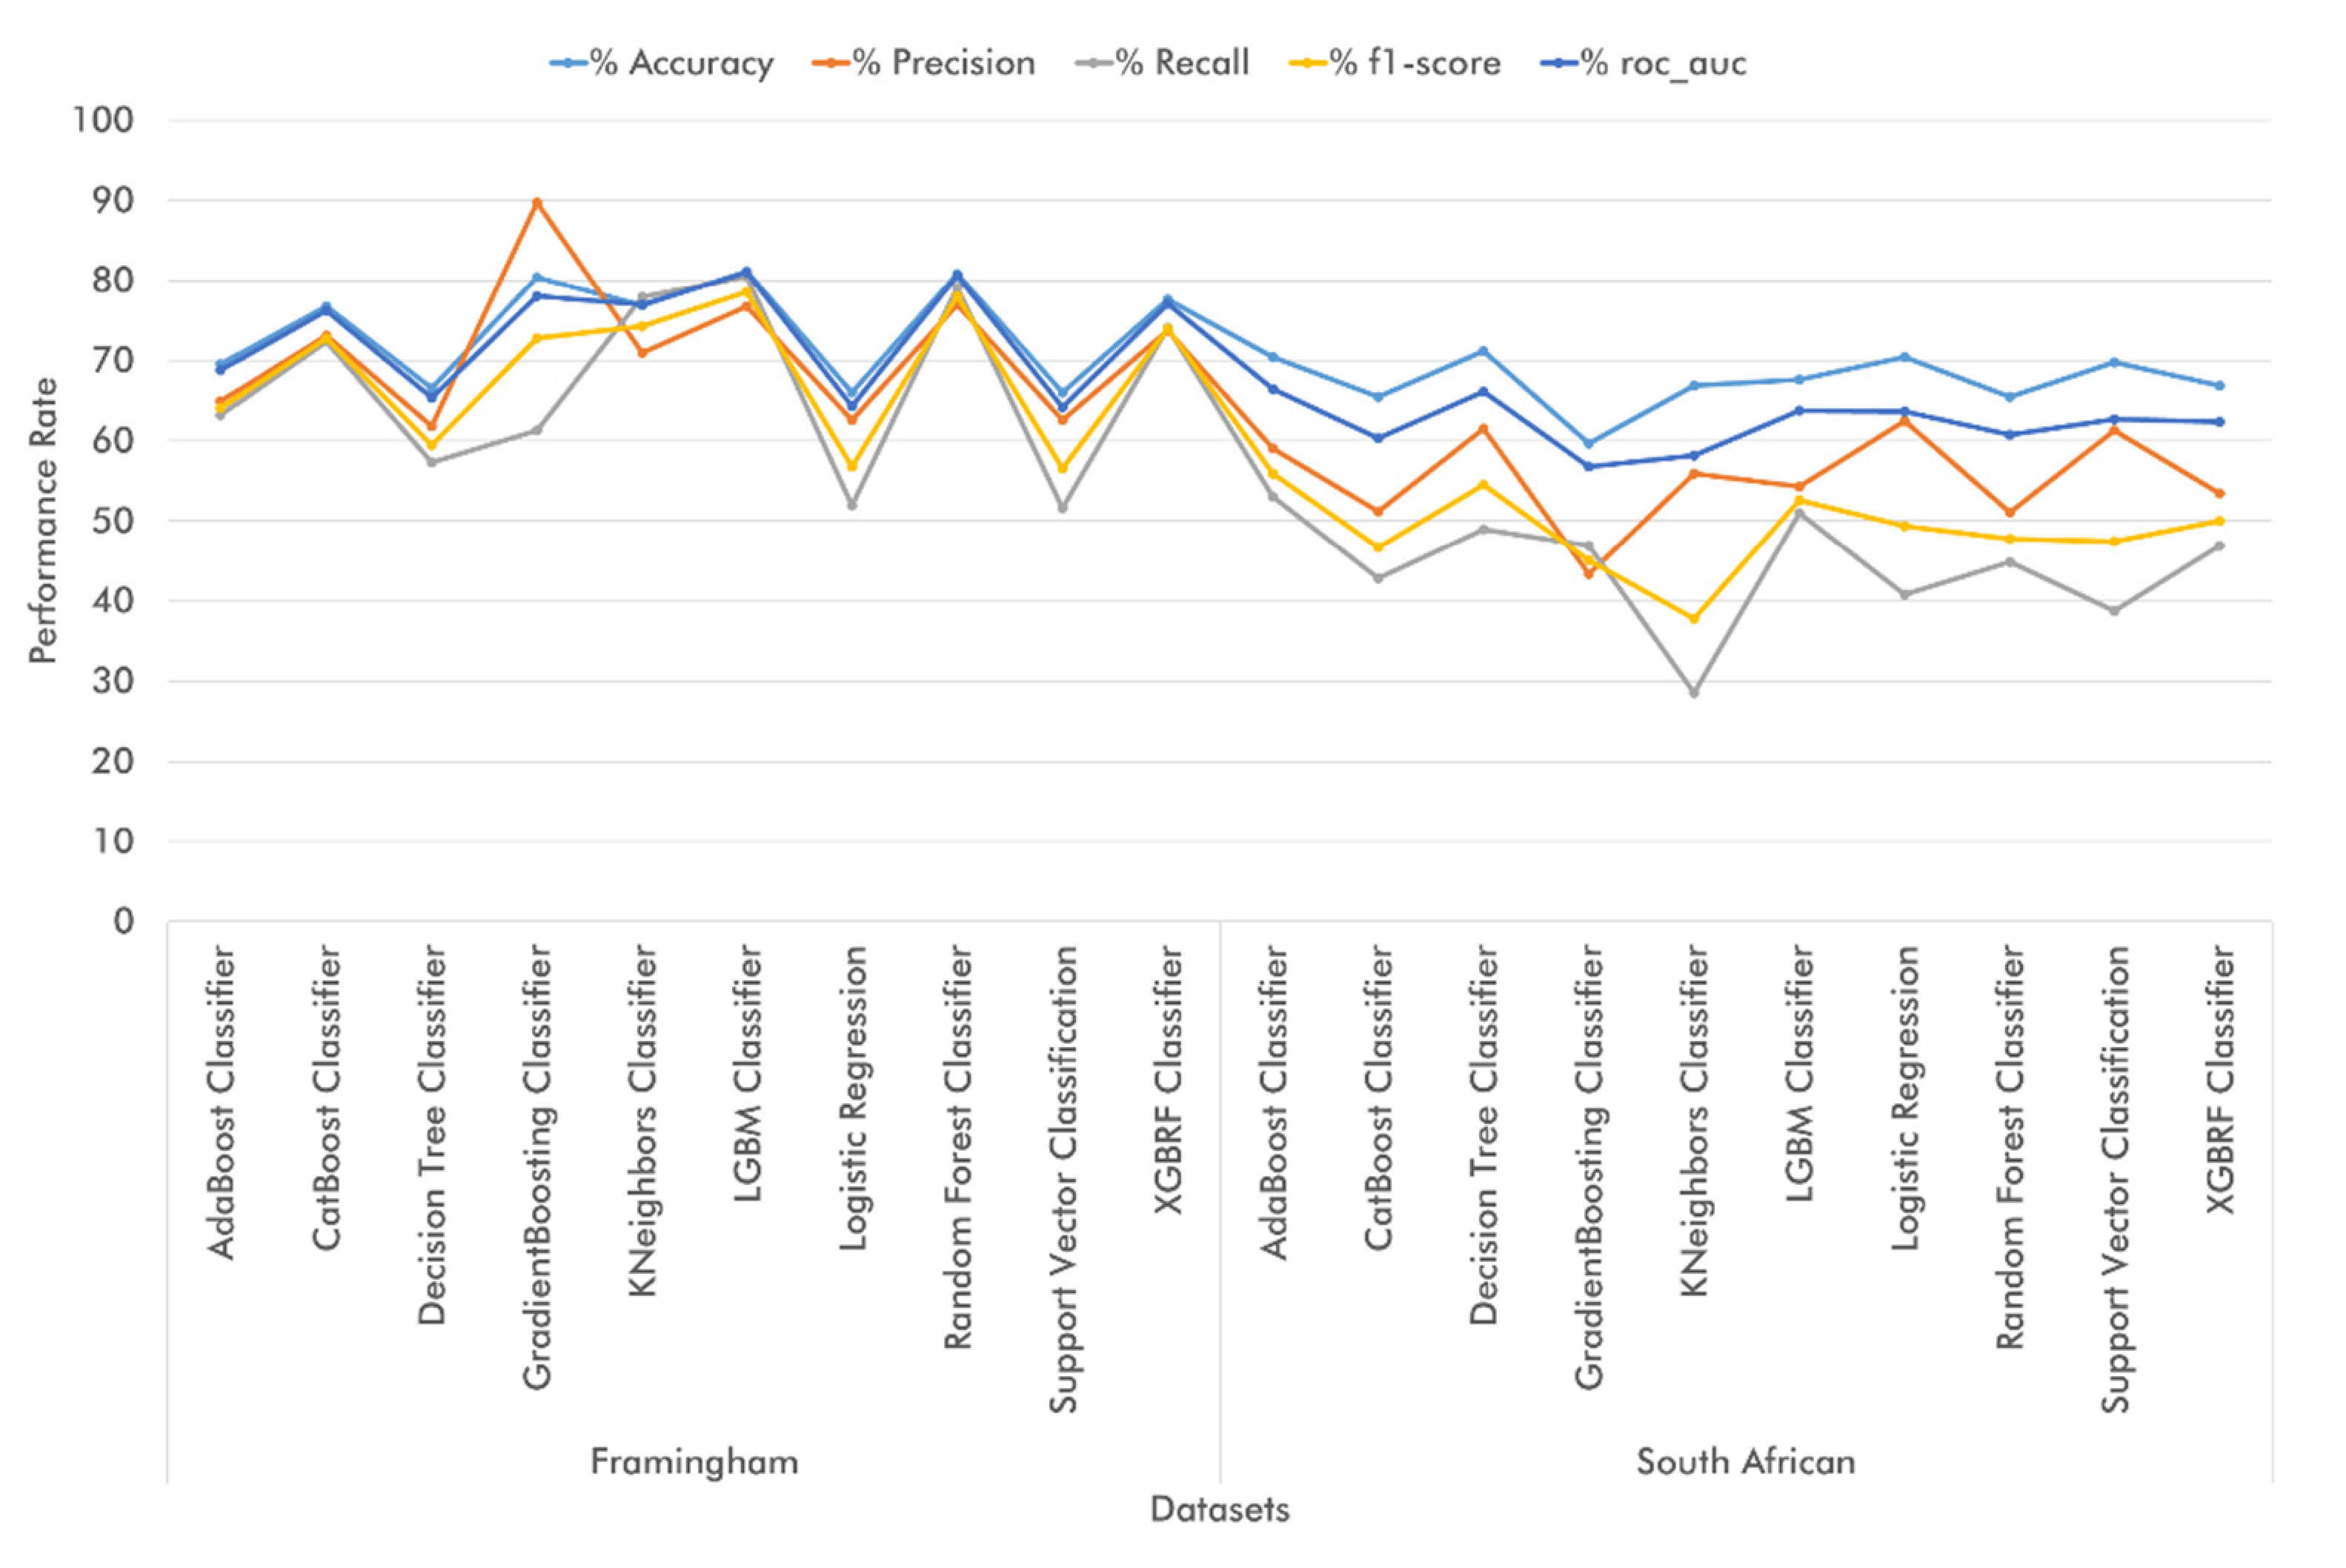
Regarding the accuracy metrics using train-test split, Figure 9 shows that adequate classifier performance was achieved in all top-two and top-four attribute classifications on the Cleveland and Framingham datasets. Additionally, we found that when working with medical diagnosis datasets, the ML classifiers performed better in terms of accuracy on the Cleveland dataset during the top-four attribute classifications and on the Faisalabad dataset during the top-two attribute classifications. On the other hand, when dealing with medical prediction datasets, we achieved better classifier performance results on the Framingham dataset (top-four attribute classification) and the South African dataset (top-two classification). As for the evaluated technique, train-and-test set validation worked best on the Cleveland dataset, whereas on the Faisalabad and Framingham datasets, some algorithms performed better when using the train-and-test set technique. Regarding the South African Hearth dataset, it is feasible to use both train-test split and k-fold cross-validation, since the ML classifiers exhibited adequate performance with both techniques.
As a result of the previous analysis, we managed to identify the main attributes for CVD diagnosis across the four datasets. On the Cleveland database, such attributes include cp (Chest Pain Type), thalach (maximal heart rate), ca (number of vessels colored by fluoroscopy), and oldpeak (exercise relative to rest). In the top-two attribute classification, CatBoost Classifier and XGBRF Classifier achieved the best accuracy (81.32%), Logistic Regression yielded the best precision performance (84.09%), Decision Tree Classifier outperformed in terms of recall (86.00%), and CatBoost Classifier and XGBRF Classifier achieved the best performance results in terms of f1-score and roc-auc, respectively (82.83% and 81.24%, respectively). On the other hand, when using k-fold cross-validation, Logistic Regression exhibited the best performance in accuracy (77.22%), precision (79.95%), and f1-score (78.96%), whereas Decision Tree Classifier showed the best results in terms of recall (79.85%), and Support Vector Classification yielded the best performance in roc-auc (80.25%).
As regards the top-four classification of Cleveland attributes using train-test split, Logistic Regression and Support Vector Classification yielded the highest accuracy (82.42%), whereas Logistic Regression alone outperformed the other algorithms in terms of precision (88.64%). On the other hand, the best-performing classifiers in recall, f1-score, and roc-auc were Decision Tree Classifier (86.00%), Support Vector Classification (83.33%), and Logistic Regression (82.9%), respectively. Finally, when using k-fold cross-validation, Support Vector Classification exhibited the highest classification accuracy (81.16%), XGBRF Classifier yielded the best results in terms of precision (79.77%), Decision Tree Classifier was the best-performing algorithm in recall (89.78%), Support Vector Classification showed the best results in f1-score (83.33%), and Logistic Regression was the best-performing algorithm in roc-auc (87.34%).
In the Faisalabad dataset, the main attributes identified included serum creatinine, ejection fraction, patient age, and platelets. In the top-two attribute classification using the test-train split technique, the best-performing classifiers were as follows: Decision Tree Classifier in accuracy (74.44%), f1-score (65.67%), and roc-auc (72.18%), KNeighbors Classifier in precision (72.22%), and Random Forest Classifier in recall (62.16%). Conversely, when relying on k-fold cross-validation, CatBoost Classifier exhibited the best results in accuracy and f1-score (76.28% and 58.55%, respectively), Logistic Regression yielded the highest precision (76.67%), Random Forest Classifier outperformed the other classifiers in terms of recall (57.11%), and XGBRF Classifier showed the best performance in roc-auc (81.18%). In the top-four classification of Faisalabad attributes using the train-test split technique, Decision Tree Classifier proved to be the best-performing algorithm as regards accuracy (71.11%), recall (70.27%), f1-score (66.67%), and roc-auc (70.98%), whereas Support Vector Classification exhibited the highest precision performance (100.00%). On the other hand, during k-fold cross-validation, the best classification performance was exhibited by Decision Tree Classifier in terms of accuracy (76.59%), recall (64.89%), and f1-score (63.59%), and by XGBRF Classifier in terms of precision (64.74%) and roc-auc (80.17%).
As regards the two CVD medical prediction datasets, the main attributes identified in the Framingham dataset included sysBP (systolic blood pressure), BMI (Body Mass Index), age (age at exam time), and totChol (total cholesterol). In the top-two attribute classification using the train-test split technique, LGBM Classifier proved to be the best-performing classifier across the five metrics: accuracy (77.84%), precision (74.61%), recall (73.26%), f1-score (73.93%), and roc-auc (77.27%). On the other hand, when using k-fold cross-validation, LGBM Classifier exhibited the best performance in accuracy (77.42%), recall (74.52%), f1-score (74.03%), and roc-auc (84.74%), whereas GradientBoosting Classifier showed the best precision results (75.17%). As regards the top-four attribute classification with the train-test split technique, LGBM Classifier outperformed the other classifiers in terms of accuracy (81.18%), recall (80.50%), f1-score (78.59%), and roc-auc (81.10%), while the highest precision was achieved by GradientBoosting Classifier (89.80%). On the other hand, when using k-fold cross-validation, the best performing classifiers included LGBM Classifier in terms of accuracy (83.10%), GradientBoosting Classifier in terms of precision (89.60%) and roc-auc (91.41%), and Random Forest Classifier in recall and f1-score (82.74% and 81.21%, respectively).
In the South African Hearth dataset, the main attributes included tobacco (cumulative tobacco), age (age at the exam), LDL (low-density lipoprotein cholesterol), and adiposity. In the top-two attribute classification using train-test split, the best-performing classifiers proved to be Logistic Regression in accuracy (73.38%), Support Vector Classification in precision (80.00%), and Decision Tree Classifier in terms of recall (48.98%), f1-score (55.17%), and roc-auc (66.71%). Conversely, when relying on k-fold cross-validation, Decision Tree Classifier yielded the highest accuracy (71.22%), Logistic Regression outperformed the other classifiers in precision (62.50%), and AdaBoost Classifier exhibited the best performance in recall (53.06%), f1-score (55.91%), and roc-auc (66.53%). Regarding the top-four attribute classifications, the best-performing classifiers with the train-test split technique were Decision Tree Classifier in accuracy (71.22%), Logistic Regression in precision (62.50%), and AdaBoost Classifier in recall (53.06%), f1-score (55.91%), and roc-auc (66.53%). On the other hand, when relying on k-fold cross-validation, both Logistic Regression and Support Vector Classification achieved the highest accuracy (70.99%), whereas Support Vector Classification itself exhibited the best performance in terms of precision (62.79%). Decision Tree yielded the best results in recall (47.50%), Logistic Regression in f1-score (50.98%), and Support Vector Classification in roc-auc (76.17%).
From this discussion of the results, we concluded that the ten studied ML classifiers performed adequately in the classification of top-two and top-four dataset attributes. Hence, efforts in predicting and/or diagnosing CVD with said features will yield the expected results (Table 11).
Of the variables identified, age in the Faisalabad, Framingham, and South African Hearth datasets is an important risk factor for any CVD. As regards heart rate (found in the Cleveland dataset as thalach), normal ranges of pulse per minute (bpm) should be monitored. On the other hand, blood pressure is known to trigger all types of CVDs. It refers to the force exerted against the walls of the arteries as the heart pumps blood to the body. In this sense, the systolic pressure range, found in the Framingham dataset, should be properly monitored, especially among patients suffering from hypertension. Levels of blood cholesterol in the body are measured with cholesterol tests, which determine the amount of each type of cholesterol and certain fats in the body. LDL cholesterol, or bad cholesterol, (attribute from the South African Hearth dataset) is a major CVD risk factor, since it causes plaque buildup in the arteries, thus reducing blood flow. Similarly, total blood cholesterol levels—attributes found in the Framingham dataset—must be monitored in all CVD diagnosis and detection efforts.
Regarding Cleveland dataset attributes, coronary angiography (ca) is a special procedure that uses contrast dyes and X-rays to see how blood flows in the arteries in the heart, thus showing whether any of the coronary arteries are blocked or narrowed due to fatty plaques and how serious it may be. Coronary angiography thus allows monitoring the development of CVDs such as heart disease, arterial disease, and coronary artery disease. As for cp, ECGs (i.e., graphical representation of the electrical forces working on the heart) allows monitoring the cardiac cycle of pumping and filling in a known pattern of changing electrical pulses that accurately reflect the action of the heart. ECGs are performed by collecting the pulses through electrodes attached to the surface of the body. Hence, ECGs help identify CVDs such as heart failure, arrhythmia, heart disease, and arterial or coronary artery disease. Finally, exercise-induced ST-segment depression (oldpeak) can be monitored via stress tests (i.e., ergometry) to examine how the heart functions during physical activity to prevent the development of CVDs, such as heart failure, heart disease, arterial and coronary artery disease. These attributes are the most important for correct CVD prediction and diagnosis. Similarly, we identified other important attributes, such as tobacco and blood platelet count. On the one hand, nicotine in the body must be monitored among both smokers and non-smokers by modifying patient lifestyle, whereas high blood platelet counts may be an indicator of CVD. Finally, as discussed by Davide Chicco, et al., other key attributes for CVD detection and diagnosis include ejection fraction (i.e., percentage of blood leaving the heart at each heartbeat) and serum creatinine (i.e., level of blood creatinine), whose abnormal levels are usually observed among diabetic patients, kidney disease sufferers, and patients with high blood pressure.

5. Conclusions and Future Directions

MLAs play a key role in healthcare services by analyzing medical data for disease diagnosis. CVDs are a critical medical problem for healthcare professionals and researchers. To approach this issue, we have conducted a dataset study with clinical data of CVDs to identify the main risk factors that influence CVD development using MLAs. First, we relied on Random Forest to identify and select the top four attributes in each dataset to improve the training and testing of the algorithms. Then, we analyzed the classification performance of the predictive models on four datasets and using the train-test split technique and k-fold validation. Finally, we compared the obtained results. Performance metrics comprised accuracy, precision, recall, f1-score, and roc-auc, whereas the analyzed datasets included the Cleveland and the Faisalabad datasets—for CVD diagnosis—and the Framingham and South African datasets—for CVD prediction.
We compared the performance of the ten algorithms in two-attribute and four attribute classifications. We found adequate and consistent algorithm performance in the top-two attribute classifications when using both train-test split and k-fold cross-validation techniques. Our results demonstrate that, in most of the datasets, age, heart rate, and blood pressure are the most significant CVD attributes, followed by weight, cholesterol, tobacco, serum creatinine, ejection fraction, chest pain type, number of vessels, platelet count, and adiposity. All these attributes stood out in the prediction performance analysis and thus have an impact on CVD detection.
With the findings obtained, we can conclude that the best performance was exhibited by Cleveland and Framingham datasets with top-two and top-four attributes in both techniques for all metrics, while in the Faisalabad and South African datasets it was only exhibited with accuracy, precision, and roc-auc. The studied algorithms classify appropriately by making use of top-two and top-four attributes that were identified in each of the datasets obtaining an appropriate performance in the evaluation of the accuracy metric. With respect to which classifier exhibited the highest performance accuracy in the train-test with top-two and top-four attributes, the top-two attributes in the Cleveland dataset were obtained with XGBRF, and top-four were obtained with Logistics Regression. In the Faisalabab dataset it was a Decision Tree for both, as well as in the Framingham dataset it was for both LGBM and in the South African dataset, for top-two attributes was Logistic Regression and by top-four Decision Tree. With cross-validation, the Cleveland dataset obtained the best performance with the top-two attributes with Logistics Regression and for top-four with Support Vector. In the Faisalabab dataset, it was a Decision Tree for the top-two attributes and CatBoost for the top four. With the Framingham dataset, it was LGBM for both and, in the South African data set Decision Tree was for the top-two attributes and Logistics Regression for the top-four. The main contribution was the identification of three main risk factors considered for cardiovascular diseases of arrhythmia and tachycardia, such as cp (Chest Paint Type), Serum creatinine (Level of creatinine in the blood), and Ejection fraction (Percentage of blood leaving the heart at each heartbeat). Therefore, the attributes are suitable for follow-up in the preventive diagnosis of CVD, such as arrhythmia or tachycardia, and for timely and accurate treatment when necessary.
As regards our suggestions for future work, we recommend replicating our study in other medical databases to contribute to current prevention and diagnosis efforts of other diseases, such as diabetes and breast cancer. Similarly, the risk factors identified in this study can be used in the development of mobile applications for heart disease monitoring in which patient clinical data are automatically recorded and further analyzed by healthcare professionals for a correct diagnosis. Finally, an attractive proposal would be to build a large database with the main attributes detected from various sources: clinical datasets, wearable devices, mobile applications, and medical records. This outcome could be achieved by relying on big data techniques and will contribute to current efforts to improve our quality of life.

Author Contributions

Conceptualization, G.A.-H.; methodology, L.R.G.-N.; software L.R.G.-N. and J.L.S.-C.; validation, L.R.-M. and L.R.G.-N.; formal analysis, N.A.C.-R.; investigation, J.L.S.-C., L.R.G.-N. and G.A.-H.; data curation, L.R.G.-N.; visualization, L.R.-M. and N.A.C.-R.; supervision, G.A.-H.; project administration, J.L.S.-C.; funding acquisition, J.L.S.-C. All authors have read and agreed to the published version of the manuscript.

Funding

This research was funded by Council for Scientific Research and Technological Development in Veracruz (COVEICYDET), grant number 12 1806.

Institutional Review Board Statement

Not applicable.

Informed Consent Statement

Not applicable.

Data Availability Statement

Publicly available datasets were analyzed in this study. This data can be found here: Cleveland Dataset (https://archive.ics.uci.edu/ml/datasets/heart+disease) (accessed on 2 October 2021); Framingham Dataset (https://www.kaggle.com/apoorvak141619/framinghamheartattackprediction/data?select=framingham.csv) (accessed on 2 October 2021); Faisalabab Dataset (https://www.kaggle.com/andrewmvd/heart-failure-clinical-data) (accessed on 2 October 2021); South African Dataset (https://sci2s.ugr.es/keel/dataset.php?cod=184#inicio) (accessed on 2 October 2021).

Acknowledgments

This work was sponsored by the Council for Scientific Research and Technological Development in Veracruz (COVEICYDET). We thank COVEICYDET for supporting this work through project name Prevention and Early Detection of Cardiovascular Diseases (Arrhythmias & Tachycardias) using Machine Learning Techniques, Big Data, and the Internet of Things (identifier number 12 1806). The authors are very grateful to National Technological of Mexico for supporting this work. Also, this research paper was sponsored by the National Council of Science and Technology (CONACYT), as well as by the Public Education Secretary (SEP) through PRODEP.

Conflicts of Interest

The authors declare no potential conflict of interest with respect to the publication of this research.

References

  1. The Top 10 Causes of Death. Available online: https://www.who.int/news-room/fact-sheets/detail/the-top-10-causes-of-death (accessed on 31 May 2021).
  2. What is CVD?—World Heart Federation. Available online: https://world-heart-federation.org/what-is-cvd/ (accessed on 31 May 2021).
  3. Pandey, A.K.; Pandey, P.; Jaiswal, K.L.; Sen, A.K. A Heart Disease Prediction Model Using Decision Tree. 2013. Available online: www.iosrjournals.orgwww.iosrjournals.org (accessed on 27 May 2021).
  4. Samuel, O.W.; Asogbon, G.M.; Sangaiah, A.K.; Fang, P.; Li, G. An integrated decision support system based on ANN and Fuzzy_AHP for heart failure risk prediction. Expert Syst. Appl. 2017, 68, 163–172. [Google Scholar] [CrossRef]
  5. Amin, M.S.; Chiam, Y.K.; Varathan, K.D. Identification of significant features and data mining techniques in predicting heart disease. Telemat. Inform. 2019, 36, 82–93. [Google Scholar] [CrossRef]
  6. Mienye, I.D.; Sun, Y.; Wang, Z. Improved sparse autoencoder based artificial neural network approach for prediction of heart disease. Inform. Med. Unlocked 2020, 18, 100307. [Google Scholar] [CrossRef]
  7. Chicco, D.; Jurman, G. Machine learning can predict survival of patients with heart failure from serum creatinine and ejection fraction alone. BMC Med. Inform. Decis. Mak. 2020, 20, 1–16. [Google Scholar] [CrossRef]
  8. Ayon, S.I.; Islam, M.M.; Hossain, M.R. Coronary Artery Heart Disease Prediction: A Comparative Study of Computational Intelligence Techniques. IETE J. Res. 2020. [Google Scholar] [CrossRef]
  9. Mohan, S.; Thirumalai, C.; Srivastava, G. Effective heart disease prediction using hybrid machine learning techniques. IEEE Access 2019, 7, 81542–81554. [Google Scholar] [CrossRef]
  10. Shah, D.; Patel, S.; Bharti, S.K. Heart Disease Prediction Using Machine Learning. Lect. Notes Electr. Eng. 2020, 708, 603–609. [Google Scholar] [CrossRef]
  11. Dwivedi, A.K. Performance evaluation of different machine learning techniques for prediction of heart disease. Neural Comput. Appl. 2019, 29, 685–693. [Google Scholar] [CrossRef]
  12. Belavagi, M.C.; Muniyal, B. Performance Evaluation of Supervised Machine Learning Algorithms for Intrusion Detection. Procedia Comput. Sci. 2016, 89, 117–123. [Google Scholar] [CrossRef] [Green Version]
  13. Deepika, K.; Seema, S. Predictive analytics to prevent and control chronic diseases. In Proceedings of the 2016 2nd International Conference on Applied and Theoretical Computing and Communication Technology, iCATccT 2016, Bangalore, India, 21–23 July 2016; pp. 381–386. [Google Scholar] [CrossRef]
  14. Tiwaskar, S.A.; Gosavi, R.; Dubey, R.; Jadhav, S.; Iyer, K. Comparison of Prediction Models for Heart Failure Risk: A Clinical Perspective. In Proceedings of the 2018 Fourth International Conference on Computing Communication Control and Automation (ICCUBEA), Pune, India, 16–18 August 2018. [Google Scholar] [CrossRef]
  15. Nahar, J.; Imam, T.; Tickle, K.S.; Chen, Y.P.P. Computational intelligence for heart disease diagnosis: A medical knowledge driven approach. Expert Syst. Appl. 2013, 40, 96–104. [Google Scholar] [CrossRef]
  16. Ahmad, T.; Munir, A.; Bhatti, S.H.; Aftab, M.; Raza, M.A. Survival analysis of heart failure patients: A case study. PLoS ONE 2017, 12, e0181001. [Google Scholar] [CrossRef]
  17. Detrano, R.; Janosi, A.; Steinbrunn, W.; Pfisterer, M.; Schmid, J.-J.; Sandhu, S.; Guppy, K.H.; Lee, S.; Froelicher, V. International application of a new probability algorithm for the diagnosis of coronary artery disease. Am. J. Cardiol. 1989, 64, 304–310. [Google Scholar] [CrossRef]
  18. Shimpi, P.; Shah, S.; Shroff, M.; Godbole, A. A machine learning approach for the classification of cardiac arrhythmia. In Proceedings of the International Conference on Computing Methodologies and Communication, ICCMC 2017, Erode, India, 18–19 July 2017; pp. 603–607. [Google Scholar] [CrossRef]
  19. Niazi, K.A.K.; Khan, S.A.; Shaukat, A.; Akhtar, M. Identifying best feature subset for cardiac arrhythmia classification. In Proceedings of the 2015 Science and Information Conference, SAI 2015, London, UK, 28–30 July 2015; pp. 494–499. [Google Scholar]
  20. Fida, B.; Nazir, M.; Naveed, N.; Akram, S. Heart disease classification ensemble optimization using Genetic algorithm. In Proceedings of the 14th IEEE International Multitopic Conference 2011, INMIC 2011, Karachi, Pakistan, 22–24 December 2011; pp. 19–24. [Google Scholar] [CrossRef]
  21. Singh, N.; Singh, P. Cardiac arrhythmia classification using machine learning techniques. In Lecture Notes in Electrical Engineering; Springer: Berlin/Heidelberg, Germany, 2019; pp. 469–480. [Google Scholar]
  22. Soman, T.; Bobbie, P.O. Classification of Arrhythmia Using Machine Learning Techniques. WSEAS Trans. Comput. 2005, 4, 548–552. [Google Scholar]
  23. Kodati, S.; Vivekanandam, R.; Ravi, G. Comparative analysis of clustering algorithms with heart disease datasets using data mining weka tool. Adv. Intell. Syst. Comput. 2019, 900, 111–117. [Google Scholar] [CrossRef]
  24. Haq, A.U.; Li, J.P.; Khan, J.; Memon, M.H.; Nazir, S.; Ahmad, S.; Khan, G.A.; Ali, A. Intelligent machine learning approach for effective recognition of diabetes in e-healthcare using clinical data. Sensors 2020, 20, 2649. [Google Scholar] [CrossRef]
  25. Ghosh, S.R.; Waheed, S. A Critical Study of Selected Classification Algorithms for Liver Disease Diagnosis. 2016. Available online: www.ijcsit.com (accessed on 27 May 2021).
  26. Mishra, S.; Mallick, P.K.; Tripathy, H.K.; Bhoi, A.K.; González-Briones, A. Performance evaluation of a proposed machine learning model for chronic disease datasets using an integrated attribute evaluator and an improved decision tree classifier. Appl. Sci. 2020, 10, 1–35. [Google Scholar] [CrossRef]
  27. Danjuma, K.J. Performance Evaluation of Machine Learning Algorithms in Post-operative Life Expectancy in the Lung Cancer Patients. Available online: http://arxiv.org/abs/1504.04646 (accessed on 27 May 2021).
  28. Li, Y.; Chen, Z. Performance Evaluation of Machine Learning Methods for Breast Cancer Prediction Performance Evaluation of Machine Learning Methods for Breast. Cancer Predict. Appl. Comput. Math. 2018, 7, 212–216. [Google Scholar] [CrossRef]
  29. Janosi, A.; Steinbrunn, W.; Pfisterer, M.; Detrano, R. UCI Machine Learning Repository: Heart Disease Data Set UCI. 2019. Available online: https://archive.ics.uci.edu/ml/datasets/heart+disease (accessed on 1 June 2021).
  30. FraminghamHeartAttackPrediction|Kaggle. 2021. Available online: https://www.kaggle.com/apoorvak141619/framinghamheartattackprediction/data?select=framingham.csv (accessed on 1 June 2021).
  31. Ernández, A.F.; Uengo, J.L.; Errac, J.D. KEEL: A software tool to assess evolutionary algorithms for Data Mining problems (regression, classification, clustering, pattern mining and so on). J. Mult. Log. Soft Comput. 2011, 17, 255–287. Available online: https://sci2s.ugr.es/keel/dataset.php?cod=184#inicio (accessed on 1 June 2021).
  32. Hosmer, D.W., Jr.; Lemeshow, S.; Sturdivant, R.X. Applied Logistic Regression; John Wiley & Sons: Hoboken, NJ, USA, 1991. [Google Scholar]
  33. Breiman, L. Random forests. Mach. Learn. 2001, 45, 5–32. [Google Scholar] [CrossRef] [Green Version]
  34. Bhatele, K.R.; Bhadauria, S.S. Glioma segmentation and classification system based on proposed texture features extraction method and hybrid ensemble learning. Trait. Signal 2020, 37, 989–1001. [Google Scholar] [CrossRef]
  35. Lecun, Y.; Bengio, Y.; Hinton, G. Deep learning. Nature 2015, 521, 436–444. [Google Scholar] [CrossRef]
  36. Sorich, M.J.; Miners, J.O.; McKinnon, R.A.; Winkler, D.A.; Burden, F.R.; Smith, P.A. Comparison of Linear and Nonlinear Classification Algorithms for the Prediction of Drug and Chemical Metabolism by Human UDP-Glucuronosyltransferase Isoforms. J. Chem. Inf. Comput. Sci. 2003, 43, 2019–2024. [Google Scholar] [CrossRef]
  37. Ramana, B.V.; Babu, M.S.P.; Venkateswarlu, N. A Critical Study of Selected Classification Algorithms for Liver Disease Diagnosis. Int. J. Database Manag. Syst. 2011, 3, 101–114. [Google Scholar] [CrossRef]
  38. Biau, G.; Cadre, B.; Rouvière, L. Accelerated gradient boosting. Mach. Learn. 2019, 108, 971–992. [Google Scholar] [CrossRef] [Green Version]
  39. Ke, G.; Meng, Q.; Finley, T.; Wang, T.; Chen, W.; Ma, W.; Ye, Q.; Liu, T.Y. Lightgbm: A highly efficient gradient boosting decision tree. Adv. Neural Inf. Proc. Syst. 2017, 30, 3146–3154. [Google Scholar]
  40. Hancock, J.T.; Khoshgoftaar, T.M. CatBoost for big data: An interdisciplinary review. J. Big Data 2020, 7, 1–45. [Google Scholar] [CrossRef]
  41. Zhu, J.; Zou, H.; Rosset, S.; Hastie, T. Multi-class AdaBoost *. Stat. Its Interface 2009, 2, 349–360. [Google Scholar]
  42. Rida, I.; Bouridane, A.; Al Kork, S.; Bremond, F. Gait Recognition Based on Modified Phase Only Correlation. In Lecture Notes in Computer Science, Proceedings of the Image and Signal Processing, ICISP 2014, Cherburg, France, 30 June–2 July 2014; Elmoataz, A., Lezoray, O., Nouboud, F., Mammass, D., Eds.; Springer: Cham, Germany, 2014; Volume 8509. [Google Scholar] [CrossRef] [Green Version]
  43. Rida, I.; Almaadeed, N.; Almaadee, S. Robust gait recognition: A comprehensive survey. IET Biomtrics 2018, 8, 14–28. [Google Scholar] [CrossRef]
  44. Brownlee, J. 00 ML Mastery—Understand You Data, Create Accurate Models and Work Projects End-to-End. In Machine Learning Mastery with Python: Understand Your Data, Create Accurate Models and Work Projects End-to-end; Machine Learning Mastery: Melbourne, Australia, 2017; p. 91. [Google Scholar]
Figure 1. Methodology for the evaluation of CVD datasets.
Mathematics 09 02537 g001
Figure 4. Train-test dataset performance of ten LM classifiers on the top-four attributes from the Cleveland and Faisalabad attributes.
Mathematics 09 02537 g004
Figure 5. Train-test set performance of ten ML classifiers on the top-four attributes from the Framingham and South African Hearth datasets.
Mathematics 09 02537 g005
Figure 6. K-fold cross-validation performance of ten ML classifiers on the top-four features of the Cleveland and the Faisalabad datasets.
Mathematics 09 02537 g006
Figure 7. K-fold cross-validation performance of ten ML classifiers on top-four attributes from the Framingham and South African Hearth datasets.
Mathematics 09 02537 g007
Figure 9. Comparison of ML classifier accuracy performance using train-test split on top-two and top-four attributes from (a) Medical diagnostic datasets; (b) Medical prediction datasets.
Mathematics 09 02537 g009
Table 1. Review of Heart Disease Datasets.
DatasetNumber of AttributesNumber of RecordsPrediction/Diagnosis
Faisalabad Institute13 + Class299Prediction/Diagnosis
Framingham15 + Class3658Prediction
Cleveland13 + Class303Prediction/Diagnosis
South African Hearth dataset9 + Class462Prediction
Table 2. Review of Machine Learning Classifiers.
MLADescriptionAdvantageDisadvantages/Limitations
Linear regressionIt analyzes the classification and regression problems of the data.Efficient for numerical and categorical classification problems.Boolean values only.
Not suitable for predicting the values of a binary value.
Random ForestIt performs a random selection of features for the construction of decision trees with controlled variance.Reduction in over-fitting.Slow in real-time prediction.Complex algorithm.
KNNIt follows a method for classifying objects based on the closest training examples in the feature space.It is used in many applications in the field of data mining, statistical pattern recognition, and many others.Slower at classification.
XGBRFIt is an ensemble method that works by boosting trees.Regularization is the feature that is dominant for this type of predictive algorithm.Slow when you have a large number of classes.
Decision TreeIt is a supervised machine learning technique that builds a decision tree from a set of class labeled training samples during the machine learning process.Decision Trees are very simple and fast.
It has good accuracy (may depend on the data at hand).
It has a long training time.
Lack of available memory, when dealing with large databases.
SVMIt is a method based on statistical learning theory and the structural risk minimization principle and has the aim of determining the location of decision boundaries also known as hyperplane that produces the optimal separation of classes.One of the most robust and accurate methods among all well-known algorithms.SVMs are extremely slow in learning, requiring large amount of training time.
Gradient BoostingIt builds an additive model in a progressive mode.It allows optimization of arbitrary differentiable loss functionsBinary classification is a special case in which only a single regression tree is induced.
LightGBMIt is an algorithm for classification that relies on the gradient hoistLight computational burden.Presorting algorithm has a large overhead in time and memory consumption.
CatBoostIt is an algorithm for regression and classification problemsSupports numerical, categorical, and text features but has a good handling technique for categorical dataSome important parameters can be tuned in CatBoost to get a better result.
AdaBoostIt is a classification algorithm consisting of a combination of basic algorithms to strengthen classification by combining them into a group and each subsequent basic classifier is built based on poorly classified objects at the previous iteration.In real problems, it is possible to build compositions that are superior in quality to the basic algorithms.It is prone to retraining when there is significant noise in the data.
Requires sufficiently long training samples.
Table 3. Selected attributes from the Cleveland dataset with Random Forest.
Attribute NameAttribute DescriptionScore
cpChest pain type 13.55
thalachMaximum heart rate12.52
caNumber of vessels colored by fluoroscopy11.70
oldpeakExercise-induced ST depression10.90
thalThallium scan10.28
ageAge in years 8.60
cholSerum cholesterol7.78
trestbpsBlood pressure at rest7.46
exangExercise-induced angina5.89
slopeSlope of the peak in exercise-induced ST depression4.95
genderGender3.35
restecgECG results at rest 2.04
fbsFasting blood sugar 0.98
Table 4. Selected attributes from the Faisalabad dataset with Random Forest.
Attribute NameAttribute DescriptionScore
Serum creatinineLevel of blood creatinine20.15
Ejection fractionPercentage of blood leaving the heart at each heartbeat17.52
AgePatient age14.56
PlateletsCount of platelets in blood12.83
Creatinine phosphokinaseLevel of the CPK enzyme in blood12.80
Serum sodiumLevel of sodium in blood11.22
High blood pressureWhether a patient has hypertension2.39
GenderWhether a patient is a woman or a man2.23
AnemiaDecrease of red blood cells or hemoglobin2.16
DiabetesWhether a patient has diabetes2.15
SmokingWhether a patient smokes 1.99
Table 5. Selected attributes from the Framingham dataset with Random Forest.
Attribute NameAttribute DescriptionScore
sysBPSystolic blood pressure14.15
BMIBody mass index13.55
AgePatient age at exam time12.73
totCholTotal cholesterol12.69
diaBPDiastolic blood pressure12.54
GlucoseSerum glucose12.51
heartRateHeart rate10.01
cigsPerDayNumber of cigarettes smoked per day5.09
MaleMale patient2.09
prevalentHypHypertension over 24-year follow-up1.76
currentSmokerCurrently smoking cigarettes1.25
BPMedsPatient taking anti-hypertensive medications0.69
diabetesDiabetic patient0.63
prevalentStrokeStroke over 24-year follow-up0.32
Table 6. Main attributes on the South African Hearth dataset identified with Random Forest.
FeatureFeature DescriptionScore
TobaccoCumulative tobacco15.70
AgeAge at onset15.39
LdlLow-density lipoprotein cholesterol 13.29
AdiposityAdiposity 11.73
TypeaType-A behavior10.65
SbpSystolic blood pressure10.13
ObesityObesity10.04
AlcoholCurrent alcohol consumption8.10
FamhistFamily history of heart disease4.98
Table 7. Train-test set performance analysis of classifiers on top-two attributes from the Cleveland and Faisalabad datasets.
DatasetPredictive ModelPerformance Evaluation Metrics
% Accuracy% Precision% Recall% f1-Score% roc_auc
ClevelandAdaBoost Classifier71.4374.0074.0074.0071.15
CatBoost Classifier81.3283.6782.0082.8381.24
Decision Tree Classifier79.1278.1886.0081.9078.37
GradientBoosting Classifier61.5464.7166.0065.3561.05
KNeighbors Classifier70.3376.7466.0070.9770.80
LGBM Classifier71.4371.4380.0075.4770.49
Logistic Regression78.0284.0974.0078.7278.46
Random Forest Classifier68.1368.4278.0072.9067.05
Support Vector Classification79.1282.9878.0080.4179.24
XGBRF Classifier81.3283.6782.0082.8381.24
FaisalabadAdaBoost Classifier64.4460.0040.5448.3960.84
CatBoost Classifier68.8971.4340.5451.7264.61
Decision Tree Classifier74.4473.3359.4665.6772.18
GradientBoosting Classifier67.7861.7656.7659.1566.11
KNeighbors Classifier72.2283.3340.5454.5567.44
LGBM Classifier68.8962.8659.4661.1167.47
Logistic Regression63.3364.2924.3235.2957.45
Random Forest Classifier70.0063.8962.1663.0168.82
Support Vector Classification58.8950.0013.5121.2852.04
XGBRF Classifier71.1166.6759.4662.8669.35
Table 8. Train-test set performance evaluation of ML classifiers on the top-two attributes from the Framingham and the South African Hearth datasets.
DatasetPredictive ModelPerformance Evaluation Metrics
% Accuracy% Precision% Recall% f1-Score% roc_auc
FraminghamAdaBoost Classifier66.9162.0258.9160.4365.91
CatBoost Classifier73.6071.9063.0967.2172.29
Decision Tree Classifier64.1658.6855.5757.0863.09
GradientBoosting Classifier75.8173.6867.8370.6374.81
KNeighbors Classifier72.0468.3864.7666.5271.14
LGBM Classifier77.8474.6173.2673.9372.27
Logistic Regression65.6563.8845.8253.3763.18
Random Forest Classifier75.7572.6169.7871.1675.00
Support Vector Classification64.9965.6438.5848.6061.71
XGBRF Classifier75.6373.1368.2570.6174.71
South African HearthAdaBoost Classifier65.4751.5234.6941.4658.46
CatBoost Classifier71.2263.6442.8651.2264.76
Decision Tree Classifier71.9463.1648.9855.1766.71
GradientBoosting Classifier63.3147.6240.8243.9658.19
KNeighbors Classifier65.4752.0026.5335.1456.60
LGBM Classifier67.6354.7646.9450.5562.91
Logistic Regression73.3871.4340.8251.9565.96
Random Forest Classifier67.6355.2642.8648.2861.98
Support Vector Classification71.2280.0024.4937.5060.58
XGBRF Classifier72.6668.9740.8251.2865.41
Table 9. K-fold cross-validation performance analysis of ML classifiers on the top-two attributes from the Cleveland and Faisalabad datasets.
DatasetPredictive ModelPerformance Evaluation Metrics
% Accuracy% Precision% Recall% f1-Score% roc_auc
ClevelandAdaBoost Classifier69.9673.3971.4372.1273.31
CatBoost Classifier74.2576.9675.6276.1479.36
Decision Tree Classifier76.2278.0079.8578.5277.87
GradientBoosting Classifier68.3172.9067.8769.9869.12
KNeighbors Classifier69.6574.4867.1070.1174.32
LGBM Classifier70.3172.1375.0773.3371.02
Logistic Regression77.2279.9578.6478.9679.76
Random Forest Classifier69.3171.7573.3872.2172.92
Support Vector Classification76.2278.6976.7677.5480.25
XGBRF Classifier75.2377.0278.0577.4078.44
FaisalabadAdaBoost Classifier70.6060.4640.4446.2268.88
CatBoost Classifier76.2868.2452.1158.5579.23
Decision Tree Classifier74.9364.0655.4458.2078.19
GradientBoosting Classifier71.9160.1146.7851.4876.78
KNeighbors Classifier74.2662.7049.2253.7677.87
LGBM Classifier73.2360.1454.3356.1777.70
Logistic Regression74.5976.6734.3345.5776.63
Random Forest Classifier72.2456.6757.1156.0880.42
Support Vector Classification71.5771.3324.1134.2276.33
XGBRF Classifier75.6164.9254.2258.0481.18
Table 10. K-fold cross-validation analysis of ten ML classifiers on top-two Framingham and South African dataset attributes.
DatasetPredictive ModelPerformance Evaluation Metrics
% Accuracy% Precision% Recall% f1-Score% roc_auc
FraminghamAdaBoost Classifier66.6764.2856.2159.8773.40
CatBoost Classifier72.6071.8662.6666.6980.67
Decision Tree Classifier63.5761.6750.2054.9364.92
GradientBoosting Classifier76.0675.1768.1971.1882.64
KNeighbors Classifier71.4768.6365.8967.1979.71
LGBM Classifier77.4272.2474.5274.0384.74
Logistic Regression63.1563.0841.5750.0766.13
Random Forest Classifier75.8472.9472.1072.3484.17
Support Vector Classification62.8064.7635.8146.0765.58
XGBRF Classifier75.6673.8369.8471.6383.54
South African HearthAdaBoost Classifier65.5849.1940.6244.0568.23
CatBoost Classifier66.6853.8640.6245.6769.26
Decision Tree Classifier72.5162.1652.5055.2071.61
GradientBoosting Classifier61.2643.5242.5042.5062.86
KNeighbors Classifier66.2354.2831.8739.2965.89
LGBM Classifier63.6446.4946.2545.7266.22
Logistic Regression70.5563.5638.7547.2074.33
Random Forest Classifier61.7043.4637.5039.7764.09
Support Vector Classification68.8366.3123.1233.6472.29
XGBRF Classifier65.6050.4240.6243.8968.80
Table 11. Main risk factors for CVD diagnosis and prediction.
MethodDatasetBest Rated FeaturesFeature Descrption
DiagnosisClevelandcpChest Pain Type
thalachMaximum heart rate
caNumber of vessels colored by fluoroscopy
oldpeakExercise-induced ST-segment depression
FaisalabadSerum creatinineLevel of creatinine in the blood
Ejection fractionPercentage of blood leaving the heart at each heart beat
AgePatient age
PlateletsPlatelets in the blood
PredictionFraminghamsysBPSystolic blood pressure
BMIBody Mass Index
AgeAge at exam time
totCholTotal Cholesterol
South African HearthTobaccoCumulative tobacco
AgeAge at onset
LdlLow-density lipoprotein cholesterol
AdiposityAdiposity
Publisher’s Note: MDPI stays neutral with regard to jurisdictional claims in published maps and institutional affiliations.

